
Abstract
The aim of this study is to clarify the social mechanisms that generate differences in the average life satisfaction among European countries by specifying the latent structures of life satisfaction. For this purpose, data from the European Values Study conducted from 2017 to 2020 (EVS 2017) were analyzed using finite mixtures of regression models. The results revealed that the respondents to the EVS 2017 could be categorized into two latent groups: a group dominated by materialist values and a group characterized by postmaterialist values. The results also imply that postmaterialist values increase average life satisfaction at the country level and are positively associated with economic prosperity and political stability at the country level. Consequently, the effect of postmaterialist values on life satisfaction is related to social inequalities among European countries. Finally, the sociological implications of these findings are discussed.
Keywords
The aim of this study is to clarify the social mechanisms that generate differences in life satisfaction in European countries. Previous studies have insisted that subjective well-being can be explained via relational goods and social capital, such as affiliations to religious groups and labor unions, having decent neighborhoods and loving family relationships (Böckerman, Laamanen, and Palosaari 2016; Boye 2011; Ellison, Gay, and Glass 1989; Firebaugh and Schroeder 2010; Hadaway 1978; Hawkins and Booth 2005; Hommerich and Tiefenbach 2018; Lim and Putnam 2010; Musick, Meier, and Flood 2016; Radcliff 2005). Previous studies have also indicated that the effects of positional goods, such as employment, socioeconomic status (SES), and (relative) income on subjective well-being, cannot be overlooked (Böckerman et al. 2016; Clemente and Sauer 1976; Inanc 2018; Wolbring, Keuschnigg, and Negele 2013; Young 2012). If individuals find that they have lower incomes than others, they are more likely to have a lower subjective sense of well-being (Alderson and Katz-Gerro 2016; Clark, Frijters, and Shields 2008; Ferrer-i-Carbonell 2005; Luttmer 2005; Oshio, Nozaki, and Kobayashi 2011).
Moreover, it is noteworthy that subjective well-being is determined not only by individual psychological factors. A few studies show that it is also influenced by social factors such as economic growth, unemployment rate, and social inequality (Calvo, Mair, and Sarkisian 2015; Easterlin 1974, 1995, 2001; Easterlin et al. 2010; Mousteri, Daly, and Delaney 2018; Schneider 2019; Schröder 2016). However, the idea of social factors as mechanisms that influence subjective well-being is highly complicated, and there is controversy regarding the effects of factors such as social inequality (Diener et al. 1993; Firebaugh and Schroeder 2010; Kelley and Evans 2017; Kenworthy 2017; McBride 2001; Schnittker 2008; Stevenson and Wolfers 2008; Wu and Li 2017). Nevertheless, it is presumed that the social mechanisms that generate subjective well-being must differ significantly among countries.
Figure 1 shows the distribution of the average life satisfaction among European countries on the basis of the data from the European Values Study (EVS) conducted from 2017 to 2020 (European Values Study 2020). Clearly, there are prominent differences in this distribution and evident tendencies for these differences can be identified (see Table A1 in Appendix A for details). Generally, Northern European countries, such as Norway, Finland, and Denmark, tend to experience high average life satisfaction, whereas Eastern European countries, such as Russia, Bulgaria, and Georgia, tend to have a low life satisfaction average. Moreover, the average life satisfaction in Western and Southern European countries was found to be between the average life satisfaction of Northern and Eastern European countries.

Average life satisfaction among European countries (n = 34).
This implies that differences in life satisfaction among European countries can be explained in terms of regional factors, such as national policies, social welfare regimes, social institutions, and culture (Aassve, Mencarini, and Sironi 2015; Frey and Stutzer 2000; Glass, Simon, and Andersson 2016; Ono and Lee 2018; Steel et al. 2018; Voicu and Vasile 2014; York and Bell 2014). Because these factors are related to problems arising from social inequality, differences in life satisfaction among countries are also thought to be related to social inequality (Eichhorn 2012; Gardarsdottir et al. 2018; Wilkinson 2005; Wilkinson and Pickett 2010). Therefore, the social mechanisms that generate differences in subjective well-being should be clarified by focusing on the relationship between subjective well-being and social inequality.
Thus, attention should be paid to the role of social values in subjective well-being. Materialistic values are defined as social values that emphasize economic and physical security, whereas postmaterialist values are defined as social values that prioritize the need for belonging as well as aesthetic and intellectual needs. Ronald Inglehart and colleagues (Abramson and Inglehart 1987; Inglehart 1971, 2008; Inglehart, Ponarin, and Inglehart 2017) have insisted that social values in Western European countries, which have realized high levels of economic and physical security, have been changing from materialist to postmaterialist ones since the late twentieth century. According to previous studies (Böhnke 2008; Delhey 2010), such changes in social values are related to economic prosperity and political stability. In other words, it is predicted that other countries, not only Western European countries, will realize a shift from materialistic to postmaterialist values by achieving economic prosperity and political stability. However, as the shift from materialist to postmaterialist values presupposes socialization and intergenerational replacement (Inglehart 2008; Marks 1997), it is thought that the changes in social values of other countries have not been deployed sufficiently at the current time. Consequently, differences in social changes between European countries may be observed. Kislev (2018) clarified that (post)materialist values are associated with subjective well-being. Therefore, differences in social values (materialist or postmaterialist) between European countries could generate differences in the level of subjective well-being at the country level. This paper explores the relationship between subjective well-being, (post)materialistic values, and social inequality at the country level using the EVS 2017 data. Thus, as subjective well-being is a broad concept, I especially focused on life satisfaction, which is one of the measures of subjective well-being, to efficiently determine the relationship between subjective well-being, (post)materialist values, and social inequality at the country level.
Theory and Hypotheses
It is well known that Max Weber categorized rational actions into value-rational and end-rational actions; according to him, social action can be rationalized by appealing to social values (Weber and Secher 1962). Furthermore, by examining the influence of the Protestant ethics on the development of early capitalism, Weber successfully clarified that social values significantly affect social change as well as social inequality (Weber 1958). In other words, Weber’s famous works tell us that because social actions dominated by social values might have unintended consequences and a large influence on society, it is important for sociological researchers to explore the complex relationships between social values and social phenomena. This fact supports the sociological significance of this study, which aims to specify the relationship between postmaterialist values and social inequality in what concerns subjective well-being.
As Hitlin and Piliavin (2004) pointed out, social values play a significant role in linking social phenomena at the macro level with social processes at the individual level. In other words, social values need to be acknowledged as a key factor linking individual actions with the social structure. Therefore, to identify the social mechanisms generating differences in life satisfaction in European countries, it is useful for social researchers to focus on the role of social values. Additionally, to examine the relationships between postmaterialist values and social inequality in relation to well-being, not psychologically but sociologically, this study adopted the micro-macro link scheme formulated by Coleman (Coleman 1994; Raub, Buskens, and van Assen 2011). Coleman insisted that social phenomena at the macro level should be explained by a series of rational actions, including social actions rationalized by social values and norms. When applying Coleman’s scheme to the problem, the complexity of the processes by which social values and social inequality affect subjective well-being should be noted. Coleman’s scheme can be expanded by considering the complex processes of social values, social inequality, and subjective well-being. Ylikoski’s (2021) study can be referred to as an example. If dualized processes with social values, social inequality, and subjective well-being (materialistic process or postmaterialist process) are clarified, it will reveal two coexisting social mechanisms across the European countries, and it will theoretically contribute to the sociological literature on subjective well-being.
By following the micro-macro link scheme, the relationships between (post)materialist values and the distribution of subjective well-being can be explained as follows. First, (post)materialist values might affect the individual choices of criteria for a good quality of life. Next, individuals evaluate the socioeconomic conditions around them based on their chosen criteria. Finally, aggregating these evaluations of their lives will provide a distribution of subjective well-being that might be intuitively different from that imagined by individuals. Sociological researchers need to note that socioeconomic conditions do not automatically determine subjective well-being at the macro level without social interactions between social values and structure. In certain cases, such interactions could widen the impact of social inequality on subjective well-being more than the level predicted on the basis of the objective distribution of socioeconomic goods. Even under the same socioeconomic conditions, different groups might experience different levels of well-being at the macro level, according to their social values. Sociological researchers should explore the role of social values as a mediator of socioeconomic conditions and subjective well-being to correctly understand the relationships between socioeconomic conditions and subjective well-being.
Exploring the role of social values in understanding social phenomena is an important task for sociological researchers. Without considering the complex interactions between socioeconomic conditions and social values, they might underestimate the role of social inequality in the differences in well-being levels between countries. This is similar to exploring the influence of early capitalism on individuals’ lives without considering religious ethics. For this reason, this study emphasizes the role of social values in subjective well-being when examining the relationships between socioeconomic conditions and (post)materialist values.
I propose five hypotheses to examine the relationship between social values and the average life satisfaction among European countries according to a theoretical framework (micro-macro link scheme). First, it is assumed that there are two distinctive mechanisms that generate life satisfaction (Diener, Oishi, and Lucas 2003; Ryan and Deci 2001; Waterman 1993): one focuses on positional goods, or SES, and the other focuses on relational goods such as healthy human relationships. The former defines the group of individuals dominated by materialist values and the latter the group characterized by postmaterialist values.
To acquire positional goods, individuals belonging to the first group must win a veritable race against others. It is thus predicted that acquiring positional goods will not be easy and that they might occasionally be hurt because of losing this race (Alderson and Katz-Gerro 2016; Burroughs and Rindfleisch 2002; Diener and Biswas-Diener 2002; Sirgy 1998; Stutzer 2004; Tim and Aaron 2001; Vansteenkiste et al. 2006). On the basis of this inference, I propose the following hypothesis:
Hypothesis 1a: Individuals belonging to a group dominated by materialist values are less likely to feel satisfied with their lives.
Furthermore, as individuals dominated by materialist values generally feel less satisfied with their lives, it is predicted that the average life satisfaction of this group will tend to remain low. Thus, I propose the following hypothesis:
Hypothesis 1b: The average life satisfaction of the group dominated by materialist values is lower than that of other groups.
Conversely, individuals belonging to the group characterized by postmaterialist values can obtain relational goods without competing with others. Therefore, it is relatively easy for them to obtain relational goods compared with positional goods. On the basis of this inference, I propose the following hypothesis:
Hypothesis 2a: Individuals belonging to a group characterized by postmaterialist values are more likely to be satisfied with their lives than individuals belonging to a group dominated by materialist values.
In contrast to the first group, members of the second group generally feel satisfied with their lives. Therefore, it is predicted that the average life satisfaction of this group tends to be high. Thus, I propose the following hypothesis:
Hypothesis 2b: The average life satisfaction of the group characterized by postmaterialist values is higher than that of the other groups.
People dominated by materialist values and those characterized by postmaterialist values coexist in every country. Therefore, on the basis of hypotheses 1b and 2b, I will presume that countries whose majority population is dominated by materialist values tend to have a low life satisfaction average, whereas countries with a greater number of individuals characterized by postmaterialist values tend to have a high life satisfaction average. This means that differences in the composition of the two groups among countries may generate differences in the average life satisfaction. On the basis of this inference, I propose the following hypothesis:
Hypothesis 3: Countries with more individuals dominated by materialist values are more likely to have low levels of life satisfaction. Conversely, countries with more people characterized by postmaterialist values are more likely to have high levels of life satisfaction.
If hypothesis 3 is correct, then the differences in the average life satisfaction among European countries can be explained as follows: materialist values deeply permeate Eastern European countries; therefore, the average life satisfaction tends to be lower than in other countries with different predominant values. In this sense, because materialist values are not as entrenched in Northern European countries, their average life satisfaction tends to be higher than in countries where such attitudes are held by a majority of people.
Data and Methods
Data
To test my hypotheses, I used data from a large-scaled, cross-national social survey, EVS, conducted from 2017 to 2020 (EVS 2017). The entire study of values in the larger European society (https://europeanvaluesstudy.eu/) covers the period from 1981 to 2020, but I used EVS 2017, which is the most recent version and covers the period I was interested in. It is among the most adequate data sets to verify my hypotheses because it provides high-quality data related to social values across Europe, on the basis of the latest social trends. It is noteworthy that EVS 2017 adopted a mixed-mode data collection procedure (face-to-face and self-administered surveys) (Luijkx et al. 2021). However, the analyses in this study did not consider the effects of the surveying mode on the response tendency; these effects may require greater attention in future studies.
The population surveyed in the EVS 2017 comprised adult residents (>18 years of age) from European countries. The sample set was selected on the basis of a probabilistic representation method. The total number of EVS 2017 respondents was 56,491. The fewest respondents were from Montenegro (n = 1,076), and the most from Denmark (n = 3,362). After excluding respondents with missing values for the targeted variables in the analyses, the substantive number of respondents used in this study was 46,025.
EVS 2017 included data from the following countries: Albania, Azerbaijan, Austria, Armenia, Bulgaria, Belarus, Croatia, the Czech Republic, Denmark, Estonia, Finland, France, Georgia, Germany, Hungary, Iceland, Italy, Lithuania, the Netherlands, Norway, Poland, Portugal, Romania, Russia, Serbia, the Slovak Republic, Slovenia, Spain, Sweden, Switzerland, and the United Kingdom. I excluded Portuguese data because they had no information on household income, which is a key variable in my analyses. Even after excluding these data, EVS 2017 offered a good balance of data from Northern, Western, Eastern, and Southern Europe.
In addition to EVS 2017, I used data from the World Economic Outlook Database (International Monetary Fund 2021) and the V-Dem Dataset (Varieties of Democracy 2022) to specify the effects of social contexts, such as gross domestic product (GDP) per capita and level of democracy. Using this resource, I could compare mechanisms generating life satisfaction among European countries and examine how they create differences in subjective well-being. Through this work, I confirmed the validity of my hypotheses related to social mechanisms that engender subjective well-being.
Variables
Dependent Variable
I used life satisfaction as the dependent variable in my analysis, measured on a 10-point scale. In EVS 2017, the respondents were asked the following question about life satisfaction: “All things considered, how satisfied are you with your life as a whole these days?” They were then asked to choose a number between 1 (dissatisfied) and 10 (satisfied) as an expression of their feelings.
This variable was examined as a continuous one. As will be mentioned later, however, its distribution did not follow a normal pattern, and the distribution shape was distorted toward “satisfied.” This suggests that a simple linear regression model is inadequate for analyzing life satisfaction using social survey data.
Independent Variables at the Individual Level
As independent variables, I used occupation, employment status, education level, and household income, all of which are considered SES components. The respondents’ occupations were divided into three categories on the basis of the two-digit International Standard Classification of Occupations 2008 code: upper white collar, lower white collar, and blue collar. Employment status was grouped into five categories: full-time employment (≥30 hours per week), part-time employment (<30 hours per week), self-employment, unpaid employment, and unemployed. As a previous study (Treas, Van Der Lippe, and Chloe Tai 2011) showed the negative effect of unemployment on subjective well-being, I distinguished unemployment from unpaid employment (military service, retired or pensioner, homemaker, student, disabled, etc.). In line with previous studies (Keyes 1998; Keyes, Shmotkin, and Ryff 2002; Kobayashi and Hommerich 2017) that have clarified that the education level has a strong effect on subjective well-being, I added education level as an independent variable in my model. Education level was classified into three categories on the basis of EVS 2017 coding: primary education, medium education, and higher education. Finally, the household income variable adopted in my analyses was a 10-point scale one ranging from 1 (1st decile) to 10 (10th decile). This variable was standardized for comparison among countries and, therefore, reflects relative income instead of absolute income. As previous studies (Alderson and Katz-Gerro 2016; Clark et al. 2008; Ferrer-i-Carbonell 2005; Luttmer 2005; McBride 2001; Oshio et al. 2011) have repeatedly emphasized the significance of relative income over absolute income in the case of subjective well-being, using relative income as an independent variable was desirable for the analyses.
Furthermore, to specify people’s tendency toward materialist values, I used the items as assessment criteria of a successful marriage or partnership: Here is a list of things that some people think make for a successful marriage or partnership. Please tell me, for each one, whether you think it is very important [coded as 2], rather important [coded as 1], or not very important [coded as 0]: an adequate income, good housing, and having some time for one’s own friends and personal hobbies/activities.
Thus, it was assumed that income and housing as criteria for a good marriage or partnership reflected people’s materialist values, and time for friends and hobbies or personal activities as a criterion reflected postmaterialist values.
These criteria do not directly measure the (post)materialist values. However, the survey items directly measuring the (post)materialist values in EVS 2017 had highly skewed distributions. For instance, approximately 90 percent of the respondents chose “very important” as their answer when they were asked “how important is it in your life: family.” Because of the social desirability bias, I could not use the items directly measuring the (post)materialist values in EVS 2017 to extract the differences in the (post)materialist values between the latent groups. In contrast, as the criteria for successful marriage or partnership indirectly measured the (post)materialist values, I could confirm the differences between the latent groups with relatively reduced social desirability bias. Therefore, to examine the differences in the (post)materialist values between the latent groups, I used the criteria for successful marriage or partnership in my analyses.
Independent Variables at the Country Level
In my analysis, GDP per capita and Liberal Democracy Index were treated as independent variables at the country level. As such, the former was considered an index of the level of economic prosperity, and the latter, which is one of the indexes measured by the Varieties of Democracy project (https://www.v-dem.net), an index of the level of political stability. I obtained values of GDP per capita (U.S. dollars) for each country in 2017 from the World Economic Outlook Database (International Monetary Fund 2021) and values of the Liberal Democracy Index for each country in 2017 from the V-Dem Dataset version 12 (Varieties of Democracy 2022).
Control Variables
Age, marital status, and sex were used as control variables. Here, all demographic characteristics of the respondents were considered. By controlling for the effects of demographic variables (age, gender, and marital status) on life satisfaction, the indirect effects of independent variables on life satisfaction at the individual and country levels via the population structure can be eliminated. In other words, I can more accurately estimate the effects of the (post)materialist values on life satisfaction. As age is known to have a positive effect on subjective well-being (Keyes 1998; Keyes et al. 2002; Yang 2008), I controlled for the effect of age on life satisfaction. Marriage is also known to have a significant effect on subjective well-being (Kalmijn 2010; Reneflot and Mamelund 2012). Therefore, I added marital status as a control variable in my model. In my analysis, marital status was divided into three categories: married (including registered partnerships), unmarried, and widowed (including divorced and separated). Finally, I considered sex a dummy variable: female (coded as 1) and male (coded as 0).
Analytic Strategy
In this study, it was assumed that different simultaneous mechanisms generate subjective well-being within a society. Thus, to specify each mechanism, I used finite mixtures of regression models (Grün and Leisch 2007, 2015; Leisch 2004), in which the observed responses

where
Additionally, I also used a multilevel linear regression model to estimate the effects of the independent variables on subjective well-being at the individual and country levels. Thus, the results from the finite mixtures of regression models were compared with the results from the multilevel linear regression model. If the results from the former model were better fitted to the EVS 2017 data than the results from the latter model, it would mean that the differences in subjective well-being among the respondents can be explained by the differences in the composition of the latent classes rather than the differences in the average life satisfaction at the country level. To estimate the parameters of the multilevel linear regression model, I used lme4 (Bates et al. 2015) and lmerTest (Kuznetsova, Brockhoff, and Christensen 2017) packages in R (http://www.r-project.org) and Stata 15.
Finally, I counterfactually compared three cases (two potential cases and one actual case) to evaluate the influences of different coexisting mechanisms on subjective well-being within a society. In one potential case, all individuals belonged to the group dominated by materialist values; in the other potential case, they all belonged to the group characterized by postmaterialist values. However, in the actual case, some individuals belonged to one group and some to the other. By comparing the distributions of subjective well-being deduced from each case, it was shown that the coexistence of two different mechanisms generating subjective well-being had a significant influence on perceived subjective social inequality.
Results
Descriptive Statistics
Table 1 presents the descriptive statistics for the variables. The arithmetic means, standard deviations, and minimum and maximum values are shown for the continuous variables (life satisfaction, age, and household income). It is noteworthy that the values for household income are not actual figures but standardized values from 1 to 10. Therefore, the variable of household income in my analyses refers to the relative income within each country and not the absolute income. For categorical variables (gender, marital status, education level, employment status, and occupation), the rates of each alternative for each variable are shown. In my analysis, I dealt with them using a dummy variable (1 or 0).
Descriptive Statistics (n = 46,025).

Note: GDP = gross domestic product.
Table 1 shows that the arithmetic mean of life satisfaction was 7.4. Given that this value surpassed 5.0, respondents to EVS 2017 seemed to be highly satisfied with their lives. However, we need to pay attention to not only the means of life satisfaction, but also its dispersion within society. Even if the mean life satisfaction is high, it cannot deny the possibility that only a fraction of society feels highly satisfied with their lives. A huge variance in life satisfaction among them implies that a significant portion of society experiences extremely low life satisfaction.
I confirmed the distribution pattern of life satisfaction in the EVS 2017, as depicted in Figure 2. The majority of the respondents to the EVS 2017 gave a score of more than seven, implying that most individuals living in European countries are highly satisfied with their lives. However, some people gave a score of less than 4, and their overall rate was not negligible. In other words, there is a nonnegligible inequality in life satisfaction among Europeans, even though they are more likely to feel satisfied with their lives. Therefore, the inequality of life satisfaction has a significant meaning for sociological researchers, and they should examine why it is present among people.

Distribution of life satisfaction (n = 46,025).
Results of the Finite Mixtures of Regression Models and Multilevel Regression Model
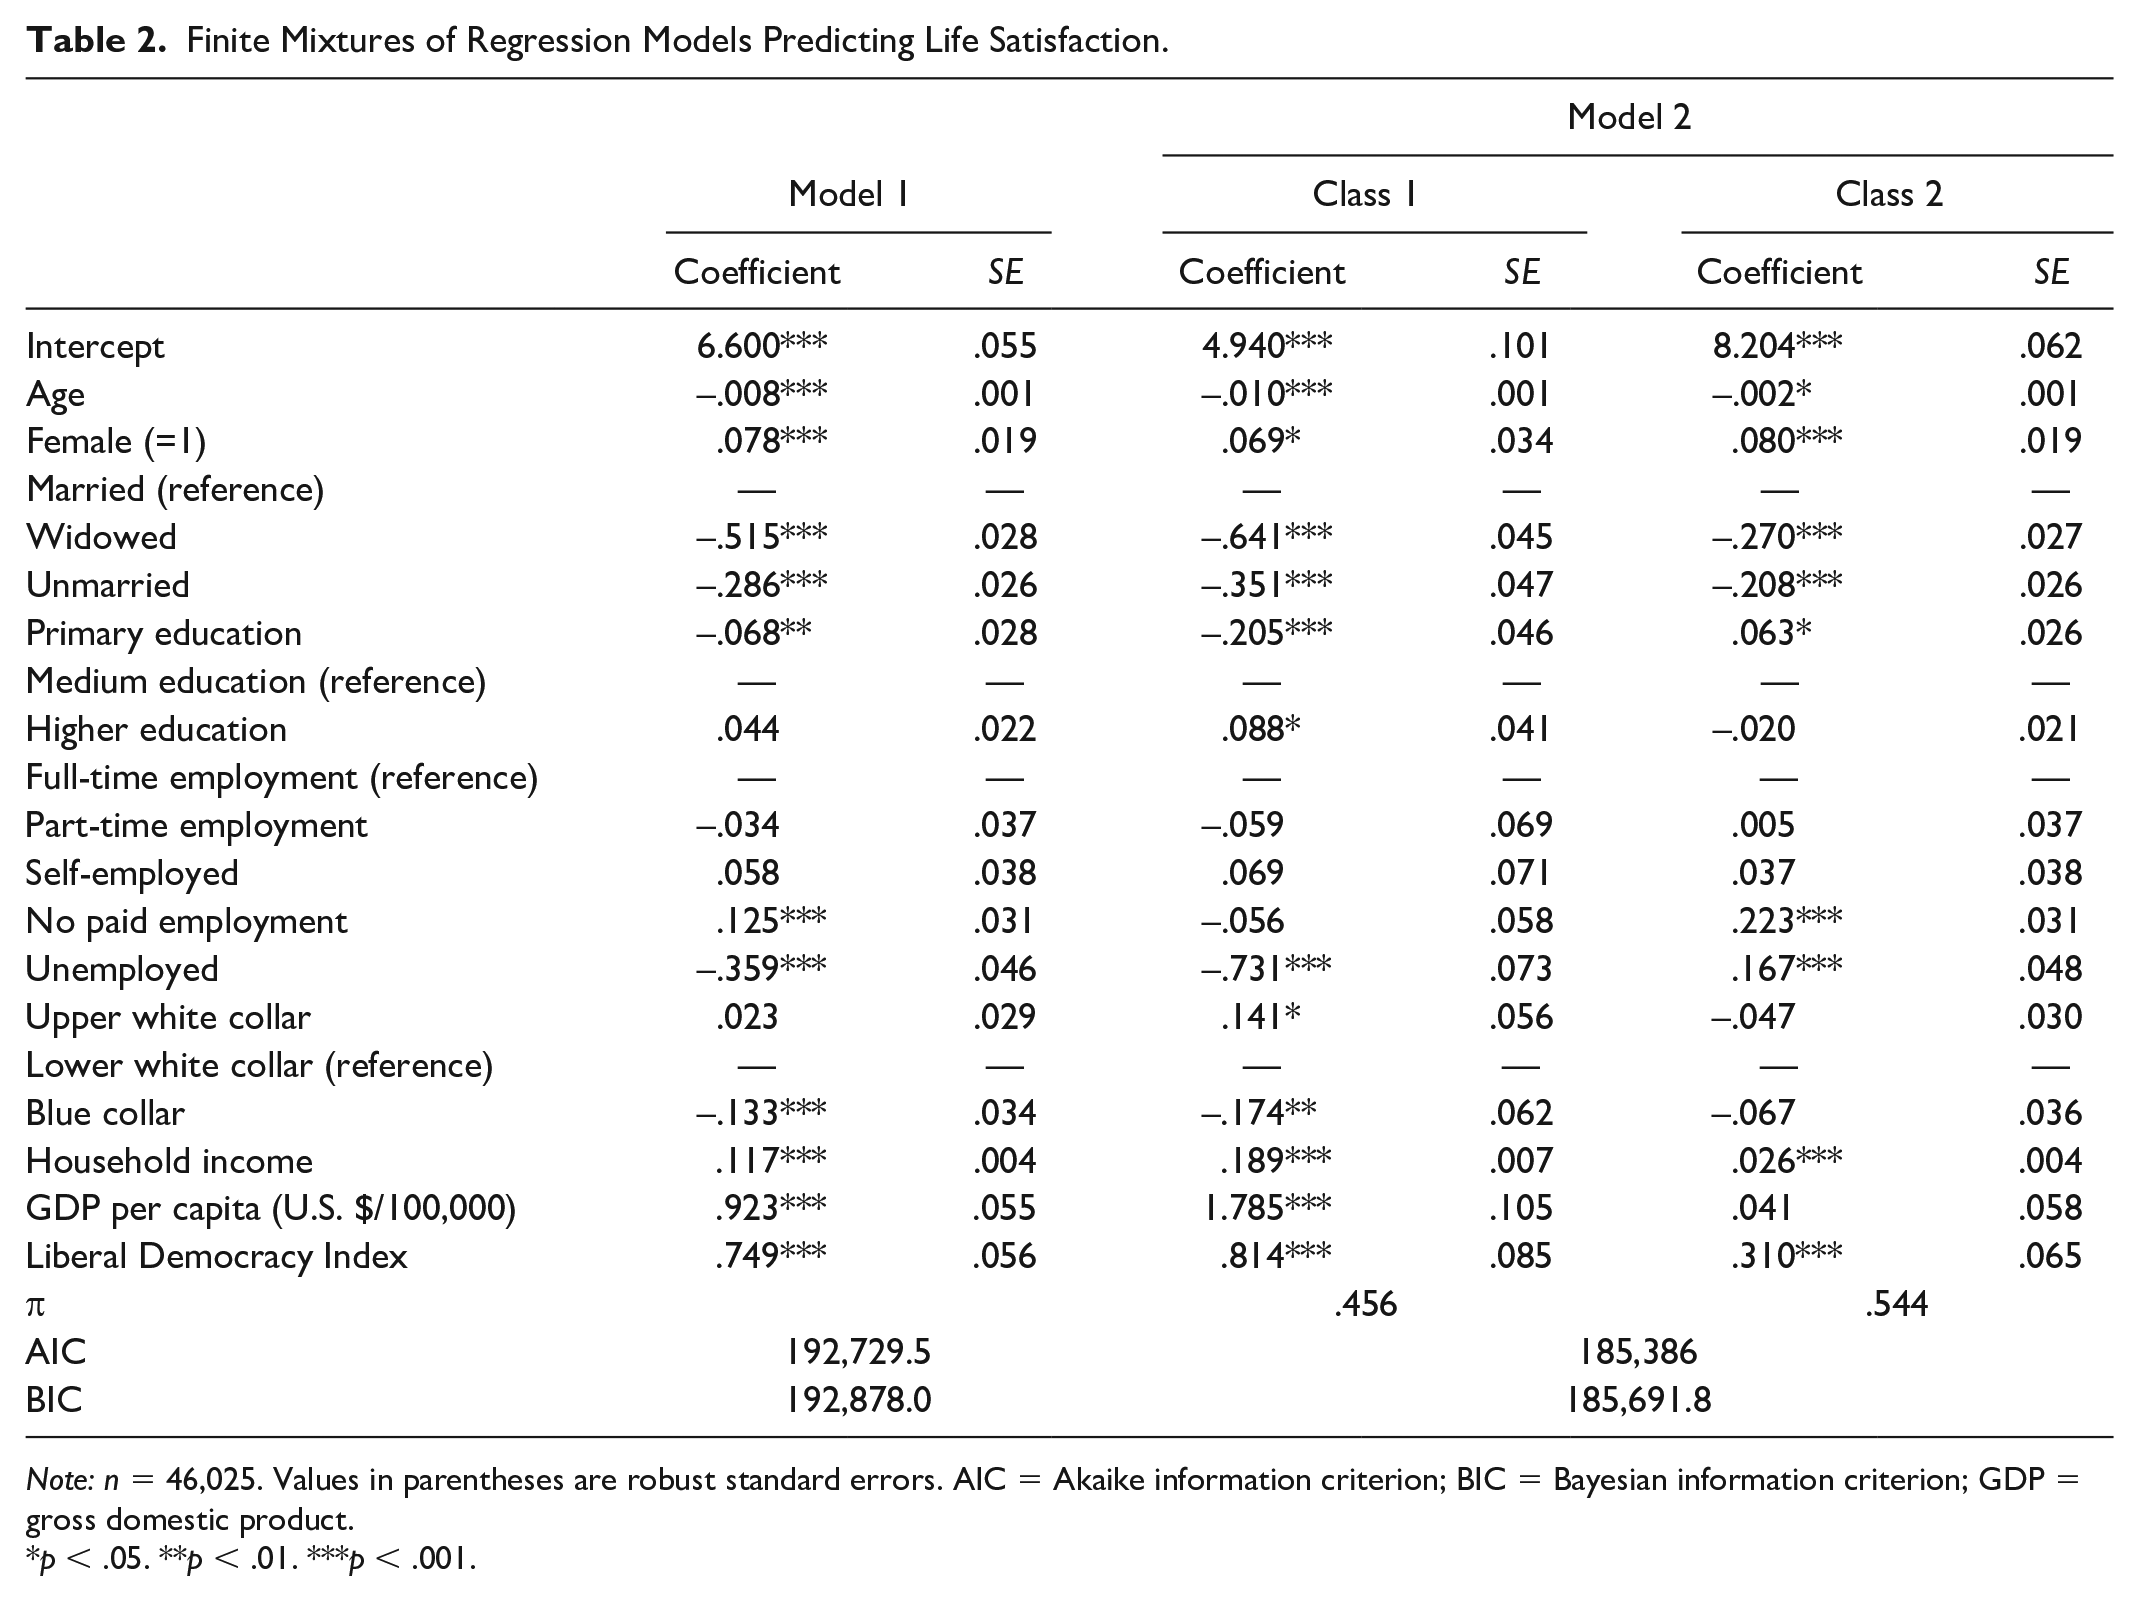
Table 2 presents the analytical results for the finite mixtures of the regression models. Model 1 in Table 2 shows the results of the model with only one latent class, which is equal to a simple multivariate regression model. Model 2 shows the results of the model with two latent classes, class 1 and class 2. Table 2 also clarifies two types of information criteria for each model: the Akaike information criterion (AIC) and the Bayesian information criterion (BIC). On the basis of the AIC and BIC values for models 1 and 2, it was concluded that model 2 is a better fit to the EVS 2017 data than model 1. Therefore, respondents’ life satisfaction can be better predicted by assuming the coexistence of latent classes in the population.
Finite Mixtures of Regression Models Predicting Life Satisfaction.
Note: n = 46,025. Values in parentheses are robust standard errors. AIC = Akaike information criterion; BIC = Bayesian information criterion; GDP = gross domestic product.
p < .05. **p < .01. ***p < .001.
Table 3 presents the results of the multilevel linear regression model for predicting the life satisfaction. Model 3 in Table 3 assumes that there are differences in the average life satisfaction among countries, and that these differences remain even after controlling for the effects of individual variables (demographic characteristics and SES) and country-level variables (GDP per capita and Liberal Democracy Index) on life satisfaction. Tables 2 and 3 show the AIC and BIC values, on the basis of which it can be concluded that model 2 in Table 2 is better fitted to the EVS 2017 data than model 3 in Table 3. This means that the model assuming two latent groups beyond national boundaries can better predict life satisfaction levels of Europeans compared with the model considering differences in average life satisfaction levels among countries.
Multilevel Regression Models Predicting Life Satisfaction.

Note: Number of observations = 46,025; number of groups = 33. Values in parentheses are robust standard errors. AIC = Akaike information criterion; BIC = Bayesian information criterion; GDP = gross domestic product.
p < .05. **p < .01. ***p < .001.
The coefficient of GDP per capita in model 3 has a significant effect at the level of .01; similarly, the coefficient of the Liberal Democracy Index in model 3 barely has a significant effect at the level of .05. However, although GDP per capita and the Liberal Democracy Index indicate statistically significant and positive effects on life satisfaction in model 2 at the .001 level, they do not have such significant effects on life satisfaction in model 3 at the .001 level. This means that by overlooking differences in the effects of socioeconomic conditions between different groups with different social values, the multilevel regression model predicting life satisfaction fails to correctly extract social context effects from the data. Meanwhile, the model assuming the two latent groups (model 2 in Table 2) considers the differences in the composition of different groups with different social values and is better fitted to the data. This fact implies that differences in the average life satisfaction among European countries need to be explained not only by social contexts (GDP per capita and Liberal Democracy Index as an independent variable at the country level) but also by differences in the effects of social contexts depending on social values.
Next, I examined the differences in the mechanisms that generate subjective well-being between the two latent classes. According to model 2 in Table 2, several variables related to SES had statistically significant effects on life satisfaction in class 1. The coefficients of upper white collar, higher education, and household income show positive effects on life satisfaction, whereas the coefficients of unemployed and blue-collar workers show negative effects. All the results were statistically significant. This finding suggests that members of class 1 tend to consider their social status when judging whether they are satisfied with their lives. In other words, they considered materialist values to define life satisfaction.
A few variables related to SES had statistically significant effects on life satisfaction in class 2. The coefficient of household income in Class 2 showed a positive and statistically significant effect on life satisfaction. However, the value of the household coefficient in class 1 (0.189, robust SE = 0.007) clearly surpassed that of the household coefficient in class 2 (0.026, robust SE = 0.004). Additionally, the coefficients of unpaid employment and primary education in class 2 are positive, although they show statistically significant effects on life satisfaction. These results suggest that members of class 2 do not consider their hierarchical status, that is, materialist values, when estimating their life satisfaction.
Additionally, model 2 in Table 2 shows that, although GDP per capita has a statistically significant and positive effect on life satisfaction in class 1, it does not have a statistically significant effect on life satisfaction in class 2. On the other hand, Liberal Democracy Index has a statistically significant and positive effect on life satisfaction in both classes 1 and 2. This result also suggests that class 1 is a group dominated by materialist values focusing on economic prosperity, and that class 2 is a group characterized by postmaterialist values that do not focus on economic prosperity. Therefore, it can be concluded that class 1 is dominated by materialist values, whereas class 2 is characterized by postmaterialist values.
Characteristics of the Two Latent Groups: Materialist or Nonmaterialist Values
In the previous subsection, I defined class 1 as a group dominated by materialist values and class 2 as a group characterized by postmaterialist values. This is confirmed by referring to differences in the criteria for successful marriage or partnership between classes 1 and 2.
I categorized all respondents into class 1 or class 2, on the basis of the posterior probabilities of each latent class. If the posterior probability of class 1 was greater than that of class 2, I categorized the respondents as class 1; otherwise, they were categorized as class 2. Thereafter, I compared the means of the variables for a good marriage or partnership (adequate income, good housing, and having some time for friends and hobbies). Table 4 clarifies that although the members of class 1 tended to value income and housing as criteria for a good marriage and partnership, those of class 2 tended to value time for their friends and hobbies as a criterion for a good marriage and partnership. Additionally, all the differences in the means of income, housing, and time between the two latent groups were statistically significant. Interestingly, Table 4 also revealed that the mean of life satisfaction in class 1 (a group dominated by materialist values) surpasses the mean of life satisfaction in class 2 (a group characterized by postmaterialist values). In other words, members of a group characterized by postmaterialist values are more likely to be satisfied with their lives than members of a group dominated by materialistic values. In contrast, these quantitative differences between classes 1 and 2 might not be large enough. Considering the values of Cohen’s D, it can be said that the difference in the mean of life satisfaction between the two latent groups is sufficiently large; however, the differences in the means of income, housing, and time as a criterion for a good marriage between the two latent groups are not adequately substantial. Nonetheless, the differences were statistically significant and consistent. This finding implies that the postmaterialist values positively affect life satisfaction.
Life Satisfaction and Criteria for a Successful Marriage or Partnership.

p < .001.
Additionally, Figure 3 shows the relationship between the composition rate of class 2 for each country and the average life satisfaction at country level. Figure 3 shows that increasing the composition rate of class 2 within a country increases the average life satisfaction of the country. This means that diffusing postmaterialist values within a country positively affects people’s life satisfaction. Therefore, by focusing on the extent of such diffusion, the life satisfaction level of a country’s population can be accurately predicted. This finding supports hypothesis 3.

Average life satisfaction and composition rate of latent class 2 (n = 33).
Table 5 shows the results of the linear regression model predicting the average life satisfaction of each country. In model 1 in Table 5, GDP per capita seems to have a statistically significant effect on life satisfaction. In model 2, the effect of GDP per capita seems to surpass the effect of the Liberal Democracy Index. However, after controlling for the composition rate of latent class 2, the effect of GDP per capita loses statistical significance. This finding suggests that GDP per capita indirectly affects life satisfaction through social values. In other words, affluent countries promote shifting from materialist values to postmaterialist values, and then diffusing postmaterialist values raises their average life satisfaction. It should be noted that economic prosperity itself does not raise the average life satisfaction in a country. The association between economic prosperity and the average life satisfaction at a country level is mediated by social (postmaterialist) values. Additionally, Table 5 clarifies that as the Liberal Democracy Index reveals a statistically significant effect on the average life satisfaction at the country level after controlling for the composition rate of class 2, political stability as a democratic society has a statistically significant effect on the average life satisfaction, regardless of the population’s social values. Thus, the effect of democracy on the average life satisfaction at the country level should be carefully considered.
Linear Regression Models Predicting Average Life Satisfaction at the Country Level.
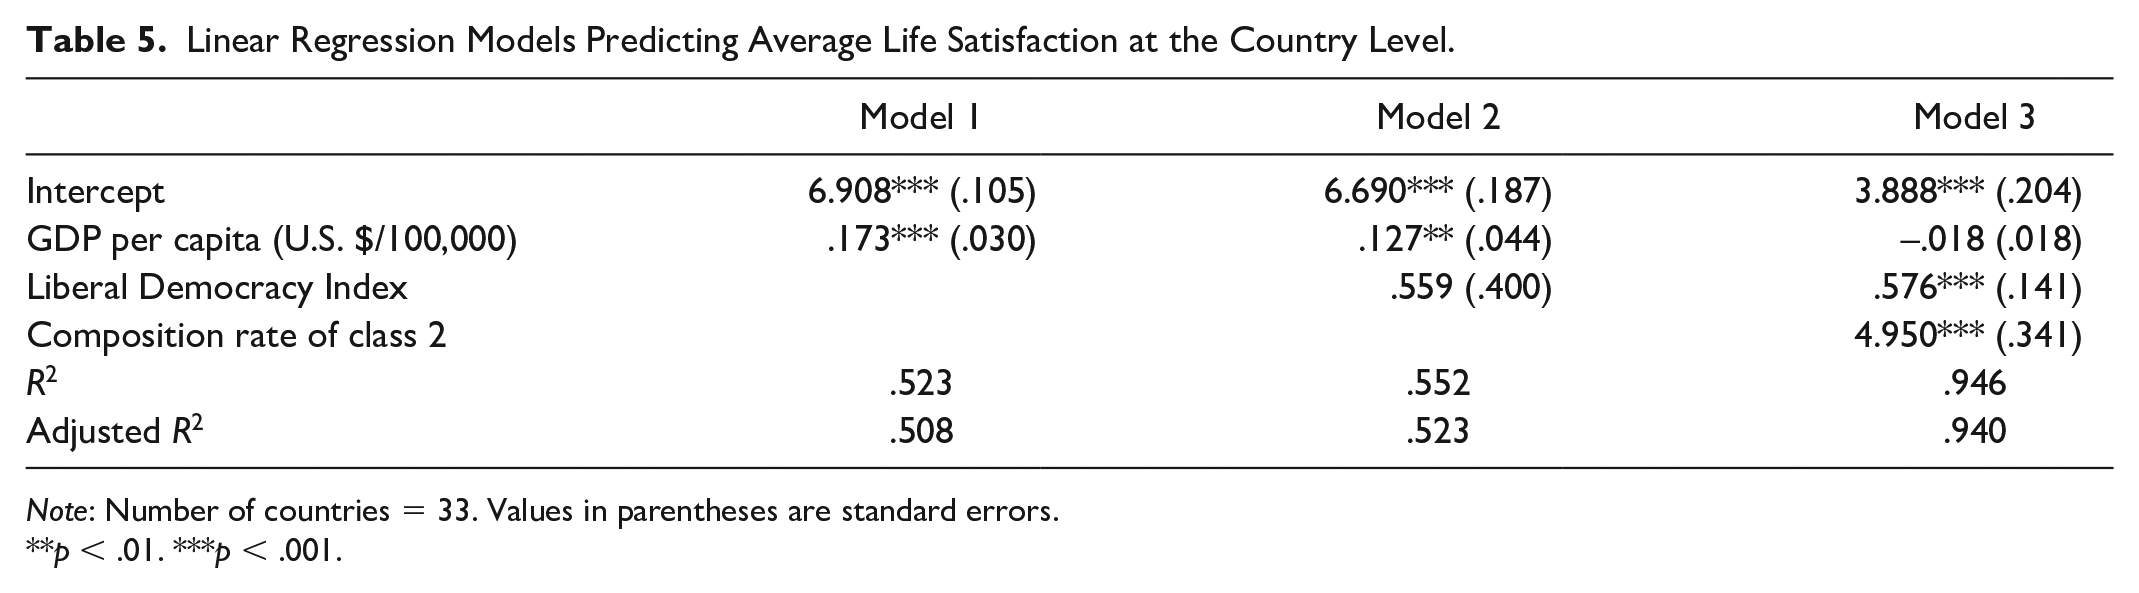
Note: Number of countries = 33. Values in parentheses are standard errors.
p < .01. ***p < .001.
Counterfactual Comparison
Finally, I examined the composition effect of class 2 on subjective social inequality. Figure 4 shows the results of the counterfactual comparison among three cases: only class 1 members, only class 2 members, and the actual case. The left boxplot shows the distribution of average life satisfaction for each country in the counterfactual case, in which all individuals in all countries belong to class 1. Similarly, the middle boxplot shows the distribution of the average life satisfaction for each country in the counterfactual case, in which all individuals in all countries belong to class 2. The boxplot on the right indicates the distribution of the average life satisfaction for each country in the actual case. The overall average of life satisfaction (for each country) in the actual case falls between the overall averages in class 1 and class 2. The range of life satisfaction averages (for each country) in the actual case is wider than that in the case of only class 2.

Counterfactual comparison of the distribution of average life satisfaction for each country among the three cases (n = 33).
Thus, comparing the distribution of the average life satisfaction for each country among the three cases, it is clear that postmaterialist values generate not only high average life satisfaction but also extremely low levels of perceived social inequality in the self-assessment of subjective well-being. In contrast, materialist values generate not only low average life satisfaction, but also relatively high levels of perceived social inequality in the self-assessment of subjective well-being. It should be noted that, in the actual case, perceived social inequality in the self-assessment of subjective well-being was higher than in the case of only class 2. This finding indicates that the coexistence of different mechanisms that generate life satisfaction accentuates the perception of social inequality in the self-assessment of subjective well-being.
In this study, life satisfaction was analyzed using the EVS 2017 data. Consequently, it was clarified that individuals’ level of life satisfaction is determined not only by their demographic characteristics and SES, but also by their (post)materialist values. Individuals dominated by materialist values or characterized by postmaterialist values experience life satisfaction differently. Thus, differences in the prevalence of postmaterialist values among European countries generate differences in the average life satisfaction.
Discussion
In this study, I analyzed the EVS 2017 data to examine the hypotheses proposed, with a view to explaining the differences in the average life satisfaction among countries. These results support my hypotheses. First, it was clarified that the respondents to EVS 2017 could be categorized into two groups: those dominated by materialist values and those characterized by postmaterialist values. Additionally, the results showed that the model considering the two latent groups was better fitted to the EVS 2017 data than the model considering differences in social contexts (economic prosperity and political stability) among countries. This implies that differences in the average life satisfaction among countries may be explained by differences in the mechanisms mediated by social values.
Individuals dominated by materialist values are inclined to consider their SES when judging their life satisfaction and are less likely to feel satisfied with their life. Consequently, the average life satisfaction of the group dominated by materialist values tends to remain at a lower level. The results related to this group support hypotheses 1a and 1b. Conversely, individuals characterized by postmaterialist values are inclined to consider their SES only slightly when estimating their life satisfaction and are more likely to feel satisfied with their life. Consequently, the average life satisfaction of the group characterized by postmaterialist values tended to attain a higher level. The results related to this group support hypotheses 2a and 2b.
Furthermore, I examined the relationship between the composition rate of the group characterized by postmaterialist values and the average life satisfaction at the country level, and their strong correlations were clarified. Countries with a high composition rate of this group attained a higher level of life satisfaction (e.g., Northern European countries); those with a low composition rate of this group had a lower level of life satisfaction (e.g., Eastern European countries). In other words, differences in the composition rate of the group characterized by postmaterialist values among European countries mostly accounted for their differences in the average life satisfaction. This result agrees with the predictions of hypothesis 3.
Notably, we can predict the average life satisfaction of a country by focusing on the composition of the two latent groups. Materialist values can serve as strong predictors of subjective well-being. This means that in achieving subjective well-being, there is a universal mechanism that goes beyond national boundaries.
Finally, I discuss the influence of materialist values on social inequality. The results of the regression models predicting life satisfaction suggest that demographic factors and SES have statistically significant effects on subjective well-being. Therefore, social inequalities related to gender, family, education, occupation, and income might be associated with individuals’ subjective well-being. However, individual subjective well-being is also influenced by social values such as materialist ones. The role of perceived social inequality in subjectively assessing personal well-being expands with the diffusion of materialist values.
A counterfactual comparison among three cases (the actual case, the case of only the group dominated by materialist values, and the case of only the group characterized by postmaterialist values) clarified the following facts: if all countries are composed of only a group characterized by postmaterialist values, the variance in the average life satisfaction among countries will be relatively small. However, as countries are composed of both groups, the variance in the average life satisfaction increases. This role of materialist values in widening subjective social inequality should not be overlooked, and it is noteworthy that materialist values themselves might make people unhappy and generate a stronger perception of social inequality in the self-assessment of subjective well-being among countries.
In conclusion, the findings of this study clarify that individual life satisfaction is not automatically determined by surrounding socioeconomic conditions. Simultaneously, however, they show that individual life satisfaction is not independent of these socioeconomic conditions either but rather significantly associated with them. Sociological researchers should note that the influence of socioeconomic conditions on individual life satisfaction depends on the social values (materialist or postmaterialist values) held by individuals. Specifically, individuals dominated by materialist values are more likely to refer to their SES when assessing their life satisfaction. If they have high SES, they are likely to be highly satisfied with their lives. Conversely, if they have low SES, they are likely to be less satisfied with their lives. Meanwhile, individuals characterized by postmaterialist values tend not to refer to their SES when judging their life satisfaction. In other words, they might be highly satisfied with their lives irrespective of their SES.
Social inequality can be objectified through socioeconomic factors. However, the influences of socioeconomic conditions on social inequality differ according to the social values held by individuals in their everyday lives. To clarify the complex processes of widening or shrinking social inequality through social values, sociological researchers should focus more on the various relationships between social values and socioeconomic conditions. The relationship between postmaterialist values and life satisfaction targeted in this study is just one example to be sociologically examined by sociological researchers. Certainly, the (post)materialist values play the role of accelerating inequality in life satisfaction in European countries. However, it should be noted that such processes occur at the individual level (Longest, Hitlin, and Vaisey 2013). Therefore, the micro-macro link scheme has a significant meaning for sociological researchers to correctly understand the processes generating the differences in life satisfaction in different countries.
For social policy makers, the end goal of social policies is to materialize the subjective and objective well-being of citizens. In other words, economic prosperity and political stability are not the ultimate objective of social policymakers. Economic prosperity and political stability should be understood as a means of materializing the subjective and objective well-being of the citizens. Thus, social policymakers need to pay attention toward the role of social values in carefully materializing subjective well-being. By doing so, the social policies implemented by the social policymakers will be more consequential and efficient for the citizens.
I do not directly discuss objective social inequality in terms of material goods ownership among European countries. However, this does not mean that the study disregards the significance of objective social inequality deduced from the socioeconomic structure. Such inequality cannot be invalidated by postmaterialist values. Conversely, this study insists that such objective social inequality can be accelerated through differences in the diffusion of postmaterialist values beyond national boundaries. Similar to Weber, sociological researchers should explore the process of yielding unintended consequences by connecting social changes and values, which could introduce amplified inequality in our world.
Limitations
This study has a few limitations that should be overcome in future research. First, it does not explain why and how people are categorized into two groups, and simply assumes the coexistence of these groups within a society. In other words, the coexistence of the group dominated by materialist values and the group characterized by postmaterialist values was treated as given. Obviously, they should be examined theoretically more in future studies of this research project.
Furthermore, this study analyzed only EVS 2017 cross-sectional data. The results of the analyses clarified the latent class structure of life satisfaction in European countries but did not explore the degree of its durability. The structure might be robust, not only beyond national boundaries but may also be independent of social changes over the duration of a few decades. Alternatively, it may easily change under the effects of various social changes. For instance, the relationships between subjective well-being, social values, and social inequality can differ according to gender or age. If this is true, population changes could affect the latent class structure of life satisfaction. Additionally, the association between subjective well-being and social factors observed in the cross-sectional data might disappear in the longitudinal analysis using the panel data (Böckerman and Ilmakunnas 2009). The association between subjective well-being and social factors observed in the cross-sectional data needs to be interpreted carefully. To examine the durability of the latent structure of life satisfaction, I would need to test my hypotheses using longitudinal data or, at least, with repeated cross-sectional data. This task should be included in future research projects.
Third, this study analyzed data from only European countries. Therefore, whether the logic used in this study can be applied to other countries (i.e., in North America and South America, Asia, Africa, and Oceania) is open to discussion. I cannot deny the possibility that for other countries, the latent structures of subjective well-being may be different from the structure discussed in this study. Therefore, in the future, I need to confirm whether the latent structure examined in this study can be applied to other countries.
Finally, the dependent variable used in this study, i.e., life satisfaction, might systematically include measurement errors depending on the social contexts in European countries (Kristensen and Johansson 2008) and, moreover, have nonlinear relationships with the independent variables, i.e., economic prosperity and democracy regime. This possibility should be carefully scrutinized in future studies.
Footnotes
Appendix A
Liberal Democracy Index, GDP per Capita, and Average Life Satisfaction by Country.

| Name | Liberal Democracy Index | GDP per Capita (U.S. $) | Average Life Satisfaction |
|---|---|---|---|
| Albania | .430 | 4,526 | 7.230 |
| Azerbaijan | .069 | 4,218 | 6.402 |
| Austria | .778 | 47,321 | 7.898 |
| Armenia | .227 | 3,869 | 6.531 |
| Bosnia and Herzegovina | .389 | 5,160 | 7.822 |
| Bulgaria | .532 | 8,414 | 6.456 |
| Belarus | .112 | 5,779 | 6.828 |
| Croatia | .621 | 13,628 | 7.539 |
| Czech Republic | .746 | 20,667 | 7.513 |
| Denmark | .887 | 57,773 | 8.040 |
| Estonia | .852 | 20,431 | 7.112 |
| Finland | .830 | 46,437 | 8.023 |
| France | .824 | 40,054 | 7.303 |
| Georgia | .545 | 4,359 | 6.407 |
| Germany | .841 | 44,637 | 7.691 |
| Hungary | .443 | 14,609 | 7.194 |
| Iceland | .794 | 73,085 | 8.094 |
| Italy | .803 | 32,649 | 7.376 |
| Lithuania | .758 | 16,879 | 6.729 |
| Montenegro | .351 | 7,800 | 7.541 |
| The Netherlands | .832 | 48,800 | 7.912 |
| Norway | .862 | 75,307 | 8.048 |
| Poland | .553 | 13,869 | 7.567 |
| Portugal | .849 | 21,483 | 7.267 |
| Romania | .523 | 10,777 | 7.486 |
| Russia | .113 | 10,724 | 6.447 |
| Serbia | .299 | 6,293 | 6.886 |
| Slovakia | .726 | 17,544 | 7.184 |
| Slovenia | .782 | 23,511 | 7.754 |
| Spain | .767 | 28,197 | 7.470 |
| Sweden | .890 | 53,459 | 7.796 |
| Switzerland | .859 | 83,695 | 8.040 |
| North Macedonia | .363 | 5,462 | 7.439 |
| United Kingdom | .800 | 40,904 | 7.804 |
Acknowledgements
I would like to thank the editor and anonymous reviewers of Socius for their helpful comments and suggestion. The part of this study was presented at the American Sociological Association’s 115th Annual Meeting in 2020 and the 13th International Network of Analytical Sociologists Conference in 2021.
Funding
The author(s) disclosed receipt of the following financial support for the research, authorship, and/or publication of this article: This research is supported by the Japan Society for the Promotion of Science KAKENHI (grants 18H03647, 19H00609, and 21H00776).
Code Availability
Contact the corresponding author. He will notify the GitHub repository to confirm the code.