
Abstract
During late spring 2020, when states were issuing stay-at-home orders, the majority of congregations and Americans followed protocols and avoided in-person worship. Yet a vocal minority of Americans defied protocols and gathered in worship. The authors use national panel data collected in mid-May and August 2020 to assess whether Americans who attended worship more frequently during lockdown restrictions were more likely to report testing positive for coronavirus disease 2019 (COVID-19) three months later. Accounting for relevant correlates including mask use, general attendance at large gatherings, and knowing others who had tested positive, the likelihood that Americans tested positive for COVID-19 between May and August 2020 grew almost linearly as Americans attended in-person worship more frequently during lockdown. However, interactions indicate that this increase was limited primarily to those who were not regular attenders previously. The results suggest that worship attendance during lockdown substantially increased COVID-19 infections for the minority who attended possibly as a form of protest.
Keywords
From March 15 to May 31, 2020, 42 states and territories issued mandatory stay-at-home orders to curb the extent of the coronavirus disease 2019 (COVID-19) pandemic. These affected 73 percent of all U.S. counties. Other states that neglected to issue mandatory orders, such as New Mexico, Texas, Kentucky, or Iowa issued “advisory orders” that also recommended that persons shelter in place and strictly avoid in-person gatherings. Data from the Centers for Disease Control and Prevention (CDC) show that the height of these lockdown mandates was in late April to early May 2020. By mid-May, most states had transitioned from mandated stay-at-home orders to advisory orders that continued on well past May 31, 2020 (Moreland et al. 2020).
Although polls taken during this time frame indicated that the vast majority of Americans both supported stay-at-home orders and personally sought to follow these orders and avoid in-person gatherings, Americans quickly became politically and religiously polarized around the pandemic and government protocols (Burge 2020a, 2020b; Daniller 2020; Freking and Fingerhut 2020; Millhiser 2020; Newport 2020; Pew Research Center 2020). This was especially the case regarding the issue of shutting down businesses and hurting the economy (Gorski and Perry 2022; Kirk 2020; Mascaro 2020; Perry, Whitehead, and Grubbs 2021b) and restricting Americans from attending large worship gatherings. Several vocal pastors and leaders on the political right expressed that such restrictions violated First Amendment rights and that corporate worship constituted an “essential activity” for the faithful (Luscombe 2020). To be sure, the vast majority of Americans, including white evangelical Protestants, followed protocols and avoided in-person worship gatherings for the duration of the mandated lockdowns and afterward (Burge 2020b; Gecewicz 2020). And data show that the majority of congregations also closed their doors to corporate worship and went online during this time (Gecewicz 2020).
Nevertheless, numerous news reports documented that some Americans continued to attend in-person worship at this time of heightened risk, some primarily citing religious reasons and others stressing their rejection of government oppression (Gjelton 2020; Li 2020; Luscombe 2020). And there have been claims that these in-person worship gatherings significantly worsened the pandemic in certain areas. In early April 2020, a California public health director estimated that one third of COVID-19 cases in Sacramento county had been linked to houses of worship (Koran 2020). In May 2020, the CDC released a report showing that a 2.5-hour choir practice attended by 61 persons resulted in either direct infection or probable secondary infection of roughly 87 percent of attendees, with 3 patients hospitalized and 2 dead (Hamner et al. 2020). Later that month, the CDC released a second report showing that 38 percent of attendees at a small church in Arkansas tested positive for COVID-19, with 3 persons dying. They also linked another 26 additional cases in the community to that church (James et al. 2020).
Some survey evidence corroborates the expectation that worship attendance during the lockdown restrictions would result in greater exposure to infection. Data from the 2021 Baylor Religion Survey (BRS; Baylor University 2021) indicate that the percentage of Americans who reported being infected at some point with COVID-19 rose from 14 percent among those who “never” attended worship services in the previous year to roughly one quarter of those who attended services at least weekly. In an analysis of the large Cooperative Election Study (CES) fielded in October 2020, Burge (2021) showed that Americans who reported attending religious services more than weekly (in general, not during a specific time window) were more likely than other Americans to report being diagnosed with COVID-19 during the past year. Burge also showed that these trends held for both Democrats and Republicans, suggesting that there could have been an independent “attendance effect” in spreading COVID-19. Yet both the 2021 BRS and 2020 CES data cannot account for the likelihood that persons who would attend worship more often during the months preceding each survey would also be attending other in-person gatherings, thereby being exposed to COVID-19 elsewhere.
In this brief report, we provide a more focused analysis of how worship attendance during a particularly high-risk time of the pandemic (late April and early May 2020) contributed to Americans’ soon testing positive for COVID-19 and potentially spreading the virus to others. Specifically, we use national panel data that were collected during mid-May 2020 and inquired about Americans’ various behaviors in the previous two weeks (i.e., during the height of mandated stay-at-home orders), with a follow-up wave in August 2020, to test whether more frequent worship attendance during the mass lockdown increased the likelihood that previously uninfected Americans reported testing positive for COVID-19 three months later.
Because the issue of in-person worship attendance during late May 2020 was so political, we also take into account previous worship attendance before the pandemic. This is so that we can distinguish between (1) Americans who attended in-person worship gatherings at the height of lockdown restrictions likely because they had always attended worship services and thus felt compelled to accept the health risk for religious reasons and (2) Americans who may have been attending in-person worship gatherings as a form of protest, not necessarily because they were committed to worship attendance per se. Using a cross-product interaction term, we assess whether any association between in-person worship around April to May 2020 and later testing positive for COVID-19 was higher for persons who were already more or less frequent attenders.
Methods
Data
Data for this study come from the Public Discourse and Ethics Survey (PDES) (Grubbs et al. 2022; Perry, Whitehead, and Grubbs 2020, 2021a, 2021b). There are eight waves of the PDES: wave 1 was collected in August 2019, wave 2 in February 2020, wave 3 in May 2020, wave 4 in August 2020, wave 5 in October 2020, wave 6 in November 2020, wave 7 in February 2021, and wave 8 in August 2021. For our analysis, we use data from three PDES waves: wave 1 (for most controls), wave 3 (for behaviors during the height of mandated stay-at-home orders and a Christian nationalism measure), and wave 4 (for the outcome).
Survey waves were designed by the authors, and the survey instrument was fielded by YouGov, an international research data and analytics company. YouGov recruits a panel of respondents through Web sites and banner ads. 1 These respondents are not paid directly but are entered into lotteries for monetary prizes. To draw a nationally representative sample, YouGov uses a method called “matching.” Drawing a random sample from the American Community Survey, YouGov then matches a respondent in the opt-in panel who is the closest to the census respondent on the basis of key sociodemographic factors. Because of the specific recruitment and sampling design used by YouGov, the company does not publish traditional response rates. However, YouGov develops sampling weights to ensure that the survey sample is in line with nationally representative norms for age, gender, race, education, and census region. 2 Results from the PDES compare favorably with results from the 2018 General Social Survey on demographic factors such as age, gender, race, marital status, region, educational attainment, and evangelical affiliation (see Table A1 in the Appendix). The resulting original survey sample included 2,519 Americans who were matched and weighted. We limit our analysis to those respondents who had not tested positive for COVID-19 at wave 3 of the survey. This in combination with sample attrition between waves and a very modest amount of missing data leaves our final analytic sample with 1,254 cases in full models. For a descriptive statistics of all variables in the models, see Table 1.
Descriptive Statistics.

Source: Public Discourse and Ethics Survey, waves 3 and 4 (n = 1,264). COVID-19 = coronavirus disease 2019.
p ≤ .01 and ***p ≤ .001 (two-tailed test).
Testing Positive for COVID-19
Starting with wave 3 (May 2020), respondents were asked to indicate whether they had tested positive for COVID-19. They were asked this question again in wave 4 (August 2020). We limit our sample to the vast majority of respondents who had not already tested positive for COVID-19 in May, and we estimate binary logistic regression models to predict whether respondents reported testing positive for COVID-19 by August (yes = 1, no = 0). Thus we are estimating the net associations between various behaviors and characteristics and testing positive for COVID-19 sometime within that three-month span.
In-Person Worship Attendance during Lockdown
Starting in wave 3 (May 2020), we began asking Americans how frequently they engaged in various activities within the past two weeks. Because the survey was fielded in mid-May, this means that we were asking Americans about their behaviors around late April or early May, which was during the height of mandated stay-at-home orders (Moreland et al. 2020). Among the questions that were asked was how often Americans attended in-person worship gatherings. Respondents could indicate that they attended never (1), once a week (2), two or three times a week (3), four to six times a week (4), or daily (5). 3 We first estimate models to assess the net association between the full worship attendance measure (ranging from 1 to 5) in May 2020 and testing positive for COVID-19 by August 2020. Because a small percentage of Americans attended in-person worship services at high frequencies during the height of stay-at-home orders, we also estimate models with the worship attendance measure as a binary variable (0 = never attended, 1 = attended at least weekly). This also allows us to estimate interaction effects with their typical worship attendance.
Controls
Multivariate models also included a number of controls theorized to potentially confound the association between worship attendance during mandated lockdowns and testing positive for COVID-19. First, it is possible that worship attendance during the height of mandated stay-at-home orders simply represents an inclination to disregard protocols entirely. That is to say, it is likely that the same persons who would attend in-person worship during mandated lockdown would also be those who were meeting in larger group gatherings in general and not wearing masks (Perry et al. 2020). Thus we use measures asking how often during the past two weeks did respondents wear masks or attend gatherings with 10 or more people (1 = never to 5 = daily).
We also seek to account for respondents’ levels of exposure within their specific contexts by including controls for whether the respondents knew anyone who had tested positive for COVID-19 at wave 3 and wave 4. This would allow us to better isolate whether in-person worship attendance during wave 3 was a factor in testing positive by wave 4 or whether respondents were simply already more likely to interact with infected persons.
Among other important factors, mandated stay-at-home orders were highly polarizing at the time, with clear partisan and religious differences observed across various public opinion polls and surveys (Gorski and Perry 2022; Hill, Gonzalez, and Burdette 2020; Perry et al. 2020, 2021a, 2021b; Smothers, Burge, and Djupe 2020). Thus we include controls for religious and political characteristics. Political characteristics include party identification and political ideology. For party identification, we use dummy variables for Republican (reference), Democratic, independent, and other or not sure. Likewise, for political ideology, we include dummy variables for very liberal (reference), liberal, moderate, conservative, very conservative, and don’t know.
Religion controls include tradition, how Americans reported their typical worship attendance at wave 1 (August 2019), and Christian nationalism. Religious tradition is measured with six categories: Evangelical Protestant (reference), liberal Protestant, Catholic, other Christian, other religion, and seculars (including atheists, agnostics, and the unaffiliated). Attendance is measured from 1 = never to 6 = more than once a week. 4
Recent research has also identified that “Christian nationalism,” or the belief that America should be distinctively Christian in its identity, sacred symbols, policies, and cultural membership, is a powerful predictor of how Americans responded to COVID-19 mandates, recommendations, and vaccines (Corcoran, Scheitle, and DiGregorio 2021; Gorski and Perry 2022; Perry et al. 2020, 2021b). Thus we use a standard measure of Christian nationalism following research by Whitehead and Perry (2020), taken from wave 3 (May 2020) of the PDES. 5 This scale includes six level-of-agreement questions using the statements “The federal government should advocate Christian values,” “The federal government should declare the United States a Christian nation,” “The federal government should enforce strict separation of church and state” (reverse coded), “The federal government should allow religious symbols in public spaces,” “The federal government should allow prayer in public schools,” and “The success of the United States is part of God’s plan.” Responses range from 1 = strongly disagree to 5 = strongly agree. Following previous research, we combine measures into an additive scale ranging from 0 to 24, with higher scores indicating greater adherence to Christian nationalism (Cronbach’s α = .90).
Finally, sociodemographic controls are included for age (19–90 years), gender (male = 1, female = 0), race (white [reference], Black, Hispanic, Asian, and other race), educational attainment (1 = less than high school, 6 = postgraduate degree), family income (dummy variables: $0–$29,999 per year [reference], $30,000–$100,000, $100,000 or more, and did not report), and southern residence. 6
Results
Table 2 presents coefficients from binary logistic regression models predicting that Americans tested positive for COVID-19 between May 2020 and August 2020. Model 1 include the attendance frequency question with all controls except for the measures for wearing masks and attending gatherings in general. The more Americans attended in-person worship during the height of mandated stay-at-home orders, the more likely they were to report testing positive for COVID-19 by August (b = .868, p < .001). Also, knowing someone who had tested positive for COVID-19 in wave 3 is positively associated with testing positive for COVID-19 by wave 4, but knowing someone who had tested positive by wave 4 is negatively associated with testing positive by wave 4. The intuitive explanation is that if respondents were exposed to persons who had tested positive for COVID-19 by the early months of the pandemic, they were quite likely to test positive themselves. However, by wave 4, the pandemic had become so widespread that the likelihood that respondents knew someone who had tested positive far outpaced the likelihood that they themselves had tested positive. These patterns remain the same throughout all models.
Binary Logistic Regression Models Predicting Testing Positive for Coronavirus Disease 2019 between May 2020 and August 2020.

Source: Public Discourse and Ethics Survey, waves 3 and 4 (n = 1,264).
Note: Reference categories are white, income (<$30,000 per year), Republican, very liberal, and born-again Protestant.
p ≤ .10, *p ≤ .05, **p ≤ .01, and ***p ≤ .001 (two-tailed test).
In model 2, the attendance measure is removed and the other measures for mask-wearing and attending gatherings are added to assess their relative influence. Wearing a mask more frequently is unassociated with testing positive for COVID-19 by August, but more frequently attending gatherings of 10 or more people in late April or early May of 2020 is positively associated with testing positive for COVID-19 by August. Last, model 3 includes all variables together. Although the statistical significance of the attendance measure has been reduced somewhat by the inclusion of the other variables (b = .706, p < .05), it is among the only significant predictors in the model besides knowing persons who had already tested positive.
Figure 1 illustrates the nearly linear association between attending in-person worship services more frequently at the height of mandated stay-at-home orders and soon testing positive for COVID-19. Among those who “never” attended in-person worship, 1.5 percent reported testing positive for COVID-19 by August. At each increase in attendance frequency, the likelihood of testing positive for COVID-19 increases to the frequency of “four to six times per week” attendance where nearly 15 percent of Americans who had not previously tested positive for COVID-19 tested positive by August. This declined slightly to 10 percent among those who attended “daily” during lockdown, but the overall pattern is clearly a higher likelihood of testing positive for COVID-19 than those who stayed home completely. It is also important to keep in mind that this is after accounting for whether Americans had engaged in mask-wearing protocols, attended large gatherings in general, and knew anyone else who had tested positive for COVID-19 in May or August, along with other religious, political, and sociodemographic characteristics.

Predicted percentage of testing positive for coronavirus disease 2019 between May 2020 and August 2020 across frequency of attending in-person worship gatherings during the prior two weeks (reported in mid-May 2020).
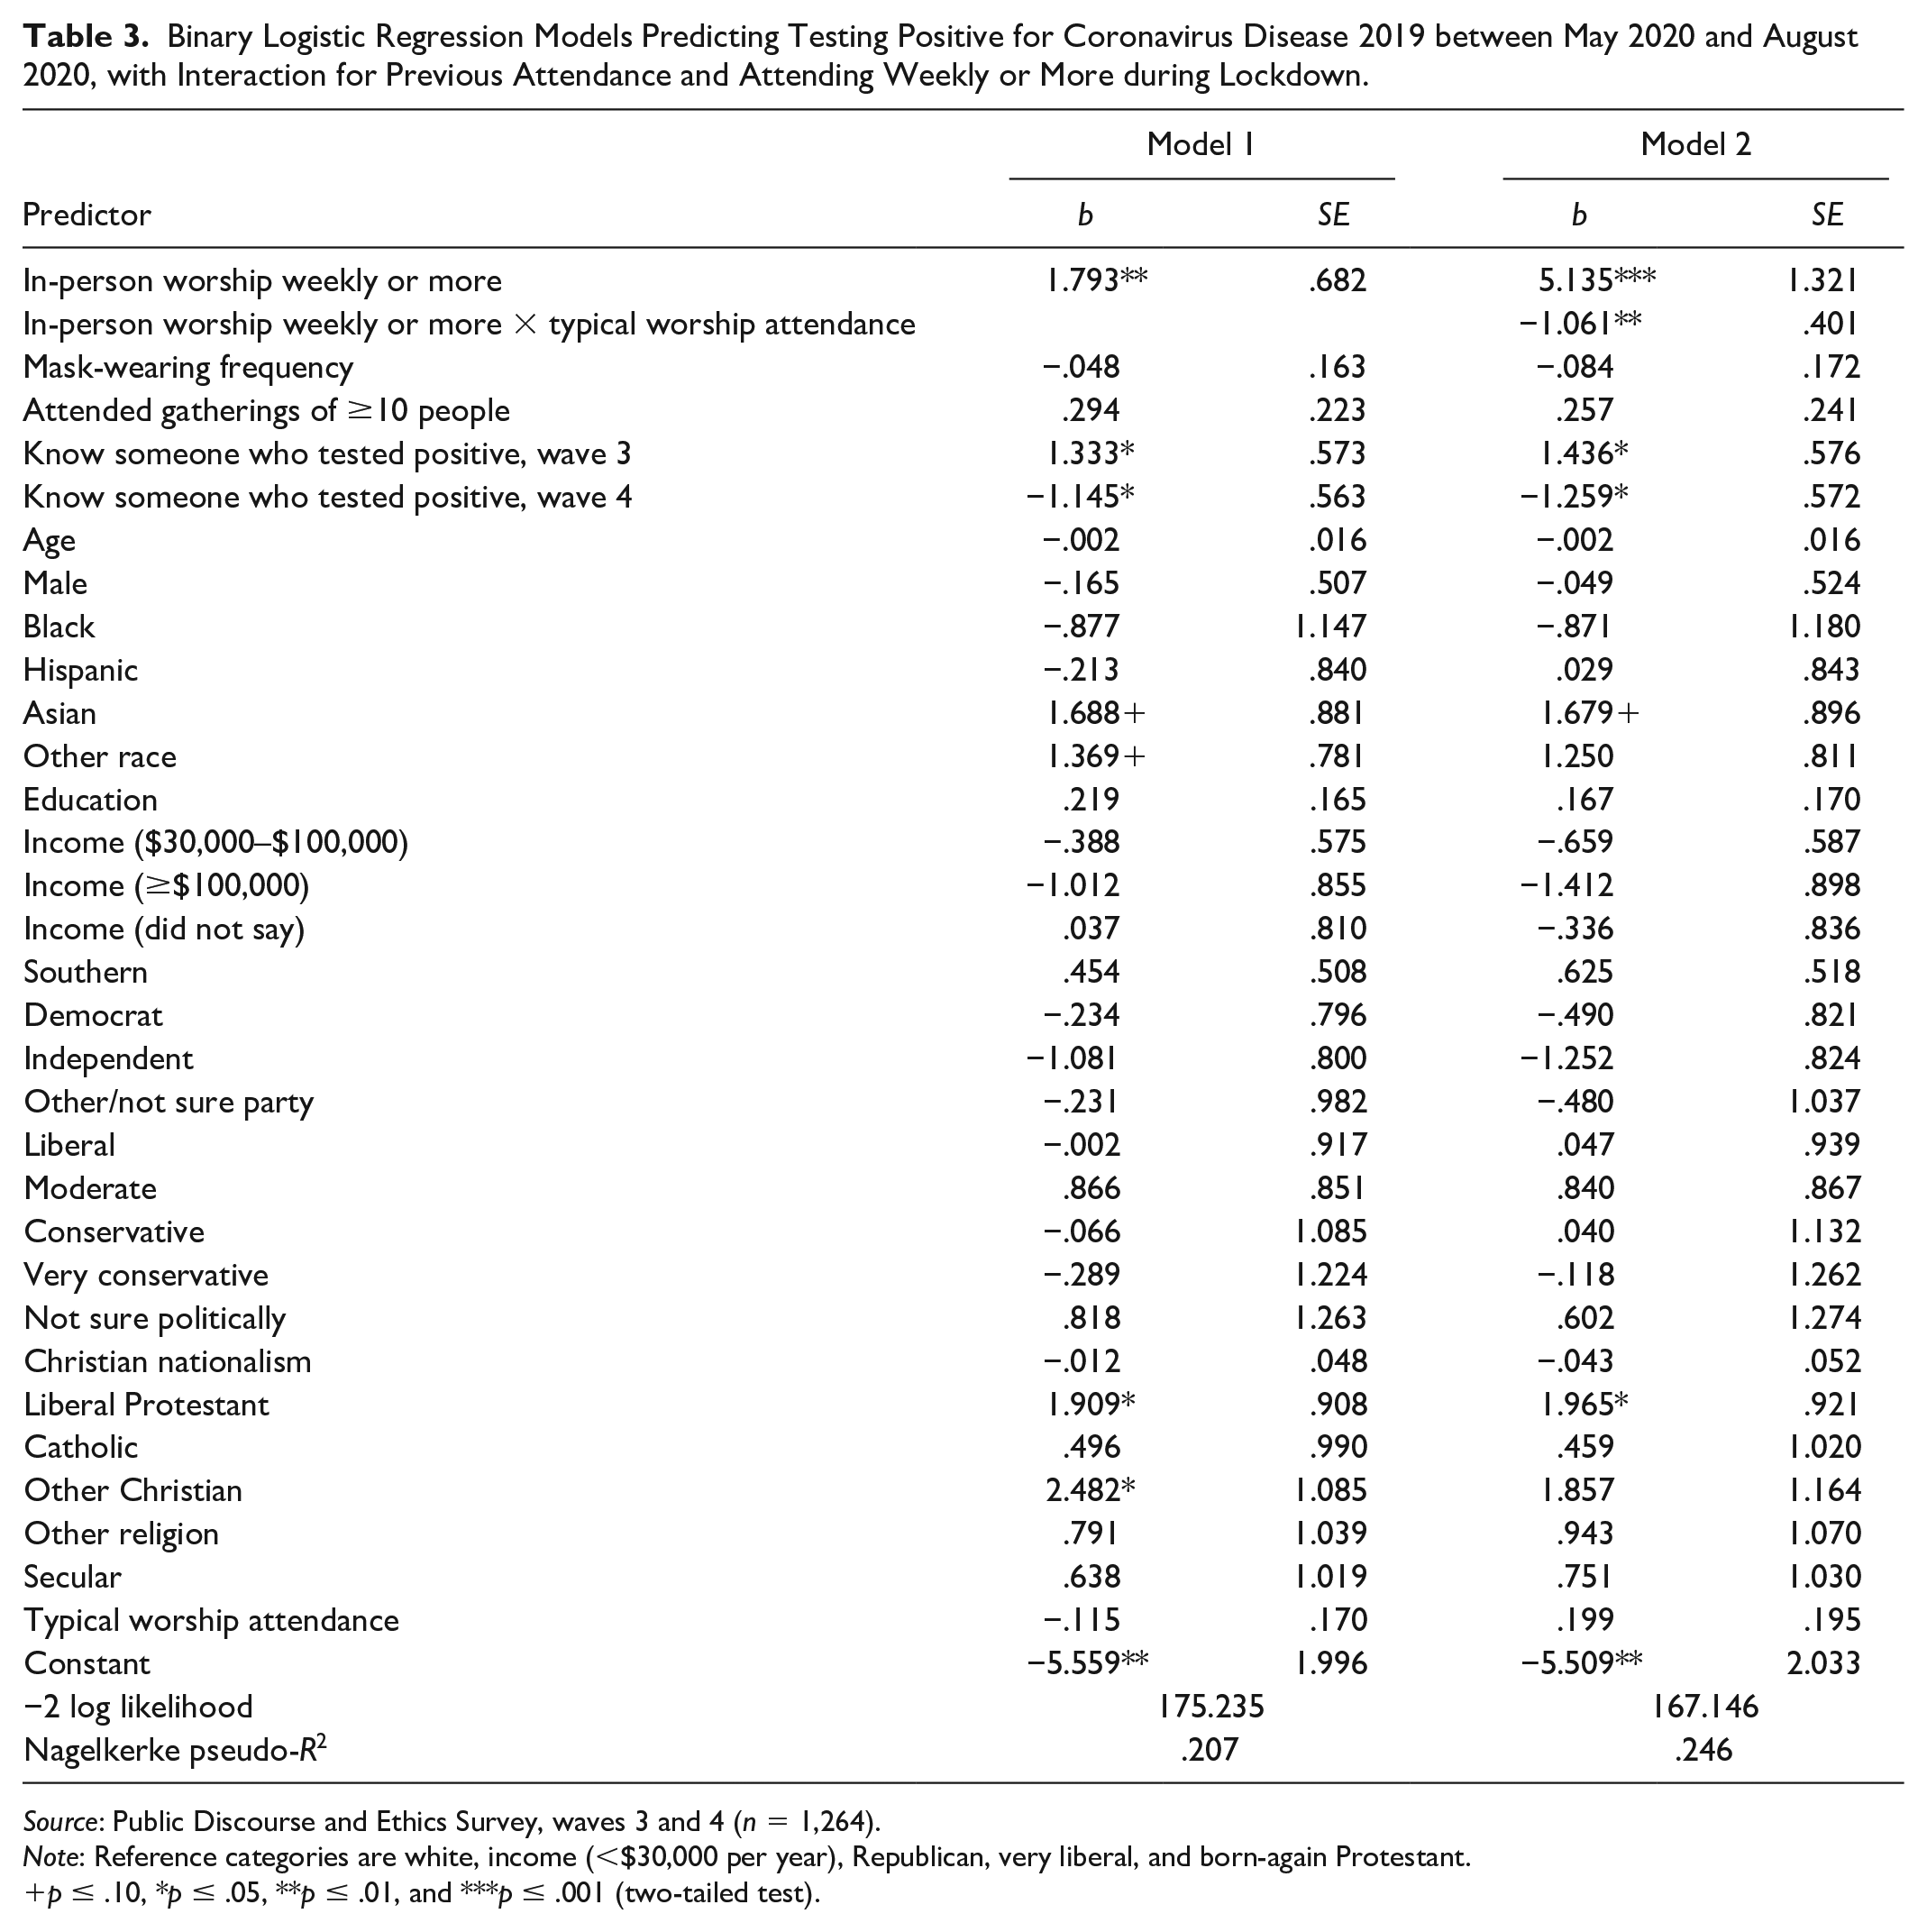
But how might this association vary by how often Americans were already attending worship gatherings as a baseline before COVID-19? Because small numbers of Americans attended in-person worship services at high rates during the height of mandated stay-at-home orders, Table 3 uses a binary measure of in-person worship attendance to test the interaction. Model 1 replicates the full model from Table 2 but substitutes the binary frequency measure. The model fit is actually improved slightly by this inclusion (R2 increases from .201 to .207 and –2 log likelihood decreases from 176.537 to 175.235), and the binary attendance measure remains a positive predictor of testing positive for COVID-19 by August (b = 1.793, p < .01), indicating that virtually any worship service attendance at the height of lockdown orders predicted testing positive for COVID-19.
Binary Logistic Regression Models Predicting Testing Positive for Coronavirus Disease 2019 between May 2020 and August 2020, with Interaction for Previous Attendance and Attending Weekly or More during Lockdown.
Source: Public Discourse and Ethics Survey, waves 3 and 4 (n = 1,264).
Note: Reference categories are white, income (<$30,000 per year), Republican, very liberal, and born-again Protestant.
p ≤ .10, *p ≤ .05, **p ≤ .01, and ***p ≤ .001 (two-tailed test).
Model 2 includes the interaction term for any in-person worship attendance × typical worship attendance. The interaction term is statistically significant and negative (b = −1.061, p < .01), indicating that as typical worship attendance increases, the association between in-person worship attendance during lockdown and testing positive for COVID-19 declines. Moreover, with the inclusion of the interaction term, the lower order term for in-person worship attendance increases in strength, indicating that at the lowest values of typical attendance (never attend), the association between in-person worship and testing positive for COVID-19 is the strongest.
Figure 2 clearly illustrates this trend. Among those who never attended in-person worship during the height of mandated stay-at-home orders, the likelihood that they tested positive for COVID-19 by August remains below 3 percent across values of typical worship attendance. However, among those who attended any in-person worship services during COVID-19 lockdowns, the likelihood that they tested positive for COVID-19 by August is its highest for those never or rarely attended religious services before the pandemic. And this likelihood declines as previous worship attendance increases. In other words, it appears that those who tested positive for COVID-19 in August 2020 after attending in-person worship services in late April or early May 2020 were not those who were previously committed to attending formal worship gatherings. But rather, it was the relatively irreligious (those who attended seldom or never) who reported attending in-person worship and then testing positive for COVID-19 soon after.

Predicted percentage of testing positive for coronavirus disease 2019 between May 2020 and August 2020 across previous worship attendance frequency and by whether someone did not attend in-person worship during lockdowns or attended at least weekly (reported in mid-May 2020).
Discussion and Conclusions
In the late spring of 2020, at the height of government-mandated stay-at-home orders, a small percentage of Americans disregarded protocols and restrictions to attend in-person worship gatherings, some multiple times in a given week. Using panel data that inquired about Americans’ behavior during this time as well as whether they tested positive for COVID-19, we have documented that Americans who attended worship gatherings more frequently, or at all, during the late April or early May of 2020 were more likely to report testing positive for COVID-19 by August. This is after taking into account whether they were frequently wearing masks or attending other gatherings with 10 or more people. However, we also found that this association between attending in-person worship during lockdown and later testing positive for COVID-19 was limited primarily to those who were not previously frequent worship attendees.
How do we interpret this latter finding? Contrary to what we might expect from the 2021 BRS or 2020 CES data showing an association between general worship attendance and COVID-19 infection, it does not seem to be the case that deeply devout Americans disregarded stay-at-home orders, attended worship gatherings frequently during lockdown, and then got infected and tested positive for COVID-19. Rather, our data suggest that some Americans who were relatively disconnected from faith communities (they rarely or never attended) reported attending in-person worship gatherings more frequently during late April or early May 2020, and it was these Americans who later tested positive for COVID-19. This suggests that their reported in-person worship attendance at the height of lockdown restrictions did not reflect their stronger commitment to religious community but that their very attendance may have been an act of defiance or protest against the restrictions. Persons who would have otherwise stayed at home (as they usually did in 2019) suddenly felt compelled to attend in-person worship when they were advised or demanded not to and then were more likely to test positive for coronavirus. Another possibility is that in-person worship would have been among the limited opportunities for even irreligious Americans to actually interact socially at the height of lockdown, though the strength of this explanation is mitigated somewhat by controlling for other kinds of gathering frequency.
Despite the purchase these data provide on understanding how religious participation and stay-at-home orders may have influenced rates of testing positive for COVID-19, there are some limitations that should be acknowledged. The first is sample size and the small number of respondents who ultimately tested positive for COVID-19 by August 2020 (n = 23). Yet the fact that associations remain consistent at the bivariate (Table 1) and multivariate (Tables 2 and 3) levels and regardless of whether in-person worship attendance is measured as an ordinal (Table 2) or binary (Table 3) variable gives us confidence that the findings are robust. In addition, our findings are entirely consistent with what we would expect given community reports published by health officials and the CDC (Hamner et al. 2020; James et al. 2020; Koran 2020) as well as associations documented in other national surveys such as the 2021 BRS (Baylor University 2021) and much larger surveys such as the 2020 CES (Burge 2021). Thus, our sample is not being used to argue for a finding that contradicts where theory and other available evidence would also point.
Another potential limitation is that these are self-reported data, and thus, we cannot take into account whether Americans had already been infected with COVID-19 and were either asymptomatic or undiagnosed. Nevertheless, the analysis allows us to isolate those who had not yet tested positive by mid-May 2020 and see whether they tested positive by August 2020, which still provides a control of who is in the sample and how their positive test status changed. Another limitation is that we cannot eliminate the possibility that respondents who attended in-person worship during the height of lockdown restrictions and later tested positive for COVID-19 did not pick up the virus somewhere else within that three-month span. Yet this is not a damning limitation, as anyone in the sample could have picked up COVID-19 somewhere else during that three-month span, and thus we are still left with a significant net association between in-person worship and later testing positive for COVID-19, even after accounting for other factors that might put Americans at greater risk (e.g., not wearing masks, attending other gatherings, being religiously or politically conservative).
Numerous studies now document how religious belief and behavior were not only influenced by the COVID-19 pandemic but how religion itself shaped Americans’ behavioral responses and interpretations (Baker et al. 2020; Beyerlein, Nirenberg, and Zubrzycki 2021; Gorski and Perry 2022; Hill et al. 2020; Perry et al. 2020, 2021a, 2021b; Smothers et al. 2020). This study adds to this literature that religious participation, particularly during the late spring 2020, when there was rapid spread of the pandemic, is consistently linked with testing positive, particularly for those who were likely attending as a form of protest.
Footnotes
Appendix
Comparison of PDES Wave 1 and 2018 GSS on Key Demographic Variables.

| PDES Wave 1 (2019) |
2018 GSS |
|||||
|---|---|---|---|---|---|---|
| Range | Mean or % | SD | Range | Mean or % | SD | |
| Male | 0–1 | 47% | 0–1 | 46% | ||
| White | 0–1 | 66% | 0–1 | 72% | ||
| Black | 0–1 | 12% | 0–1 | 15% | ||
| Latino | 0–1 | 14% | ||||
| Asian | 0–1 | 3% | ||||
| Other race | 0–1 | 5% | 0–1 | 13% | ||
| Age | 18–90 | 52.8 | 15.9 | 18–89 | 46.6 | 17.7 |
| Married | 0–1 | 52% | 0–1 | 49% | ||
| BA degree or higher | 0–1 | 33% | 0–1 | 31% | ||
| South | 0–1 | 38% | 0–1 | 40% | ||
| Northeast | 0–1 | 17% | 0–1 | 15% | ||
| Midwest | 0–1 | 22% | 0–1 | 21% | ||
| West | 0–1 | 23% | 0–1 | 24% | ||
| Employed full-time | 0–1 | 37% | 0–1 | 50% | ||
| Republican | 0–1 | 28% | 0–1 | 35% | ||
| Democrat | 0–1 | 36.2 | 0–1 | 43% | ||
| Other | 0–1 | 35.9 | 0–1 | 22% | ||
| Born-again or evangelical Protestant | 0–1 | 22% | 0–1 | 23% | ||
Note: GSS = General Social Survey; PDES = Public Discourse and Ethics Survey.
Funding
The authors received no financial support for the research, authorship, and/or publication of this article.
1
Because of nonresponse, the use of online nonprobability surveys has increased in recent years, and certain vendors are better than others (Kennedy et al. 2016). Independent evaluations of several vendors using online panels in comparison with traditional probability panels showed that YouGov “consistently outperformed the others including the probability-based [sample]” (Kennedy et al. 2016; ![]() ).
).
2
Weighted data are used for the analyses. However, analyses run without sampling weights were virtually identical in substantive and statistical significance.
3
Although we are also able to account for in-person worship attendance just before wave 4, the inclusion of this variable is confounding and unhelpful. Because our interest is attendance during the height of stay-at-home orders when COVID-19 cases were surging and Americans had fewer options for social interaction. By mid-August, more venues for social interaction (e.g., work, shopping) had opened up and there would be more places to contract COVID-19. Thus worship attendance would intuitively not be as strongly correlated with testing positive.
4
“Evangelical Protestants” are those respondents who indicated that they were “Protestant” and then on a separate question indicated that they were “born again or evangelical.” This measure is similar to that used by Pew and other polling firms, with the exception that polling firms also constrain this category further by specifying “white born-again Protestants.” Liberal Protestants, in contrast, are those Protestants who indicated they were not “born again or evangelical.” “Other Christians” refers to Mormons and Eastern Orthodox Christians who do not have large enough numbers to be included separately but nonetheless should be included in the analysis. “Other religions” included all non-Christian religious faiths (Jewish, Buddhist, Hindu, Muslim, etc.).
5
The outcomes do not change substantively if we use the Christian nationalism measures from the previous wave 2 (February 2020) or the following wave 4 (August 2020). We include measures from the May 2020 wave because they would be here most likely to confound with COVID-19-related behaviors.
6
Collinearity diagnostics indicated no concerns for multicollinearity issues in the models.