
Abstract
Neighborhood social cohesion is strongly associated with health and well-being, especially among families with children. However, there is a widespread perception in the media, policy circles, and prominent research traditions that neighborhood social cohesion has decreased in recent decades for the United States as a whole and among certain subpopulations. Unfortunately, the empirical evidence for such trends is thin. In this study, we use data on families with children from two studies, the Survey of Income and Program Participation and the Fragile Families and Child Wellbeing Study, to explore trends in neighborhood social cohesion and how individual- and neighborhood-level characteristics pattern disparities in the experience of neighborhood social cohesion. Counter to popular perceptions, our results show increases in neighborhood social cohesion over recent decades, at least for families with children. However, our results reveal persistent disparities in the experience of neighborhood social cohesion by individual and neighborhood characteristics.
Neighborhood social cohesion, the extent of mutual trust and support among neighbors that is fostered by and helps foster interactions, friendships, and exchanges in communities, is a crucial predictor of both adults’ and children’s well-being. Disparate research traditions have documented associations between neighborhood social cohesion and as wide a range of outcomes as adults’ neighborhood satisfaction (Dassopoulos et al. 2012; Dassopoulos and Monnat 2011), mental health (Robinette et al. 2013), self-perceptions of status (Cramm, van Dijk, and Nieboer 2013), and parental practices (Maguire-Jack and Showalter 2016). Other work highlights links between neighborhood social cohesion and prosocial behavior in children (Lenzi et al. 2012) and children’s perceptions of safety (Wang and Fowler 2019). Neighborhood social cohesion also predicts a range of specific health outcomes across the life course, including infant birth weight (Buka et al. 2003), depression in both children and adults (Baranyi et al. 2020; Dawson et al. 2019), stroke risk (Clark et al. 2011; Kim, Park, and Peterson 2013), cardiometabolic risk (Robinette et al. 2018), and stress and cognition during old age (Sharifian et al., 2020). Beyond individuals, neighborhood social cohesion is a core component of community-level measures of collective efficacy and is negatively associated with neighborhood crime and victimization rates (Lee 2000; Mazerolle, Wickes, and McBroom 2010; Sampson, Raudenbush, and Earls 1997).
Although neighborhood social cohesion is a widely studied predictor of various outcomes, fewer studies consider perceptions of neighborhood social cohesion as an outcome of interest in its own right. A classic research tradition examined predictors of living in neighborhoods with high social cohesion and found that its patterning across social groups is unequal and spatially concentrated. These patterns translate into stratified experiences, both at the individual and community levels. For example, more highly educated and wealthier individuals tend to say their communities have high social cohesion, and members of communities with more such people, regardless of these members’ own education or affluence, tend to report that their neighborhoods are high in social cohesion (Campbell and Lee 1992; Guest et al. 2006; Sampson, Morenoff, and Earls 1999; Taylor 1996).
Unfortunately, prior studies do not consider trends in neighborhood social cohesion, and work on its patterning is generally dated. Whether the predictors of neighborhood social cohesion have changed over time is an open question. An even more essential question, given academic, policy, and media emphasis, is whether the prevalence of living in neighborhoods with high social cohesion has changed. There are reasons to suspect the answers to both may be “yes.” In particular, advances in communication technology have made proximity to social ties less important while also reducing the need to maintain close relationships with neighbors (Boessen et al. 2014; Wellman 1979; Wellman et al. 2003; Wellman and Leighton 1979); because cohesion is in part determined by (in addition to its role in determining) community social ties, these changes can be expected to lower neighborhood social cohesion. Similarly, other changes related to leisure activities, time pressures, and demographic shifts have made the physical spaces close to home less central to everyday experiences; these changes could lower neighborhood social cohesion through both direct (lower trust and support among neighbors) and indirect mechanisms (less interaction among neighbors; Putnam 2000). These arguments—that the factors that underpin neighborhood social cohesion are faltering—have become pervasive and are commonly referred to as the “community lost” hypothesis, which posits that neighborhood social cohesion is weaker today than in the past (Boessen et al. 2014; Wellman 1979; Wellman and Leighton 1979). Yet, although the community lost hypothesis is ubiquitous, empirical support for such a decline is thin.
Another limitation of past work on neighborhood social cohesion, even among the more recent studies in this tradition, is that such scholarship often relies on data from single-city studies, most often conducted in just a small number of cities, especially Chicago and Boston (e.g., Cradock et al. 2009; Pabayo et al. 2020; Schmidt et al. 2014). The absence of comparative studies on neighborhood social cohesion is a challenge that raises the question of whether current knowledge about the topic can be generalized beyond large urban areas. Rural or suburban areas—or even urban areas beyond the most commonly studied cities—often have different neighborhood dynamics due to factors like urban spatial organization and its influence on neighbors’ physical and social distance. Lack of attention to these issues represents gaps in the literature, yielding an incomplete portrait of stratification in neighborhood social cohesion and precluding serious engagement with the community lost hypothesis given unequal patterns of geographic growth over recent decades.
Given the pervasiveness of the hypothesis that neighborhood cohesion has declined in recent decades and the lack of empirical evidence about either the predictors of or trends in neighborhood social cohesion across the United States, it is imperative to reevaluate what is known on this topic. In this study, we use nationally representative data to test whether perceptions of neighborhood social cohesion have decreased in the past two decades and examine how individual and neighborhood characteristics pattern perceived neighborhood social cohesion. We draw data from two sources that have complementary strengths in terms of understanding stratification and trends in neighborhood social cohesion. We first draw a series of repeated cross-sections from the Survey of Income and Program Participation, which is nationally representative and provides a dynamic view of trends in neighborhood social cohesion and social group disparities. Our second data source, the Fragile Families and Child Wellbeing Study, is a panel study that emphasizes urban areas; we use these latter data to consider longitudinal changes in experiences of neighborhood social cohesion within individuals and to characterize associations between neighborhood-level characteristics and neighborhood social cohesion. Both data sources focus on families with children, the modal household living arrangement for people in the United States 1 and a group for whom neighborhood social cohesion is particularly important.
Background
Trends in Neighborhood Social Cohesion
How might neighborhood social cohesion have changed in recent decades? Social scientists have long recognized that neighborhoods are unique entities that have the potential to play an outsized role in shaping social relationships (Cornwell and Behler 2015; McPherson, Smith-Lovin, and Cook 2001). In particular, neighbors are exposed to similar contexts (e.g., to crime, schools, and businesses), which can create shared interests and serve as a foundation for social relationships. At the same time, residential sorting contributes to the relative homogeneity of neighborhoods and increases the likelihood of developing relationships with neighbors (Fischer 2003). Furthermore, classic ideas about social networks suggest that propinquity is fundamental to the formation of relationships (Nahemow and Lawton 1975), providing an additional mechanism for strong social connections among neighbors. However, the most prominent thesis in the recent literature on neighborhood cohesion has focused on the idea of “community lost,” arguing that technological advancements, demographic shifts, and sociopolitical changes have worked against the social forces that create relationships among neighbors and eroded neighborhood and community ties (Boessen et al. 2014; Wellman 1979; Wellman and Leighton 1979).
Specifically, recent work argues that technological advancements, in general, and advances in communication technology, in particular, have led to neighborhoods becoming less important for social relationships, thereby decreasing social cohesion among neighbors. One proposed mechanism for these trends is increased access to social ties that are not physically proximate (Hampton and Wellman 2001; Wellman and Leighton 1979). As a result, there has been a shift from densely connected local groups to “networked individualism,” where groups are less bounded by physical space (Guest and Wierzbicki 1999; Rainie and Wellman 2012; Wellman 2002). Likewise, people spend less time in neighborhoods, consumed by commuting for jobs, increased nonlocal educational opportunities, and child care and other activities increasingly taking place outside of the home (Fox et al. 2013; Wellman and Leighton 1979). Proponents of the community lost hypothesis contend the rise of these activities has contributed to declines in neighborhood social cohesion over time. At a more macro level, other proposed contributing factors include urbanization, industrialization, and economic reorganization (Dotson 2017; Wellman 1979; Wellman and Leighton 1979). Simply put, the community lost hypothesis argues that technology and other changes have resulted in people replacing neighborhood ties with physically distant ties, lowering neighborhood social cohesion in the process.
The community lost hypothesis also straddles a broader social science narrative related to growing social isolation. This argument was perhaps most famously expressed by Robert Putnam (2000) in Bowling Alone, although this work is far from the only source of such conjectures. Like the community lost hypothesis, Putnam also points to technological advancements as one of the key contributors to eroding community and neighborhood ties—and his work and the research tradition it spawned repeatedly connect the diminishment of such ties to declines in other aspects of neighborhood social cohesion, such as trust (Putnam 1993). Although he arrives at a conclusion similar to the one made by network scholars that focus on how advancements in digital communication have afforded access to physically distant ties, Putnam also emphasizes a different mechanism: how technology has facilitated individualizing leisure-time activities. For example, instead of spending an evening playing bridge with neighbors, individuals increasingly spend their leisure time alone at home watching television or on the Internet, negatively affecting interactions with neighbors and neighborhood trust and related social goods. Although the mechanism differs, the result is the same: predicted decreases in neighborhood social cohesion over time.
Even critiques of Bowling Alone, which tend to focus on other societal shifts as causal agents, accept its general premise that community investment and social relationships have decreased. In particular, critics suggest that time pressures (from work, child care, and commuting) have increased, arguing that it is a scarcity of time that has led people to retreat from neighborhood ties and social organizations that help facilitate neighborhood social cohesion (Fischer 2005; Roxburgh 2006). Others point to broader shifts in social psychology and a potential increase in the mistrust of others (Raudenbush 2016). Again, the emphasis is on predicted declines—but the evidence for such declines at a national level remains underdeveloped.
To some extent, there is a question of time scale in the community lost hypothesis, and the literature is less than clear about the time frame during which declines in neighborhood social cohesion should be expected. When considering the decline of bridge playing—or the purported demise of bowling in groups—it is clear that authors are considering longer time frames (a nostalgic era, perhaps the 1950s, to the 1990s or beyond), but when considering arguments about the rise of new technologies eroding community cohesion, especially the Internet and related digital communication tools, it is more likely that authors are considering a more recent history. In either case, it is clear that the predicted direction for neighborhood social cohesion is downward, even in recent decades.
A similar body of scholarship debates potential increases in social isolation and declining social networks over the last few decades. For example, McPherson et al. (2006) posit that core discussion networks, those comprising confidants with whom Americans discuss important matters, substantially declined in size from approximately three confidants to two confidants between 1985 and 2004 and that the number of social isolates nearly tripled to become the modal state (the latter is a contested result, as we discuss shortly). They also noted greater losses among nonkin confidantes than kin confidantes, reflecting fewer contacts through voluntary associations and neighborhoods. Like others, McPherson and colleagues suggest that advances in communication technology, specifically the Internet and cell phones, lower the likelihood of having face-to-face interactions with neighbors and have allowed social networks to spread out across geographic space. Again, this body of work offers no reason to suspect that such alleged declines have abated in recent years.
However, the literature on increasing social isolation highlights a few cracks in the firmament of the broader community lost narrative. Specifically, numerous studies have called McPherson et al.’s (2006) findings into question. Fischer (2009) contends that the findings may be an artifact caused by notable anomalies in the 2004 data. Paik and Sanchagrin (2013) uncovered strong interviewer fatigue effects that explain significant variation in the number of people reporting no contacts. And Fischer (2011) documented, across a wide range of measures, that the evidence for growing social isolation—or even the more general loss of community argued in Putnam’s (2000) Bowling Alone—is thin and contradictory. As with arguments about social isolation, numerous critics have raised questions about the community lost hypothesis, arguing that negative views are misplaced and that local communities remain strong (Hampton and Wellman 2018; White and Guest 2003). For example, Hampton and Wellman (2018) recently argued that contemporary unease about communities stems from selective perception of the past, which idealizes a nostalgic, perfect form of community that never was.
Yet in research on trends in informal social participation, Marsden and Srivastava (2012) find a modest decrease in the frequency that people report spending a social evening with neighbors. Specifically, between 1974 and 2008, the percentage of people who reported socializing with neighbors more often than once per month decreased from roughly 44 percent to approximately 31 percent, with most of this decrease occurring between the mid-1970s and early 1990s. Moreover, they find that the percentage of people who never spend an evening with neighbors increased from roughly 20 percent in the 1970s to 30 percent in 2008, again with most of the change occurring between the 1970s and 1990s with only somewhat notable changes thereafter. However, although they find a decrease in interactions with neighbors, they find an increase in contact with kin and also a modest increase in contact with nonneighbor friends. They note this is consistent with the notion that there has been a “network reconfiguration,” where social network ties are increasingly less constrained by proximity and availability and more likely to be chosen.
Despite substantial work on these issues over the past 30 years, reflecting great interest in these topics, there remain two surprisingly open questions in the literature: Has neighborhood social cohesion decreased in recent decades? How is neighborhood social cohesion stratified across individual and neighborhood characteristics?
Stratification in Neighborhood Social Cohesion
What types of people live in neighborhoods with high or low social cohesion? What neighborhood characteristics are associated with perceptions of high or low social cohesion? Here, we briefly review theories about stratification in neighborhood social cohesion, drawing on past studies that consider neighborhood attachment, neighborhood satisfaction, and number of neighborhood ties to inform our expectations. At the individual level, we focus on differences by income-to-poverty ratio, relationship status, race/ethnicity, education, homeownership, and housing assistance receipt. At the neighborhood level, we focus on differences by percentage of residents unemployed, percentage of households rented, percentage of households receiving public assistance, percentage of female-headed households, and median household income.
Past scholarship suggests that social integration and investment are key determinants of neighborhood attachment and relationship development among neighbors and that high levels of integration and investment yield greater social cohesion. This view is often described as the “community of limited liability” model, which emphasizes the role of household characteristics in shaping social and economic investment in neighborhoods and, in turn, neighborhood attachment and relationships among neighbors (Sampson 1988). An alternate but similar viewpoint, the “social integration” model, argues that personal investments in neighborhood quality determine commitment to a neighborhood and that increases in commitment yield greater attachment and stronger relationships among neighbors (Austin and Baba 1990). Of course, these processes can feed back into one another, wherein investments in the neighborhood foster perceptions of cohesion that further incentivize integration and investment and so on. Despite some theoretical clarity on the processes that foster greater neighborhood social cohesion, the mapping of these processes to individual and neighborhood characteristics remains untested.
Drawing on these perspectives, we expect household characteristics that increase the likelihood of neighborhood investment will strengthen neighborhood social cohesion. In particular, research suggests that homeowners have a greater stake in neighborhood quality and invest more in neighborhood relationships than renters (Blum and Kingston 1984; Hipp 2009; Oh 2004). Therefore, we expect homeownership to be associated with greater neighborhood social cohesion, with individuals who own homes or live in neighborhoods with a large fraction of owner-occupied homes more likely to report greater neighborhood social cohesion. Similarly, research suggests that marriage determines neighborhood investment and attachment, a finding attributed to the fact that single or cohabiting households are more likely to view current neighborhoods as a temporary or transitional place (Hipp 2009). Consequently, we expect that married individuals and those living in neighborhoods with a large share of married couples will tend to report greater neighborhood social cohesion. The data we analyze are limited to households with children, so we do not test explicit expectations regarding the presence of children in the household, but it is worth noting that households with children and those living in neighborhoods with large numbers of households with children can be expected to report greater social cohesion through similar mechanisms. Finally, past studies find that younger and older people have more time to invest in neighborhood relationships (Ross and Searle 2019), leading us to expect a U-shaped association between individuals’ ages and living in neighborhoods with high social cohesion.
Although the social integration and community of limited liability perspectives emphasize social investments among neighborhood residents, these perspectives do not fully account for residential sorting. Early studies of residential mobility emphasized the “residential satisfaction perspective,” arguing that personal and lifestyle factors, including neighborhood characteristics like social bonds with neighbors, determined when and where households moved (Bach and Smith 1977; Heaton et al 1979; Landale and Guest 1985; Newman and Duncan 1979; Speare 1974). More recently, the residential mobility literature has drawn attention to the “place stratification” model, which highlights how individual and household characteristics such as race/ethnicity and economic resources restrict access to different neighborhoods (South and Crowder 1997a, 1997b), and the “location attainment” model (Alba and Logan 1992; Logan et al., 1996), which argues that socioeconomic resources provide access to desirable neighborhoods. This vein of research has shown that neighborhood dissatisfaction is less likely to result in residential mobility for black households (South and Deane 1993), that housing market discrimination influences the neighborhood options available to households (Krysan 2008), and that residential moves for poor and low-income households are often unplanned and involuntary, making exhaustive searches challenging (DeLuca, Wood, and Rosenblatt 2019; Desmond, Gershenson, and Kiviat 2015).
However, although the residential mobility and sorting literature often emphasizes neighborhood socioeconomic resources, there is mixed evidence for associations between neighborhood socioeconomic context and neighborhood dynamics (Sharp 2018). On the one hand, some studies show more interactions between neighbors and helping behaviors in more affluent neighborhoods (Guest et al. 2006; Sampson et al. 1999; Taylor 1996); on the other hand, a number of studies show increased neighborly exchange in more impoverished areas (Keene, Bader, and Ailshire 2013; Pattillo-McCoy 1999; Stack 1975). In fact, a competing perspective suggests that poverty and need may facilitate the strongest neighborhood connections. For example, Campbell and Lee (1992) found that individuals with low socioeconomic status tended to have more frequent and intense contact with neighbors, which resulted from the need for support. Similarly, Stack (1975) found that residents of the low-income black community she studied had elastic kinship boundaries, with networks diffused over several kin-based households, fostering resource access as a means of adapting to economic insecurity. There are similarly mixed findings related to race/ethnicity (Abascal and Baldassarri 2015; Hipp 2009; Lee, Campbell, and Miller 1991; Putnam 2007; Woldoff 2002). Given this robust line of research emphasizing the vitality of neighborly experiences in different subpopulations, our analysis aims to clarify these competing perspectives. Therefore, in addition to individual-level measures of economic resources, we examine associations between social cohesion and neighborhood-level measures of unemployment, income, and public assistance receipt.
Data and Methods
We draw data from two sources: the Survey of Income and Program Participation (SIPP) and the Fragile Families and Child Wellbeing Study (FFCWS). The SIPP offers nationally representative data that allow us to explore trends in neighborhood social cohesion; unfortunately, the SIPP does not contain measures of neighborhood-level characteristics. FFCWS addresses this shortcoming. Specifically, FFCWS data allow us to consider how different neighborhood characteristics, measured at the census-tract level, are associated with neighborhood social cohesion. Both data sources focus on households with children, meaning that we miss households that do not have children living in them; however, it is worth noting that over 150 million individuals lived in households with children in each year of the period we study, representing a little more than half of the U.S. population and between 40 percent and 50 percent of all households (calculated by authors from Current Population Survey 2021 and U.S. Census Bureau 2020). We describe each data source in turn.
SIPP
The SIPP, conducted by the U.S. Census Bureau, is fielded as a series of panels. 2 Each panel lasts approximately 4 years and surveys respondents every 4 months over the course of those 4 years. At each survey wave, respondents report on core interview topics like income, assets, labor force participation, and demographic characteristics. Each wave also contains topical modules. The topical modules cover specific areas (e.g., marriage history, work schedule, child care) and differ from wave to wave. The Child Wellbeing Topical Module, which was fielded in the 1996, 2001, 2004, and 2008 panels, 3 asks respondents who have children a series of questions related to neighborhood social cohesion. By extracting responses to the Child Wellbeing Topical Module across SIPP panels, we created a repeated cross-sectional sample with observations in 1997, 2003, 2006, and 2011.
Only respondents who were the designated parent or guardian of a child under the age of 18 completed the Child Wellbeing Topical Module. Consequently, our sample is limited to families with children. Census Bureau researchers impute most missing values in the SIPP (U.S. Census Bureau 2008), and as a result, we lose less than 1 percent of observations to missing data. After restricting the data to be complete on all covariates, our analytic sample consists of 44,394 observations.
FFCWS
FFCWS is a longitudinal study of approximately 5,000 urban births that were sampled between 1998 and 2000 with an oversample of nonmarital births. FFCWS interviewed mothers at the time of the birth of the focal child. Follow-up interviews occurred when the focal child was 1, 3, 5, 9, and 15 years old. At each of the first four waves, FFCWS interviewed both the mother and father of the focal child. The fifth wave (the year 15 survey) only interviewed the child’s primary caregiver, which was the mother in most cases but could be the father or someone else. We use data from mothers only.
FFCWS did not measure items related to neighborhood cohesion in the baseline survey, 1-year follow-up, or 3-year follow-up. Accordingly, we used data from the 5-, 9-, and 15-year follow-ups and the baseline survey for time-constant characteristics. Year 5 data were collected between 2003 and 2006, Year 9 between 2007 and 2010, and Year 15 between 2014 and 2017. The sample size for the FFCWS from Waves 4 through 6 where the primary caregiver is the mother is 9,391 person-years. Of these, 976 person-years are missing data on one or more independent variables. We used listwise deletion methods to handle missing data, resulting in a final sample of 8,177 person-years.
Outcome Variables
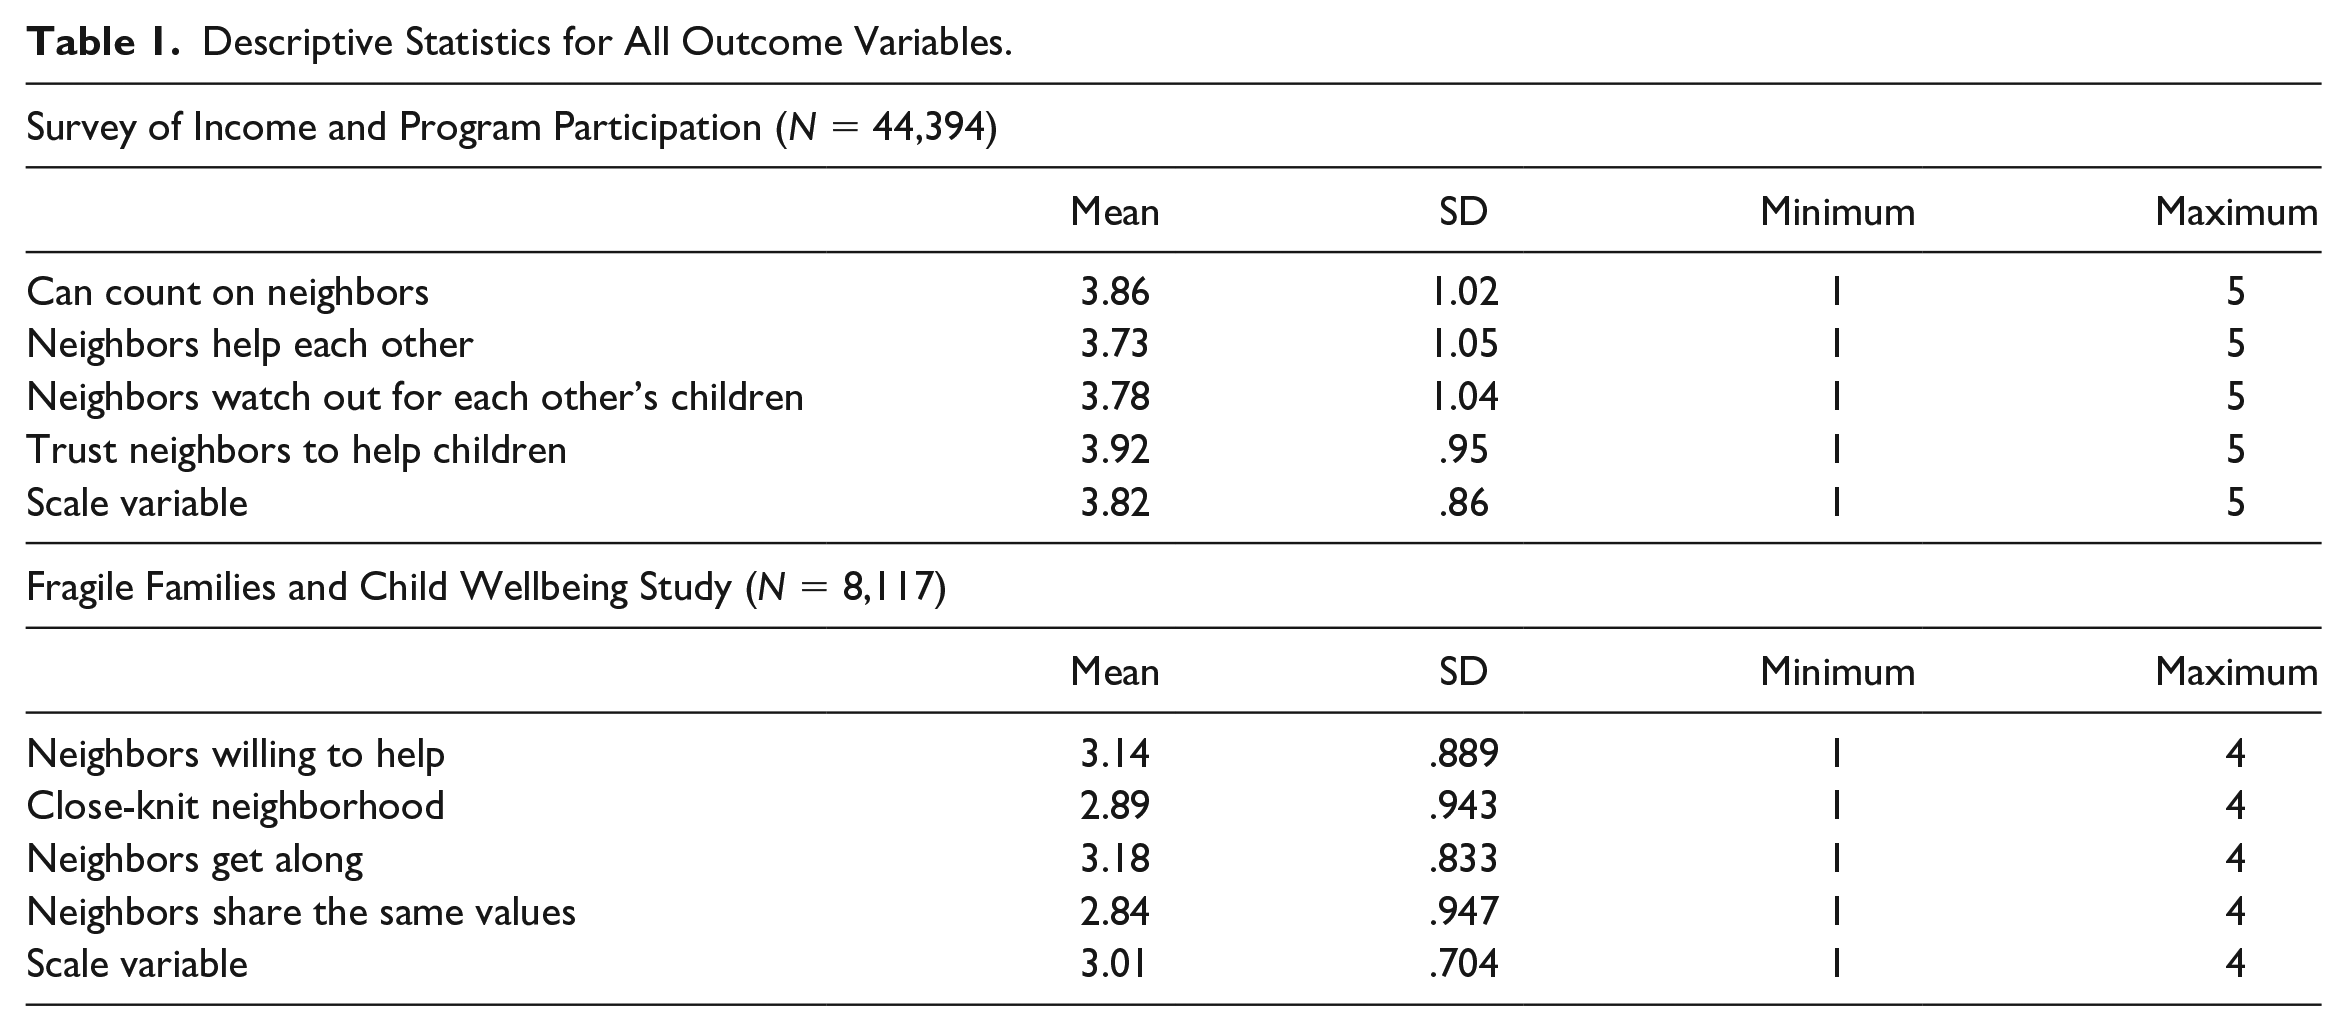
We examined a total of 10 outcome variables with 5 outcome variables drawn from the SIPP and 5 outcome variables drawn from the FFCWS. In the SIPP, the Child Wellbeing Topical Module asked respondents whether they agreed or disagreed with a series of statements related to neighborhood social cohesion. The four statements read:
People in this neighborhood help each other out. 4
We watch out for each other’s children in this neighborhood.
There are people I can count on in this neighborhood.
If my child/children were outside playing and got hurt or scared, there are adults nearby who I trust to help him/her/them.
Respondents could answer they strongly agree, agree, disagree, strongly disagree, or have no opinion for each statement. We code “no opinion” as a middle, neutral response category.
We treat each of these four items as separate outcome variables, modeling them ordinally. We also study a fifth outcome variable measured as a scale equal to the sum of all 4 variables divided by 4, ranging from 1 for those who strongly disagree with all 4 items to 5 for those who strongly agree with all 4 items (Cronbach’s α = .87).
FFCWS included similar questions related to neighborhood social cohesion. The prompt to the questions read: “Now I’m going to read some statements about your neighborhood and the people who live there. For each statement, please tell me if you strongly agree, somewhat agree, somewhat disagree, or strongly disagree.” The four statements were:
People around here are willing to help their neighbors.
This is a close-knit neighborhood.
People in this neighborhood generally don’t get along with each other.
People in this neighborhood do not share the same values.
We coded each of these so that higher values represented greater neighborhood social cohesion (i.e., reverse-coding the final two items so they can be interpreted as agreement with the statement that people in this neighborhood generally get along with each other and share the same values). We treat each of these as distinct outcomes and also combine the variables to create a scale that ranges from 1 to 4, with higher values representing greater social cohesion (Cronbach’s α = .78).
Descriptive statistics for all outcome variables are presented in Table 1.
Descriptive Statistics for All Outcome Variables.
Independent Variables
All of our multivariable analyses include measures of survey year, income-to-poverty ratio, whether the respondent owns or rents his/her home, whether the respondent receives any housing assistance, educational attainment, race/ethnicity, age, and relationship status. The analyses that use SIPP data include a variable for metro status, which is measured as lives in a metro area, nonmetro area, or not identified. Metro areas consist of a core area that contains a substantial population nucleus and the adjacent areas that have a high degree of social and economic integration with the core, whereas nonmetro areas are commonly considered to be rural areas. In effect, the metro versus nonmetro distinction delineates those who live in urban or suburban areas from those who live in rural areas. The small number of observations in the third category (less than 2 percent) could be either metro or nonmetro but were coded as not identified to avoid disclosures and protect respondent anonymity (U.S. Census Bureau 2008). The analyses that use FFCWS data also include census-tract characteristics to measure neighborhood-level attributes. Specifically, we include measures of percentage of residents who are unemployed, percentage of housing units that are rented, percentage of households receiving public assistance, percentage of households led by a single mother, whether the median household income is below the 30th percentile (for the sample), and whether the median household income is above the 70th percentile (for the sample). Descriptive statistics for all independent variables are presented in Table 2.
Descriptive Statistics For All Independent Variables.

Note: For SIPP data, N = 44,394. For FFCWS, N = 8,117 person-years. Standard deviations not provided for dichotomous variables. SIPP = Survey of Income and Program Participation; FFCWS = Fragile Families and Child Wellbeing Study.
The SIPP and FFCWS data differ in notable ways and reflect differences in study design. Specifically, whereas the SIPP was designed to be nationally representative, FFCWS samples women who had just given birth in urban areas and oversampled unmarried mothers. Consequently, the FFCWS sample has a lower average income-to-poverty ratio, younger average age, 5 lower rate of homeownership, lower rate of being married, higher rate of housing assistance receipt, and a larger proportion of racial and ethnic minority respondents.
Analytic Strategy
Our analytic strategy is straightforward. To understand time trends and social group disparities in neighborhood social cohesion, we estimate a series of multivariable regression models. For each of the eight ordinal outcomes, we estimate ordinal logistic regression models. For the two scale outcome variables, we estimate ordinary least sqaures regression models. We include all independent variables in each model.
For analyses with SIPP data, we use survey weights to adjust estimates to be nationally representative. For analyses with FFCWS data, we use hierarchical models to account for repeat observations across waves within the same families. For the FFCWS sample, national weights are available only for respondents from 16 of the 20 cities included in the baseline sample (Reichman et al. 2001). As a result, only 5,962 of the 8,117 observations in our sample have a national sample weight. To preserve the entire FFCWS sample, we do not use weights for the FFCWS analysis.
Findings
Figure 1 shows unadjusted descriptive trends for each individual neighborhood social cohesion variable from the SIPP. The two outcomes related to counting on neighbors and trusting neighbors to help a scared or injured child were stable over time: Roughly one in four respondents strongly agreed with these statements at all time points. The two outcomes measuring the extent to which neighbors help each other out and the extent to which neighbors watch out for each other’s children showed increases over time. For example, the percentage of respondents strongly agreeing that neighbors help each other out increased from 18 percent in 1997 to 23 percent in 2011. None of the measures showed decreases, the key prediction of the community lost hypothesis.

Unadjusted trends in neighborhood social cohesion from the Survey of Income and Program Participation data.
Table 3 presents estimates from multivariable regression models for each of the five outcomes from the SIPP. To ease interpretation, we present the findings in terms of predicted probabilities for each of the first four models in Figures 2 and 3. Figure 2 shows trends in the predicted probability of reporting strong neighborhood social cohesion for each of the four items (i.e., strongly agreeing with each statement about neighbors). There was little change over time in the likelihood of respondents strongly agreeing that there are neighbors they can count on or strongly agreeing that there are neighbors who would help a scared or hurt child. However, like the unadjusted trends, there were increases in the likelihood of strongly agreeing that neighbors help each other out and that neighbors watch out for each other’s children. Similarly, predicted results for the scale variable that combines all four items (not shown in Figure 2) indicate there was an increase in reported neighborhood social cohesion over time. Overall, in contrast to the community lost hypothesis, the time trends were relatively stable, and to the extent that there were changes, the changes were toward reporting increased neighborhood social cohesion.
Multivariable Regression Models of Neighborhood Social Cohesion with Data from the SIPP.

Note: N = 44,394. Estimates presented as beta coefficients. Standard errors are presented in parentheses. Estimates for individual outcomes are from ordered logistic regression models and an ordinary least squares regression model for the neighborhood scale outcome. Age and Age2 are divided by 10. SIPP = Survey of Income and Program Participation.
p < .1. *p < .05. **p < .01. ***p < .001.

Adjusted trends in neighborhood social cohesion from the Survey of Income and Program Participation.

Predicted probabilities of neighborhood social cohesion by sociodemographic characteristics from the Survey of Income and Program Participation.
Figure 3 presents estimates in terms of predicted probabilities for the other categorical variables estimated in the multivariable regression models presented in Table 3 for the count on neighbors and neighbors help each other outcomes. For parsimony, we present corresponding figures for the watch children and help injured child outcomes in the Appendix. The estimates in Figure 3 reveal no differences by the receipt of housing assistance for either outcome, but they show large differences between owners and renters not receiving housing assistance, with owners reporting much greater levels of neighborhood social cohesion. Results for income paint a more complex picture, suggesting that differences in reported neighborhood social cohesion are concentrated among those at the highest income levels. Specifically, those with income-to-poverty ratios greater than 3 (i.e., the more affluent) reported higher levels of neighborhood social cohesion for all of the four items relative to poor families. However, the differences between families with income-to-poverty ratios between 1 and 3 were not statistically significant relative to poor families. For example, families with incomes that were 2 times the federal poverty line did not report higher levels of neighborhood social cohesion than families with incomes below the federal poverty line.
Additionally, married families reported higher levels of neighborhood social cohesion than nonmarried families, non-Hispanic white families reported higher levels of neighborhood social cohesion than other race/ethnicities, families where the parent/guardian had at least a college education reported higher levels of neighborhood social cohesion than families where the parent/guardian had lower levels of education, and those in nonmetro areas reported higher levels of neighborhood social cohesion than those in metro areas. Finally, the relationship between age and each outcome was concave, although not markedly so (Figure 4). Reports of strong neighborhood social cohesion increased throughout the 20s and 30s before plateauing in the 40s and decreasing slightly in older ages.

Predicted probabilities of neighborhood social cohesion by age from the Survey of Income and Program Participation.
Figure 5 shows the unadjusted trends in each of the five FFCWS outcomes over time. For each of the four individual items, the percentage of respondents who strongly agree with the statement (i.e., experienced high neighborhood social cohesion) increased between Wave 4 and Wave 6: from 36 percent to 46 percent for “People around here are willing to help their neighbors”; from 26 percent to 33 percent for “This is a close-knit neighborhood”; from 29 percent to 56 percent for “People in this neighborhood generally get along with each other”; and from 21 percent to 39 percent for “People in this neighborhood share the same values.” The average value on the social cohesion scale also increased from 2.93 to 3.11. Overall, as with the SIPP data, these results indicate trends toward increased perceptions of neighborhood social cohesion over time.

Unadjusted trends in neighborhood social cohesion with data from the Fragile Families and Child Wellbeing Study.
Table 4 presents results from the multivariable regression models for the five FFCWS outcomes. In terms of the individual covariates, the most consistent patterns are that higher incomes and owning a home are associated with a higher probability of having positive perceptions of neighborhood social cohesion, whereas living in public housing has the reverse association. For two of the outcomes (neighbors willing to help and close-knit neighborhood), income benefits were limited to those with income-to-poverty ratios greater than 2; but for the other outcomes, the associations were more linear: Relative to poor families, families with income-to-poverty ratios greater than 1 reported greater levels of neighbors getting along and sharing the same values. We also find that relative to non-Hispanic white individuals, other race/ethnicities report experiencing lower levels of neighborhood social cohesion for four of the five outcomes, whereas non-Hispanic black individuals report higher levels of neighborhood social cohesion for two outcomes (close-knit neighborhood and neighbors get along) but no difference for the other three outcomes. Additionally, we find that relative to high school graduates, college graduates experience higher levels of neighborhood social cohesion for three of five outcomes (neighbors willing to help, neighbors share same values, and neighborhood scale).
Multivariable Regression Models of Neighborhood Social Cohesion with Data from the Fragile Families and Child Wellbeing Study.

Note: N = 8,117 person-years. Estimates presented as beta coefficients. Standard errors are presented in parentheses. Estimates for individual outcomes are from ordered logistic regression models and an ordinary least sqaures regression model for the neighborhood scale outcome.
p < .1. *p < .05. **p < .01. ***p < .001.
For the neighborhood characteristics, we found that the percentage of residents who are unemployed, the percentage of housing units that are rented, and the percentage of households receiving public assistance were consistently associated with a lower likelihood of positive perceptions of neighborhood social cohesion. For ease of interpretation, Figure 6 presents the results for the neighborhood characteristics in terms of predicted probabilities for neighbors willing to help and neighbors get along outcomes, while corresponding figures are in the Appendix.

Predicted probabilities of neighborhood social cohesion by neighborhood characteristics from the Fragile Families and Child Wellbeing Study.
We see from Figure 6 that as the percentage of residents in the respondent’s census tract that are unemployed increases from 0 percent to 25 percent, the percentage of respondents that strongly agree with statements that their neighbors help each other out and get along with each other drops 6 percentage points. As the percentage of households receiving public assistance in the respondent’s census tract increases from 0 percent to 30 percent, the percentage of respondents strongly agreeing with the aforementioned outcomes falls between 4 and 8 percentage points. Finally, as the percentage of housing units that are rented in the respondent’s census tract increases from 0 percent to 60 percent, the percentage of respondents strongly agreeing with these two outcomes drops 6 to 9 percentage points. In sum, these findings indicate that there is a strong association between these neighborhood characteristics and perceptions of neighborhood social cohesion. However, we do not find statistically significant associations between percentage female-headed households or where the neighborhood median income falls on the income distribution.
Discussion
In the social sciences and in popular culture, there has been a growing concern about weakening relationships among neighbors, which is part of a broader cultural narrative related to worries about growing social isolation (Putnam 2000). A broad narrative has settled in across the social sciences and in the public forum—the idea of “community lost”—but empirical evidence for such a trend is scarce (Fischer 2011). Indeed, even the timeline for such a loss is uncertain: Putnam’s work primarily dealt with losses over generations to the 1990s, other prominent debates about increased isolation focused on the millennial period (McPherson et al. 2006), and still other opinions hold that such losses are ongoing. Many studies cite technological advancements, particularly advancements in digital communication that provide access to physically distant social ties and minimize the need for physically nearby social ties, as a key social change that might have disrupted neighborhood social cohesion (Wellman et al. 2003). Meanwhile, critics argue that contemporary unease about communities stems from selective perception of the past.
Research on temporal changes in neighborhood social cohesion that could adjudicate these disputes is needed, especially work that focuses on the contemporary period wherein the Internet became a dominant communication medium given that other scholarship examines the longer and somewhat porously defined period highlighted in the social capital literature (Fischer 2011). There is also a lack of clarity surrounding demographic and socioeconomic patterns in neighborhood cohesion; for example, there are competing perspectives that expect directly opposing patterns regarding the relationship between socioeconomic status and cohesion (South and Crowder 1997a, 1997b; Stack 1975). To address these limitations and gaps in the prior literature, our analysis uses two data sets, the nationally representative Survey of Income and Program Participation and the urban-focused Fragile Families and Child Wellbeing Study, to explore over time change in neighborhood social cohesion and to characterize associations between individual- and neighborhood-level characteristics and neighborhood social cohesion.
The results of our analysis provide no evidence that neighborhood social cohesion has declined in recent decades. Rather, our results from both data sets show increases in neighborhood social cohesion and suggest that concerns related to deteriorating neighborhood social cohesion are unwarranted. That is, this novel empirical test of the community lost hypothesis is more consistent with an interpretation that “community lost” is a misplaced concern, at least when considering the United States as a whole. Such a finding adds to the growing body of literature refuting narratives of increased social isolation (e.g., Paik and Sanchagrin 2013) or declining social capital (e.g., Fischer 2011).
Technological advancements have undeniably reconfigured social networks by lessening the need for physical proximity and providing access to physically distant ties; however, we speculate that these changes have been counteracted by three important social forces that have allowed neighborhood social cohesion to endure. First, many forms of assistance that social ties are able to provide depend on physical proximity. For example, although a close friend who lives across the country might provide emotional support via the phone or financial support via a digital fund transfer, that same friend is unable to help with routine assistance like yardwork, watching pets, or an errand—a neighbor, however, can provide such assistance, and these types of exchanges foster social cohesion. Second, many social issues and everyday interests and concerns are place-based—quality of schools, exposure to crime, problems with traffic or noise. These social issues remain a potential foundation for relationships among neighbors. Third, residential sorting—the tendency of people to live in neighborhoods and communities with people who share similar beliefs and a similar socioeconomic position—facilitates relationships among neighbors and has increased in recent decades (Fischer 2003). It is possible that increases in residential sorting have offset any potential declines created by technological changes. It is worth keeping in mind that the data we examine pertain only to families with children, however, and that there is the possibility that residential sorting on having children in the household may in part explain our findings of no perceptible declines.
Although our analysis of Fragile Families data documents a sizable increase in neighborhood social cohesion, we are unable to offer definitive conclusions about the source of this increase. One potential explanation is attrition—that the respondents lost over time had lower levels of neighborhood social cohesion. However, this does not appear to be the case: We find no difference in neighborhood social cohesion at Year 5 for those who attrit and those who remain in the sample. Another alternative explanation is that these trends may reflect a life course process (e.g., as children age or having older children in the household), not a true period increase among the types of families that FFCWS samples. Research that carefully considers this cohort-period problem is needed
Moreover, although our findings across both data sets are not consistent with the community lost thesis and do not show a trend toward decreases in neighborhood social cohesion, our results highlight notable differences in neighborhood social cohesion by individual- and neighborhood-level characteristics. In general, our findings are consistent with research on neighborhood attachment and neighborhood satisfaction that show that social integration and investment influence social cohesion. We also find that renters report lower levels of neighborhood social cohesion than owners, that reported neighborhood social cohesion is greatest for high-income families, and that reported neighborhood social cohesion decreases as neighborhood disadvantage increases, where neighborhood disadvantage is measured as the percentage of households unemployed or the percentage of households receiving public assistance. Our results also show that those living in nonmetro areas perceived higher levels of neighborhood social cohesion, highlighting the need for research that considers neighborhood social cohesion in a range of settings outside of urban areas. These results comprise an important step toward clarifying the competing perspectives about how socioeconomic status predicts neighborhood cohesion. Given that neighborhood social cohesion is positively associated with health and well-being (Baranyi et al. 2020; Buka et al. 2003; Clark et al. 2011; Dawson et al. 2019; Kim et al. 2013; Robinette et al. 2018; Sharifian et al. 2020), these disparities are distressing.
Although our findings shed light on trends in neighborhood social cohesion and reveal disparities in neighborhood social cohesion across social groups and by neighborhood characteristics, data limitations temper our conclusions. First, although we use a range of outcome variables related to neighborhood social cohesion from two different data sources, we lack other measures of neighborly activity such as exchanges of assistance among neighbors, number of neighbors who are close social ties, or time spent visiting with neighbors. It is possible that although neighborhood social cohesion has not declined in recent decades, other forms of neighboring have.
Second, both of our data sources are limited to families with children. Consequently, the extent to which our findings are generalizable to other family types is unclear. Households without children may be better positioned to replace physically proximate ties with distant ties, and research on households without children is needed; in particular, scholarship would benefit from greater attention to issues of neighborhood social cohesion for older adults, who, like children, seem to exhibit especially strong associations between neighborhood social cohesion and well-being in qualitative studies of community-dwelling individuals who frequent community amenities (Torres 2019). Additionally, neighborhood social cohesion is a neighborhood property, is not exclusively experienced by households with children, and may in fact be perceived differently by households with children than those without them—for instance, households with children may view a neighborhood bar as a detriment to cohesion, whereas some households without children may view it as a beneficial gathering place. How to think about differential experiences and perceptions of neighborhood social cohesion, how such perceptions map onto family and life course attributes, and related theoretical issues deserve greater attention in subsequent work. Because our data are limited to households with children, we are unable to capture the extent to which neighborhood social cohesion dynamics are driven by changes in the composition of households with children. Our sociodemographic results suggest that the types of households that are becoming more prevalent among households with children tend to perceive lower cohesion, such as members of racial and ethnic minorities, which would run counter to an explanation that our results are driven by changes in the composition of households with children, but this assertion cannot be fully assessed without data on households without children. Research that evaluates neighborhood-level measures of family composition (e.g., proportion of households with children) is needed.
Third, we were able to consider trends only from 1997 forward. Although our findings show either stability or increases in neighborhood social cohesion since 1997, we were unable to consider how neighborhood social cohesion may have changed in earlier decades. Despite these limitations, the two data sources afford clear benefits for studying neighborhood social cohesion. Namely, the combination of nationally representative data and panel data allow us to examine changes across all sorts of families throughout the entire country and to characterize associations between neighborhood social cohesion and key predictors during a time where Internet use expanded vastly (Dimaggio and Garip 2011) and that also saw substantial social changes such as a sharp increase in income segregation (Reardon et al 2018) and a notable uptick in political partisanship (Baldassarri and Gelman 2008). Fourth, our findings are descriptive, and it is important to consider unobserved variables that may correlate with neighborhood social cohesion. For example, we are unable to include a neighborhood-level measure of instability in our regression models. It is likely that some of the observed association between neighborhood socioeconomic resources and neighborhood social cohesion is attributable to neighborhood instability. Although our findings document important disparities by individual- and neighborhood-level characteristics, these findings are not causal.
Finally, although our results show stability or even potentially modest increases in neighborhood social cohesion over time, one question that is unclear is the extent to which people can be characterized as having strong neighborhood social cohesion. On the one hand, the modal response across all outcomes for both data sources is “agree,” and a clear majority responded either “agree” or “strongly agree,” meaning that on average, people report mutual trust and support with their neighbors. On the other hand, a sizable portion of respondents report “disagree” or “strongly disagree” for each outcome. For example, in the SIPP, about 15 percent of respondents disagreed or strongly disagreed that neighbors help each other out or that they can count on neighbors. Respondents who were racial and ethnic minorities, renters, not married, and had incomes below the poverty line were more likely to report low levels of neighborhood social cohesion. Although neighborhood social cohesion has not deteriorated in recent decades, inequalities in neighborhood social cohesion remain.
Research that considers temporal changes in other neighboring activities, especially as it relates to differences in economic resources, is needed. Although we find that economic disadvantage is associated with lower reported levels of neighborhood social cohesion, it may be the case that economic disadvantages are associated with increases in other forms of neighboring such as frequency of contact with neighbors. Similarly, research on past studies have considered how the racial and ethnic composition of neighborhoods shape community social ties, norms, and attitudes, producing conflicting results (Abascal and Baldassarri 2015; Hipp 2009; Legewie and Schaeffer 2016; Putnam 2007; van der Meer and Tolsma 2014; Wickes et al. 2013, 2014). Research that evaluates associations between neighborhood-level measures of race and ethnicity and neighborhood social cohesion is needed.
Conclusions
This study addresses a significant gap in the social connectedness literature because widespread postulating about declining neighborhood social cohesion has not drawn on nationally representative data or considered trends. Contrary to popular expectations, we find that neighborhood social cohesion in the United States has remained stable and shown increases in recent decades. However, these qualitatively positive trends should not obscure persistent inequalities in neighborhood social cohesion. We uncovered worrisome levels of perceived neighborhood social cohesion for some respondents, especially those who were racial and ethnic minorities, renters, not married, had incomes below the poverty line, or lived in disadvantaged neighborhoods. Contrary to the community lost hypothesis, neighborhood social cohesion may be improving overall, but concerns about the many remaining in communities being lost are not misplaced.
Footnotes
Appendix
Acknowledgements
We acknowledge assistance provided by the Population Research Institute at Penn State University, which is supported by an infrastructure grant by the Eunice Kennedy Shriver National Institute of Child Health and Human Development (P2CHD041025).
1
The share of households with children has declined over time, driven by the staggering rise of one-person households from 13 percent in 1960 to 23 percent, 26 percent, 27 percent, and 28 percent in 1980, 2000, 2010, and 2020, respectively (![]() ). Despite this, the largest number of people still live in households with children, and such households have represented about a third of all household types since 2000.
). Despite this, the largest number of people still live in households with children, and such households have represented about a third of all household types since 2000.
2
The Census Bureau redesigned the Survey of Income and Program Participation (SIPP) beginning with the 2014 panel. Unfortunately, the items related to neighborhood social cohesion were not included in the redesigned SIPP panels after 2014.
3
The 1993 SIPP panel included the same series of questions related to neighborhood social cohesion. However, the response options for each category were different from later panels. As a result, we exclude these data.
4
If respondents lived in a rural area, “neighborhood” was replaced with “community” in each statement.
5
Given the narrower range of ages in the Fragile Families and Child Wellbeing Study (FFCWS) sample, we do not include a quadratic term for age in analyses with FFCWS data.