
Abstract
The onset of the coronavirus disease 2019 (COVID-19) pandemic had far-reaching economic and social consequences, affecting economic well-being, health, mobility, relationships, and daily routines. What effect did the COVID-19 pandemic have on neighborhood social cohesion? Drawing on data from the National Survey of Children’s Health, the authors examine trends in neighborhood social cohesion as reported by caregivers of U.S. children from 2016 to 2021. Despite the substantial changes spurred by the COVID-19 pandemic, the authors find that the pandemic did not lead to a significant change in perceived neighborhood social cohesion. These findings reveal the durability of perceived neighborhood social cohesion, showing that it appears to be unaffected even by sizable changes in social and economic contexts. Moreover, the findings provide additional evidence of disparities in perceived neighborhood social cohesion across social groups and contribute to ongoing debates related to potential declines in neighborhood relationships.
Neighborhood social cohesion, defined as the extent of mutual trust and support among neighbors, is negatively associated with parental stress, child neglect, and adolescent depression (Dawson et al. 2019; Maguire-Jack and Showalter 2016) and positively associated with child and adolescent well-being and self-esteem, prosocial behaviors, and participation in physical activity (Cradock et al. 2009; Lenzi et al. 2012; Wang and Fowler 2019). Although a large body of research explores the determinants and consequences of cross-sectional differences in neighborhood social cohesion, research on changes in neighborhood social cohesion during the coronavirus disease 2019 (COVID-19) pandemic is limited. Studying trends in neighborhood social cohesion during the pandemic offers insights into how sensitive neighborhood social cohesion is to broader contexts and also updates research on the putative decline in neighborhood social cohesion in the United States. Specifically, recent research (Campbell et al. 2022) has shown that perceived neighborhood social cohesion levels for families with children were largely steady in the years leading up to the COVID-19 pandemic, but it is unknown if this trend has continued since the onset of the COVID-19 pandemic.
The COVID-19 pandemic caused widespread disruption to everyday life and normal routines for families with children. For example, remote learning became commonplace for many schools (Donohue and Miller 2020), the number of people working from home increased substantially (Brynjolfsson et al. 2020), public transit became more limited (Liu, Miller, and Scheff 2020), and unemployment increased sharply (Smith, Edwards, and Duong 2021). People spent more time at home and in their neighborhoods (Huang et al. 2022) but did so under unusual circumstances. Drawing on past findings and theories related to neighborhood social cohesion, we first consider how the significant changes spurred by the COVID-19 pandemic may have shaped trends in neighborhood social cohesion among families with children before discussing the methods and findings of our study.
Research has often emphasized access to physically distant social ties as a potential deterrent to high levels of neighborhood social cohesion. In particular, there is a long tradition of researchers arguing that advances in transportation and telecommunication have provided greater access to physically distant social ties, resulting in declines in neighborhood social cohesion (Hampton and Wellman 2018; Putnam 2000). Although evidence of such declines is thin (Campbell et al. 2022), digital communication assumed an unprecedent role during the COVID-19 pandemic and was used to replace many interactions that had previously taken place face to face (Nguyen et al. 2020). To the extent that increased use of digital communication during the COVID-19 pandemic displaced and reduced in-person interactions among neighbors, we should expect neighborhood social cohesion among families with children to have declined during the pandemic.
Similarly, research on neighborhood social cohesion frequently highlights social integration and investment as important factors shaping neighborhood attachment and relationships among neighbors, and in turn, neighborhood social cohesion. A key determinant of integration and investment is neighborhood tenure, with those who have lived longer in a given neighborhood reporting greater levels of neighborhood social cohesion. Data on mail forwarding requests to the U.S. Postal Service show that during the COVID-19 pandemic, residential mobility increased, particularly in large cities (Kolko, Badger, and Bui 2021), breaking with a decades-long trend of declining residential mobility (Frost 2020). Moreover, some studies suggest that attempts to minimize the spread of COVID-19 through social distancing led to increases in social isolation (Ernst et al. 2022) and fewer opportunities for interaction among neighbors. There is evidence that, at least early in the pandemic, social distancing was particularly commonplace among adolescents (Oosterhoff et al. 2020). However, other studies argue that the pandemic may have increased reliance on geographically proximal social ties, because of the loss of connection with geographically distant friends and relatives (Ottoni, Winters, and Sims-Gould 2022) and that some households actually increased interactions with neighbors as a result of the pandemic (Finlay et al. 2022). Taken together, these early findings lead to conflicting expectations about neighborhood social cohesion during the COVID-19 pandemic.
Additionally, past research suggests that an individual’s relationship with their neighbors is a function of time constraints (Campbell and Lee 1992). Specifically, individuals have a finite amount of time to dedicate to work, family, and other obligations, including socializing with neighbors or providing assistance to a neighbor by helping with a chore or errand. Time-use diary research shows that parents were stretched thin during the COVID-19 pandemic (Augustine and Prickett 2022), which may have resulted in less time for neighborhood activities; however, there is some evidence that parents increasingly turned to neighbors to form “learning pods”: small groups of children supervised by parents or hired instructors during periods of school closure (Jochim and Poon 2022; Lee, Quadlin, and Ambriz 2023). Again, these results offer mixed support for anticipating an increase or decrease in neighborhood social cohesion.
Finally, research on neighborhood social cohesion has produced conflicting findings related to the salience of socioeconomic resources. Several studies have documented prevalent mutual support among neighbors in poor and low-income neighborhoods (Patillo-McCoy 1999; Stack 1975), arguing that individuals’ need for resources drives deeper relationships among neighbors. However, other studies have found that interactions among neighbors are more common in affluent neighborhoods (Guest et al. 2006; Sampson, Morenoff, and Earls 1999) and that household and neighborhood disadvantage are associated with lower neighborhood social cohesion (Campbell et al. 2022). Although some measures of economic hardship increased for families with children during the COVID-19 pandemic; for example, a study of families in Ohio showed that nearly half reported decreases in monthly income in the early months of the pandemic (Singletary et al. 2022), the relevance of this trend to changes in neighborhood social cohesion remains unclear.
We use data from the National Survey of Children’s Health (NSCH) to examine trends in neighborhood social cohesion among U.S. families with children from 2016 to 2021, documenting how neighborhood social cohesion changed during the pandemic. To the extent that neighborhood social cohesion improves parent and child well-being and mental health (Dawson et al. 2019; Lenzi et al. 2012; Maguire-Jack and Showalter 2016; Wang and Fowler 2019), the benefits offered by high levels of neighborhood social cohesion would be particularly valuable during the stresses caused by the COVID-19 pandemic, which makes understanding neighborhood social cohesion during this time frame particularly important. By examining trends in neighborhood social cohesion during the COVID-19 pandemic and the preceding years, our research helps determine whether neighborhood social cohesion is robust to significant societal changes, and updates recent research on trends in neighborhood social cohesion.
Data
We draw data from the NSCH, an annual household survey that is funded and directed by the Health Resources and Administration’s Maternal and Child Health Bureau and fielded by the U.S. Census Bureau. The NSCH sample consists of U.S. households with at least one child between the ages of 0 and 17 years. If multiple children live in the home, one child is randomly selected to be the subject of a detailed topical questionnaire about the child’s health, their primary caregivers, and the family’s social and economic circumstances, including neighborhood characteristics. The survey, which is available in English and Spanish, is completed by a parent or caregiver knowledgeable about the sample child’s health. We limit the sample to cases with complete data on all covariates. Our final analytic sample size is 225,180.
Measures
Neighborhood Social Cohesion
As part of the NSCH, parents or caregivers were asked the extent to which they agree or disagree with the following statements:
People in this neighborhood help each other out.
We watch out for each other’s children in this neighborhood.
This child is safe in our neighborhood.
When we encounter difficulties, we know where to get help in our community.
For each statement, the parent or caregiver could respond that they “definitely agree,” “somewhat agree,” “somewhat disagree,” or “definitely disagree.” To capture neighborhood social cohesion, we treat each of these statements as a separate outcome variable and also combine the four variables into a scale (weighted Cronbach’s α = .82; Jann 2004).
Previous studies have used similar items to construct a neighborhood social cohesion scale, but there are differences across surveys. For example, the Survey of Income and Program Participation has a four-item scale that is similar to the items found in the NSCH (Campbell et al. 2022), while the Project on Human Development in Chicago Neighborhoods (five-item scale) and the Health and Retirement Study (four-item scale) include items about trust and getting along with neighbors (Kim, Park, and Peterson 2013; Sampson, Raudenbush, and Earls 1997). The differences between the NSCH and surveys like the Health and Retirement Study (e.g., greater focus on items relevant to parents and caregivers) reflect, in part, differences in the population of interest.
Survey Year
Our focal independent variable is survey year, which allows us to examine over time changes in neighborhood social cohesion. The NSCH was fielded annually between 2016 and 2021. The 2016, 2017, 2018, and 2019 surveys provide measures of neighborhood social cohesion prior to the COVID-19 pandemic. The 2020 survey, fielded between late July 2020 and early January 2021, and the 2021 survey, fielded between late June 2021 and early January 2022, provide data on neighborhood social cohesion during the COVID-19 pandemic. Although both the 2020 and 2021 surveys measure neighborhood social cohesion during the COVID-19 pandemic, they also provide observations before and after the widespread availability of COVID-19 vaccines for adults in the United States. We treat year as a categorical variable, with 2016 serving as the reference year.
Household, Neighborhood, Caregiver, and Child Characteristics
We include several control variables in our analyses. At the household level, we include a measure of income-to-poverty ratio (0 percent to 99 percent, 100 percent to 199 percent, 200 percent to 400 percent, and >400 percent of the federal poverty line), a dummy variable for receipt of public cash assistance, and a measure of family structure (two-parent family, single mother family, or any other). At the neighborhood level, we construct two scale variables that sum the caregiver’s responses to yes-or-no questions about neighborhood amenities (sidewalks or walking paths, park or playground, recreation or community center, and library or bookmobile; weighted Cronbach’s α = .72) and neighborhood problems (litter or garbage on street or sidewalk, poorly kept or rundown houses, and vandalism, such as broken windows or graffiti; weighted Cronbach’s α = .66). At the caregiver level, we include a dummy variable for whether any caregivers were born outside of the United States and a variable that captures the highest educational attainment of either caregiver (less than high school, high school or GED, some college or technical school, college degree or higher). At the child level, we include measures of age, gender, and race and ethnicity (non-Hispanic White, non-Hispanic Black, Hispanic of any race, Asian American, or any other race/ethnicity). Table 1 presents descriptive statistics for the independent variables used in the analysis.
Descriptive Statistics.
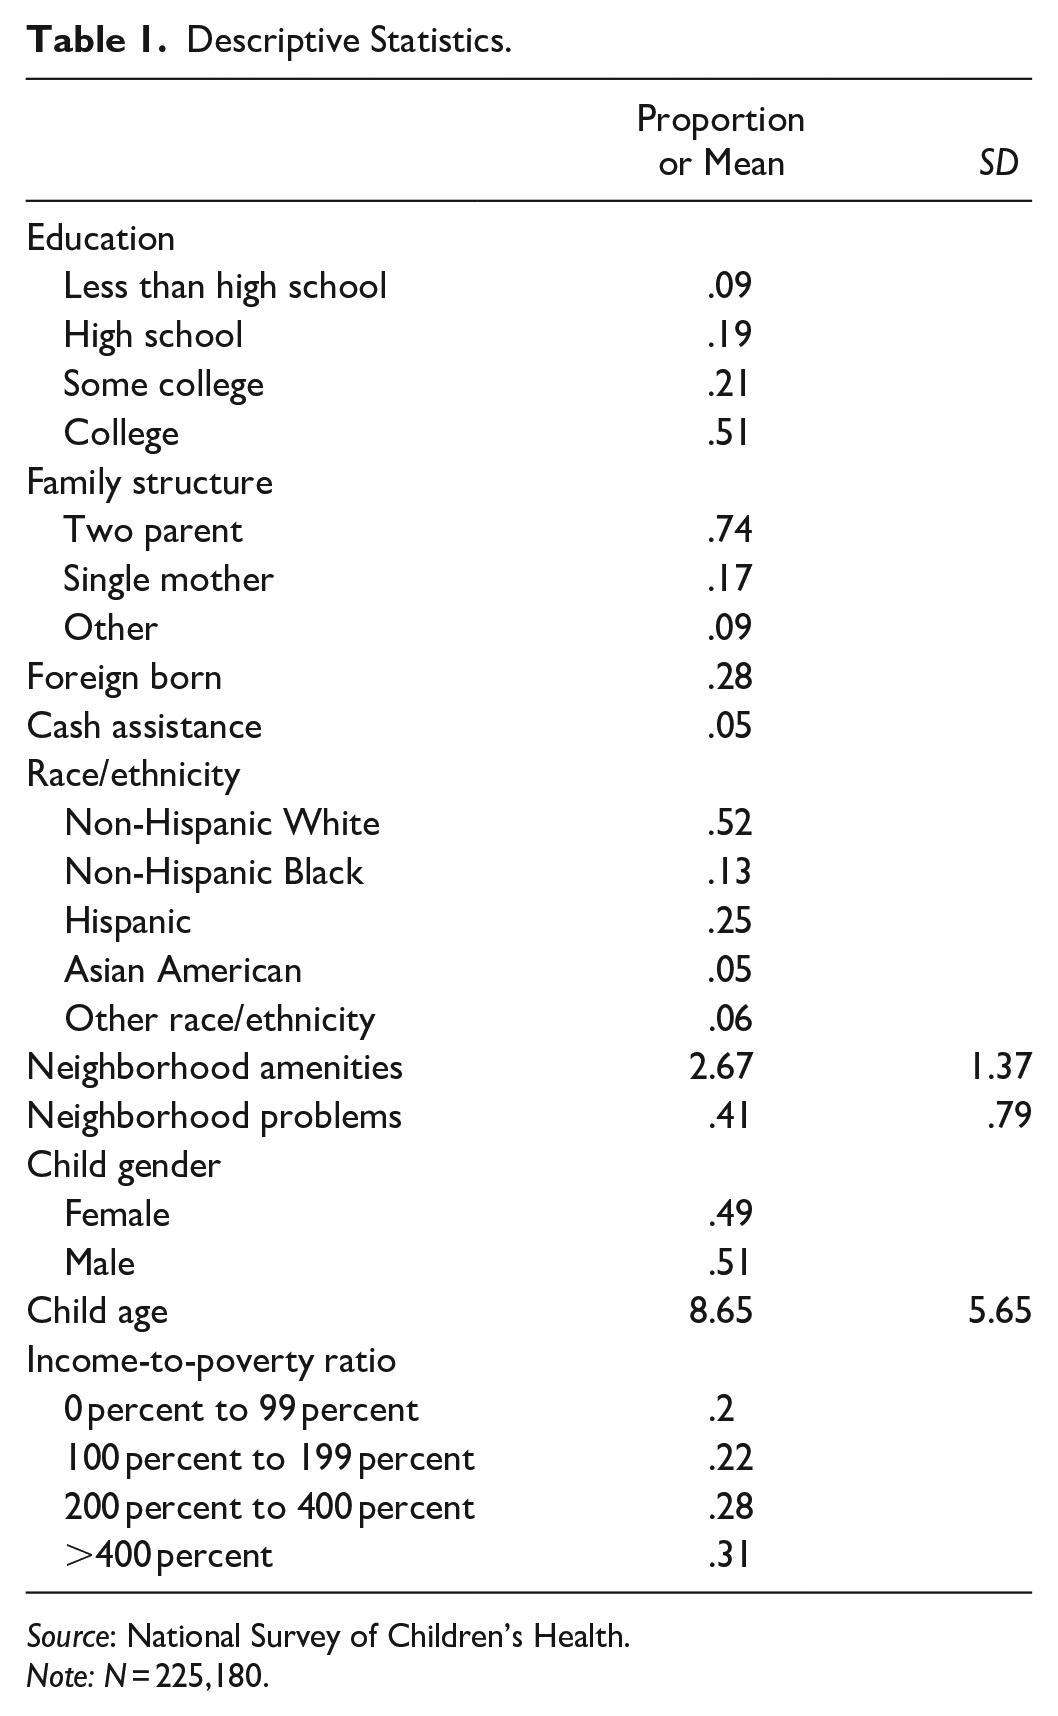
Source: National Survey of Children’s Health.
Note: N = 225,180.
Methods
To examine changes in neighborhood social cohesion during the COVID-19 pandemic, we first report descriptive statistics for all outcome variables and present unadjusted trends for each outcome. We then estimate a series of multivariable regression models. Specifically, we estimate ordered logit regression models for each of the individual outcome variables related to neighborhood social cohesion and a linear regression model for the neighborhood social cohesion scale variable. We include all independent variables in each regression model. The coefficients for survey year provide an estimate of how neighborhood social cohesion changed during the COVID-19 pandemic. To ease interpretation, we calculate average marginal effects (Williams 2012) and present the adjusted trends as predicted probabilities.
When weighted, data from the NSCH are intended to produce state-specific and national estimates of child health and well-being. We use these child-level survey weights to adjust our estimates to be nationally representative of the U.S. population of noninstitutionalized children between ages 0 and 17 years and adjust standard error calculation for the complex sampling design. To explore possible heterogeneity in trends across social groups, we also fit multivariable regression models that included interaction terms between year and other independent variables such as income-to-poverty ratio, caregiver education, race and ethnicity, and neighborhood amenities. These models did not yield any substantively significant results and are omitted from the findings section.
Findings
Table 2 reports the distribution of responses for the individual outcome measures. In general, respondents reported living in neighborhoods where they felt they could count on their neighbors. For example, in response to the statement that people watch out for one another’s children in this neighborhood, 45 percent definitely agreed, 40 percent somewhat agreed, 10 percent somewhat disagreed, and 6 percent definitely disagreed. Notably, few respondents reported concerns about the safety of their child in the neighborhood; only 5 percent of respondents somewhat disagreed or definitely disagreed that their child was safe in their neighborhood. Nonetheless, although neighborhood perceptions were generally positive, roughly one in seven respondents disagreed with the statements that people in this neighborhood help one another out, that neighbors watch out for one another’s children, and that they know where to get help when they encounter difficulties.
Distribution of Outcome Variables.

Source: National Survey of Children’s Health.
Note: N = 225,180.
Figure 1 shows unadjusted trends between 2016 and 2021 for all individual outcome measures. Overall, the figure reveals remarkable stability in neighborhood social cohesion. Across all outcomes, there was little change during the observed period, and no significant change observable after the onset of the COVID-19 pandemic in 2020.

Unadjusted trends in neighborhood social cohesion, 2016 to 2021.
Table 3 presents results from multivariable regression models. To facilitate interpretation of year trends in the ordered logit models, we present results as predicted probabilities in Figure 2. Although there are statistically significant differences across years, the results show substantively negligible change in neighborhood social cohesion over the study period. For example, in 2016, the predicted probability of definitely agreeing with the statement that neighbors help each other out was 0.35. Between 2017 and 2021, the predicted probability ranged between 0.36 and 0.39. Similarly, the predicted probability of definitely agreeing that neighbors watch out for each other’s children was 0.43 in 2016 and ranged between 0.44 and 0.45 between 2017 and 2021. Neither the onset of the COVID-19 pandemic in 2020 nor access to COVID-19 vaccines for adults in early 2021 were associated with a change in neighborhood social cohesion.
Multivariable Regression Models Predicting Neighborhood Social Cohesion.

Source: National Survey of Children’s Health.
Note: N = 225,180.
p < .05. **p < .01. ***p < .001.

Adjusted trends in neighborhood social cohesion, 2016 to 2021.
The other coefficients in Table 3 show several notable disparities in reported neighborhood social cohesion. Generally, respondents in single mother households experienced lower levels of neighborhood social cohesion than respondents in two-parent households; as did respondents from households where at least one caregiver was born abroad, or households receiving cash assistance. Respondents who identified their child as non-Hispanic White reported higher levels of neighborhood social cohesion than respondents whose child was identified as Black, Hispanic or Latino, or any other racial or ethnic category. Neighborhood social cohesion was positively associated with higher reported levels of neighborhood amenities and with families’ income-to-poverty ratio. Older age of the focal child was also positively associated with reported neighborhood social cohesion, although the number and ages of other children in the household were not ascertained.
Discussion
The onset of the COVID-19 pandemic had wide-reaching impacts on families with children. Everyday routines were upended, there were significant disruptions to the labor market and schools, and unemployment rapidly increased. During times of distress, neighbors serve as a potential source of support and comfort for one another, and living in a neighborhood with high levels of neighborhood social cohesion is associated with lower levels of parental stress and improved mental health and well-being in children (Dawson et al. 2019; Lenzi et al. 2012; Maguire-Jack and Showalter 2016; Wang and Fowler 2019). Despite the significant changes spurred by the COVID-19 pandemic, we found that perceived neighborhood social cohesion remained approximately constant.
Our findings also contribute to ongoing debates related to a perceived loss of community. Specifically, a popular narrative, commonly referred to as the community-lost hypothesis, argues that relationships among neighbors have weakened in recent decades because of technological advancements, demographic shifts, and changes to the economy and labor market (Hampton and Wellman 2018). However, counter to the expectations of the community-lost hypothesis, a recent study (Campbell et al. 2022) revealed that trends in neighborhood social cohesion were stable from the mid-1990s through 2017. Our research updates these findings, showing that levels of neighborhood social cohesion remained steady through 2021. Our findings also highlight that neighborhood social cohesion is remarkably robust to broader social and economic context. The COVID-19 pandemic brought about significant changes and yet neighborhood social cohesion was unchanged.
We also found disparities across social groups that are consistent with previous studies (Campbell et al. 2022; Guest et al. 2006). We found that neighborhood social cohesion was highest among two-parent households, households with non-Hispanic White children, affluent households, and in neighborhoods with more amenities (e.g., sidewalks, recreation center) and fewer problems (e.g., litter, graffiti). These findings highlight two important issues. First, neighborhood social cohesion levels are lower among less affluent households, demonstrating how the effects of socioeconomic disadvantage can be compounded, as households with fewer socioeconomic resources also face lower levels of neighborhood social cohesion. Second, the positive association between neighborhood amenities and neighborhood social cohesion is in line with previous research that shows how physical characteristics of neighborhoods are associated with relationships and ties among neighbors (Cohen, Inagami, and Finch 2008; Williams and Hipp 2019). Making changes to the physical characteristics of neighborhoods could be an effective mechanism for increasing neighborhood social cohesion (Cattell et al. 2008).
There are four notable limitations to our study. First, our data are limited to families with children and our results are unable to address trends for childless households. There is evidence that parenthood leads to an increase in contact with neighbors (Rözer, Poortman, and Mollenhorst 2017). If having children in the home helps facilitate neighborhood social cohesion, our estimates might overstate overall levels of perceived neighborhood social cohesion. Second, our outcomes are limited to caregivers’ perceptions of their neighbors and neighborhood. Measures of neighborly activity, such as time spent socializing with a neighbor or exchanges of assistance, would help provide a different lens through which to analyze how neighborhood relationships changed during the pandemic. However, to the extent that neighborhood activities may have decreased during the COVID-19 pandemic because of increases in social distancing or greater demands on parents’ time, it is noteworthy that neighborhood social cohesion remained stable during this period. Third, the deidentified nature of the NSCH precludes us from analyzing variations across small geographical units (e.g., county or census tract), where there might have been significant differences in preexisting levels of social cohesion; differences in measures taken to prevent the spread of COVID-19, and differences in compliance with these policies. Fourth, because our unit of analysis is each family with children, we are unable to explore changes that may have occurred in specific neighborhoods or other geographical areas. Further research on trends in neighborhood social cohesion should take into account geographic clustering of respondents within neighborhoods, and would offer valuable insights into the stability of neighborhood social cohesion.
We posit two explanations for why perceived neighborhood social cohesion remained constant during such extraordinary times. First, neighborhood social cohesion is durable because neighborhoods continue to be central to everyday life and help create common interests and experiences among neighbors. Second, it could be that the adverse effects of the COVID-19 pandemic on neighborhood social cohesion were offset by positive changes that led people to invest more in their neighborhoods. For example, although efforts to maintain social distancing and minimize the spread of COVID-19 may have reduced particular forms of neighborhood activity (e.g., socializing in a neighbor’s home), the significant increase in time spent at home may have fostered greater interest in building neighborhood relationships. The incredible stability of neighborhood social cohesion over time raises further questions about what social or economic forces are capable of producing changes in neighborhood social cohesion.