
Abstract
Many migrants are vulnerable due to noncitizenship, linguistic or cultural barriers, and inadequate safety-net infrastructures. Immigrant-oriented nonprofits can play an important role in improving immigrant well-being. However, progress on systematically evaluating the impact of nonprofits has been hampered by the difficulty in efficiently and accurately identifying immigrant-oriented nonprofits in large administrative data sets. We tackle this challenge by employing natural language processing (NLP) and machine learning (ML) techniques. Seven NLP algorithms are applied and trained in supervised ML models. The bidirectional encoder representations from transformers (BERT) technique offers the best performance, with an impressive accuracy of .89. Indeed, the model outperformed two nonmachine methods used in existing research, namely, identification of organizations via National Taxonomy of Exempt Entities codes or keyword searches of nonprofit names. We thus demonstrate the viability of computer-based identification of hard-to-identify nonprofits using organizational name data, a technique that may be applicable to other research requiring categorization based on short labels. We also highlight limitations and areas for improvement.
Nonprofit organizations have long been hailed as institutions critical to providing human and social services where markets or government fail to do so, helping people exercise civic and political voice, and creating ways for communities to engage in cultural, religious, and social activities, from volunteer cricket leagues or bird-watching groups to mutual assistance associations and affinity groups (Powell and Bromley 2020). Given their diverse roles, nonprofits are especially important for vulnerable groups, such as those living in poverty or racial minorities. In this article, we focus on immigrant communities, an understudied population in nonprofit scholarship. 1 Migrants are vulnerable because they are often shut out of the formal political system or safety-net programs due to their noncitizenship, frequently face linguistic or cultural barriers to accessing mainstream human services, and may find that their cultural or religious traditions are poorly expressed in established nonprofit infrastructures (Chow et al. 2019b; Cordero-Guzmán 2005; de Graauw 2016; de Graauw, Gleeson, and Bloemraad 2013; de Leon et al. 2009).
We see the development of two important research agendas in the study of immigrant-oriented nonprofits. The first seeks to evaluate the degree to which nonprofits can alleviate difficulties that migrants face. This agenda centers on whether and how much nonprofits facilitate immigrant well-being and integration. Most research on immigrant integration has focused on the impact of macro-structures, such as labor markets and racial hierarchies, or individual determinants, such as human capital or English language ability. The burgeoning scholarship on immigrant-oriented nonprofits provides evidence for the importance of meso-level institutions: Nonprofits help immigrants have a political voice (de Graauw 2016; Wong 2006), provide direct services (Cordero-Guzmán 2005; Chow et al. 2019b), help precarious immigrant workers challenge exploitation (Fine 2006; Gleeson 2012), protect immigrants from deportation (Chand et al. 2021), facilitate cultural or social activities (Hung 2007), and advance transnational charitable efforts (Chaudhary and Guarnizo 2016). This research agenda conceives of nonprofit organizations as possible determinants, or independent variables, affecting immigrant incorporation.
A second research agenda considers immigrant-oriented nonprofits as the dependent variable: When, where, and why do immigrant-oriented nonprofits become established, and what affects their persistence over time or their decline? Bloemraad, Gleeson, and de Graauw (2020:294) have introduced the idea of “civic inequality” to characterize situations in which there is a disparity in the number, density, breadth, capacity, and visibility of nonprofit organizations oriented to a specific group, such as immigrants, relative to the nonprofits available to other people. Scholars speculate that community resources, politics, institutional legacies, and immigration status affect nonprofit founding and survival (de Graauw et al. 2013; de Leon et al. 2009; Hung 2007; Joassart-Marcelli 2013). The greater the civic inequality, the more likely that vulnerable groups will lack voice, services, and the institutions they need to thrive.
Unfortunately, progress on systematically evaluating the role of nonprofits for immigrant well-being or accurately modeling the determinants of civic inequality has been hampered by significant data difficulties, namely, the problem of identifying immigrant-oriented nonprofits. Research on nonprofits and immigrant incorporation, for example, is largely based on case studies of a few organizations or of a particular city or metropolitan region. We tackle this data challenge in this article. We follow de Graauw et al. (2013:96) in conceptualizing an immigrant nonprofit organization as one that serves or advocates on behalf of one or more immigrant communities, promotes their cultural heritage, or engages in transnational relations with countries or regions of origin. In what follows, we outline an innovative strategy for efficiently and accurately identifying immigrant-oriented organizations in existing databases of nonprofit organizations using machine learning techniques.
Although machine learning has exploded in popularity in recent years, the term machine learning is decades-old, first coined in 1959 (Samuel 1959). Other terms, like pattern recognition, share a similar idea, namely, the process of data classification based on prior knowledge or statistical patterns. Here, machine learning is the process by which machines adapt their classification procedures for identifying patterns in data by iteratively fitting various models and algorithms to the data (Jordan and Mitchell 2015; Mooney and Pejaver 2018). Machine learning usually employs one of three models: supervised machine learning, unsupervised machine learning, and semisupervised machine learning. This study applies supervised machine learning, which relies on already existing “training” data sets—data sets that have been previously classified or labeled—to explore patterns in new data and to validate those classification processes on a “test” data set.
Usually the goal of machine learning is to increase classification efficiency when compared to humans. For example, human coding of thousands of nonprofit organizations, all located in a single U.S. region, can take hundreds of hours. In comparison, once a machine learning model is trained, a computer can classify about 400 organizations within a minute. This not only increases the speed of the research process but also makes it much more feasible to analyze big data sets spanning multiple states or regions, or even the entire nation, and to track patterns over time. A trade-off of computer-based coding and classification, however, is accuracy, especially in cases requiring greater human interpretation (e.g., subtleties of ethno-racial origins or prejudice; see e.g., Tolley 2015) or where a researcher has few words for classification, as in the case of organizational names. We aim to advance researchers’ ability to study immigrant-oriented nonprofits by considering how best to maximize efficiency and accuracy.
We consequently test whether machine learning and natural language processing (NLP) are promising methods for classifying immigrant-oriented nonprofit organizations. We evaluate a number of different computer-based strategies and compare them to existing techniques. We find, impressively, that the best results, using the bidirectional encoder representations from transformers (BERT) technique, achieved 89% accuracy in the validation data set and, compared to other techniques, also showed better performance in detecting immigrant-oriented organizations. Our procedures hold out promise for expanding the breadth of research on complementary projects seeking to classify other institutions or objects based on short names, although further refinements remain necessary. In what follows, we first survey prior strategies and then outline our data and methods. Next, we present results from seven different models, comparing machine learning algorithms to each other and to prominent existing strategies. We conclude by discussing the benefits and limitations of NLP.
Identifying Immigrant-Oriented Nonprofits: Prior Strategies
Many existing studies of immigrant-oriented nonprofits examine a few case study organizations or, due to the limitations of national or state-level nonprofit data sets, attempt to do a census of immigrant organizations in a particular city or metropolitan region. An example of the former strategy is Chung’s (2007) participant observation at two Korean American-headed nonprofits in Los Angeles. During her fieldwork, she studied day-to-day operations, decision-making, activities, and generational conflicts. De Graauw (2016) provides an example of the latter strategy. She used fieldwork, directories, web searches, and interviews to assemble the universe of immigrant-oriented social service nonprofits in San Francisco and then sent each organization an extensive survey to collect information on revenues, programs, clientele, staff, and advocacy activities.
These approaches contrast to the prevailing strategy in the broader nonprofit field, which frequently relies on large databases of nonprofit organizations drawn from Internal Revenue Service (IRS) lists. Such databases contain information on organizations that have filed for 501(c)(3) status to avoid paying taxes on donations and revenues and to permit them to provide receipts to donors who want to claim tax deductions. 2 Government administrative data offer important benefits in data uniformity and scope, especially when faced with tallying hundreds of thousands of organizations nationally.
Researchers who want to study immigrant-oriented organizations face a problem, however: There is no easy way to identify such nonprofits in data sets derived from IRS records. The broader field of nonprofit scholarship frequently leverages the National Taxonomy of Exempt Entities (NTEE) codes, used by the IRS to classify nonprofits, to categorize organizations. But although there are a few codes specific to immigrants and refugees, such as “Ethnic & Immigrant Centers” (P84) or “International Migration & Refugee Issues” (Q71; Jones, 2019), these codes do a poor job of identifying most immigrant-oriented organizations. For example, to identify immigrant-oriented nonprofits in the Boston metropolitan area, Joassart-Marcelli (2013) identified all organizations with an NTEE code of P84 using the National Center for Charitable Statistics data set of 501(c)(3) organizations cross-referenced with GuideStar. 3 Because relatively few organizations use or are assigned this particular code, Joassart-Marcelli found only 63 registered immigrant-oriented nonprofit organizations in the metro Boston area. This is less than 6 percent of the more than a thousand nonprofits providing social, housing, employment, and health services to low-income residents in the region in 2006 and most likely a significant undercount of the region’s immigrant-oriented nonprofit sector. 4 Cordero-Guzmán and colleagues (2008) used a wider range of NTEE codes to do a similar stock-taking of immigrant-oriented nonprofits in Chicago and New York, but they also ended up with a small number of organizations. 5 Indeed, field research suggests that many organizations may not be officially listed in these NTEE categories yet engage in substantial work serving immigrants (de Graauw 2016). A health organization in San Francisco’s Chinatown may, for instance, provide services primarily to Asian immigrant populations but be listed under the health category in nonprofit data sets. Although there are clear benefits to using NTEE codes—they provide a standardized and quick way of labeling organizations—this strategy likely undercounts substantially the true universe of immigrant-oriented organizations.
Researchers have come up with alternative methods to using NTEE codes. A common procedure is to use information in organizations’ names to categorize nonprofits. Computer keyword searches can look for particular words that highlight a specific homeland, race, or ethnicity, such as Chinese or Hispanic, or search functions can look for common non-English words that might indicate an immigrant-oriented nonprofit, such as the use of Centro (center in Spanish; Chan 2014; Cortés 1998; Kim 2020). An alternative or complementary strategy is to select nonprofits that include a certain percentage of board members with a common “ethnic” last name such as Nguyen or Tran for those of Vietnamese origins (Hung 2007) or (where these data are available) board members identified as foreign-born (Vermeulen 2006). Using organizational or board member names as an identification strategy is a reasonable way to comb through thousands of records efficiently, but the technique can fall short in accuracy. It can produce both significant omissions (e.g., missing an immigrant-oriented organization because its name or board members’ names are judged “Anglo” or nonimmigrant), or alternatively, it can erroneously include nonimmigrant organizations (e.g., an “Indian” organization focused on people of Native American background, not from South Asia). It is also difficult for a research team to be familiar with dozens and dozens of immigrant languages or to have a solid list of common “immigrant” last names, especially given intermarriage and the multigenerational diversity of the U.S. population.
A more accurate approach is to hand-code hundreds or thousands of organizations listed in official databases and determine, one by one, whether they are primarily immigrant-oriented organizations. This often involves using a combination of NTEE codes, organizational names, social service or organizational directories, web searches, information collected during fieldwork, and interviews with community and philanthropic leaders (e.g., de Graauw 2016; Gleeson and Bloemraad 2013). Although much more exhaustive and accurate, these intensive research methods are very tedious, time-consuming, and labor-intensive, trading off efficiency for accuracy and depth. 6 Producing a relatively rich tally in just a few cities might take 1 or 2 years of research, making broad geographic or temporal comparisons prohibitive.
Given all of these challenges, we wondered whether the rapidly expanding field of machine learning might provide a powerful tool to accurately and efficiently identify immigrant organizations. We turn now to our attempts to develop such a research tool.
Methods
Our overall strategy was to assess two different NLP methods based on word frequency models (i.e., “bag-of-word” approaches and term frequency-inverse document frequency [TF-IDF]) and five word-embedding approaches (i.e., word2vec [locally trained and pretrained with Google News], Stanford’s global vectors for word representation [GloVe], long short-term memory [LSTM], and BERT) to identify immigrant-oriented nonprofits based on organizational name. We compare the results from the computer-based algorithms to strategies based on NTEE codes or key words—common procedures in existing research—to calibrate the benefits and limitations of NLP methods. To train the algorithms and evaluate results, we leveraged four existing data sets, two from well-known providers of general nonprofit data (GuideStar and NCCS) and two data sets focused specifically on immigrant-oriented nonprofits drawn from two immigrant-rich regions of the United States, the San Francisco Bay area and New York State. We first describe our data sources.
Data Sources
To train the supervised machine learning model, we needed to have a data set of “known” immigrant-oriented organizations and a second data set of nonimmigrant organizations. For the former, we first drew on nonprofit information collected and curated by GuideStar. GuideStar is the premier data aggregator for the nonprofit field. We entered two keywords, “immigration” and “migrants,” into the search bar and downloaded the top 1,000 returned organizations from each keyword for a total of 2,000 organizations. Duplications across these results were deleted, leaving 1,982 organizational names. The GuideStar algorithm is proprietary and thus a black box to researchers, so we do not know the specific search rules employed by the website. Our observation suggests that typically, the search criteria first return organizations with keywords in their organizational name and then organizations with the keyword in their missions. A third priority appears to be the presence of the keyword or similar word (e.g., immigrant rather than immigration) in their program description. GuideStar’s algorithm might also prioritize larger organizations in its search returns. The 1,982 organizations returned by GuideStar were coded as 1 to indicate that an organization is related to immigrants or immigration (“GuideStar immigrant data set”).
For the nonimmigrant-oriented organization data set, we picked 1,000 nonprofit organizations randomly from the National Center for Charitable Statistics (NCCS) data set for the year 2015. We excluded organizations that appeared in the list from GuideStar or that had a country name in its organizational name. These deletions reduced the nonimmigrant data set slightly, to 986 nonprofits, which were coded as 0 (“NCCS nonimmigrant data set”).
As outlined previously, there is good reason to believe that intensive field-based methods are more effective—but much less efficient—in identifying immigrant-oriented organizations. For this reason, we also leveraged a third data set that we acquired from the Immigrant Civic Engagement Project (ICEP; “ICEP data set”; Gleeson and Bloemraad 2013; de Graauw et al. 2013). This data set, built from the NCCS Business Master File from 2005, encompasses all nonprofits listed by the IRS as having an address in seven cities in the San Francisco Bay area (Cupertino, Fremont, Milpitas, Mountain View, Santa Clara, San Jose, and Sunnyvale). Human coders undertook extensive efforts to identify immigrant-oriented nonprofits using NTEE codes, organizational names, local directories, and referrals from community leaders. For each potential organization, researchers looked up mission statements or activities on the Internet and/or spoke to people associated with the organization. This data set contains 3,472 organizations, of which 875 are verified as an immigrant-oriented nonprofit. 7
Finally, we draw on a fourth data set for validation purposes, which we call the “NY data set.” It is extracted from the file “A Guide to Community-Based Organizations for Immigrants,” produced by the Department of Education of New York. This list includes organizations with a variety of services, such as advocacy, health care, and legal services (The New York State Education Department, 2021). Some duplicate organizations and organizations without a proper employer identification number (EIN) 8 were dropped, producing a final data set of 168 immigrant-oriented New York nonprofit organizations, which are all coded as 1.
Data Merging
Given the accuracy benefits of human-coded data sets but their drawbacks in terms of scope and size, we merged the data from the three main data sets elaborated previously (GuideStar immigrant, NCCS nonimmigrant, and ICEP), only retaining the EIN, organizational name, and the dummy variable code for “immigrant” (I or 1) or “nonimmigrant” (N or 0) organization. We had two distinct purposes for this merged data set: to train the algorithms in classifying organizations and to test the results of the classificatory algorithms on a subset of data that we put aside for testing purposes. The data merging process is diagrammed in Figure 1. First, the 1,982 organizations from the GuideStar immigrant data set were combined with the 986 organizations from the NCCS nonimmigrant data set. These in turn were combined with the 3,472 ICEP organizations. Because a few EINs and names were duplicative, duplicate organizations were removed, resulting in a combined file of almost 6,500 organizations, of which 3,592 are nonimmigrant- and 2,835 are immigrant-oriented nonprofits. The bulk of these organizations, 6,027, became the training and testing data set, with 56 percent coded 0 and 44 percent coded as 1. We also randomly set aside 400 human-labeled organizations from the ICEP data set as a validation data set (200 organizations each for immigrant/nonimmigrant).

Data merging process.
Text Preprocessing
NLP strategies work better when textual information has been preprocessed to have a tidy, consistent format. To this end, all organizational names were changed into the same format (lower case), and stopwords (i.e., very high-frequency words) such as the, an, and a were deleted based on the NLTK package, which includes a standard, common dictionary of stop words (Bird, Klein, and Loper 2009). We further used stemming to evaluate the bag-of-words and TF-IDF methods and decrease unnecessary calculations. Stemming is when words are reduced to their roots so that cognates (e.g., Latino and Latinos) are treated as the same words. We picked the word stems based on the NLTK “stem” package; NLTK is a leading platform in NLP and well documented.
Data Analysis: Frequency and Embedding Methods
The field of machine learning and NLP is evolving rapidly, with a range of techniques that are continuously being refined. We focus on two broad classes of techniques: a set of strategies that is frequency-based and another set that considers word embeddings.
Frequency-Based Methods
The simplest and most intuitive NLP technique is the bag-of-words. In this model, a string of text (for us, the organizational name) is represented as a jumble of disconnected words, disregarding grammar and word order but keeping multiplicity (i.e., the frequency or count; Harris 1954). The rows of the large matrix produced by this technique represent each organization in the data set, and the columns represent each tokenized word. The number in the matrix is the frequency of the word. For example, “The Latinos Service” would have a long vector such as [0000010000. . .10000], with two 1s, one for the column representing the stem word Latin and another for the column Service. 9 We use “sklearn,” a common machine learning package in Python, to produce the bag-of-words matrix for our data set (Buitinck et al. 2013; Pedregosa et al. 2011).
An alternative method builds on the bag-of-words approach but calibrates algorithms to give less weight to common words in the classification process (e.g., association) and more weight to rarer words (e.g., Somali). This TF-IDF method has two components. TF is term frequency, the number of times the term appears in a document (here, the organizational name), like the bag-of-words approach. IDF is the inverse document frequency, weighing words by how prevalent or rare they are in the entire corpus (for us, all organizational names; Jones 1972). This approach has been shown to be better for determining a document (or organization) topic (Leskovec et al. 2020). We again use the “sklearn” package.
Word Embedding Methods
Frequency-based methods remove words from their context in the wider world, treating them as isolated pieces of information (bag-of-words) or calibrating somewhat by frequency but not by the relationship between words (TF-IDF). Word embedding methods differ in that they use a natural language process modeling technique to map words in a data set to vectors of words used in context in the wider world (Mikolov et al. 2013). The word embedding method can thus preserve the semantic and lexical relationships among words. Doing so helps to address some important disadvantages of the frequency-based approaches because the latter do not capture a word’s position in the text, the co-occurrence of words, or semantics. Researchers can train text material and produce their own embeddings, or they can draw on pretrained models that already assign vector representations to each word. For instance, Google has a pretrained embedding based on Google News text material (Mikolov et al. 2013). If the word becomes a vector with a meaningful space, then distance can be regarded as similarity and researchers can apply mathematical calculations to the words or vocabularies. The typical example to communicate the intuition behind this approach is the “equation” of King – Man + Woman = Queen. We test four different word embedding methods.
The first of these methods is word2vec. It takes as its input a large corpus of text and produces a vector space, typically of several hundred dimensions, such that words that share a common context in the corpus are located close together in vector space (Mikolov et al. 2013). In our research, we applied two variants of word2vec. The first variant (which we identify as W2V) is trained on our corpus of organizational names. The second variant is a pretrained Google News model (which we identify as G-News). 10 Both are two-layer neural networks.
The second word embedding method we employ is Stanford’s GloVe, which is computed using term-context matrices. Its embeddings reflect the probabilities that two words appear together using a log-bilinear regression model rather than neural networks. GloVe is pretrained using the co-occurrence of words over a corpus drawn from Wikipedia, Common Crawl, and Twitter (Pennington, Socher, and Manning 2014). In our project, whether using locally trained word2vec, G-News, or GloVe, organizational names are mapped, with each word assigned 300 dimension vectors. Because an organizational name usually has several words, the mean vector of these words represents the vector of the organizational name, which includes partial information of each word in the organizational name. 11
Our third word embedding model is a recurrent neural network model, LSTM. A simple neural network technique like word2vec usually assumes that word order is independent between inputs when calculating semantic distance (i.e., the precise order of words does not matter). However, words always have a sequence, and the sequence may reveal an important pattern (e.g., Indian American vs. American Indian). Recurrent neural network (RNN) classification models better capture the sequencing of words. We use an LSTM model, a variant of RNN (Hochreiter and Schmidhuber 1997), via the package “keras,” an interface for the TensorFlow library (Chollet 2018).
Finally, we consider a fourth word embedding approach, the BERT technique, which is a neural-network-based technique created by Google and pretrained on BookCorpus and English Wikipedia (Devlin et al. 2019). BERT further builds on the importance of understanding words in context, drawing on its corpus to assign different embeddings depending on the probable context of each word. For example, if the techniques outlined previously come across the word China in an organization name, China will have a similar vector representation in both the organizations China-California Heart Watch and China Lake Surgery Center. However, the word China has a different meaning: The first China refers to a country, whereas the second China is a part of China Lake, a location in California. BERT provides an additional contextualized embedding that differs according to the phrase because it draws on BookCorpus and English Wikipedia to put words in context, thus increasing the likelihood it can distinguish distinct uses of China.
BERT comes with drawbacks, however. It is very “expensive” in its calculation, costing a much longer time and more computation power to run than other strategies. 12 To speed up processing, a graphics processing unit (GPU) with parallel computing is necessary. We thus applied Google Colab’s GPU. Moreover, fine-tuning and distilling BERT is complicated. Hence, we employ the package “FastBERT,” which was invented by Liu et al. (2020). 13
Analytical Approach
Our analysis process has two steps. First, we use NLP to convert language (i.e., organizational names) into machine-readable vectors, called representations. Second, these representations are used to build machine learning classification models. In this project, logistic regression is applied for classification. 14 In this context, the left side of the logistic equation is 1 and 0, and the right side is terms or dimensions and their weights, depending on the type of method. Results are based on fivefold cross-validation in the training data set.
Validation Methods
We start from frequency-based methods (i.e., bag-of-words and TF-IDF) and then turn to more sophisticated embedded word methods attentive to context to see whether investing more calculation time and computing power substantially improves results. To evaluate our models, we use three validation methods: an accuracy metric, a confusion matrix, and a calculation of the percentage of correctly identified immigrant-oriented nonprofits.
In terms of accuracy, the models are first run on the training data set and then assessed for accuracy on the validation data using a simple evaluation metric:

This metric calculates the sum of true positives (TP, organizations accurately identified as immigrant-oriented) and true negatives (TN, accurately categorized non-immigrant-oriented nonprofits) divided by total number of organizations. Because our validation data set is roughly even, around half 1s and half 0s, if the model guesses all 1s or all 0s, or categorizes randomly, the accuracy will return as .5. 15 In the current data sets, the baseline for the test data set is .56, and the baseline for the validation (holdout) data set is .5. Here, the validation data set can be regarded as a second test data set to evaluate the performance of a trained model.
We also examine a confusion matrix to observe the distribution of true positive, false positive, true negative, and false negative classifications, which can help tell a researcher what causes low accuracy and provide direction for improvement.
Lastly, we test the percentage of classifications that the model correctly identified as immigrant-oriented nonprofits. This metric allows us to compare how well existing, non-NLP coding strategies (i.e., based on the NTEE code or a keywords list such as nationality name) do compared to the machine learning models. We run this test on two validation data sets, the holdout data set from the ICEP organizations and the NY data set.
Results
As Table 1 shows, the simpler NLP models do a poor job of categorizing and distinguishing between immigrant- and non-immigrant-serving nonprofits. The first row shows the accuracy score after training on the test data set. The benchmark accuracy metric is .56. (Because accuracy is from a zero rate classifier, even if the model [erroneously] predicted all results as 1, the accuracy will still return as .56.) We see that all models appear to do quite a bit better than the benchmark for the test set, ranging from .77 (W2V) to .86 (Fast-BERT). However, when the classification model is applied to the validation data set, that is, to the 400 organization names that the algorithms had not previously seen (second row of Table 1), the locally trained bag-of-words, TF-IDF, and W2V models performed poorly, at .72 or lower, and with a marked gap between the test data set and validation data set. In comparison, the pretrained and context-sensitive algorithms (G-News, GloVe, LSTM, and FastBERT) do consistently well in both the test and validation data sets, with FastBERT noticeably outperforming all other models at .89 for the validation data set compared to .79 for G-News and GloVe. 16
Results of Accuracy in Test Set and Validation Set.
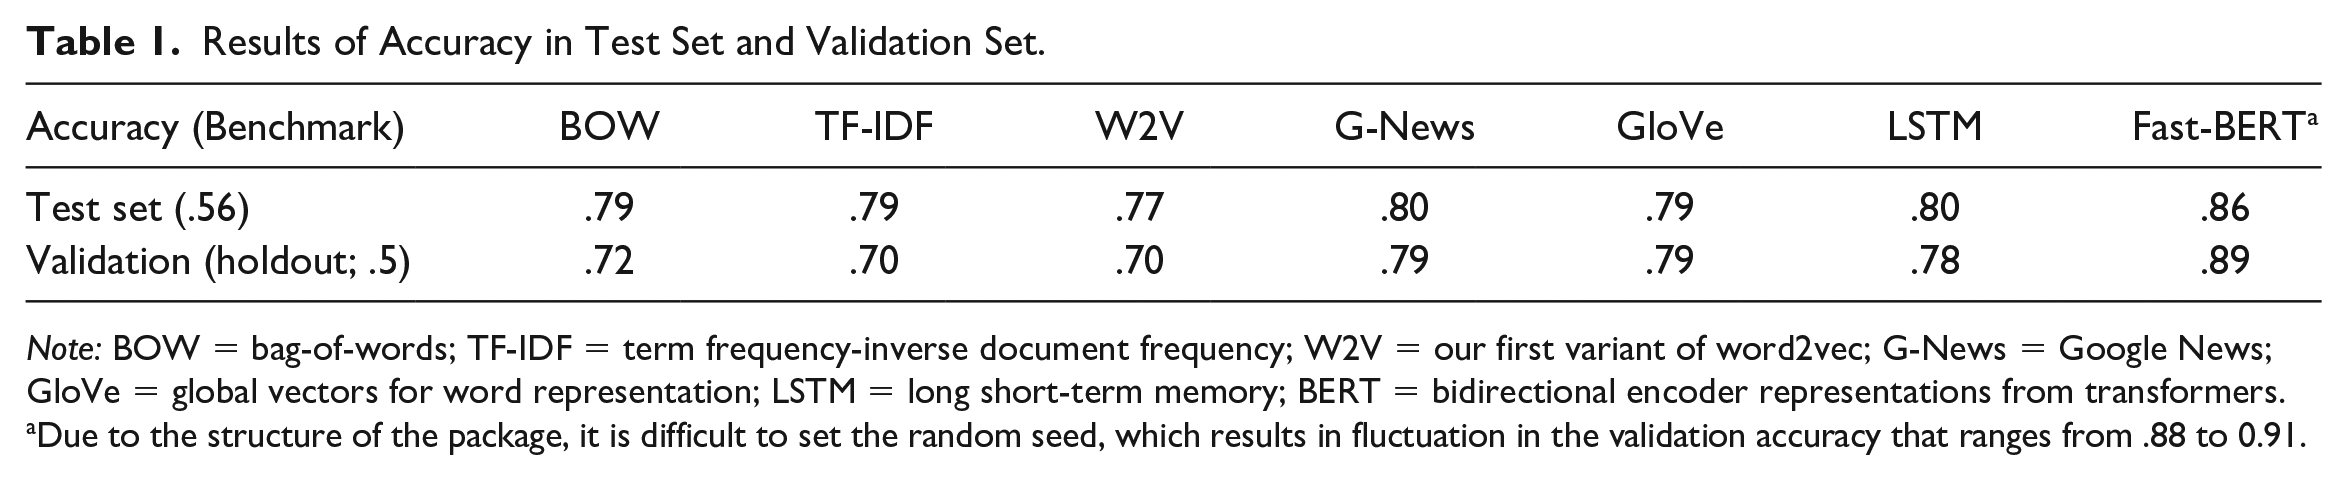
Note: BOW = bag-of-words; TF-IDF = term frequency-inverse document frequency; W2V = our first variant of word2vec; G-News = Google News; GloVe = global vectors for word representation; LSTM = long short-term memory; BERT = bidirectional encoder representations from transformers.
Due to the structure of the package, it is difficult to set the random seed, which results in fluctuation in the validation accuracy that ranges from .88 to 0.91.
A confusion matrix can help researchers evaluate what causes low accuracy. Appendix B shows accurate and erroneous classification for the bag-of-words and TF-IDF approaches. We observe the most false (or inaccurate) predictions on the bottom left, which represents a false negative classification. For us, a false negative means that the model predicts an organization is a non-immigrant-oriented organization but it is actually an immigrant nonprofit. This provides insight into the limits of computer-based word frequency methods absent real-world context. These NLP models likely could not generate sufficient features from immigrant-related organizational names for strong classification performance. This inability may be based on limitations in the algorithm itself, but the limited corpus of immigrant organization names (a few thousand) is likely also at play, especially the lack of vectors pretrained on a larger corpus beyond names.
To visually inspect the performance of each NLP model, we transform the high dimensional vectors used in the algorithms into two dimensions via t-SNE, as seen in Figure 2. Here, the x-axis and y-axis represent coordinates after dimensionality reduction, without inherent substantive meaning. The flattening to two-dimension space is useful, however, to see whether the word vectors are able to delineate clear boundaries around word clusters more likely to be found in an immigrant nonprofit name compared to a nonimmigrant organization. As we can see in the left panel of Figure 2, which shows the bag-of-words representations, the distribution of 1s and 0s is largely mixed together. This suggests that the model has a hard time distinguishing name features from organizations. In comparison, on the right panel of Figure 2, which shows the BERT representations, the non-immigrant-oriented organizations are clustered on the left side, whereas the right side consists mostly of immigrant-oriented organizations, with the overall separation between organizations much clearer. This suggests that BERT (and possibly word embedding models more generally) could be a better representation for training classification models than bag-of-words (or frequency approaches).

Spatial distribution after t-SNE between bag-of-words and sentence-BERT.
Visualizations can also help identify where the BERT algorithm, the best of our approaches, performs particularly well and where it has more difficulties in distinguishing immigrant- and non-immigrant-serving organizations. Figure 3 shows how particular organizational names cluster together. First, we see several pure clusters with only immigrant-oriented organizations. These are clusters of organizational names that the model had a very high accuracy in categorizing correctly. In the cluster highlighted by the purple circle, we find organization names that include keywords related to countries, like Somali and Chinatown. The red circle identifies a cluster that has a majority of 1s and a few of 0s because most organization names include Spanish words, such as alianza (alliance) or centro (center). Indeed, a mainstream language other than English proves to be a good factor for the algorithms to use to indicate whether the organization is related to migrants. The organizational names inside the yellow circle cluster together based on migrant-related words, such as refugee, immigrant, or citizenship. Conversely, we also find clusters of concentrated nonimmigrant organizational names, such as the green circle, which identifies organizations with school in the name but no other word (e.g., by place or language) to indicate an immigrant orientation.

Clusters inspection based on sentence-BERT.
We found, in comparing BERT to other methods, that although bag-of-words could find features (e.g., a specific country name, e.g., China), it cannot detect that country names together form a class in the same category (e.g., China, India, Somalia); the country-name words are understood as distinct for word frequency approaches. Word embedding methods like GloVe do better because country names are clustered, but with GloVe, the meaning of distinct languages is thin. For example, the organization “la porte county leadership inc” is not an immigrant-related organization, but for GloVe, it is close to Hispanic organizations because la is a feature in Spanish even though in this example, la porte is French and refers to a place in the United States. 17 The BERT model better distinguishes languages, given that the organizational name “la porte county leadership inc” sits at a further distance from the Hispanic organizations.
Figure 3 also reveals where the model had difficulty separating out immigrant and nonimmigrant organizations, represented by clusters with a more even mix of 1 or 0 categorizations. For example, the blue circle indicates a cluster of organizational names with relatively evenly distributed 1s and 0s. Upon inspection, we find that these are “foundation” nonprofits, which all include a family name. Inclusion of the family name appears to make it difficult for the algorithm to build a strong connection between the organization and their service or community orientation. 18
As noted earlier, BERT hit the highest accuracy in both the test data set and validation data set. This appears to be because it learns something from the training set and then is able to make some tough predictions on the validation data set in a manner superior to the other algorithms. For example, BERT successfully classified “Kimochi Inc,” a Japanese service organization for elderly residents in Japantown, San Francisco, likely using Kimochi to designate it as immigrant-oriented nonprofit even as Inc could signal a mainstream, nonimmigrant organization. The false negatives and false positives are quite even using BERT, around 5 percent. Our inspection found it hard to provide an obvious and consistent pattern in those false predictions—not surprising because a good model drawn partially from a human-coded training data set hopefully absorbs human learning and intuitions. Some of the false negatives, that is, organizations that should be 1 but were predicted as 0 by BERT, included the “nargis dutt cancer foundation inc,” “windhorse foundation,” and “far east dragon lion dance association inc.” False positives—that is, organizations designated as immigrant but that are in reality mainstream nonprofits—include “freedom worldwide” or “susie komor charitable trust.” Clearly, absent direct knowledge of these organizations, some nonprofits are difficult to predict correctly merely by organizational name.
Given the idiosyncrasies in some organizational names, researchers wanting a very high degree of accuracy with virtually no false negatives or positives will need to continue to rely on human-intensive methods that include some field knowledge, examination of websites, and informant interviews. However, for those wishing to do large-N studies across large geographies or across time, how well do computer-based algorithm and machine learning processes do compared to scholars’ existing techniques in larger data sets? Here we see much more promise for machine-based classification.
In Table 2, we compare BERT—the strongest NLP approach we tested—to two alternative strategies used in existing research: either the use of NTEE codes that are commonly associated with immigrant and refugee nonprofits or the use of standard dictionary-based keywords to identify immigrant-oriented nonprofits. We assess these strategies against each other by counting the number of accurate positives, that is, the number of organizations correctly identified as an immigrant nonprofit.
Prediction Comparison between Different Methods.

Note: NTEE = National Taxonomy of Exempt Entities; BERT = bidirectional encoder representations from transformers.
The NTEE code includes P84, Q71, R21, A23, and R22.
The dictionary-based keywords use a list of countries/areas and nationalities (https://github.com/Dinuks/country-nationality-list), continents, and words related to migration (i.e., migrant, refugee, hispanic, latin, immigrant, and immigration).
We first see that the NTEE strategy does very poorly, as shown in Table 2. In our holdout ICEP data set, which we used as a validation test of the machine-learning algorithms, we had 200 immigrant-oriented nonprofits. Only 32 had “immigrant” NTEE codes (capturing just 16 percent of all organizations). 19 For the NY data set, the NTEE method only identified 18 percent of the organizations successfully. We found that most organizations instead classify themselves based on the major service that they provide rather than based on their clientele or membership. For example, many organizations may report themselves as a “P20 Human service organization,” a very broad designation, but they provide services targeted predominantly to immigrant communities.
We further find that dictionary-based methods using preset keywords for country name, nationalities, and migrant-specific words did better, but not dramatically so, identifying 42 percent and 27 percent of immigrant-oriented nonprofits in the holdout ICEP data set and NY data set, respectively. 20 The machine learning categorization strategy works far better in both validation data sets, correctly identifying 90 percent and 67 percent of the immigrant-oriented nonprofits. We note that success in the NY data set is likely depressed because these organizations, identified as immigrant-oriented by the Department of Education of New York State, include a large number of education-specific organizations, such as after-school programs targeting children and youth. The BERT algorithm was likely underexposed to such organizations during the training process.
Concluding Discussion
After testing several NLP and machine learning techniques, we conclude that this is a promising and viable strategy to replace part of the human labor needed for identifying a specific subset of organizations in large databases that do not already have easy tags for subgroup identification. This is the case even though organization names are short, providing limited range for NLP. We represented those organizational names as vectors in NLP and employed machine learning to classify whether the organization is immigrant-oriented or not, validating the methodology on human-labeled data sets from the San Francisco Bay area and New York State. We show the potential for substantial increases in efficiency—a well-known benefit of machine learning—but also notable benefits in accuracy compared to existing research strategies employed in published research using large organizational data sets (i.e., use of NTEE codes or preselected keyword dictionaries).
Relative to dictionary-based methods, we further see the promise of machine learning because a researcher does not need to have an exhaustive list of predetermined words; nor, as in our case, do they need to be an expert in multiple languages. Pretrained NLP techniques can pick up words likely indicative of an immigrant-origin community (e.g., Buddhist) that a researcher might not have considered initially, and such techniques can, at times, make relatively fine language distinctions. We thus found that word embedding methods have better performance than the frequency-based NLP methods and that pretrained models like GloVe exhibit better performance compared to locally trained models (i.e., trained only on our own data set) due to the rich external corpus that the pretrained models draw on. This result may flow in part from the size of the training data set, which in our case, was modest and based on group names that tend to be short and thus offer limited semantic or linguistic information. It is hard to say how large of a data set is enough for a categorization project, but pretrained models, based on Wikipedia or news publishers, proved powerful in our case. The pretrained models are usually trained on very large data corpuses, therefore capturing a wider range of contexts that might push the vectors for the words in the organizations’ names closer to or further away from the semantic space around immigration.
Looking forward, researchers should be attentive to possible biases embedded in pretrained models, a possibility that we did not explore because our goal was a proof-of-concept endeavor. We are also excited by the possibilities of studying patterns in the output clusters, as shown in Figure 3. Such clusters provide possibilities for new inductive insights into organizational naming strategies, ones that may prove useful to human coders and field-based methods and also to methodologists interested in refining the applicability of NLP techniques.
There are, of course, limitations to our proof-of-concept work. First, part of the training data set was generated from Guidestar and NCCS and thus not verified by human coders, unlike the ICEP and NY data sets. To increase accuracy and reliability, it would be better if these organizations could be verified in similar ways to the human coding behind the ICEP and NY state data. Second, the ICEP and NCCS data sets are both drawn from IRS administrative data. Here we confront a selection bias known to nonprofit scholars: The IRS only reports on organizations with $50,000 or more in gross receipts; furthermore, religious congregations, irrespective of revenues, are not required to file Form 990/990-EZ to the IRS (IRS 2020). Thus, if there are naming patterns specific to small nonprofits or religious organizations, these patterns were not well observed. A third challenge lies in computing power. Although we can now categorize thousands of organizations quite quickly, the BERT methods, in particular, need GPU power to run fast. Finally, although our data visualization helped us to understand some of the categorization processes behind the outcomes, it can be hard to explain the categorization processes embedded in deep learning in a transparent way, which may make it harder to generalize the model. That said, in human coding, despite clear guidelines and codebooks, “intuition” might drive boundary decisions in a way analogous to NLP.
NLP and machine learning methods are clearly promising, but we underscore that for those needing very high accuracy, they do not yet reach the level of replacing human coding completely, especially if human coders can access information beyond organizational name. In this sense, future advances in machine learning techniques might come from being able to process richer data sets. Some nonprofit organizations, for example, report full Form 990 information, including the group’s mission, program descriptions, names of board members, and other features, like location. These data could be leveraged to improve the categorization. Rather than more data, another possible future direction is the use of the subwords method to improve models. A challenge in coding organizational names is that the name is often too short to reveal extensive information. Facebook’s fastText library application of subwords could generate more information from organizational names. 21 Researchers will also need to think carefully about extending these methods to other countries, especially non-English-speaking societies. However, expertise is developing rapidly, with several pretrained packages available in other languages, opening up the possibility for cross-national research in the future. 22 Similar methods could also be applied to other research topics, such as identifying nonprofits or small businesses related to particular demographic groups (e.g., African Americans, LGBTQ communities). Quick categorization and pattern recognition open up exciting possibilities in comparing across geographical space and time, although researchers will need to be sensitive to changes in naming or textual conventions over time and space in pretraining processes. 23
Despite limitations, we are optimistic about the possibilities, especially for large-scale data analysis, within the United States and comparatively across societies. NLP and machine learning models effectively recognized immigrant-related organizations and did so by substantially reducing the manual labor needed to categorize nonprofits. Scholars can thus better render visible a group previously overlooked in research on nonprofits as well as in philanthropy and, arguably, policymaking. Germane to our work, researchers can use this information to assess the extent to which places with rich organizational infrastructures improve immigrant well-being or, perhaps, isolate immigrants from mainstream society. We can also better investigate organizational inequities. This is especially important when, as in the United States, nonprofit organizations provide a significant portion of human and social services outside of state bureaucracies. Are there more nonprofit service providers per immigrant population in big cities, suburbs, or rural areas or in places with long-standing immigrant histories compared to new destinations? Answering these questions requires us to make immigrant organizations—and other overlooked communities—visible.
Footnotes
Appendix
Confusion Matrix on Validation Data Set.

| Bag-of-Words | Predicted Values | ||
|---|---|---|---|
| Negative | Positive | ||
| Actual values | Negative | 182 | 18 |
| Positive | 95 | 105 | |
| TF-IDF | Predicted Values | ||
|---|---|---|---|
| Negative | Positive | ||
| Actual values | Negative | 189 | 11 |
| Positive | 111 | 89 | |
Note: Positive = immigrant-related; negative = non-immigrant-related. TF-IDF = term frequency-inverse document frequency.
Acknowledgements
Authors are listed in reverse alphabetical order and share equal co-authorship. We thank Jasmijn Slootjes and David Harding for, respectively, advice early in this project and suggestions on a prior draft of this article.
Funding
We gratefully acknowledge funding from the National Science Foundation under Grant 2017044 and a pilot grant from the Berkeley Population Center, under NICHD Grant P2CHD073964.
1
Research on immigrant-oriented nonprofit organizations is starting to take off, with an almost 20-fold increase in scholarly publications on the topic from the 1980s to 2010s (Bloemraad, Gleeson, and de Graauw 2020:299–300).
2
Scholars in other countries use somewhat similar registries, such as financial data on registered charitable organizations in Canada (Chan 2014) or business association records in the Netherlands (Vermeulen 2006). In the United States, some researchers also consult state-level lists of incorporated entities (![]() ).
).
3
GuideStar is a data aggregator for the nonprofit sector.
4
As a point of comparison, ![]() reports 16 community organizations serving the Portuguese-origin community in metro Boston and 32 organizations oriented to Vietnamese-origin residents. It is likely that a number of these organizations are not formally registered as 501(c)3 groups, but even if half are, this would already tally to 24 nonprofits for only two national-origin groups, groups that constitute less than 10 percent of all immigrants in the Boston area.
reports 16 community organizations serving the Portuguese-origin community in metro Boston and 32 organizations oriented to Vietnamese-origin residents. It is likely that a number of these organizations are not formally registered as 501(c)3 groups, but even if half are, this would already tally to 24 nonprofits for only two national-origin groups, groups that constitute less than 10 percent of all immigrants in the Boston area.
5
6
One of the authors currently has a team of four research assistants coding nonprofits in three states. Evaluating a single organization based on name, mission, and information on a website might take 1 to 10 minutes. At an average of 5 minutes per organization, a human research assistant can code only 12 organizations an hour.
7
Given our interest in pattern recognition by name, we eliminated duplicate names from the data set (e.g., multiple “Toastmasters International” clubs).
8
An employer identification number (EIN) is a nine-digit number that the Internal Revenue Service (IRS) assigns businesses and organizations, including nonprofits (IRS, 2014). We use it as an identification key to match the organization to its NTEE code to test our classification strategies.
9
The would already have been deleted as a stopword.
10
The locally trained word2vec model (trained on our organization data set) used continuous bag-of-words (CBOW) to produce a distributed representation of words, converting the corpus to 300 dimension vectors. CBOW is computationally less expensive (faster) than skip-gram, and our corpus is of modest size, making this an adequate choice. (Testing both CBOW and skip-gram implementation, we find very similar results; differences between the results were smaller than .01.) The word2vec model is based on the “gensim” package, a common package in natural language processing in Python (![]() ).
).
11
After creating the embedding models, we want to understand how well these embeddings capture differences between immigrant-related and non-immigrant-serving organizations, but high-dimension vectors are extremely difficult to visualize. We thus apply t-distributed stochastic neighbor embedding to reduce the dimensionality of the organizational name vectors from the model with good performance (![]() ). To better observe the spatial distribution of those points, we applied an open-source interactive D3 plotting tool produced by Computational Approaches to Human Learning Research at the University of California, Berkeley. This tool helps researchers visualize the spatial distribution and information attached to each point.
). To better observe the spatial distribution of those points, we applied an open-source interactive D3 plotting tool produced by Computational Approaches to Human Learning Research at the University of California, Berkeley. This tool helps researchers visualize the spatial distribution and information attached to each point.
12
13
Another challenge lies in the visualization of results. We use Fast-BERT for our primary classification tasks and accuracy statistics. However, we use sentence-BERT to provide readers with a visualization of results because Fast-BERT cannot export its vectors into visualization designs. The accuracy of the two is very close (.02 lower for sentence-BERT; ![]() ).
).
14
We also compared other classification models, like random forest classifiers with fine-tuning, but the logistic regression performs best overall in our situation. The threshold used to binarize the predicted probabilities from the logit model is .5 because the probability of 1 and 0 should be equal for random guesses in our context. Although the long short-term memory (LSTM) and BERT classifications are built in the neural network, the classification function is still based on logistic regression due to the binary classification, but with slightly different optimization functions. Here, the LSTM’s activation function is sigmoid with a binary cross entropy loss function, and BERT uses softmax with negative log likelihood loss.
15
This accuracy metric would not be appropriate if our data set were not evenly balanced.
16
We focus on the accuracy metric because it is an easy, intuitive way to assess the success of classification guesses. We also calculated precision, recall, and F1 scores, reported in ![]() . These supplemental metrics tell a similar story of poorer performance with the validation data set for bag-of-word, term frequency-inverse document frequency, and W2V models and superior performance of Fast-BERT in both the test and validation data sets relative to all other methods.
. These supplemental metrics tell a similar story of poorer performance with the validation data set for bag-of-word, term frequency-inverse document frequency, and W2V models and superior performance of Fast-BERT in both the test and validation data sets relative to all other methods.
18
The Immigrant Civic Engagement Project data set did not include private family foundations by design; it is possible that careful human coding of such foundations could improve BERT’s ability to distinguish them.
19
For the NTEE method, we used the codes P84 (Ethnic & Immigrant Centers), Q71 (International Migration & Refugee Issues), R21 (Immigrants’ Rights), A23 (Cultural & Ethnic Awareness), and R22 (Minority Rights).
20
21
An example of subwords is Chinese, which may be split into several subwords such as chin, chine, ese, and so on.
22
23
One can imagine, for example, a project to track the diffusion of LGTBQ organizations that raises the issue of how to calibrate naming conventions across time and geography; for example, group naming conventions may be more cryptic in the 1970s (or in more conservative areas) compared to in the contemporary period (or in more progressive areas).