
Abstract
What kinds of taxation are most politically sustainable in a democracy? The authors answer this question by applying natural language processing and machine learning techniques to a large, new corpus of digitized documents describing municipal tax policies of heterogeneous design that have been directly subjected to popular referendum in the state of California. The authors find that tax policies of different description vary systematically in their popularity with voters. In particular, official textual summaries of tax policy differ along two social dimensions that are associated with voters’ willingness to approve the tax. The authors interpret these dimensions as risk pooling and community orientation and show that measuring these dimensions can modestly improve the ability to predict the popularity of a tax, relative to a conventional regression specification that omits information about qualitative policy design. The authors discuss implications for the study of the sociology of taxation.
One of the most vexing problems facing Congress in 2021, and one that has especially “bedeviled” congressional negotiators (Edmondson and Cochrane 2021), has been how to finance big, popular infrastructure and social policy bills without levying unpopular new taxes. Economic analysis has played very little role in these debates; as Alice Rivlin, the former director of the Congressional Budget Office, foresaw more than 30 years ago when she delivered a talk to the American Economics Association titled “The Continuing Search for a Popular Tax” (Rivlin 1989), the tax debates of the twenty-first century are “less concerned with the equity and efficiency of taxes than with their political acceptability.” Rivlin predicted that the search for a popular tax would require economists to apply “the tools of sociologists and psychologists to find out how people think about taxes and what kinds are least objectionable” (p. 113).
Which kinds of tax are least objectionable to voters? Since Rivlin posed this question, sociologists have acquired new tools for answering it. One such tool is a large, new corpus of digitized documents describing tax policies of heterogeneous design that have been directly subjected to popular referendum in the state of California (Martin, López, and Olsen 2017). Although some features of this setting may limit the generalizability of our results to other contexts, other features of this setting—including the size and political diversity of the state, the heterogeneity of its local governments, and the unprecedented availability of data on how the public votes on specific tax policy proposals—provide an opportunity to study variation in tax policy design. We also have new computational methods for the analysis of large corpora of texts and their associated quantitative metadata. By applying those new methods to these new data, we show that tax policies of different description vary systematically in their popularity. This approach does not tell us what voters think about taxes, but it provides an unprecedented opportunity to analyze how voters behave in response to taxes of different design and “what kinds are least objectionable” in the sense that voters, given the opportunity, are least likely to vote against them.
This approach makes possible a substantial advance over recent work in the social science of taxpayer consent (see reviews in Campbell 1993; Martin, Mehrotra, and Prasad 2009; Martin and Prasad 2014). Social scientists have documented substantial variation in how voters respond to taxation, including municipal taxation (Martin, López, and Olsen 2019; Pearson 2014; Williamson 2017). Most studies have focused on features of social context that can affect tax attitudes—such as employment insecurity (Barnes 2014; Dodson 2017), racial diversity (O’Brien 2017), and partisan polarization (Campbell 2014)—rather than the features of a tax policy itself that may make it more or less politically acceptable. The policies themselves, however, may encode cultural and institutional logics that may affect their political acceptability (see, e.g., McCabe and Berman 2016), and the politically salient features of a policy may not be adequately described in public opinion polls. By analyzing a large and heterogeneous population of tax policies, we are able to identify features associated with the most popular tax policies and the conceptual dimensions that distinguish those policy features from others.
Our application of machine learning to the analysis of policy text proceeds in two steps. First, we validate our approach to “text as data” (Grimmer and Stewart 2013) by showing that a simple clustering algorithm applied to textual policy descriptions yields a meaningful classification of tax policies, corresponding to types of municipal taxation that other studies have found to be most politically salient. Second, we use a supervised learning algorithm to identify dimensions that distinguish among these policies in an abstract conceptual space. Our aim is to go beyond a mere catalogue of popular and unpopular types of taxation. By abstracting from particular policy types to dimensional concepts, we hope to contribute to greater theoretical understanding of what it is about particular types of policy that may conduce to more or less voter support.
We find that tax policy proposals differ along two interpretable dimensions that are associated with taxpayer consent. The first dimension, which we call risk pooling, distinguishes between popular policies that socialize the risk of social exclusion and unpopular policies that individualize the costs of social inclusion. The second dimension, which we call community orientation, distinguishes between popular taxes on residency associated with the town and unpopular taxes on commercial activity associated with the city. These are analytical distinctions we have inferred from a comparison of texts, rather than emic distinctions drawn by the voters themselves, and it is certainly possible that voters might use different labels for these dimensions or might associate these policy features with additional beliefs (e.g., about the incidence of different taxes, about the partisan valence of different proposals, or about who benefits from the public spending associated with a given tax) that could affect their opinions of these policies. Instead of attempting to identify how individual voters make meaning of policy texts, we focus on how voters in the aggregate behave in response to those texts, and, in particular, whether a policy with given characteristics attracts more votes. We show that measuring just these two dimensions of policy variation can modestly improve our ability to predict the popularity of a tax at the ballot box, relative to a conventional regression specification that omits information about qualitative policy design. We conclude with some suggestions for the application of machine learning to Rivlin’s search for a popular tax.
Why Social Scientists Do Not Know Much about How to Write a Popular Tax
Despite widespread agreement that some taxes may be more politically tolerable than others, there has emerged little consensus on the precise characteristics of taxes that render them popular. Consider, for example, the U.S. federal payroll tax authorized by Title VIII of the Social Security Act of 1935, which finances Old Age Insurance. Social scientists generally agree that this tax is comparatively popular, but they point to different features of the policy to explain its popularity. Scholars have suggested variously that the Social Security payroll tax is comparatively popular because it is called a “contribution” rather than a tax (Ikenberry and Skocpol 1987:412); because, as tax on payroll, it symbolically associates the program with the dignity of work (Steensland 2008:13–14); because it is earmarked for people regarded as deserving of benefits (Campbell 2003:6); because it can be withheld from paychecks inconspicuously (Williamson 2017:56–58); or because its incidence is obscured by the nominal splitting of the tax burden between employees and employers (McCaffery 1994:1878–80). These hypotheses are not mutually exclusive, but they are different. If we wish to draw any implications from this case for the design of other tax policies, it is important to understand precisely which of these features of the payroll tax, perhaps among others, account for its comparative popularity.
Social scientists who examine questions such as these often have attempted to isolate the effects of particular policy features through “framing” interventions that draw attention to some of those features, while taking the policy design itself to be fixed. Experimental studies have focused, for example, on whether the same levy will induce different behavior if it is described as a “tax” or as a “payment” (McCaffery and Baron 2006) or whether survey respondents react differently to the same policy when it is described as a “death tax” or an “estate tax” (Sides 2016). Research designs such as these rely on a distinction between the effective policy text and the words used to frame it in a particular interaction. Such studies may reveal effects of “crafted talk” about tax policy in the course of a political campaign (Graetz and Shapiro 2005; Jacobs and Shapiro 2000) but may have little to say about the effects of “policy crafting” (Martin 2010) or the framing encoded in the policy design itself. Rather than testing the effects of policy design, these studies test the effects of public relations spin applied after the basic policy design has been decided.
Other studies have attempted to isolate the relevant dimensions of policy design experimentally, by means of paired comparisons that hold many policy features constant (e.g., McCaffery and Baron 2006; Pampel, Andrighetto, and Steinmo 2019). The best of these studies provide convincing causal inferences, but it can be difficult to abstract theoretical conclusions from them, because they compare few policies at a time and rely perforce on extremely abridged descriptions of those policies. Haselswerdt and Bartels (2015), for example, showed experimentally that respondents in a representative sample of U.S. adults preferred public benefits described as “reducing their tax burden” to equivalent benefits described as “a cash payment from the government” p. 611). We might wonder whether this effect is best interpreted as a response to taxes in general, personal taxes, or income taxes in particular; to assumptions respondents may have made about implementation or administration of the benefits; or to some other perceived difference between a cash benefit and a tax break. Each of these hypotheses could be tested in turn, but an exhaustive experimental search of the policy design space is unfeasible. To narrow the search, we require an analytical description of the relevant dimensions of policy variation.
Still other, observational studies have attempted to specify the relevant dimensions by comparing how people respond politically to multiple categories of taxation (e.g., Martin et al. 2019; Williamson 2017). Even the best recent studies compare only a few categories at a time. Campbell (2018), for example, compared survey responses given by American adults evaluating the fairness of eight kinds of taxation, corresponding to a conventional classification in revenue statistics; Martin and Gabay (2018) similarly compare frequencies of reported protest against eight kinds of taxation, using nearly the same categories. These studies draw plausible inferences, but their theoretical usefulness may be limited by their reliance on a relatively crude administrative classification of taxes. The curse of dimensionality in such research designs applies to the number of kinds of taxes that are compared; even eight categories of taxation is too few to span the theoretical space of potentially relevant policy characteristics.
Social scientists who have relied on theoretical criteria to identify politically relevant dimensions of policy design at a greater level of generality—such as Pierson’s (1993) two dimensions of “visibility” and “traceability” (see Arnold 1991; Wilensky 1976)—have typically abstracted so far from any observable characteristics of policy that their arguments are difficult to operationalize. It is not obvious how to identify which taxes are “visible” or “traceable” from the policy text alone, for example, and scholars applying these abstractions have often relied on untested measurement assumptions (see, e.g., Martin and Gabay 2018; Roosma, van Oorschot, and Gelissen 2016; Wilensky 2002). At worst, this practice can lead to circular arguments, as when scholars assert that voters resist the personal income tax because it is “visible” and then adduce, as evidence of its visibility, studies showing that voters resist it (see, e.g., Hibbs and Madsen 1981; Prasad 2005).
We aim to make headway on Rivlin’s question by taking an alternative, inductive approach to describing kinds of taxation that may be more or less popular. We treat the problem as fundamentally one of data availability. As long as social scientists limit ourselves to comparisons of a few policies at a time, it will be difficult to isolate the features of those policies that make a difference to their popularity, let alone to know whether the features we have isolated are really those that would make the greatest difference outside of the experimental setting or the survey encounter. Our approach is therefore to measure political responses to a large corpus of policies that vary along multiple dimensions.
Our focus, like Rivlin’s, is on the search for characteristics of taxes that are popular in the sense that they can be politically sustained in a democracy. We therefore focus on “popularity” as expressed in the share of affirmative voters at the ballot box in a referendum election. The aggregate vote in a policy referendum may differ from other measures of policy attitudes in the adult public: voters are a nonrandom subset of the population, whose policy attitudes may be unrepresentative of the public at large, and the yes-or-no votes that voters cast at the end of an election campaign may differ from the policy attitudes that even the same individuals would express in another context, with different information, or with a different array of policy options before them. For all of these reasons, it would be a mistake to assume that the tax that is most popular with voters on election day is the tax that would be most popular in another deliberative context such as an experiment or a public opinion poll. It is also important to note that the issues presented to voters for referendum elections also are not a representative sample from the universe of possible tax policies, however that universe might be imagined, nor are they presented to voters wholly at random, any more than the issues selected for public opinion polling are a random or representative sample of possible tax policies. It is therefore safe to assume that the implicit sample selection process involved in the decision to put a measure on the ballot may affect the analysis of voting on referendum measures. There is no reason, however, to suspect that this selection process is any more problematic than the implicit sample selection involved in the analysis of public opinion polls, which tend to focus on only a few high-salience issues that already have been selected for the issue agenda in a particular time and place (see Burstein 2014). For all of these reasons, the observation of which tax policies survive referendum elections may be at least as informative as experiments or public opinion polls about which tax policy characteristics can be politically sustained in a democratic system.
A Computational Analysis of California Municipal Tax Measures
California provides a unique opportunity to implement this approach. In 1978, an amendment to the state constitution (Proposition 13) required most California municipalities to submit certain kinds of tax increases to the voters for approval; in 1996, another such amendment (Proposition 218) effectively generalized this requirement to every category of local taxation in every municipality in the state. In the intervening years, municipal governments have put hundreds of tax policies to a popular vote. Some categories of taxation are not represented in this corpus of proposed policies because state law forbids their use by local government: most notably, local governments may not levy personal income taxes (California Revenue and Taxation Code § 17041.5), estate taxes (California Revenue and Taxation Code § 13301), or any ad valorem property taxes in excess of the constitutional maximum rate (California Constitution, article XIII D, § 3). Nevertheless, the creativity of California’s local officials within these constraints has been considerable, and the taxes proposed to voters by California municipalities since 1996 are quite diverse with respect to various policy features that have attracted attention from political sociologists and behavioral economists. The list includes taxes that were described to voters as “service charges,” “fees,” “assessments,” and, of course, “taxes”; taxes on payroll, retail sales, business receipts, parcels of real estate, and utility consumption, among other things; taxes that are earmarked for purposes as diverse as parks and paramedical services and taxes that are not earmarked; graduated taxes, flat taxes, and lump-sum taxes; taxes on luxury goods and services, whose incidence may be assumed to be progressive, and taxes on utilities, whose incidence may be assumed to be regressive; taxes that are borne by legally liable taxpayers and taxes whose costs can be passed along to customers or employees; and taxes that vary in many other respects. If policy characteristics such as these matter to voters, then we might expect to find variation in voters’ willingness to approve municipal taxes in California.
Our analysis focuses on a subset of 848 municipal tax proposals put to voters in 330 cities and towns from 1996 to 2010. The average tax proposal in this sample was favored by 57.6 percent of the voters who cast ballots on the question; the affirmative vote share ranged from 5.8 percent to 96.1 percent, and the standard deviation was 15.3 percentage points. For each proposal, we collected, digitized, and cleaned the “impartial analysis” provided by mail to voters, which is a summary of no more than 500 words, “showing the effect of the measure on the existing law and the operation of the measure,” required by state statute, and prepared, except in unusual cases, by the city attorney (see California Elections Code § 9280). Although this summary does not form part of the statutory text, it is a statement of policy presented to the final legislative decision makers, and its accuracy and impartiality may be litigated. Decades of case law—and the reasonable expectation that proponents and opponents both will monitor the text of this summary and may contest it in the courts—limits the creativity of city attorneys when it comes to characterizing the features of a tax proposal in an impartial analysis (see Jenkins 2015). To survive scrutiny, an impartial analysis must focus on the policy design features that a court would regard as important, and there is comparatively little room for two different impartial analyses to frame a policy differently if the legally consequential design features of the two underlying policies are otherwise identical. Our sample includes every proposal to introduce, continue, or increase a tax, for which we could locate the impartial analysis in the documentary record that survives in county or city archives. We excluded proposals to issue municipal bonds, because such measures are subject to different legal rules from tax measures, and may elicit different political behavior. 1
We cast a broad net for relevant policy design features, by using machine learning methods to identify any aspects of policy design revealed in the semantic features of the impartial analysis text that were associated with the affirmative vote share. We preprocessed the corpus of text for analysis in several steps. First, we converted words into tokens, which were standardized in lower case and stemmed into their root or base form (following Porter 1980). We expanded common abbreviations, such as “UUT” for “utility users’ tax,” and removed “stop words,” including the names of cities and individuals, along with a corpus of common English-language stop words provided with the Natural Language Tool Kit (see Bird, Klein, and Loper 2009) that provide little semantic information for distinguishing texts. We also removed any term that appeared in fewer than three documents. After all of these preprocessing steps, our corpus contained 1,557 unique terms.
The next step was to convert each text into a vector representation. We computed the frequency of each term in each document and weighted these term frequencies by the inverse of the frequency of documents containing the term across the corpus, so that each text could be represented as a vector of term-frequency-inverse-document-frequency (TF-IDF) weights. This so-called bag-of-words representation takes into consideration the occurrence of each term within a document and the rarity of the term across the entire corpus; words that occur frequently within a document but infrequently across the entire corpus will have the largest weights. We represent each impartial analysis as a vector in semantic space, and the entire corpus of policy text as an 848-by-1,557 document-term matrix of TF-IDF weights. Although our vector representation of policy text associates a quantitative weight with each individual term, we do not attempt to model the effects of individual words; instead, we treat TF-IDF weights as input for a holistic characterization of the policy. The presence and frequency of particular words can provide us with clues as to whether a proposed policy is a hotel tax or a sales tax, for example, and those different kinds of taxes may provoke different political responses. The holistic assumption that the document is the relevant unit of meaning distinguishes our approach from other methods, such as “word embedding” algorithms, that aim to represent the individual words themselves as points in semantic space and that treat a small set of nearly adjacent words, rather than a whole document, as the relevant semantic context (cf. Kozlowski, Taddy, and Evans 2019).
Our analysis of these data proceeds in two stages. In the first stage, we assess whether this method can reproduce qualitative results concerning which features of public policy are politically salient. We begin with a simple k-means clustering algorithm that identifies documents that are closest in semantic space (see Elkan 2003). We select k = 5 clusters, following Martin et al. (2019), who used interpretive judgment to classify California municipal taxes into five categories. We assess the face validity of the five-cluster classification by inspecting the documents associated with each cluster and the terms that most distinguish that cluster. The test of face validity is interpretive: whether or not a cohesive cluster of documents in the semantic space corresponds to a legally or administratively meaningful type of tax. We then assess the predictive validity of the classification by testing whether membership in a cluster is a statistically significant predictor of the share of voters who favor the policy in question. Our aim at this stage is to test our approach to the quantitative representation of tax policies, by ascertaining whether an unsupervised algorithm applied to the matrix of TF-IDF weights can reproduce qualitative patterns that are known from the literature.
In the second stage of our analysis, we exploit the power of machine learning to go beyond what is already known from the literature. Our aim at this stage is to proceed from the classification of policies to a characterization of the dimensions that distinguish them in conceptual space. To that end, we fit a supervised principal-component analysis (PCA). In contrast to probabilistic topic models, PCA is a simple algebraic technique that entails no assumptions about such matters as the number of latent “topics” or the functional form of their probability distributions; in contrast to word embedding models, whose estimation typically requires computationally expensive neural networks, our PCA factors the document-term matrix using a comparatively simple singular value decomposition algorithm, rendering computation comparatively fast and cheap. It yields a basis transformation of the document-term matrix, so that each text, instead of being represented as a single vector of TF-IDF weights, is represented as a linear combination of vectors called principal components. In a high-dimensional setting, when the principal components are intended as predictors in a regression model, the consistency of the regression estimator can be improved by selecting only a subset of terms for inclusion in the PCA, on the basis of the strength of their correlation with the outcome variable; this is supervised PCA (Bair et al. 2006).
Our application of supervised PCA proceeds as follows. Let y be the affirmative vote share, and let
Our measure of model fit is the square root of the leave-one-out cross-validation statistic, which is the average of n squared prediction errors computed by fitting the model to n unique subsamples of n – 1 observations each, and using the results of each of these n implementations to predict the value of y for the omitted observation. We report the square root of this statistic below as the root mean squared error (RMSE).
Once we have identified meaningful principal components, the final step is to test whether knowledge of these components improves our ability to predict the popularity of a tax. We establish a baseline by fitting linear regression models of the affirmative vote share y on contextual covariates that include the home ownership rate, the share of the population that is Black, the share of the population that is Latinx, the share of the population with four-year college degrees or more education, the population (logged), the median household income (logged), and municipal tax revenues per capita (logged) (data from Martin et al. 2019). Our baseline model also controls for the share of the municipal electorate that voted Republican in the last presidential election, standardized across candidates by subtracting the national Republican share of the vote in the last presidential election, and imputed to off-year elections by linear interpolation; this measure of partisanship has been shown to predict some dimensions of municipal tax policy (see Einstein and Kogan 2016). We also estimate fixed-effects models with implicit city-level intercepts (to adjust for unmeasured, time-constant differences among cities in their propensity to favor certain policies) and a dummy variable for each year (to adjust for unmeasured differences over time that might be assumed to affect all municipalities similarly, such as differences in turnout between presidential and off-year elections). Rivlin’s search for a popular tax aimed to identify a tax policy design that was consistently popular, regardless of partisan context. We approximate this search by testing whether principal components of policy design improve the predictive performance of a linear regression model relative to our baseline regression specification.
The promise of this method is to produce not only a list of popular taxes, of which there are many in this sample, but also an inductive characterization of dimensions of policy design that make the greatest difference for whether a tax is popular. The null hypothesis that there are no such dimensions is also plausible. A municipal tax referendum presents voters with a dichotomous choice. Assuming that voters compare a proposed tax policy with the status quo, we might expect that it is the popularity of the status quo, rather than the policy of the proposed tax increase, that drives the decision (see Romer and Rosenthal 1978). If a city voter is well satisfied with the current level of municipal public goods provision, for example, then that voter may be motivated to oppose a tax increase, regardless of the policy details. If a voter is dissatisfied with the current level of public goods provision, and wishes for greater municipal spending, then that voter may have no option but to support the tax increase—again, regardless of its precise details. There is no reason to assume a priori that any qualitative policy details will matter for the popularity of a tax increase, relative to the status quo.
Varieties of Tax Policy
We find that the vector representation of impartial analysis documents can indeed produce a meaningful classification of tax policies. We begin with a k-means cluster analysis of the term-document matrix. Table 1 summarizes our five-cluster solution in a form suitable for interpretation, by listing the terms that have the greatest average TF-IDF weights within each cluster. These clusters correspond clearly to types of taxation that are distinct in California law and in local tax policy discourse (see Ingenito et al. 2007), providing support for our assumption that impartial analyses capture the major features of policy design that are encoded in local ordinances. There is one cluster each corresponding to the categories of sales tax, transient occupancy tax, business license tax, real estate parcel tax, and utility users’ tax.
Five-Category Classification of California Municipal Tax Measures on the Basis of k-Means Clustering Applied to a Term-Document Matrix of Impartial Analysis Texts.

These categories of taxation are not only legally and semantically distinct from one another, they are also politically salient. To assess the predictive validity of this classification, we regressed the affirmative vote share, measured in percentage points, on a vector of dummy variables representing these clusters of tax policy. Table 2 reports the unstandardized coefficients of the dummy variables, with utility users’ taxes as the reference category. The first and second columns report coefficients and standard errors from a spare ordinary least squares model that includes only the dummy variable for each cluster. The pattern of coefficients indicates that real estate parcel tax received the greatest share of affirmative votes, followed, in order, by business license taxes, transient occupancy taxes, sales taxes, and utility users’ taxes. This rank order corresponds to the pattern reported by Martin et al. (2019:16) in a human-classified data set that applied a similar classification scheme to California municipal tax measures over the same period. (Although Martin et al. did not classify business license taxes separately, they included these in a residual “other or multiple” category that was second to real estate parcel taxes in popularity.) The third and fourth columns of Table 2 report the coefficients and standard errors of the same dummy variables from a fixed-effects regression model that includes controls for contextual covariates, with dummy variables for year and implicit city-level intercepts. The coefficients of this model can be read as expected differences in the affirmative vote share across policies of different types within the same city and year. The coefficients for parcel tax, transient occupancy tax, and sales tax remain comparatively large and sharply estimated. The type of tax policy that was proposed, as inferred solely from quantitative information about the co-occurrence of terms in the city attorney’s impartial description, was predictive of its relative popularity in a referendum election. The most popular type of tax policy proposal, a business license tax, could expect a greater affirmative share of the vote by 8.0 percentage points than the least popular type, a utility users’ tax (cf. Martin et al. 2019). In these fixed-effects models, the coefficients of other variables are generally not distinguishable from zero, as indicated by the large standard errors; such contextual variables as the homeownership rate, the standardized Republican vote share, and the percentage of residents who are Black all distinguish among municipalities, but they do not much distinguish between successful and failed tax referendum elections within a given municipality, on average, which is the comparison represented by these models.
Unstandardized Coefficients and Standard Errors from Regression Models of the Affirmative Vote Share on the Category of Taxation, in California Municipal Ballot Measures Proposing Tax Increases.

Note: FE = linear regression models with dummy variables for years and a “fixed effects” adjustment that introduces an implicit, fixed intercept for each city; OLS = linear regression models fit by ordinary least squares; RMSE = root mean squared error from leave-one-out cross-validation.
This cluster analysis validates our quantitative representation of policy text and yields evidence that some kinds of taxation are indeed more popular than others on average. But what is it about those policies that makes them more popular with voters? Having established that a highly simplified quantitative representation can encode legally meaningful and politically salient differences among tax policy proposals, we turn now to supervised PCA to identify the dimensions that distinguish popular from unpopular tax policies.
The Dimensions of Tax Policy: Risk Pooling and Community Orientation
Our supervised PCA algorithm yields a simplified representation of policies in terms of a few dimensions that reliably predict the popularity of a tax. The PCA solution that minimizes out-of-sample prediction error (RMSE = 14.7) includes 196 terms from the policy documents and summarizes their associated TF-IDF weights with two principal components. We describe these components in Figure 1, which is a scatterplot of all 196 terms in the vector space spanned by the two principal components. Each term is centered on coordinates that correspond to its factor loadings, which may be understood as the multipliers that would be applied to TF-IDF weights to represent the position of a given policy description in this vector space. To increase readability, we multiplied factor loadings by 100 and applied an inverse hyperbolic sine transformation to adjust the skewness of the distribution for ease of visualization (see Burbidge, Magee, and Robb 1988; Johnson 1949). Words that are closest to each other in this two-dimensional space are words that tend to co-occur in the same tax policy proposal; words that are farthest apart are words that tend most clearly to distinguish tax proposals from one another. We have highlighted illustrative terms to improve the legibility of the scatterplot and facilitate interpretation.

Scatterplot of 196 tax policy terms in a vector space spanned by the principal components risk pooling and community orientation, with illustrative terms highlighted; n = 848 municipal tax policy proposals.
We label the first principal component risk pooling. This concept designates a policy that raises funds from a category of persons who are at common risk for a particular kind of misfortune and allocates those funds to mitigate the misfortune for those who experience it. The use of municipal finance to pool risk is a key component of what Castells (1983) described as “collective consumption”: the “collective demand for a good city as a social service to which all citizens were entitled” (p. 316). The determination that a measure pools risk requires information about both how the revenue is raised and how it is spent; risk pooling involves both the categorical allocation of the fiscal burden and the ostensible earmarking for safety net spending of some kind. The paradigmatic example at the federal level is a social insurance program such as Old Age Insurance: funds are raised from people in certain occupational categories and spent to mitigate poverty and social exclusion in old age for people in those categories. At the municipal level, Castells identified public “housing, schools, health centres and cultural amenities” (p. 316) as examples of collectively financed and produced goods that mitigate the risks for economic insecurity in a capitalist economy. The opposite of a policy that pools risk would be a policy that assigns the cost of mitigating misfortune to the individual.
The component we call risk pooling distinguishes between taxes that socialize risk and taxes that individualize it. The terms that load positively on this component indicate special taxes, a term of art in California law for taxes that are earmarked, and most especially those dedicated to such purposes as paramedical and medical services. The taxes that score most positively on this dimension also are taxes on real estate, distinguished by such terms as parcel, unit, and square feet. An example of a measure that scores very positively on this dimension would be the taxation of town residents to pay for local ambulance services; such a policy follows a classic risk-pooling insurance model and could reasonably be described as a local form of social insurance. It is a tax on all residents of a community in exchange for concentrated benefits available to those residents who experience medical misfortune. 2 Perhaps unsurprisingly, the term insure and its cognates also load positively on this dimension, although this is not among the strongest loadings. By contrast, the terms that load negatively on risk pooling are associated with flat-rate utility users’ taxes. They include such terms as utility, user, electricity, telephone, television, cable, and water. Utility users’ taxes are, in effect, mandatory price increases on goods whose consumption is indispensable for social life. They individualize the costs of social exclusion by requiring households to bear the risk for future price increases for such necessary resources as heat and water. In this sense, they may be conceptualized as the mirror image of social insurance. We note that both parcel taxes for ambulance service and utility users’ taxes for the general budget are similar in many other respects. For example, both are local taxes; both are conventionally (and correctly) understood as regressive taxes; and both may be regarded as indirect taxes, insofar as the cost of both may be passed along to tenants in the rent charged by a landlord. They offer a clear contrast, however, with respect to how they socialize or individualize the costs of social inclusion.
We label the second principal component community orientation. We intend the term to resonate with Tönnies’s ([1887] 1957) classic theoretical distinction between two systems of positive law, which he called “community” and “society,” respectively. Community, in Tönnies’s conceptual scheme, expresses the shared values of neighbors who live together in a small settlement; it is “based on land ownership” (p. 223), is administered with little bureaucracy, and attains its most developed form in the town (p. 227). The conceptual opposite of community is society, a system of law that “derives from the conventional order of trade and similar relations” (p. 223); this form of law is based on commercial relations among strangers, is administered by a bureaucratic state, and emerges “only when the town develops into the city” (p. 227).
In our data, we apply the name community orientation to a dimension that distinguishes taxes on town residency from taxes on city commerce. The term with the strongest positive loading on this dimension is town; the term with the strongest negative loading is city. Legally, these are interchangeable terms in California (see California Government Code § 34502), but symbolically, they evoke a contrast between the bedroom communities of the exurban fringe and the denser settlements of the urban core. Taxes that score positively on this component tend to target residency rather than commercial activity; all of the 30 measures that are most associated with this component are parcel taxes or utility taxes that target residents. The terms residential and non-resident both load positively on this dimension: policies that score high on community orientation tend to discriminate explicitly between residents and nonresidents. The terms that load positively also indicate special purposes such as paramedical services, police and fire protection, street and park maintenance, and deficit reduction. Taxes that are negatively associated with community orientation, by contrast, are general purpose taxes (as indicated by terms such as general and government) on commercial activity (as indicated by such terms as percent and rental), especially on forms of commerce that may be morally contested or disreputable (as indicated by such terms as marijuana and cardroom). This dimension evokes a symbolic contrast between the moral order of the residential town and the amoral legal order of the commercial metropolis.
The two dimensions of risk pooling and community orientation allow us to go beyond a mere typology of tax policy proposals, by representing the relationships among types of tax policy as well as relationships among additional policy features that are not captured in our simple five-category typology. Figure 2 illustrates the relationships among our five clusters of tax policy proposals, by plotting each cluster in the space spanned by the two dimensions of risk pooling and community orientation. Despite the radical simplification involved in reducing a 1,557-dimensional representation of policy to a 2-dimensional plane, the clusters remain clearly distinct from one another. The graph also reveals systematic relationships among them.

Scatterplot of 848 tax policy proposals in a vector space spanned by the principal components risk pooling and community orientation, with clusters of tax policy highlighted in blue.
As our description of risk pooling has already suggested, this dimension most clearly distinguishes real estate parcel taxes from utility users’ taxes, revealing them to be not only different types but also, in at least this sense, conceptual opposites to each other. The other types of taxation occupy intermediate positions with respect to risk pooling. Conceptually, these other local taxes neither fully pool risk to support social services, nor completely individualize the costs of social inclusion, although most types of local taxation involve some collectivization of risk insofar as they support public goods. The greatest values of community orientation are exhibited by some real estate parcel taxes—the paradigmatic taxes on town residence rather than urban commerce—but as a group, real estate parcel taxes exhibit a wide range of values with respect to community orientation, and many utility users’ taxes are also positively community oriented. The taxes that are lowest in community orientation are generally sales taxes, transient occupancy taxes, and business license taxes, all of which are, indeed, types of taxation associated with urban commerce. The graph illustrates that types of taxation that we previously found to differ in popularity are also conceptually distant from each other with respect to the two dimensions we have identified.
The representation of tax policy proposals in terms of risk pooling and community orientation also improves our ability to predict which of these proposals will be popular. We fit a series of regression models of the affirmative vote share, treating the two principal components of risk pooling and community orientation as predictors. For comparison, we also report the RMSE for models that represent the type of tax policy as a categorical variable, corresponding to the five-category classification we have already introduced. We report our measure of out-of-sample prediction error, the RMSE from leave-one-out cross-validation, in Table 3; the full sets of coefficients and standard errors may be found in Tables A1 through A3 in the Appendix. The first column of Table 3 presents the results from baseline models with no control variables. In such a model, the representation of tax policy in terms of risk pooling and community orientation yielded an RMSE of 14.7, compared with 14.9 for a similar model that represented tax policy as a set of five categories. Including both sets of variables yielded an RMSE of 14.7, suggesting that there is no advantage to including dummy variables for the type of taxation if one is already measuring the degree of risk pooling and community orientation. The second column of Table 3 reports the results of models that control for the political, social and fiscal context. With this specification, a model that represented tax policy in terms of the two principal components (RMSE = 14.1) performed very slightly better than a model that represented tax policy in terms of five categories (RMSE = 14.2). The final column reports results of fixed-effects models that include implicit city-level intercepts and year dummy variables. In this specification, both representations of tax policy performed comparably (RMSE = 10.4).
RMSEs from Regression Models of Affirmative Vote Share with and without FE (n = 848 Tax Measures).

Note: Contextual covariates include the home ownership rate, the share of the population that is Black, the share of the population that is Latinx, the share of the population with four-year college degrees or more education, the population (logged), the median household income (logged), and municipal tax revenues per capita (logged). FE = models with dummy variables for year and a “fixed effects” adjustment that introduces an implicit, fixed intercept for each city.
In short, these two ways of measuring tax policy both have similar predictive validity. Our description of tax policy in terms of the two principal components of risk pooling and community orientation is based on the same documents, and summarizes much of the same information, as our descriptive classification of tax policies into the five categories of utility users’ tax, parcel tax, business license tax, transient occupancy tax, and sales tax. But faced with a choice between these two ways of representing a tax policy, the conceptual representation in terms of the two continuous dimensions of risk pooling and community orientation is more concise, more closely related to theoretical concepts in political sociology, and slightly more predictive of actual political outcomes.
Policy Design and Political Context
Just how closely are risk pooling and community orientation related to voters’ support for tax policy proposals? Table 4 reports coefficients and standard errors from a series of linear regressions of the affirmative vote share on the two principal components in our full population of 848 tax measures. Because the two dimensions of risk pooling and community orientation are measured in a semantic space whose units are difficult to interpret, we have z-standardized these two variables for ease of interpretation; their coefficients can be read as percentage points of the vote associated with a 1 standard deviation difference in the relevant principal component. All other covariates are measured in more easily interpretable units, and we therefore leave them unstandardized, so that their coefficients can be read as percentage points of the vote associated with a one-unit difference in the relevant covariate. All standard errors in the table are clustered at the city level. The first column represents coefficients from a specification without any control variables. A difference of 1 standard deviation in risk pooling is associated with a difference of 3.6 percentage points in the share of voters approving a tax. A difference of 1 standard deviation in community orientation is associated with a difference of 2.6 percentage points in the share of voters approving a tax. The second model reported in this table introduces control variables for contextual covariates. In this specification, too, both risk pooling and community are associated with the affirmative share of the vote, and both coefficients are estimated with relatively small standard errors; a difference of 1 standard deviation in risk pooling is associated with a difference of 2.9 percentage points in the share of voters approving a tax, and a difference of 1 standard deviation in community orientation is associated with a difference of 1.8 percentage points in the share of voters approving a tax.
Unstandardized Coefficients and Standard Errors from Regression Models of the Affirmative Vote Share on Two Dimensions of Policy Design, in California Municipal Ballot Measures Proposing Tax Increases.
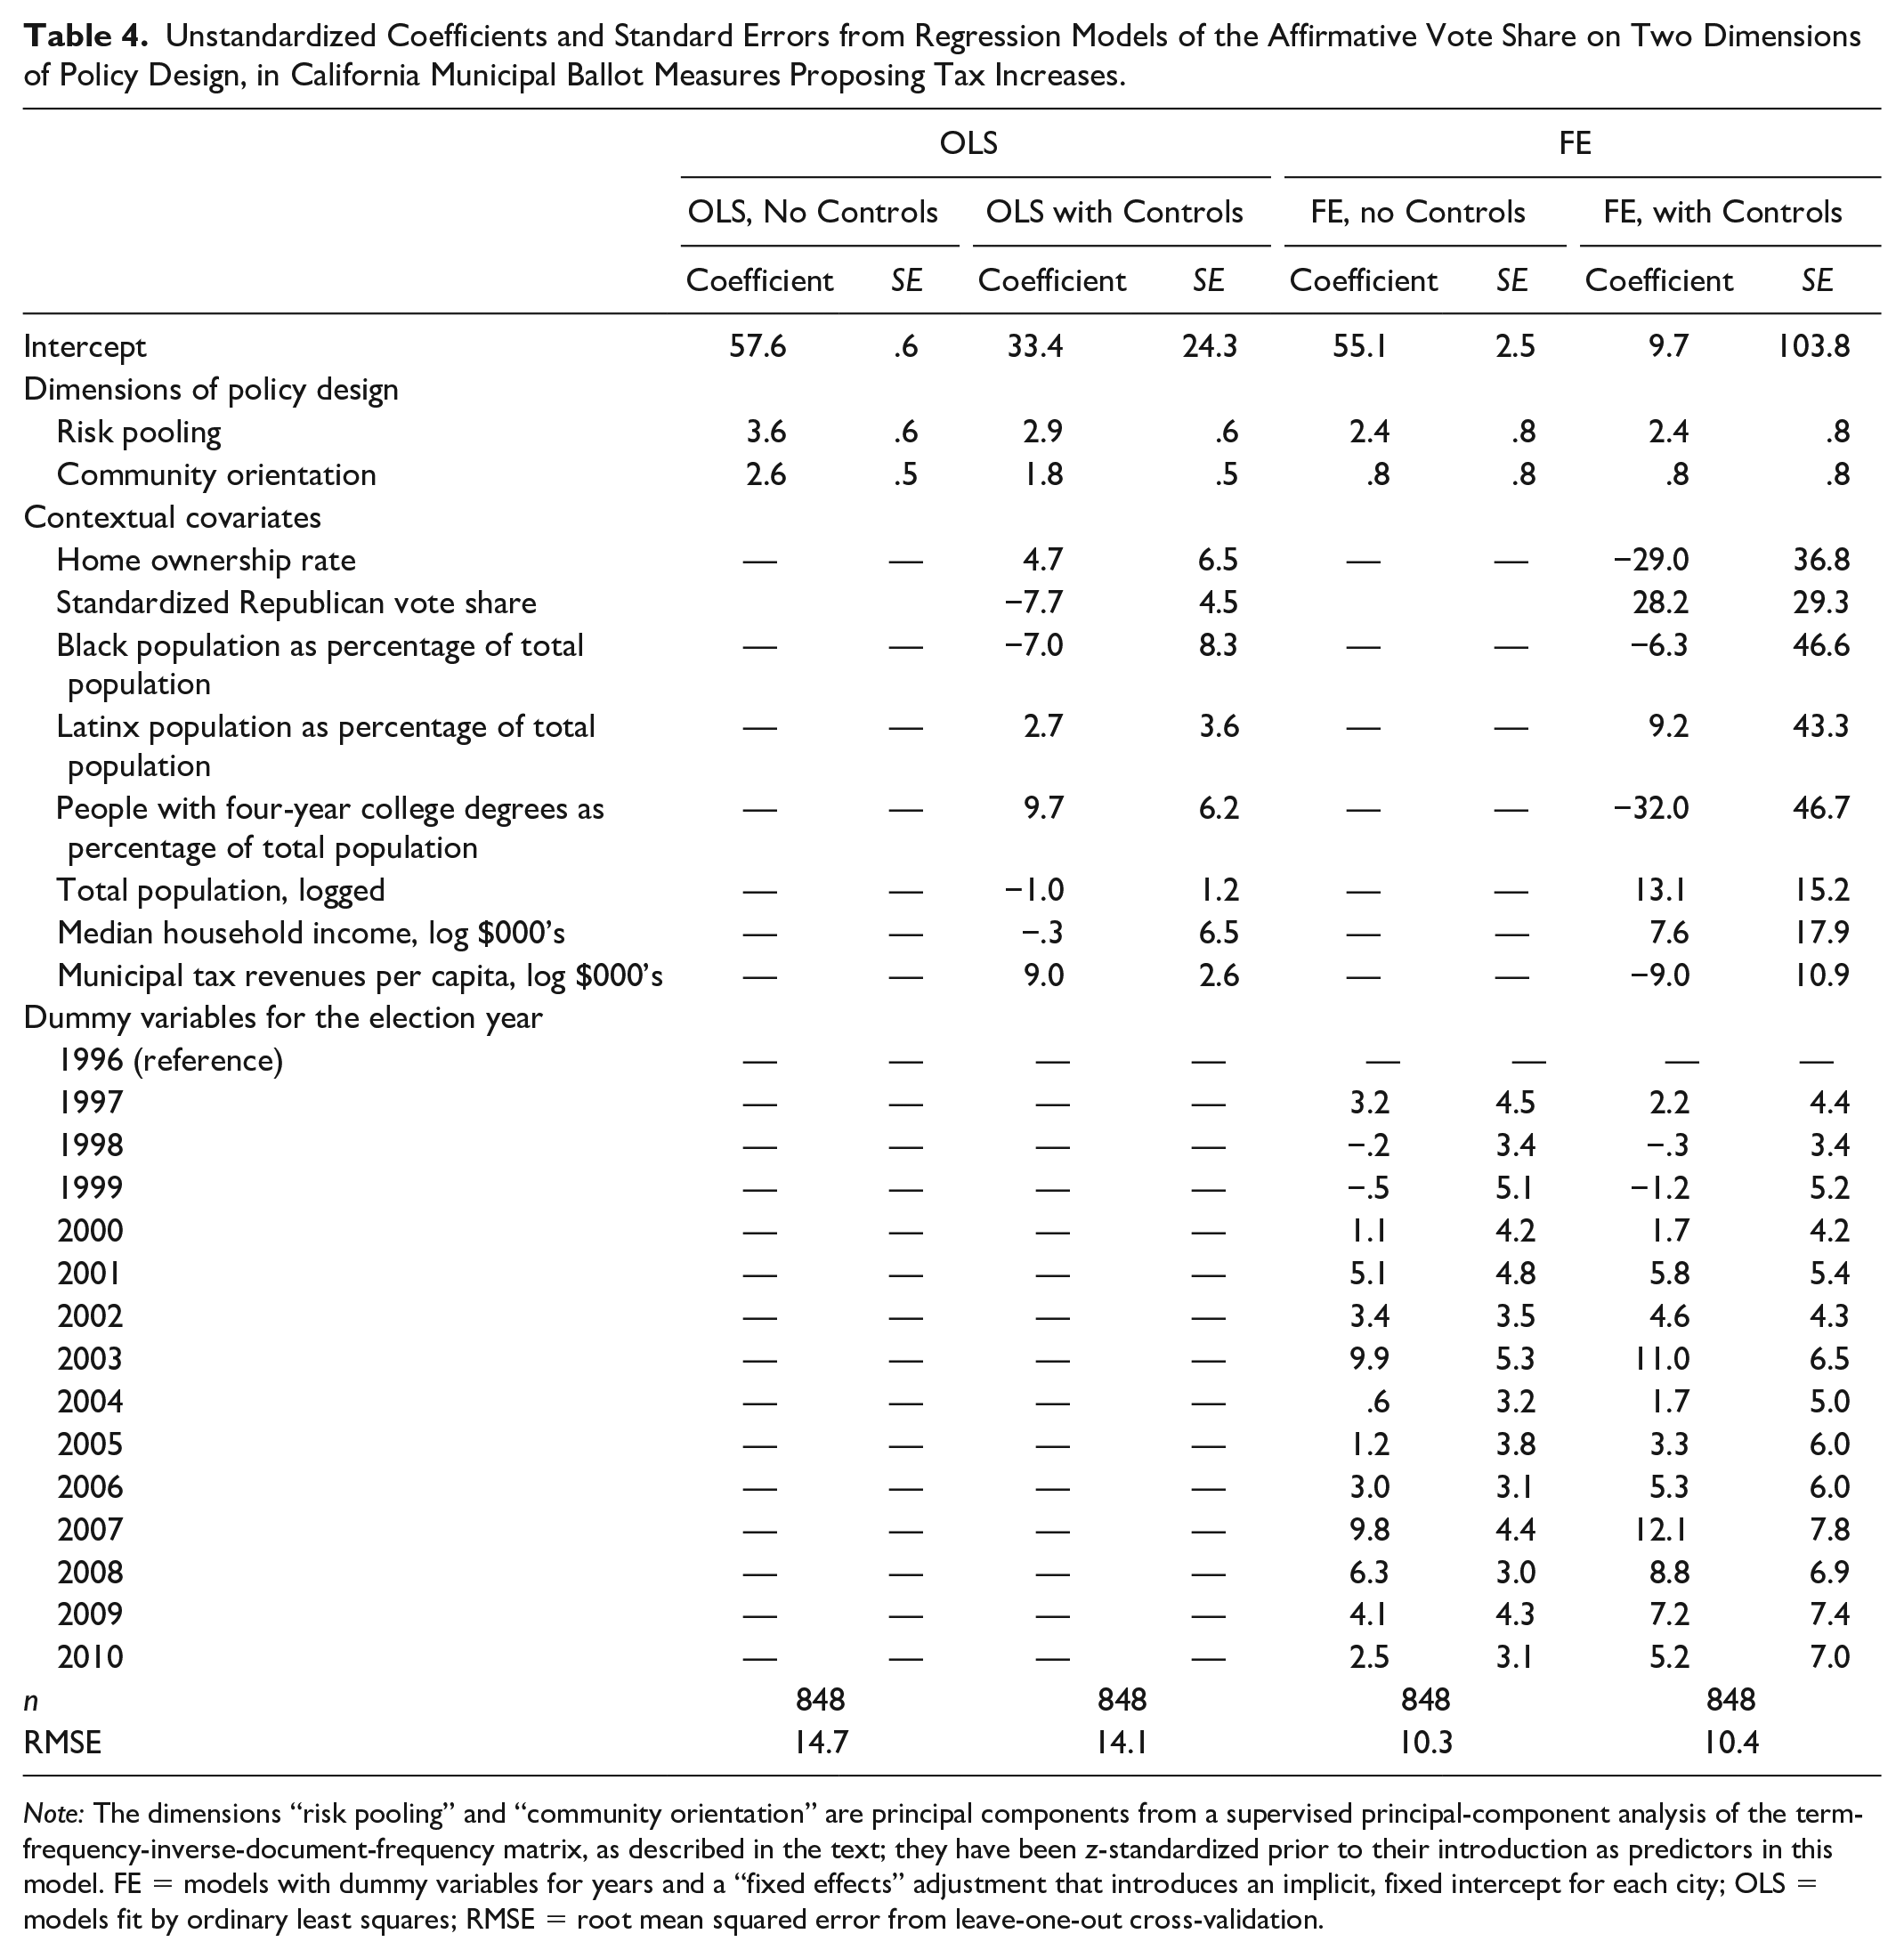
Note: The dimensions “risk pooling” and “community orientation” are principal components from a supervised principal-component analysis of the term-frequency-inverse-document-frequency matrix, as described in the text; they have been z-standardized prior to their introduction as predictors in this model. FE = models with dummy variables for years and a “fixed effects” adjustment that introduces an implicit, fixed intercept for each city; OLS = models fit by ordinary least squares; RMSE = root mean squared error from leave-one-out cross-validation.
These differences may be spurious if different policies are proposed in different contexts. In particular, the loadings of the terms city and town in the component we have labeled community orientation might be taken to suggest that this component is indirectly measuring a difference between places, rather than a theoretically important difference in policy design. The third and fourth models reported in Table 4 are fixed-effects models that adjust for differences among places by centering the independent and dependent variables at their group means (i.e., the sample means for the respective municipality). This approach computes the average within-municipality association between principal components and the affirmative vote share, or the association net of unmeasured, time-invariant differences among municipalities. In the model with this fixed-effects adjustment, we observe that the coefficient of community orientation is still positive, but its magnitude is attenuated compared with models without the fixed-effects adjustment, and it is statistically indistinguishable from zero. Tax policies that score high on community orientation may be comparatively popular simply because they are the sorts of policies typically proposed in places where voters are most inclined to support tax increases.
The coefficient of risk pooling, by contrast, is positive, substantial, and sharply measured in every regression specification. Our most conservative model, in the last columns of Table 4, adjusts for contextual covariates; for unmeasured, time-invariant characteristics of the municipalities; and for unmeasured, city-invariant factors that vary from year to year. The coefficient in this model can be read as our best estimate of the expected difference in the degree of voter support between two different tax policy proposals that differed only with respect to their degree of risk pooling, if those two policy proposals were presented to the same voters in the same city and year. According to this model, a 1 standard deviation difference in risk pooling was associated with a 2.4 percentage point difference in the expected share of voters approving a tax policy. This is a narrow margin, but it could mean the difference between a measure that narrowly passes and one that narrowly fails.
Our inductive treatment of tax policy data thus yields two dimensions that are both theoretically meaningful and politically salient. Although we have highlighted the ways in which these dimensions evoke some familiar sociological concepts, we should also note that they are different from the dimensions that might be suggested by prior research. Policy terms that did not load on either factor include, for example, some that might be associated with the moral worthiness of target populations (such as contribution, senior, citizen, elderly, child, and veteran), the visibility of public spending (park, street, build), and the putative invisibility of taxation (consumption, withholding). All of these terms are represented in the corpus of policy text analyzed here, and some of them are quite amply represented, with TF-IDF weights that exhibit considerable variance. But they do not have a sufficiently strong or consistent association with aggregate voting behavior to be selected by the supervised PCA. In this sample of 848 elections, we have found no evidence that these policy descriptors, or others like them, are politically salient at all.
The Search for a Popular Tax Continued
The analysis reported here may shed some light on why Rivlin’s question has gone unanswered for so long. Many taxes are popular in context, and some of them are very popular indeed, but it is difficult to offer any general statement about which kinds of taxation are most popular that is both true to the data and sufficiently abstract to be useful. On the one hand, we have found that the popularity of a tax policy may be systematically related to the kinds of policy features that are described in a city attorney’s impartial analysis. On the other hand, our most predictive models rely heavily on a fixed-effects adjustment for unmeasured differences among cities and over time. A comparison of models within each column of Table 3 reveals that the out-of-sample prediction error is relatively insensitive to whether the regression model includes tax policy characteristics only, contextual covariates only, or both; the election outcomes may be predicted about equally well from information about the policy or information about the social and political context, and combining both kinds of information does not much improve our predictions. We may infer that risk pooling and community orientation are politically salient characteristics of tax policy—but we also may infer that most of the politically salient information contained in these principal components is redundant with the information contained in the contextual covariates. In other words, the taxes with the most popular features are also often proposed in the most favorable sociopolitical contexts, and it is difficult to distinguish observationally between the effects of policy design and the mere fact of favorable conditions. Popular taxes are popular in context, and the dream of a policy design mechanism that is consistently powerful enough to overwhelm the effects of political and social context is likely to prove chimerical.
Still, the fact that is difficult to distinguish observationally between the effects of policy design and the presence of favorable conditions does not mean that it is impossible; and, if no kind of tax is universally the most popular, some kinds are, on average, more popular than others. It would be wise to focus more of our theoretical attention on the dimensions that distinguish these taxes. We identify two such dimensions, risk pooling and community orientation, that differentiate popular from unpopular taxes in a sample of 848 municipal referendum elections in California. Both of these dimensions concern social dimensions of taxation: they distinguish among policies according to their social purposes and according to how broadly or narrowly they draw the circle of those who are obligated to pay. The most popular taxes in this sample are those that assign a common obligation to everyone who owns a parcel in the residential community and that earmark the funds for safety net services available to everyone in the residential community. The least popular taxes are those that increase prorated charges for basic utilities that are necessary for survival and social inclusion, and that do not reserve the resources for those in the pool of contributors. These patterns are consistent with the hypothesis that social insurance is among the most popular functions of fiscal policy and more generally with the idea that taxation can be popular when it is bound to membership in a civic community (see Williamson 2017). Other dimensions of tax policy—whether it is coupled with sales transactions, earmarked for especially morally worthy populations, symbolically tied to the virtue of work, labeled a “contribution,” or split between employers and employees; whether it is collected in frequent or infrequent increments; whether it is painfully visible or deducted invisibly from another transaction—do not make much of a difference, to judge from the tax policy descriptions in this corpus.
We should not assume that California municipalities at the turn of the twenty-first century are representative of other polities, of course, but neither should we assume that these findings are relevant only to California, or to municipal government, or to the turn of the twenty-first century. The sampling design of the present study shares a weakness of all of the most influential works on how voters respond to public policies, none of which has examined a representative sample of policies or polities (but see Burstein 2014). The approach taken here—to examine a large population of policies, to adopt a coding protocol that sticks close to the textual data on which it is based, and to focus on observational measures of consent that do not depend on features of an artificial experimental setting or survey encounter—nevertheless may help overcome other weaknesses of previous studies. Our approach exploits the distinctive strengths of modern computational social science. The data for future such studies are richly available, and we think this approach is worth pursuing further.
If Rivlin was right, then the search for a popular tax will continue. The good news from the present study is that the most difficult part of the search is over. Popular taxes are quite common. The challenge is no longer to find one. It is to analyze the richly available data concerning the large numbers of popular tax policies that already exist, in order to discover principles that can inform the design of the next one. Although this approach is unlikely ever to discover a silver bullet that will end the bitter struggle over how to pay for public goods, we think it can inform the design of tax policies that are more likely to survive the democratic test.
Footnotes
Appendix
Funding
The author(s) disclosed receipt of the following financial support for the research, authorship, and/or publication of this article: This research was supported by the National Science Foundation (grant number 1823821).
2
Although a parcel tax is nominally a tax on property owners, it is borne by renters as well, who can be expected to pay higher rents where a parcel tax supports valued local services (see, e.g., ![]() :553–54). This difference between legal and real incidence is consistent with classic examples of social insurance; for example, the Social Security payroll tax for covered workers in the United States is nominally split between employees and their employers, but the employer’s share of the tax is also borne economically by employees. As one reviewer has correctly noted, we cannot exclude the possibility that voters believe parcel taxes to be progressive. It is possible that such a belief, or some other correct or incorrect belief held by voters, might help account for why tax policies that socialize risk are popular and policies that individualize risk are unpopular at the ballot box.
:553–54). This difference between legal and real incidence is consistent with classic examples of social insurance; for example, the Social Security payroll tax for covered workers in the United States is nominally split between employees and their employers, but the employer’s share of the tax is also borne economically by employees. As one reviewer has correctly noted, we cannot exclude the possibility that voters believe parcel taxes to be progressive. It is possible that such a belief, or some other correct or incorrect belief held by voters, might help account for why tax policies that socialize risk are popular and policies that individualize risk are unpopular at the ballot box.