
Abstract
Julia Kay Worlf and Lynne S. Cossman on local preferences.
The sociology of health and illness/well-ness considers the complex interactions between society and individuals’ health and well-being. Where we live, who is in our social networks, and our cultural, historical, and political contexts all contribute to our health-related behaviors and outcomes. Scholars often recommend improvements in various societal elements that influence health, such as increasing access to affordable housing, higher education, green (e.g., parks, fields) and blue (e.g., lakes, pools) spaces, and quality health care. However, who should be responsible for providing such resources and how well they do so have been up for debate—including among the people researchers are studying.
In this brief empirical article, we consider whether and how perspectives on these topics differ by geographical location.
First, in the United States, a capitalist society with partially socialized public safety, how do people feel about who should be responsible for health-related resources, such as housing, parks and recreation, and transportation? Should the government or private sector be accountable for providing these goods?
Second, different levels of government and other groups and organizations can shape our environments. Do U.S. adults believe the actions and policies of these entities are generally good or bad for their communities?
To answer these questions, we explore the results of the 2018 National Survey of Health Attitudes (NSHA). The NSHA is a cross-sectional, nationally representative survey of U.S. adults designed and fielded by the Robert Wood Johnson Foundation (RWJF) and RAND Corporation. An earlier wave was fielded in 2015, but it did not contain our questions of interest. (We also advocate for a third wave to assess post-pandemic opinions, as they may have shifted due to different entities and levels of governments’ responses to this major public health problem). The inspiration for the survey was RWJF’s advocacy for a Culture of Health—a society in which health is a right and health equity is the norm.
We compare the responses of respondents from the Northeast, Midwest, and West to those from the South—the region typically reporting higher, if not the highest, levels of poor health outcomes. We dropped cases if they did not answer every question (n =3,564) and used survey weights via the svy package for analyses that were conducted in Stata 14.2.
The first survey item stated: "Indicate who you think should play a bigger role in providing these services, the government or the private sector (businesses and nonprofits)?" Respondents were asked to slide a dot along a scale ranging from 0 to 100—closer to 0 indicated a greater role by the government and closer to 100 indicated a greater role by the private sector. Placing the dot all the way to either end indicated that entity should provide the services/resources without any involvement from the other one. We examined overall weighted proportions to each option and then performed eight bivariate ordinary least squares (OLS) regressions using each service/resource outcome score as the dependent variable and region as the independent variable.
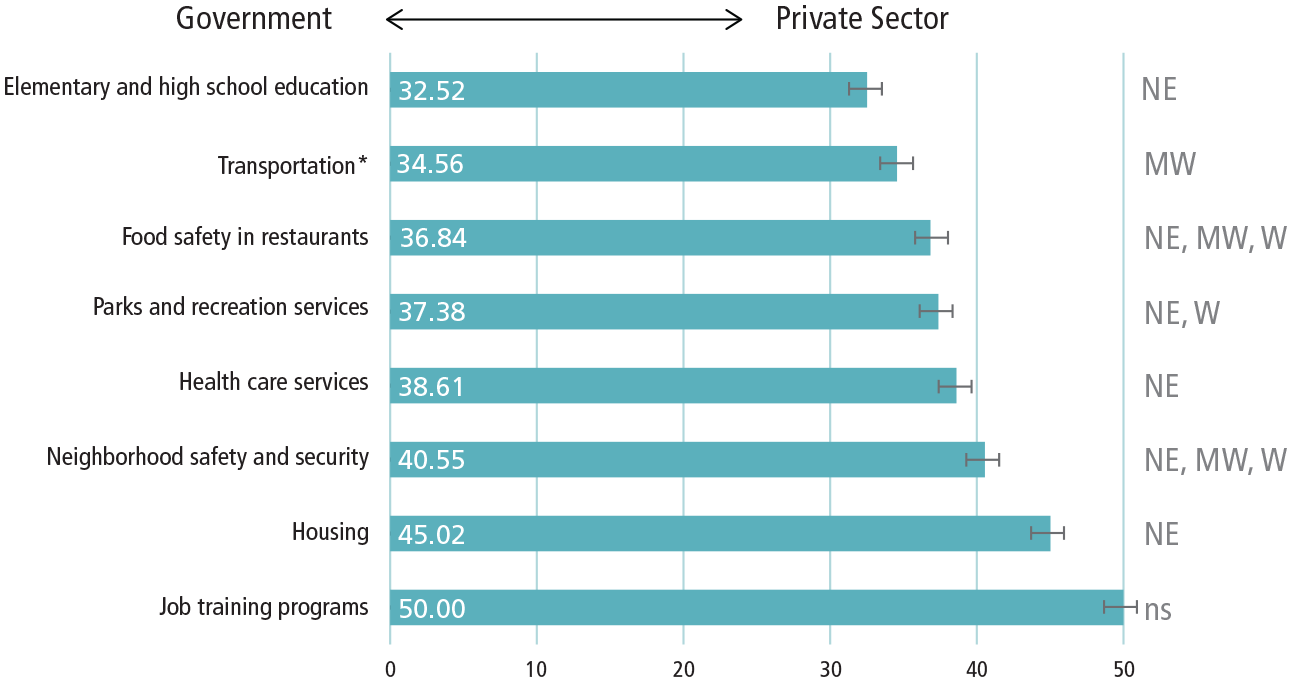
The figure below shows the average responses for each service option for all respondents, regardless of location. Bold numbers in each bar represent the weighted average mean response per question across all regions; error bars represent their 95% confidence intervals. We can see that, on average, respondents throughout the United States believed the government should play a bigger role in providing each service compared to the private sector (especially when it comes to elementary/high school education), though they suggest a 50/50 split on job trainings.
Perceptions of Who Should Play a Bigger Role in Providing Health Care Services by Region in the 2018 National Survey of Health Attitudes (n=3.564)
Notes: transportation including highways, roads, buses, trains, and subways. Respondents were asked to slide a dot along a scale ranging from 0 to 100—closer to 0 indicates a greater role by the government and closer to 100 indicates a greater role by the private sector. Bold numbers in each bar represent the weighted average mean response per question across all regions; error bars represent their 95% confidence intervals. Eight bivariate ordinary linear regressions (OLS) were used to compare each region to the South for each option; regions with significant differences (a = 0.05) from the South are noted on the right (NE = Northeast, MW = Midwest, W = West, ns = not significant).
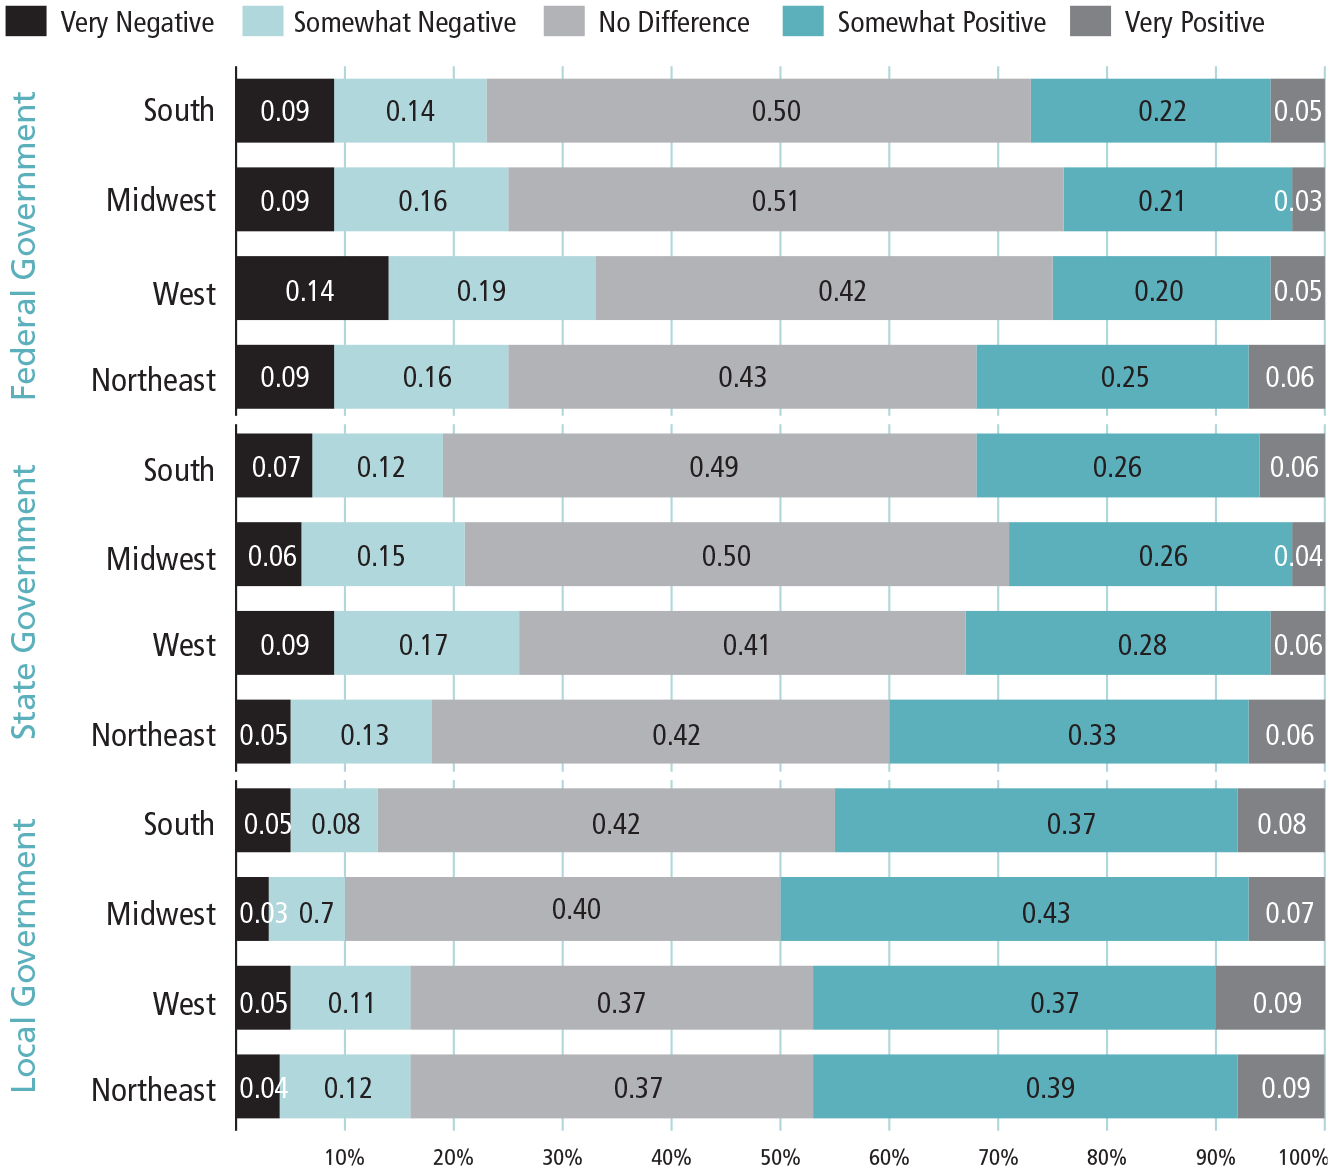
Weighted Proportions of Perception of Government Impact on Community Health By Region in the 2018 National Survey of Health Attitudes (n=3,564)
Notes. The weighted proportions show responses to "This question is about how different groups or organizations impact the health of your community. For each, please indicate what impact (positive, negative, or no impact) this group has on the health of your community. If the impact is both positive and negative, please indicate whether the overall impact is more positive or negative." Response options are on a 5-point Likert scale from very negative (= 1) to very positive (= 5).
On the righthand side of the figure on p. 60, we include basic results of the significant (a = 0.05) geographical variations from the South found in the bivariate OLS regressions (NE = Northeast, MW = Midwest, W = West, ns = not significant). For example, the Northeast reported different responses from the South in regard to who should be responsible for every service except transportation and job training programs. In fact, no region differed from the South regarding job trainings. For both options related to safety (restaurant food and neighborhood), all three regions differed in their opinions from the South. In each case shown where responses differ, respondents from the South preferred the private sector play a bigger role.
The South has had a complex relationship with the federal government since the inception of the country. The Civil War highlights this adversity, as most of the South was part of the Confederacy, fighting against the rest of the nation to maintain the practice of slavery. Southern states still tend to enact more conservative laws and policies today. For example, almost every state in the South has a law banning abortion (albeit a contested form of healthcare), while there is greater variation in the other regions. It is not unexpected that Southerners would not want the government playing as large a role in other health-related services.
The second survey item stated: "This question is about how different groups or organizations impact the health of your community. For each, please indicate what impact (positive, negative, or no impact) this group has on the health of your community. If the impact is both positive and negative, please indicate whether the overall impact is more positive or negative." Response options were on a 5-point Likert scale from very negative (= 1) to very positive (= 5). We performed eight bivariate logistic regressions with responses to this question dichotomized (1 = very positive, somewhat positive; 0 = no difference, negative, very negative) as each dependent variable and region as the independent variable.
For simplicity, the figure on this page shows the breakdown of the responses pertaining to local, state, and federal governments only. The bar graphs show the weighted proportion of each of the 5-point Likert scale responses for each region. We can see the trend of increasingly negative responses from local to federal levels, indicating respondents across the nation generally appear to believe local governments more positively affected their communities’ health than did state and federal governments. Interestingly, we do not see the South holding the most negative perceptions of government impact. These findings may indicate a universal preference for governmental help by politicians and employees more familiar with one’s particular location, who may be more likely to provide context-specific solutions, than for those with a broader purview who may try more general approaches to problems.
The table on the next page shows the results of the eight bivariate logistic regressions. Asterisks indicate where a region had higher odds of reporting that the respective entity had a positive impact on the health of their community compared to the South. Only two significant differences (a = 0.05) were found considering governments: the Midwest (OR = 1.25; 95% CI = 1.01, 1.54) regarding local government and the Northeast (OR = 1.37; 95% CI = 1.09, 1.71) regarding state government.
Logistic Regression of the Perceived Positive Impact Groups/Organizations Have on Community Health by Region in the 2018 National Survey of Health Attitudes (n = 3,564)
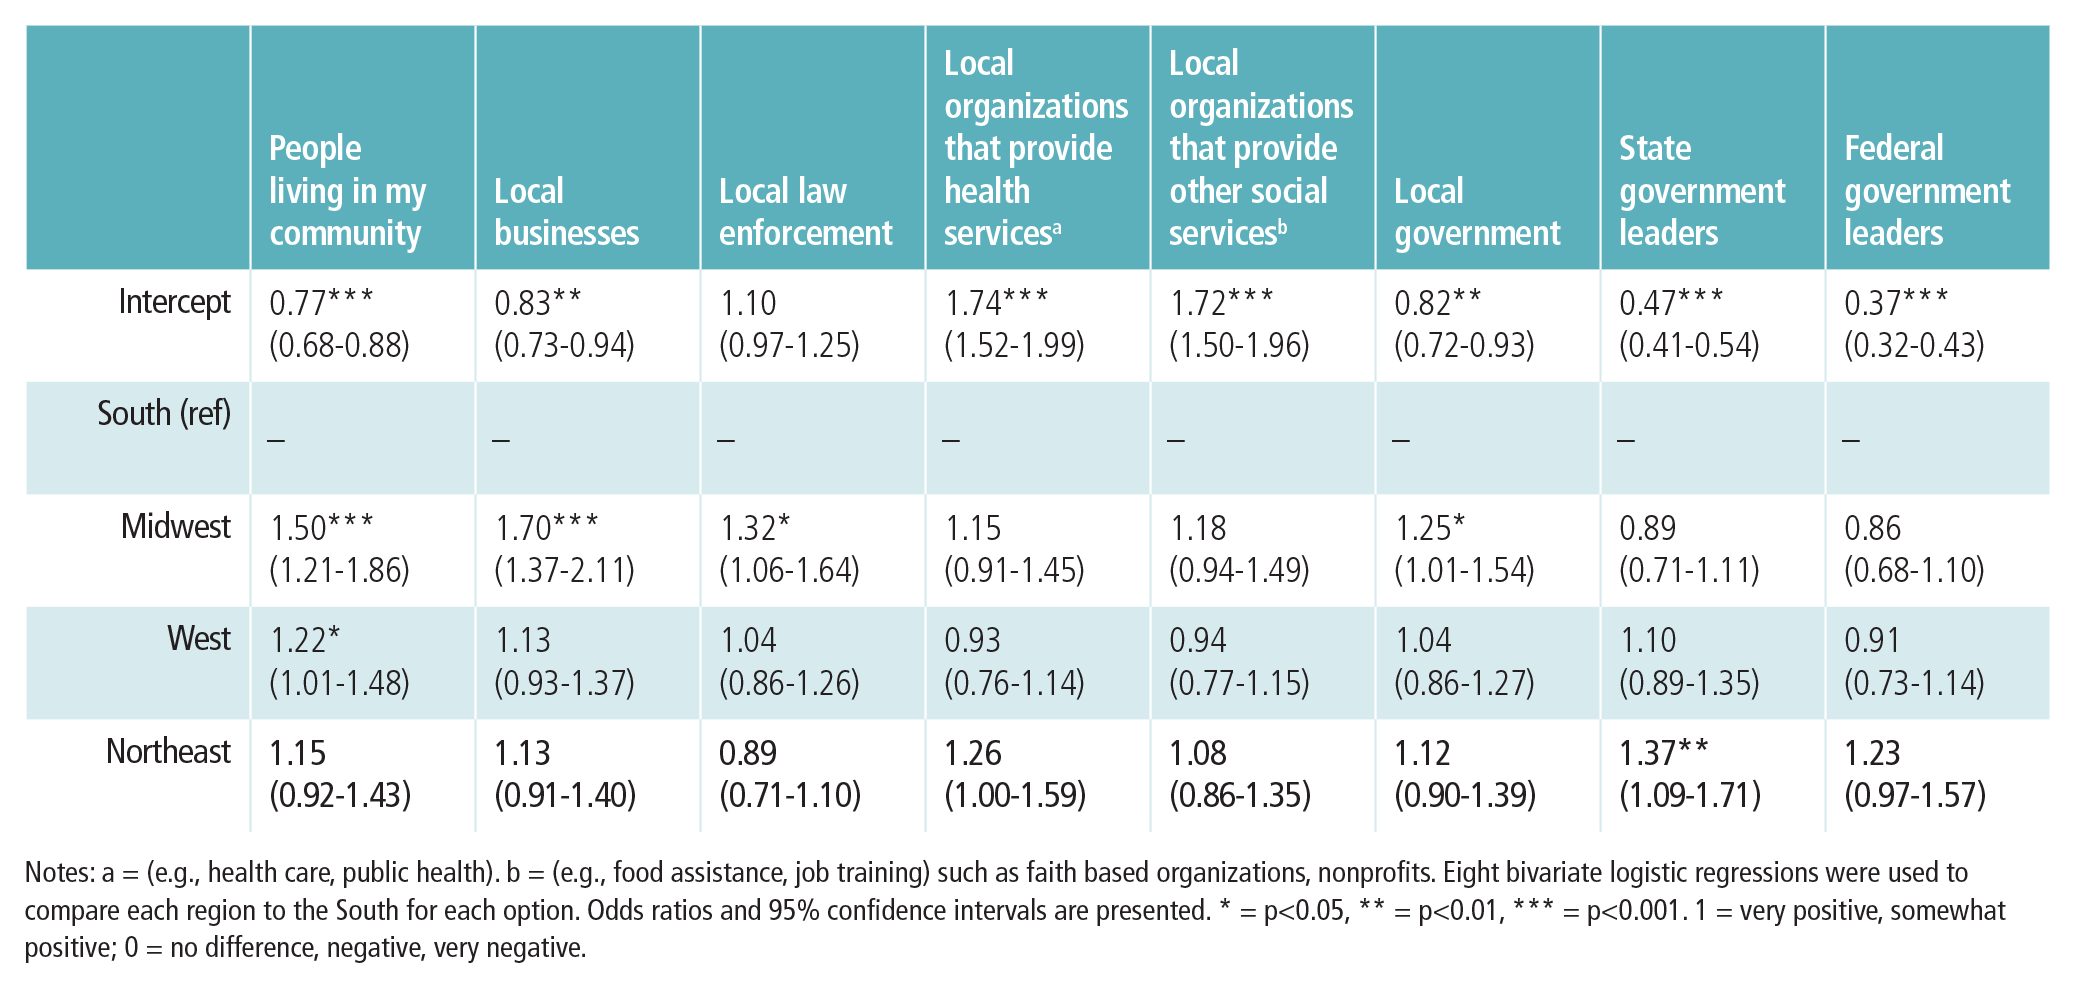
Notes: a = (e.g., health care, public health). b = (e.g., food assistance, job training) such as faith based organizations, nonprofits. Eight bivariate logistic regressions were used to compare each region to the South for each option. Odds ratios and 95% confidence intervals are presented. * = p<0.05, ** = p<0.01, *** = p<0.001. 1 = very positive, somewhat positive; 0 = no difference, negative, very negative.
Further, only the Midwest and West differed from the South regarding some non-governmental entities. No region differed from the South when considering local organizations that provide either health or social services, implying respondents generally found them to affect health similarly. The greater variation among the three less explicitly health-related entities may indicate different perceived influences based on context. For example, respondents may have perceived people living in their Midwestern and Western communities were more focused on health while people in the South were focused on other goals.
While informative, we wish to point out two main limitations of this study.
First, we only focused on external influences on health. NSHA also included many questions on individual/internal vs. collective/external influences on health-related behaviors and outcomes in both rounds of the survey. Their descriptive summaries show variations in opinions on whether internal (e.g., knowledge about health, personal health practices) or external (e.g., community safety, where a person lives) factors affect health and well-being. Future research should consider how these perceptions vary by location.
Second, we only considered the association of respondents’ location to these health-related questions. As scholars who study spatial disparities in health, we approached this project wanting to start by understanding fundamental geographical differences in these opinions. Other factors, such as respondents’ age, race/ethnicity, gender, or education level, may reveal additional relationships that may coincide with or supersede the ones we found and should be examined in future research.
Researchers interested in promoting health across the country tend to analyze and report on health-related outcomes and disparities while providing suggestions on how to address them. Fewer consider how the individuals affected by policy change view such external health-influencing factors. Our descriptive results show regional disparities in perspectives on who should be responsible for health-related services/ resources, indicating different approaches may be necessary to provide optimal and welcome health-related care to communities based on geographic location. Similarly, respondents show some differences in perceived positive impact on their communities by various entities. Discrepancies in these key health-related opinions speak to underlying resistance to universal health-promotion endeavors.
The findings from this descriptive work can help public health workers create strategic partnerships and consider innovative ways to pitch their health-related projects to local residents for maximum endorsement and effectiveness.