
Abstract
The authors document variation in charge rates by demographic basis, observe basis and spatial variation in charge rates, and examine potential sources of this variation. The authors find that discrimination charge rates are much higher for the disabled and African Americans than for women, people older than 40 years, Hispanics, Asians, immigrants, and men, and there is dramatic state-level variation in charge rates. Possible explanations for this variation include access to legal representation, post-complaint employer retaliation, job loss, rights consciousness, and variations in charge outcomes. Findings point toward regulatory outcomes mandating changes in employer behavior as the only robust antecedent to discrimination charge filing. Unfortunately remedies targeting employer behavior are rare, while employer retaliation and firing are common. Neither access to law nor the frequency of monetary damages are associated with charge filing. Rights consciousness is associated with more discrimination charge filings, but only on the bases of disability.
It has been 65 years since the 1964 Civil Rights Act outlawed employment discrimination and created the U.S. Equal Employment Opportunity Commission (EEOC). The political focus at the time was discrimination against Black men. The 1964 law, however, extended these protections to all races, national origins, skin colors, religions, and genders. Shortly thereafter, protections were extended to older workers and, in 1990, to people with disabilities.
Given this history and the fact that we are more than 50 years past the passage of equal opportunity legislation, it is surprising that we know so little about the incidence and antecedents of discrimination charges. In this article we ask who files discrimination charges, comparing charge rates on the bases of sex, race, national origin, age, and disability, while also investigating spatial variations across the United States. For sex and race, the two most prominent bases of charges, we further disaggregate charge rates for men, women, whites, Blacks, Hispanics, and Asians. Doing so offers important insights into the contemporary relevance of inequality in the workplace but also probable mechanisms that bolster or mute legal rights and claims-making.
Our aims in this article are primarily descriptive, with the hope of informing research on workplace inequalities and law and society. We have two main findings. First, our analyses are the first to our knowledge to document variations in the rates of discrimination charges nationally. We discover that disabled workers, followed by African Americans, are most likely to respond to experiences of discrimination by filing formal charges. No less important, we also document substantial variation in the rate of formal charge filing among U.S. states—variation that is observed for all protected bases of employment discrimination.
The substantial variations observed, both by basis of charge and spatially, are complemented throughout with potential antecedents drawn from the law and society literature: exposure to discrimination, access to law, rights consciousness, and legal redress. Our analyses suggest that in states with higher charge rates, discrimination charges are more likely to lead to mandated changes in employer behavior, a pattern that is stable and largely consistent across distinct discrimination charge bases. Other plausible explanations receive little or no support when it comes to either charge rate difference across bases or variation across states.
Discrimination Charges and Potential Sources of Claims-Making Variation
Filing a discrimination charge is quite different from experiencing discrimination. Past research suggests that fewer than 1 percent of people who experience discrimination actually file discrimination charges (Berrey, Nelson, and Neilsen 2017; McCann, Tomaskovic-Devey, and Badgett 2018). When employees perceive that they have been treated unfairly, they must first make sense of why, be aware of their rights under the law, and then take action. Scholars conceptualize the process of filing a charge in terms of a dispute pyramid in which many people experience grievances, some of whom come to recognize their treatment as violating the law and are also able to identify the source of that violation, and very few move on to actually make legal claims (Felstiner, Abel, and Sarat 1980; Miller and Sarat 1980).
Individuals vary, of course, when it comes to awareness of legal rights (Burstein and Monahan 1986; Hirsh and Kornrich 2008) and access to the resources necessary to use the legal process (Berrey et al. 2017). Research also points to some employers being more discriminatory than others (Nazarov and von Schrader 2020). Among employers, some react more harshly to discrimination claims (James and Wooten 2006) and when they encounter repeated claims get better at defending themselves in court and avoiding awards of benefits to the claimant (Hirsh 2008).
Past research also makes clear that complaining to an employer about discriminatory treatment can be quite dangerous, leading to employee vilification, employer retaliation, and often firing of the person who raises a discrimination complaint (Roscigno 2007). In addition, only a small proportion of discrimination charges result in some benefit to the employees making the claims (Berrey et al. 2017). Those benefits tend to be small monetary payments, coupled with loss of employment and more rarely change in workplace practices or even admission of fault by the employer. Employers who are willing to settle during the EEOC investigation process or prior to court action, while also paying only small amounts to claimants, may be more likely to agree to workplace changes (Hirsh 2008).
In one of the more definitive studies of employment discrimination claims, Berrey et al. (2017) explored sequentially the process from filing through eventual resolution. They found that filing an employment discrimination claim is associated with three interconnected goals: personal vindication, organizational change, and compensation. They found that after complaining internally to their employers, claimants typically faced isolation and retaliation. Their initial motive to file discrimination complaints tended to be personal vindication in the face of this isolation and retaliation coupled with protecting current and future coworkers from abuse. As they moved through the legal process, however, they learned that the best they could expect was some monetary compensation for their loss of dignity and often employment.
Despite some attention to the experience of discrimination and the sequential barriers victims may run into when claiming legal rights, it is somewhat surprising that, with two exceptions, there is almost no prior research examining variation in discrimination charge rates. One relevant study is a national time-series analysis by Wakefield and Uggen (2004) suggesting that discrimination charges rise with new legal rights and when unemployment is high. They interpreted the former as indicating expanded rights consciousness and the latter as suggesting weaker attachment to particular employers. A second is the work of Hirsh and Kornrich (2008), who focused on the types of firms that generate gender- and race-based discrimination charges. They found that employees are more likely to file charges in smaller, less bureaucratized organizations and when their managers are white and male. They interpreted the former as representing better internal grievances procedures and the latter as indicating more hostile workplaces.
Although one of our primary goals is to highlight and establish descriptively that there is variation in charge rates for different protected groups and across states, we also ask whether this variation is associated with rights consciousness, experiencing retaliation after an internal complaint, separation from employment, access to law, and both monetary and nonmonetary legal redress. Doing so is important for our understanding of inequality, legal rights, and actions and how they are interpreted and acted upon and for the plausibility of particular remedies that civil rights agencies, legal advocates, and even employers might consider moving forward.
Data
The EEOC and state fair employment practice agencies (FEPAs) are the regulatory bodies authorized to receive and adjudicate discrimination complaints against employers. Under the Civil Rights Act of 1964, a person who believes that they have been discriminated against in employment must file with either the EEOC or a state FEPA before pursuing legal action against their employer.
Our core data are workplace discrimination charges from the EEOC. These charges were filed directly with the EEOC or with state or local FEPAs. The data include all workplace charges filed between fiscal years 2012 and 2016. 1 In previous work, we created aggregate national and state statistics from the original individual charges to the EEOC and FEPAs. To ensure confidentiality, statistics at the state level are calculated only where there are 30 or more cases.
We calculate charge rates using formal EEOC and FEPA charges as the numerator and population estimates from the American Community Survey (ACS) as the denominator. The ACS is collected yearly from random samples of people living in the United States. Five years of ACS data are required to produce statistically accurate estimates of population size for subnational units such as state. We use the 2011–2015 five-year ACS to estimate local employed workers potentially at risk for employer discrimination. We define our population baselines as the civilian population currently employed at work. In addition, we restrict our population to individuals aged 16 and older for all bases, except age. The population for age discrimination is limited to employed individuals older than 40 years. From the ACS data, we estimate the civilian employed at work population at risk for each type of discrimination at the state and national levels. These populations are described in more detail in the following section.
Types of Discrimination
A basis is the legally protected category that a plaintiff claims was the basis of discrimination. Under Title VII of the Civil Rights Act and its extensions, these protected categories include race, sex, color, religion, disability, age, and national origin. We focus on five discrimination charge bases and, for sex and race, the status characteristic of the charging party. 2
Age discrimination includes all Age Discrimination in Employment Act charges filed by charging parties 40 years of age or older that contain age as a basis of the charge.
National origin discrimination includes all Title VII charges that contain national origin as a basis of the charge. These charges can be from a person of any race.
Race discrimination includes all Title VII charges that contain race as a basis of the charge. We further calculate race-based charge rates for white, Black, Hispanic, and Asian charging parties.
Sex discrimination includes all Title VII and Equal Pay Act charges that contain sex as a basis of the charge. This includes charges made on the basis of sexual orientation or gender identity and pregnancy. We further calculate sex-based charge rates for men and women.
Disability discrimination includes all Americans with Disabilities Act charges that contain disability as a basis of the charge.
Measuring Discrimination Charge Rates
Although the EEOC routinely reports the number of discrimination charges it and FEPAs receive at eeoc.gov, it does not produce any standardization to allow citizens to gauge how widespread discrimination complaints are. We follow Wakefield and Uggen (2004) in using U.S. Census Bureau employment estimates to calculate discrimination charge rates, the yearly average charge rate per 100,000 employed persons in the state (or nationally):

The at-risk employed population is calculated using the ACS for the civilian employed at work population. Because our charges include charges filed in a five-year time frame, we multiply the employed population estimates by 5 to obtain a yearly charge rate. 3
We treat the entire civilian employed at work population as at risk for sex-based discrimination. Rates are calculated separately for each sex to produce sex-specific charge rates and then combined weighted by sex-specific charges to produce a total sex charge rate. For example, the female charge rate is calculated as the number of charges filed by women over the number of employed women at work in the state or nationally.
Race-based discrimination rates are calculated separately for each race and combined as above. For example, the Black charge rate is calculated as the number of race-based discrimination charges filed by Black charging parties divided by the number of employed Black employees. Although we limit subanalyses to white, Black, Hispanic, and Asian, the national rate includes charges associated with Native Americans, Native Hawaiians and Pacific Islanders, and multiracial claimants. These latter three groups were too small to support their own analyses.
For age discrimination, the denominator includes the civilian employed at work population older than 40 years. For national origin discrimination, the at-risk population includes the civilian employed at work population born outside the United States and Puerto Rico. For disability discrimination, this includes the civilian employed at work population identified as having a disability. The ACS asks respondents about six different disabilities: hearing difficulty, vision difficulty, cognitive difficulty, ambulatory difficulty, self-care difficulty, and independent living difficulty. Respondents who report any of these difficulties are considered to have disabilities. 4
Table 1 presents descriptive statistics for both charge rates and potential explanatory variables, which we introduce below. What is immediately clear is that discrimination charge rates are much higher for disability and Black race than for other bases. Discrimination claims based on national origin are the next most common, followed by female sex and age. Race claims by Asians, Hispanics, and whites and sex claims by men are much less common. Although we did not originally separate national origin by sending country, we do know from earlier analyses that Hispanics, but not Asians, are more likely to file under national origin than race.
Descriptive Statistics, 50 States, Puerto Rico, and the District of Columbia.

Focusing on the coefficient of variation, a measure of variability across the 52 geographic units, most charge rates are roughly similar in their state-to-state variation. The exceptions are the white and Asian rates, which show more state-to-state variation. The aggregate race charge rate shows a great deal of state variation, reflecting that state populations vary tremendously in their racial profiles.
Explaining Variation in Discrimination Charge Rates
We draw on past research on discrimination charges, particularly the work of Wakefield and Uggen (2004) and Berrey et al. (2017) and the general dispute pyramid model (Felstiner et al. 1980; Miller and Sarat 1980), to guide our exploration of variation in charge rates by their bases and across states. We identify a set of plausible explanations for both types of variation: rights consciousness, employer retaliation after an internal discrimination complaint, employer attachment, charge resolutions with either a monetary or business practices remedy, and access to legal counsel. For each we develop indicator variables and hypotheses. We do not differentiate hypotheses by discrimination bases (e.g., age vs. disability) as we have no prior theory or research to support more specific expectations.
Although charge rates across bases are only moderately correlated across states, all of the potential explanatory variables are highly correlated across bases. 5 That is, states with high (low) levels of retaliation, job loss, nonmonetary benefit, monetary benefit, and legal representation for one discrimination claim base (e.g., sex) have high (low) rates for all other (race, age, national origin, and disability) discrimination claims. This is an interesting finding in its own right. States have fairly homogenous legal and employer variation in discrimination responses, regardless of the bases of the claim. As a result we create summated scales for each of these explanations, rather than focusing on bases specific indicators. 6
Rights Consciousness
Following Wakefield and Uggen (2004), we conceptualize expanded antidiscrimination rights as generating stronger rights consciousness. At the national level, there was only an expansion of LGBT rights during our observation period. There was, however, a great deal of state-level variation in both the bases on which employees are protected from discrimination and prohibited practices. To code state variation in employment protections, we turned to the list of state-level employment discrimination laws provided by the National Conference of State Legislatures (Hentze and Tyus 2021).
We coded any protected basis or prohibited practice that went beyond national law and was on the books by 2016. For example, in addition to the basic protections on the bases of race, religion, national origin, and sex, some states have added protections for most commonly marital status, pregnancy, and sexual orientation, but there were 17 more protected statuses, including criminal record, smoking, and even past employment affiliation with a state FEPA. Some states also had expanded lists of prohibited or permitted behaviors. The most common, found in 22 states, was a prohibition from aiding others to or willfully resisting equal employment opportunity enforcement. All others were less common but included narrowing the business necessity exemption in discrimination law and expanding the definition of race to include hair styles (both in 4 states) and prohibitions on nondisclosure and mandatory arbitration employment agreements (both in 3 states).
We measure state-level rights consciousness as a count of both additional protected statuses and the expanded list of prohibited and permitted behaviors. The average state had three additional discrimination protections. The District of Columbia (12), New York (11), California (8), and Washington (8) had the highest scores for additional discrimination protections. Eleven states had zero additional protections (Arizona, Arkansas, Georgia, Idaho, Indiana, Mississippi, North Carolina, Ohio, South Dakota, Tennessee, and West Virginia).
Hypothesis 1: States with more additional discrimination protections will tend to generate higher discrimination charge rates.
Employer Retaliation
Employer retaliation is measured as the percentage of all charges filed that alleged employer retaliation. Almost all retaliation happens after an employee raises a complaint of experiencing discrimination with their employer, but prior to filing a formal charge with the EEOC or a state FEPA. Retaliation to a discrimination complaint is a form of legally proscribed discrimination. Roscigno (2014) found retaliation and vilification to be core employer strategies for responding to discrimination charges. It is also the type of experience Berrey et al. (2017) described as motivating filing discrimination charges in search of vindication by the charging party. We found a strong pattern of retaliation across all bases of discrimination. A factor analysis of state retaliation rates for sex, race, national origin, disability, and age discrimination returned a single shared factor across states (α = .95). Retaliation in reaction to an internal discrimination complaint is most common in Utah, Nebraska, and Kansas and least common in Puerto Rico and Alaska. The mean score for retaliation is 38 percent of discrimination claims.
Hypothesis 2: States where employers are more likely to retaliate against internal discrimination charges will generate higher discrimination charge rates.
Employer Attachment
Employer attachment is measured as the percentage of all charges filed that alleged job loss. Job loss includes constructive discharge, layoffs, and suspension, in addition to firing. Constructive discharge refers to an employer-created hostile workplace that forces an employee to quit. Following Wakefield and Uggen (2004), we see job loss as an indicator of lost attachment to the employer, which they argued reduces the cost of filing a formal discrimination complaint. We interpret job loss as a more direct indicator of employer attachment than national unemployment rates, as in Wakefield and Uggen. Again comparing states, there is a strong correlation across bases in the probability of losing a job, and we create a single state-level indicator (α = .93). Job loss is most common in Nebraska, Oklahoma, Wyoming, and Idaho and least common in Puerto Rico and California. The mean percentage of claimants who lost their jobs was 64.1 percent. Job loss had the least variation across states.
Hypothesis 3: States where discrimination-related job loss is more common will generate higher discrimination charge rates.
Change in Employer Practice
Berrey et al. (2017) found that people who pursued discrimination claims tended to do so originally to improve the employment relationship for themselves and others. They also report that a key aspect of the legal defense of charged employers is to protect the firm from having to change their employment practices. We use the percentage of all charges closed for nonadministrative reasons that received a nonmonetary benefit as an indicator of the frequency of such actions. 7 These are changes in workplace practices that employers agree to after mediation or conciliation agreements with the EEOC or FEPA. We do not know how substantive these changes are, but we do know that they are rare across all states. We create a scale of negotiated change in employer practices (α = .97). The mean score of changes in workplace practices is only 8.6 percent of cases. Changes in workplace practices are most common in Wisconsin, Connecticut, and the District of Columbia.
Hypothesis 4: States with higher rates of nonmonetary benefits will generate higher discrimination charge rates.
Monetary Benefits
From an economic perspective, one might expect that states with higher monetary benefits would generate more discrimination charges. As we will see shortly, most people receive no monetary benefit, and those who do average only about $10,000 in their settlements. Berrey et al. (2017) found that people who pursued discrimination claims often settled for monetary benefits only when it became apparent that real workplace change was unlikely. Their study focused on discrimination charges that were filed in civil courts but revealed only slightly higher incidences of actually receiving monetary benefits, which in turn were only slightly higher than what we observe in EEOC and FEPA settlements.
We calculate the percentage of all charges closed for nonadministrative reasons that received a monetary benefit. The mean score is 15 percent of claims. Monetary benefits are most common in in Maine, Puerto Rico, and Wyoming. They are most infrequent in Massachusetts, Iowa, Oregon, and Wisconsin. The prior research by Berrey et al. (2017) leads us to expect no effect on charge rates, as plaintiffs settle for monetary benefits after a formal charge, while their original motivation was to challenge discrimination in their workplace. We offer a hypothesis for this indicator, but because prior research suggests that this is not a primary motive for filing a discrimination charge, it would not be surprising to find a null result.
Hypothesis 4: States with higher rates of monetary benefits will generate higher discrimination charge rates.
Represented by Legal Counsel
Berrey et al. (2017) reported that plaintiff lawyers are very selective in taking employment discrimination cases. We interpret the ability to retain access to legal representation as an indicator of access to law, a key hurdle in the dispute pyramid theory. Percentage of all charges in which the charging party was represented by legal counsel is our core measure of access to law. Again, variation across states in legal representation is strongly associated across states, and we calculate a state score on legal representation as a scale (α = .98) across the five discrimination charge bases (sex, race, national origin, disability, and age). On average 15.4 percent of discrimination charges are filed with legal representation. However, there is substantial state variation in legal representation. In Maine, New Hampshire, and Pennsylvania, more than 40 percent of discrimination charges include legal representation. In Vermont, Massachusetts, and Puerto Rico, the figure is fewer than 5 percent.
Comparing the Bases of Discrimination
Figure 1 reports the proportion of all discrimination charges received by the EEOC or state FEPAs between 2012 and 2016 by protected category. Race-based charges are the most common, but sex, disability, and age charges are not far behind. Religion and color-based charges are much less common, and we do not pursue them further. 8 We can make partial comparisons with the proportions of claims in 2001 reported by Wakefield and Uggen (2004). The proportions of all claims based on race (35 percent), sex (30 percent), and age (22 percent) were roughly comparable in the early 2000s and more recently. In contrast, disability-based claims grew from 21 percent to 27 percent of all charges.

Percentage of charges by bases received by the Equal Employment Opportunity Commission and state fair employment practice agencies, 2012 to 2016.
These proportions do not tell us much about the rate at which employees experience or report discrimination. When people perceive that they have been treated unfairly, they first must make sense of why, be aware of their rights, and then take action (Felstiner et al. 1980; Miller and Sarat 1980). In 2016, the General Social Survey (GSS) asked respondents if they felt that they had been discriminated against at work in the past five years. Nine percent of respondents reported having experienced discrimination. Of these, age (24 percent), race (21 percent), and sex (14 percent) discrimination were the most common, while religion (1 percent) and disability (3 percent) were relatively uncommon. 9 Compared with the distributions of complaints to the EEOC, the incidence rates of perceived age, race, sex, and religion discrimination are quite close to their proportions of discrimination charges. 10 Disability discrimination claims stand out for being much more common than the perception of disability-based workplace discrimination. This suggests that the disabled have stronger rights consciousness or access to law than other groups.
Figure 2 reports the same discrimination charges to the EEOC and FEPAs broken down by protected group and standardized relative to every 100,000 employees. Discrimination charge rates on the basis of disability (429 per 100,000 workers) and being African American (195 per 100,000) are much higher than those filed by other groups. Discrimination charges filed on the basis of national origin (50 per 100,000), gender (38 per 100,000), and age (35 per 100,000) are less common. Finally, racial discrimination charges filed by Asians (19 per 100,000), Hispanics (7 per 100,000), and whites (1 per 100,000) and sex discrimination charges filed by men (5 per 100,000) are rare. As individuals who file charges first need to understand their right to do so, the higher rates of charging by disabled workers and African Americans suggests that they encounter more discrimination but also that they are potentially more aware of their rights.
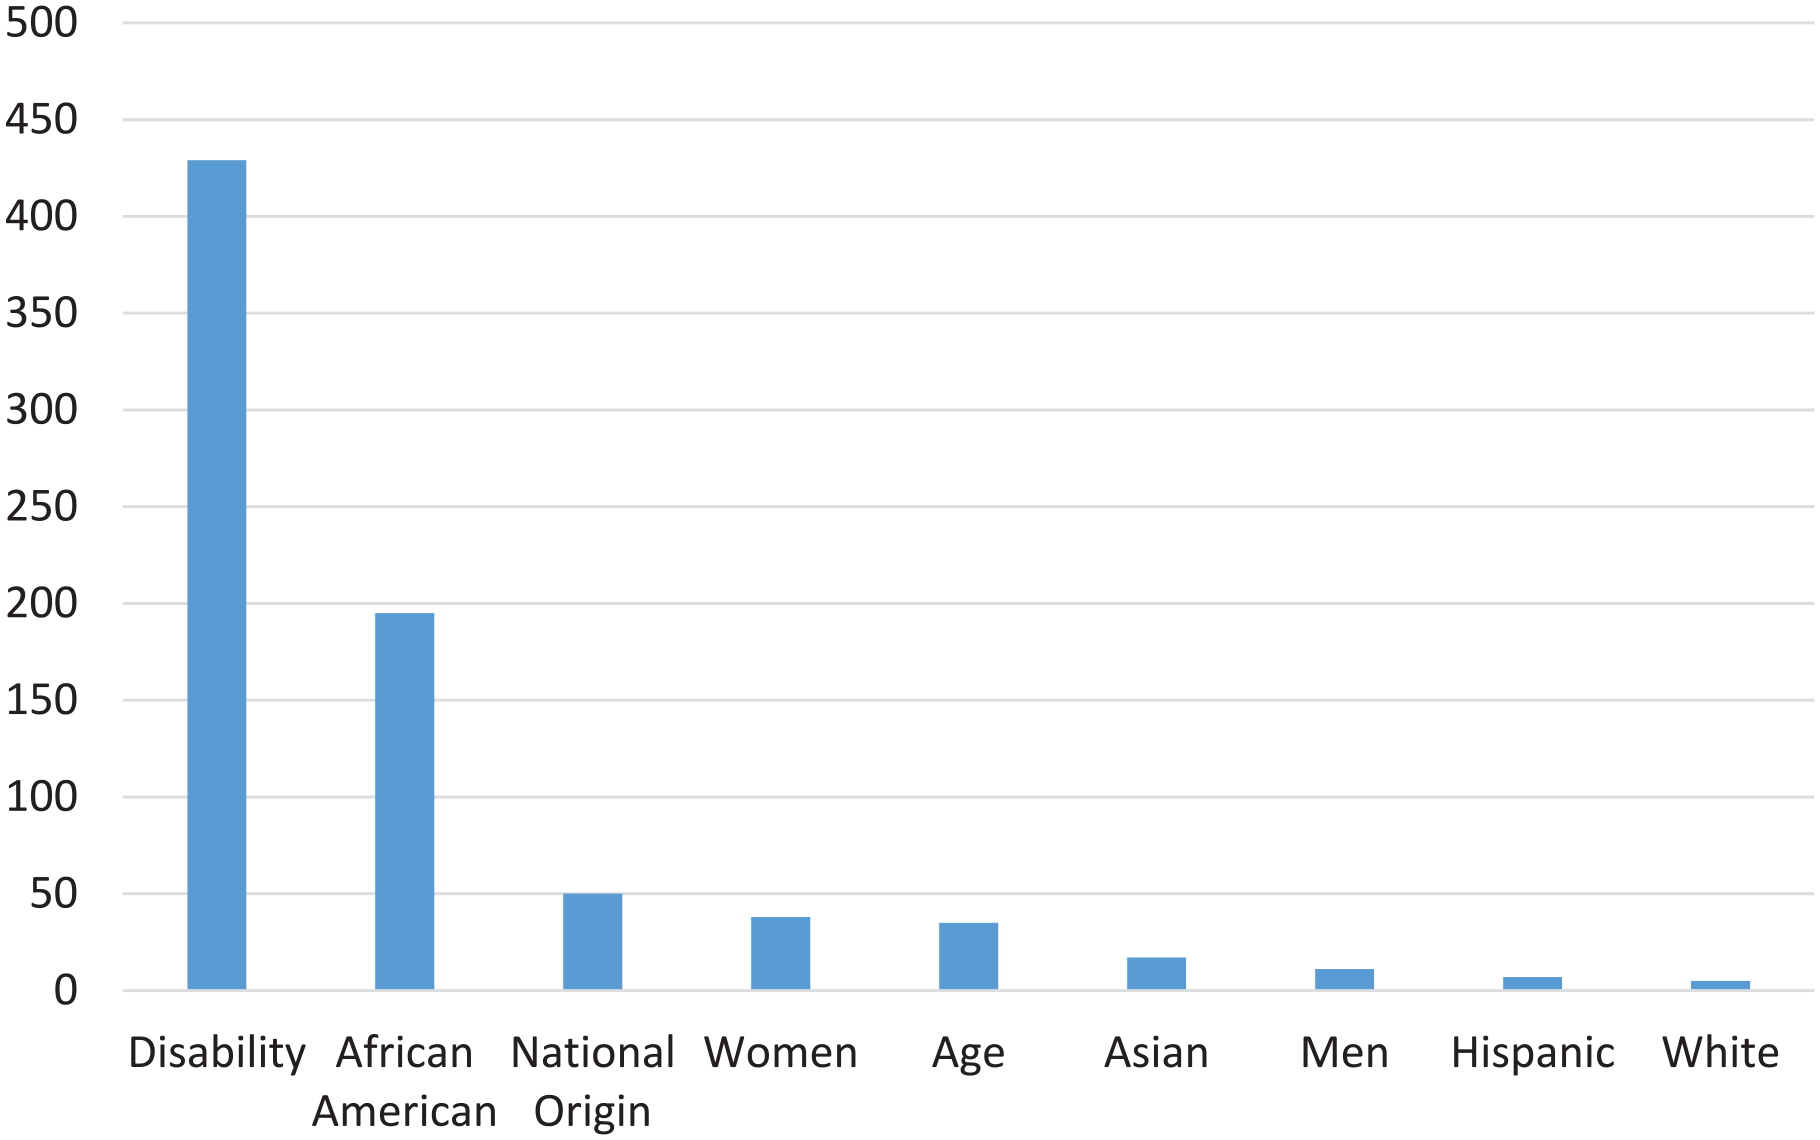
Discrimination charge rates by charging party characteristic per 100,000 employees, 2011 to 2016.
Figure 3 compares the charge rate for the five global protected bases with indicators of employer discrimination and attachment, benefits received, and access to law. Disability charges are associated with marginally higher legal representation, receipt of monetary benefit, change in employer practices, and loss of employment than the other bases. Sex-based claims are marginally more likely to have legal representation and to receive monetary benefits. These differences are small, and the general patterns in Figure 3 do not lead to strong inferences that these factors vary strongly with discrimination bases.

Discrimination bases by indicators of access to law, achieved benefits, employer attachment, and retaliation.
It is striking, however, how much more common employer retaliation and the loss of employment are than either legal representation or achieving either monetary or workplace benefits. This basic pattern confirms earlier research by Berrey et al. (2017) and Roscigno (2007) that describes the fate of discrimination claimants as dominated by harsh employer reactions and limited legal redress.
State Variation in Charge Rates
We created a series of visualization of state-level variation in discrimination charge rates using the Center for Employment Equity’s Diversity Analytics web page. Figure 4 displays heat maps of discrimination charge rates for the 50 U.S. states plus Puerto Rico and the District of Columbia. We report maps for the four most common status bases of discrimination charges: female, Black, disability, and age. There are two striking patterns.

Heat maps of female, Black, disability, and age discrimination charge rates, 2012 to 2016. Darker colors indicate higher discrimination charge rates; grayed-out states have fewer than 30 total charges.
First, there is a great deal of variation in discrimination charge rates across political units. Women file sex discrimination charges at their highest rate, 85 per 100,000 workers, in New Mexico. Their lowest rate in neighboring Utah, is 84 percent smaller, at 14 charges per 100,000 women employees. For African Americans, the highest charge rate is in Iowa, with 719 discrimination charges filed for every 100,000 workers. The lowest rate is in New York, at 65 per 100,000. Disability discrimination charges show similar variation. Disability charge rates max out in Delaware at 851 per 100,000 and are lowest in South Dakota (112 per 100,000). Age discrimination charges by workers older than 40 years are at their highest in Nevada (70 per 100,000) and lowest in Vermont (9 per 100,000). This high level of spatial variation is a surprising and previously unknown pattern.
The second striking pattern in these maps is that although there are no obvious regional patterns, certain states stand out in Figure 4 for having high levels of discrimination charge rates across multiple protected bases. On these four maps, New Mexico, Indiana, and Delaware are particularly prominent among states with high rates of discrimination charges.
In Table 2 we explore state variation in charge rates as a function of the potential impact of rights consciousness (additional equal employment opportunity protections), employer post-complaint discrimination (percentage retaliation), attachment to employers (percentage lost job), monetary compensation (percentage charges receive monetary compensation), workplace change (percentage charges negotiated workplace changes), and access to law (percentage legal presentation). As the explanatory variables have wildly different variability across states, we report standardized coefficients, which can be interpreted as changes in standard deviation units of charge rates for a 1 standard deviation change in explanatory variables. These coefficients are directly comparable across explanations and are equivalent to partial correlation coefficients. As all hypotheses are directional, we use one-tailed tests for statistical significance. The small sample size (n = 52) means that these tests are underpowered. That these are at the state, rather than case, level and are cross-sectional estimates means that any result points toward, but does not establish strong evidence for, a potential causal relationship.
Regression of Charge Rates on Predictor Variables, 50 States Plus Puerto Rico and the District of Columbia.

Note: Values are standardized coefficients (t statistics).
p < .05 and **p < .01 (one-tailed tests).
Our first hypothesis is that in states with more discrimination protections and presumably higher rights consciousness, there would be more discrimination charges filed. This hypothesis is supported, but only for disability charges. The standardized coefficient (β = .425) is quite large. All of the other bases are associated with small, nonsignificant coefficients.
There is no support for the second or third hypothesis that charges would be more common in states where employers further violate discrimination law by retaliating against employees who raise internal complaints or from employees with nothing left to lose because they have lost their jobs.
States with higher rates of monetary benefits associated with discrimination charges have more sex-based charges, but monetary payouts are not significantly associated with more charges on other bases. Thus, support for the fifth hypothesis is limited to sex-based charges. We also estimated these models separately for charges from men and women, and this result was primarily a function of sex-based charges from women, although the coefficient for men was also positive, but smaller and not statistically significant.
In contrast, in states where nonmonetary benefits are more common, we find higher charge rates for all bases, and all, with the exception of national origin, are statistically significant. These are also quite large standardized coefficients, ranging from .27 for race charges to .34 for disability. We see this set of results as striking confirmation of Berrey et al.’s (2017) conclusion that the main motive for filing a discrimination lawsuit was to make things right for oneself and others in the workplace.
A classic hypothesis in the sociology of law is that access to the law, via legal representation, is a prerequisite for filing a claim. State variation in legal representation is not significantly associated with charge rates for any bases. In some ways this is not surprising, as past research suggests that lawyers primarily take discrimination cases they are confident they can win in civil court and after an EEOC or FEPA filing (Berrey et al. 2017). In the case of employment discrimination claims, a person must file a claim with the EEOC or a state FEPA prior to filing a civil suit. Thus for discrimination claims, legal representation becomes necessary only after an EEOC or FEPA claim is filed.
Conclusion
We have discovered two previously undocumented patterns about contemporary employment discrimination in the United States. Charge rates vary dramatically be across protected bases, with more discrimination charges filed by the disabled and African Americans. We also have discovered that there is substantial state-to-state variation in charge rates for all bases.
Our first discovery is that different groups file employment discrimination charges at different rates. Persons with disabilities file employment discrimination charges under the American with Disabilities Act at more than twice the rate of the next most frequent filers, African Americans. Women and workers older than 40 years file employment discrimination charges at much lower rates. Asians, Hispanics, men, and whites file discrimination charges at very low rates. 11 These national-level group differences in charge rates are not, however, strongly associated with common explanations in the literature: employer retaliation, nothing left to lose because of lost employment, charges leading to monetary and nonmonetary benefits, or access to legal representation.
Filing a discrimination charge requires experiencing discrimination, labeling it as such, and access to the legal system (Felstiner et al. 1980; Miller and Sarat 1980). The disabled and African Americans stand out for higher rates of discrimination charge filing than other groups. Legal representation for disability charges is at about the same level as for other bases but less common for African Americans. Thus we can rule out access to the legal system as an explanation for the higher rates of discrimination filings by the disabled and African Americans. This leaves two plausible explanations: these two groups experience more discrimination, and/or they have higher rights consciousness. In our state-level analysis, more discrimination protections, which we interpret as a source of rights consciousness, covaried strongly with more disability charges. Past research has shown that African Americans perceive more employment discrimination but has not been able to distinguish between more (or harsher) discrimination experiences and the potential to have higher levels of rights consciousness (Hirsh and Lyons 2010). Both seem possible explanations for the higher discrimination charge rates associated with African Americans.
Berrey et al. (2017) documented that people who file discrimination lawsuits are initially motived by goals of fixing their workplaces for themselves and those who come after them. Assuming this is the case here, it suggests that the disabled and African Americans experience both more discrimination and have stronger identity-based goals of fixing broken workplaces for other employees than others who experience discrimination.
Our second discovery is that states vary widely in their rates of discrimination charges for all protected bases. Of the nine protected bases of discrimination we examined, the highest charge rate state received charges at 10 times the rate of the lowest. There were seven states that stood out as having high discrimination charge rates for at least six of the nine bases we examined: New Mexico, Delaware, Nevada, Alabama, Indiana, Missouri, and the District of Columbia. High discrimination charge rate states did not stand out for having higher access to legal representation, higher levels of retaliation or job loss, or higher monetary benefits to charging parties.
State-level variation in discrimination charge rates are consistently associated only with the most rare of outcomes: a settlement that includes some change in employer behavior. This supports Berrey et al.’s (2017) qualitative finding that individuals file discrimination claims to fix hostile workplaces. That monetary benefits and legal representation largely do not predict state variation in charge rates supports their observation that the decision to file a claim precedes both. That our measure of rights consciousness is associated only with disability charge rates suggests that a permissive legal environment is particularly encouraging for disability claims but also that it is not salient for other bases of discrimination.
Of course, discovering these two social facts is not the same as providing a strong explanation for their variation. Our regression models are cross-sectional and do not permit strong causal inference. As the first study to document the variation in charge rates and explore state variation, we see all of our interpretative results as interesting but not conclusive.
We think that the rights consciousness framework (Felstiner et al. 1980; Miller and Sarat 1980) remains a good place to start further exploration of this variation. Even more promising is the work of Berrey et al. (2017), which points toward social, rather than financial, motives for filing discrimination lawsuits, as crucial. Other promising approaches might be to examine variation in the role of group threat in producing discrimination (Maume, Matthew, and Wilson 2018), local political context (Wakefield and Uggen 2004), cultural variation in tolerance for discrimination (Skaggs 2009), the legal system’s receptiveness to discrimination claims (Skaggs 2008), and the activities of local EEOC and FEPA offices in terms or ease of access to file claims and the promotion of rights consciousness. 12 We also think that more attention should be paid in the future to the impact of claim outcomes and charge rates at the intersection of various bases.
At a more abstract level, the low rate of benefit receipt in all states is consistent with a critical realist approach to law, which sees the legal control of discrimination case processing as the primary outcome of the employment discrimination legal system, with satisfying legal claims of those who experience discrimination an incidental and relatively rare result (Nielsen, Nelson, and Lancaster 2010). From this point of view, state variation in discrimination claims may be driven primarily by the normative orientation of regulators and courts as influenced by lawyers and employers, rather than those who experience discrimination. However, if the point of discrimination law is to reduce discrimination, then the motive of charging parties—to fix hostile and broken workplaces—is the place to look for solutions.
There are implications of this research for efforts to stop workplace discrimination as well. First, bad behavior by employers is much more common than positive outcomes for charging parties. That bad employer behavior does not generate higher charge rates suggests that although illegal, these are effective strategies to silence employees who are brave enough to fight for their rights. Second, discrimination claims do not seem to be particularly responsive to the probability of personal gain, nor do more lawyers lead to more claims. At least for initial discrimination claims to the EEOC and FEPAs, motives seem much more altruistic: discrimination claims are higher when workplace interventions are more common. Common employer and legal strategies to vilify discrimination claimants may work to insulate employers from the hard but necessary work of examining how they can manage their workplaces to be more respectful places for everyone. This suggests that regulators such as the EEOC and local FEPAs, as well as the courts in the case of civil suits, should spend more of their efforts on shifting the normative and managerial frameworks in workplaces and less on legally “proving” discrimination.
Footnotes
Acknowledgements
We thank Steven Boutcher and two reviewers for helpful comments.
Funding
The author(s) disclosed receipt of the following financial support for the research, authorship, and/or publication of this article: This research was supported by a grant from the W. K. Kellogg Foundation.