
Abstract
In the context of growing interest in social networks and the sociology of graduate education, the authors examine a relational feature of postbaccalaureate study that has received particularly little attention: the doctoral committee. Data on committee memberships speak to multiple theoretical issues and are presumably maintained by most doctorate-granting institutions, yet this information is seldom aggregated or analyzed. Here, the authors draw on records from the University of California, San Diego to illustrate the utility of doctoral committee data for four areas of sociological inquiry: interdisciplinary knowledge production, departmental community, inequality in the workplace division of labor, and variation in student outcomes. For each, the authors present core findings, discuss their implications, and suggest directions for future research.
Network analysts have long observed an irony of mainstream sociological research: society is defined by human interdependence, and yet much of our work takes the individual, if not the isolated individual, as the central unit of analysis (Freeman 2004). 1 This approach makes particular sense for sociologists of education. Schools “do their work” on individuals; data on individual student experiences, achievements, and attainment levels are painstakingly recorded by teachers and scholars alike; and inequality in these (and later life) outcomes is a central and crucially important focus of the field (Stevens, Armstrong, and Arum 2008:141–42).
Nonetheless, there are exceptions to this trend. On one hand, a vast body of work draws attention to the informal relational environments that so heavily influence students’ experiences and reproduce core dimensions of inequality (e.g., Armstrong and Hamilton 2013; Gansen 2017; Lewis 2003). On the other hand, scholars have used formal network analytic techniques to map various sorts of relationships among teachers (Coburn, Mata, and Choi 2013; Frank et al. 2011), parents (Li and Fischer 2017; Morgan and Sørensen 1999), and, most commonly, students themselves. This research spans from elementary to higher education and focuses predominantly on two areas: segregation (considering networks as fences or bridges that enclose or span social groupings; e.g., Moody 2001; Stearns, Buchmann, and Bonneau 2009; Wimmer and Lewis 2010) and peer influence (considering networks as conduits of information, attitudes, and behaviors; e.g., DeLay et al. 2016; Kretschmer, Leszczensky, and Pink 2018; Raabe, Boda, and Stadtfeld 2019).
We join this body of work by mapping social networks in an educational setting. However, our focus is a class of relationships that is hierarchical rather than lateral: the ties between doctoral students and their dissertation committee members. These ties have a distinct relational structure. In his classic piece “The Duality of Persons and Groups,” Breiger (1974) argued that group membership is itself a kind of network tie: groups represent the “intersection” of individuals, while individuals can likewise be defined by the specific constellation of groups to which they belong (cf. Simmel 1955). We extend this perspective to the case of doctoral committees. In other words, we observe that such committees entail the “intersection” of faculty members for the purpose of advising a particular doctoral student’s dissertation and likewise recognize that a core dimension of faculty careers and identities consists of the various students whom they have advised. 2
Although records of committee membership are presumably maintained by most doctorate-granting institutions, published analyses of these data are rare. Our aim is to demonstrate, using the case of the University of California, San Diego (UCSD), that we are missing a valuable and multifaceted opportunity. Specifically, we illustrate the potential of doctoral committee data to shed light on four areas of sociological interest: interdisciplinary knowledge production, departmental community, inequality in the workplace division of labor, and variation in student outcomes. Although our methods include formal network analysis as well as more traditional, individual-based approaches, we emphasize the utility of relational thinking for sociologists of higher education (Biancani and McFarland 2013; Kezar 2014); and though we prioritize proof of concept, the patterns we document are novel, at times striking, and worth further attention.
We begin by briefly reviewing past literature on doctoral advising and describing four different ways of conceptualizing dissertation committee data. We then describe our data and present four exploratory analyses (each motivated by one of the four conceptualizations). We conclude by summarizing results and implications and suggesting directions for future research.
Previous Research
Although most research in the sociology of education focuses on elementary, secondary, and undergraduate schooling, graduate education is increasingly important to inequality in the United States (Posselt and Grodsky 2017). Between 2000 and 2018, the number of people age 25 and older with doctoral degrees grew from 2 million to 4.5 million (U.S. Census Bureau 2000, 2018). As of 2017, Americans with doctorates had a median annual salary of $90,000, compared with $70,000 and $56,500 for those with master’s and bachelor’s degrees, respectively (National Science Foundation 2017). Graduate degree holders are also heavily overrepresented among “the 1 percent” (Keister 2014).
When sociologists examine postbaccalaureate study, they tend to focus on inequality at “key junctions” such as matriculation and degree attainment (see review in Posselt and Grodsky 2017). In other words, the emphasis is on “sieve” rather than “incubator,” to use Stevens et al.’s (2008) metaphors, and we know comparatively little about the “experiential core” of graduate life. Of course, for doctoral students, the cornerstone of this experience is the dissertation.
The nature of doctoral education varies markedly by discipline (Delamont, Atkinson, and Parry 2000), and requirements for degree completion and doctoral committee constitution are institution specific. That said, prior research has focused on general features of adviser-advisee relationships (Benmore 2016; Lee 2008; Taylor et al. 2018; Zhao, Golde, and McCormick 2007), emphasizing their central role in academic socialization (Delamont et al. 2000; Leahey 2006). A large body of work (e.g., Bargar and Mayo-Chamberlain 1983; Cardozo 2006; Delamont, Atkinson, and Parry 2004) is prescriptive (and at times autobiographical), including a special edition of the American Sociologist dedicated to informal professionalization in sociology (Shulman and Silver 2005).
Although several of these accounts suggest thinking “beyond the dyad” in terms of doctoral advising (Burawoy 2005)—and develop such concepts as “mentoring constellations” (Higgins and Kram 2001) and “macro-mentorship” (Kealy and Mullen 1999; see also Sweitzer 2009)—we are aware of only one effort to operationalize these constructs in terms of doctoral committees (a study of academic genealogy in library and information science; see Russell and Sugimoto 2009; Sugimoto 2012; Sugimoto et al. 2011). Building on this work, we argue that doctoral committees are important social facts in graduate education, more than simply the sum of their parts (Durkheim 1982), and that patterns in committee membership can be illuminating in multiple ways.
Conceptualizing Committees
Doctoral committees can shed light on multiple areas of substantive interest, each focusing on a slightly different aspect of the data and a different understanding of what they represent. Although we focus on four conceptualizations, others are certainly possible. First, committees are reflections of broader social structures, among both (1) large organizational units (e.g., departments or disciplines) and (2) individual students or faculty. Second, dissertation committees are sites of inequality, among both (3) faculty (in terms of the distribution of advising) and (4) students (in terms of important outcomes like attrition or time to degree). We consider each in turn.
Interdisciplinarity
Knowledge production is a social endeavor (and increasingly so; Leahey 2016) and we cannot fully understand an intellectual contribution without considering its relational context. This is at once a core premise of the sociology of knowledge and of a substantial body of work examining collaboration patterns within (Moody 2004) and across (Schummer 2004) disciplines.
The latter are particularly noteworthy. “Bridges” between intellectual communities play a crucial role in fostering creativity (Fleming, Mingo, and Chen 2007) and the volume and patterning of such ties has been used as an indicator of interdisciplinarity (Jacobs and Frickel 2009). Rawlings et al. (2015), for instance, draw on comprehensive data on faculty collaborations and departmental affiliations in their study of intellectual cohesion at Stanford; and Sugimoto et al. (2011) examined the academic background of committee members to understand changes in the field of library and information science. Similarly, when a doctoral student appoints a committee member outside of their home department, this establishes both a social and an intellectual linkage. Aggregating such ties provides a map to interdisciplinary influences in knowledge production and illuminates the degree (and contours) of fragmentation versus integration in university communities.
Local Community
A second conceptualization of doctoral committees focuses on local rather than global structures. Here, rather than considering how ties between students and external members are patterned across departments, we might look within a single department and examine connections among faculty (cf. Fleming et al. 2016) via the students they together advise. 3
In stark contrast to “big data” analyses of social networks (Lazer and Radford 2017), such an approach is reminiscent of classic “small-n” network studies that are much more ethnographic in nature. The structure of a coadvising network is challenging to predict. Two faculty may be appointed to a committee because of their areas of specialization and/or because they get along (with each other or the student), again reflecting the jointly intellectual and interpersonal nature of academic production. Appointments are also constrained by departmental and disciplinary rules and conventions (see Zhao et al. 2007:265). Consequently, we can expect to find multilevel variation both within and across departments: individual faculty may be central or peripheral, certain dyads may work together more or less often, and departments may be integrated as a whole or divided into factions (on the basis of research foci, methods, or ideological commitments).
Faculty Participation
The previous two conceptualizations suggest using doctoral committee data to identify the structure of (respectively, macro and micro) social networks. A third possibility is to consider participation in doctoral advising as an outcome in its own right.
A long line of research, stemming from Kanter’s (1977) foundational work, examines the impact of gender ratios on workplace experiences (e.g., Roth 2004; Turco 2010; Yoder 1994). Although the proportion of doctorates awarded to women has increased dramatically (England et al. 2007), women are still underrepresented in faculty positions, employed at lower status institutions and ranks, and underpaid compared with their male counterparts (Jacobs 1996; Monroe and Chiu 2010). Women, especially women of color, also experience various forms of marginalization (Aisenberg and Harrington 1988; Noy and Ray 2012; Turner 2002) and spend more time on teaching and service (and less on research) compared with men (Link, Swann, and Bozeman 2008; Winslow 2010).
Although there is a broad literature on gender and mentoring (e.g., Noe 1988), research on doctoral advising tends to focus on same-gender relationships (e.g., Main 2014; Smeby 2000; see also Sallee 2011). Gender may influence committee appointments in numerous ways, including its correlation with actual or perceived mentoring ability (which may be biased toward women), research prowess (which may be biased toward men), and willingness to “say yes” (which is almost certainly biased toward women; cf. Denker 2009; Pyke 2011). To our knowledge, the upshot of these dynamics, in terms of the actual distribution of advisees by faculty gender, is unknown.
Student Outcomes
Finally, we may explore the properties of doctoral committees in the context of student outcomes. Previous research has focused on the causes of attrition (Bowen and Rudenstine 2014), time to degree (Tuckman, Coyle, and Bae 1990), and student satisfaction (Barnes and Randall 2012). The central question for much of this research (as summarized by Posselt and Grodsky 2017:365) amounts to the following: “who is responsible . . . the individual or the institution?”
But this is a false binary. Between individual and institution are a variety of social relationships, including those between advisers and advisees (see review in Sugimoto 2012), that substantially influence the graduate experience. Committee members may provide practical guidance or emotional support; they may pull the student in confusing, conflicting, or unrealistic directions or provide clear, united, and feasible advice; they may broker connections with people or resources; and they may offset (or exacerbate) issues with the central adviser (cf. Bargar and Mayo-Chamberlain 1983; Posselt 2018; Sternberg 1981). As obvious as such factors may seem for anyone who has pursued graduate study, we are not aware of any research that has systematically explored the properties of doctoral dissertation committees in conjunction with doctoral student outcomes.
Data
As should be clear from the preceding discussion, doctoral committee data may be used for a variety of scientific ends. Before presenting our results, we provide a brief overview of our data set, its limitations, and its institutional context. In supplementary material, we describe how our data were cleaned, coded, and manipulated for each of the specific analyses that follow.
Original Data Set
We acquired our data from the UCSD Graduate Division. The original data set spanned from June 1989 to April 2017. However, we were notified that the electronic records were inconsistently maintained and should be considered comprehensive only for committees constituted in February 2013 or later. We refer to these as the full and subset data, respectively, and (except for Part IV) focus on the latter.
The data were stored in a row-by-column format. However, like most network data sets, rows in our data refer to relationships, not individuals. Most important, each row contained (1) a unique, random identifier referring to a specific doctoral student and (2) the full name of a committee member. Such data are considered two-mode (or bipartite) because they represent two classes of entities—here, students and faculty—where only ties between classes (advising relationships) are permitted. A visualization of this data structure is presented in Figure 1.

Illustration of underlying data structure.
This basic relational skeleton was accompanied by additional information (i.e., other columns in the data matrix). Some of this information referred to the relationship itself: the date on which the committee member was appointed 4 and whether the appointment was for a new or “reconstituted” committee (see Part IV). Other information referred to the faculty member, including current rank, departmental affiliation, and committee role (chair, co-chair, or member). Still other information referred to the student, including degree program, type of degree (PhD, EdD, DMA, or AuD), and the date of graduation or withdrawal (if applicable). Our original data set consisted of 52,702 appointments, including 8,473 students across 42 programs.
Limitations
Our data and analyses face several limitations that are important to acknowledge from the outset. Greatest among these obstacles is the absence of data on individual students (including student-doctoral education fit; Baker and Pifer 2015; Ward and Brennan 2020). Although necessary to preserve their anonymity, this means we were unable to explore variation in committee properties by demographic traits—much less control for these traits in our investigation of attrition. Although the Graduate Division generously provided us with all electronic records, comprehensive digital storage was not implemented until 2013, such that we draw on older data sparsely and cautiously. In the course of data processing, we discovered formatting inconsistencies, occasional missing data, and some outright errors (e.g., typos and duplications). We mention these issues in order to qualify interpretation of our results (lest there were other errors we missed), caution future researchers, and alert institutional recordkeepers. Finally, given the illustrative nature of these analyses, we cannot assume that our results are generalizable, especially to elite institutions or educational systems in other countries that may not resemble the public American context considered here.
Institutional Context
Founded in 1960, UCSD is a large public research university known for its inclusive science, technology, engineering, and mathematics (STEM) education (Clark 2016) and contributions to social mobility, research, and public service (Johnson 2018). As of fall 2018, UCSD had 2,535 faculty (1,317 of whom are ladder-rank), 8,037 graduate and professional students (including 3,269 doctoral students), and 30,285 undergraduates (UC San Diego 2019b). Also as of 2018, just over 60 percent of academic personnel identified as men, as did 62 percent of newly admitted graduate students and 49 percent of new undergrads (UC San Diego 2019a).
UCSD also maintains policies surrounding doctoral committee appointment. 5 Two are particularly consequential. First, all committees must include at least five “officers of instruction” at UCSD, four of whom must hold professorial titles. Second, committees must include two members representing “academic specialties” different from the student’s, at least one of whom must be a tenured or emeritus UCSD faculty member from outside the student’s home department. For these reasons, doctoral committees at UCSD tend to be slightly larger than at many other institutions and require some degree of interdisciplinarity, the point at which we begin our analysis. 6
Results
Part I: The Macro-structure of Knowledge Production
In the visualization in Figure 2, we find a distinct structure to interdisciplinary advising at UCSD, reflecting broad patterns in academia as well as features specific to this university. Arcs (directed ties) point from students’ degree program to their committee members’ departments. We focus on new committees, ensuring that each student is featured only once. We exclude within-department ties (“loops” in network terminology) and committee members with joint affiliations, a non-UCSD affiliation, or (rare cases of) a UCSD affiliation with no clear department. Unshaded nodes are departments with no doctoral students, darkly shaded nodes are interdisciplinary degree programs with no dedicated faculty, and lightly shaded nodes are standard departments with doctoral programs. For a list of affiliations, see the Appendix.

The network structure of interdisciplinary committee membership.
Perhaps unsurprisingly (at this STEM-heavy university), at the center of the map is the Department of Computer Science and Engineering. Programs with no dedicated faculty or no doctoral students are peripheral, with the glaring exception of the medical school, whose faculty advise students from across the natural sciences. On the basis of this visualization, there appears to be a slight cleavage between engineering and the physical, biological, and health sciences at the top and the social sciences, arts, and humanities at the lower left. (Interestingly, the peninsula of arts and humanities bifurcates the social sciences.) A hierarchical cluster analysis refines this impression: we find three large clusters corresponding to the biological and health sciences, the physical sciences and engineering, and the social sciences, arts, and humanities, with two smaller clusters consisting of fields related to language and the mind on one hand and money, management, and politics on the other. Full results are presented in the supplement. 7
It is also instructive to highlight selected dyadic exchanges. Because line thickness represents proportional (rather than absolute) membership flows, some of the most visually arresting arcs stem from relatively small degree programs (e.g., AUDL, CLIN, and PUBL) that draw heavily on medical school faculty. (Also unsurprising are the thick ties running from NENG and CENG to NANO, the administrative home of these two programs.) Focusing solely on departments with both faculty and students, the thickest arc runs from ethnic studies to literature: literature faculty constitute 67 percent of external appointments for doctoral students in ethnic studies. The strongest reciprocal relationship is between economics and the Rady School of Management (where more than 35 percent of external members from each department are appointed from the other). The second largest asymmetry in membership flow (the largest being that ethnic studies faculty constitute only 20 percent of external appointments from literature) is that a third of music students’ external appointments are theater faculty, while no music faculty serve on theater committees.
Part II: The Micro-structure of Committee Comembership
In this section, we continue to examine the network structure of committee memberships. However, instead of interdepartmental links between students and faculty (where nodes represent “sending” and “receiving” affiliations), we look at intradepartmental links among faculty (where nodes are individuals). Specifically, we consider how faculty are connected via students they coadvise (cf. Breiger 1974). Among other notable features, we find that coadvising communities at UCSD are segregated by gender and rank.
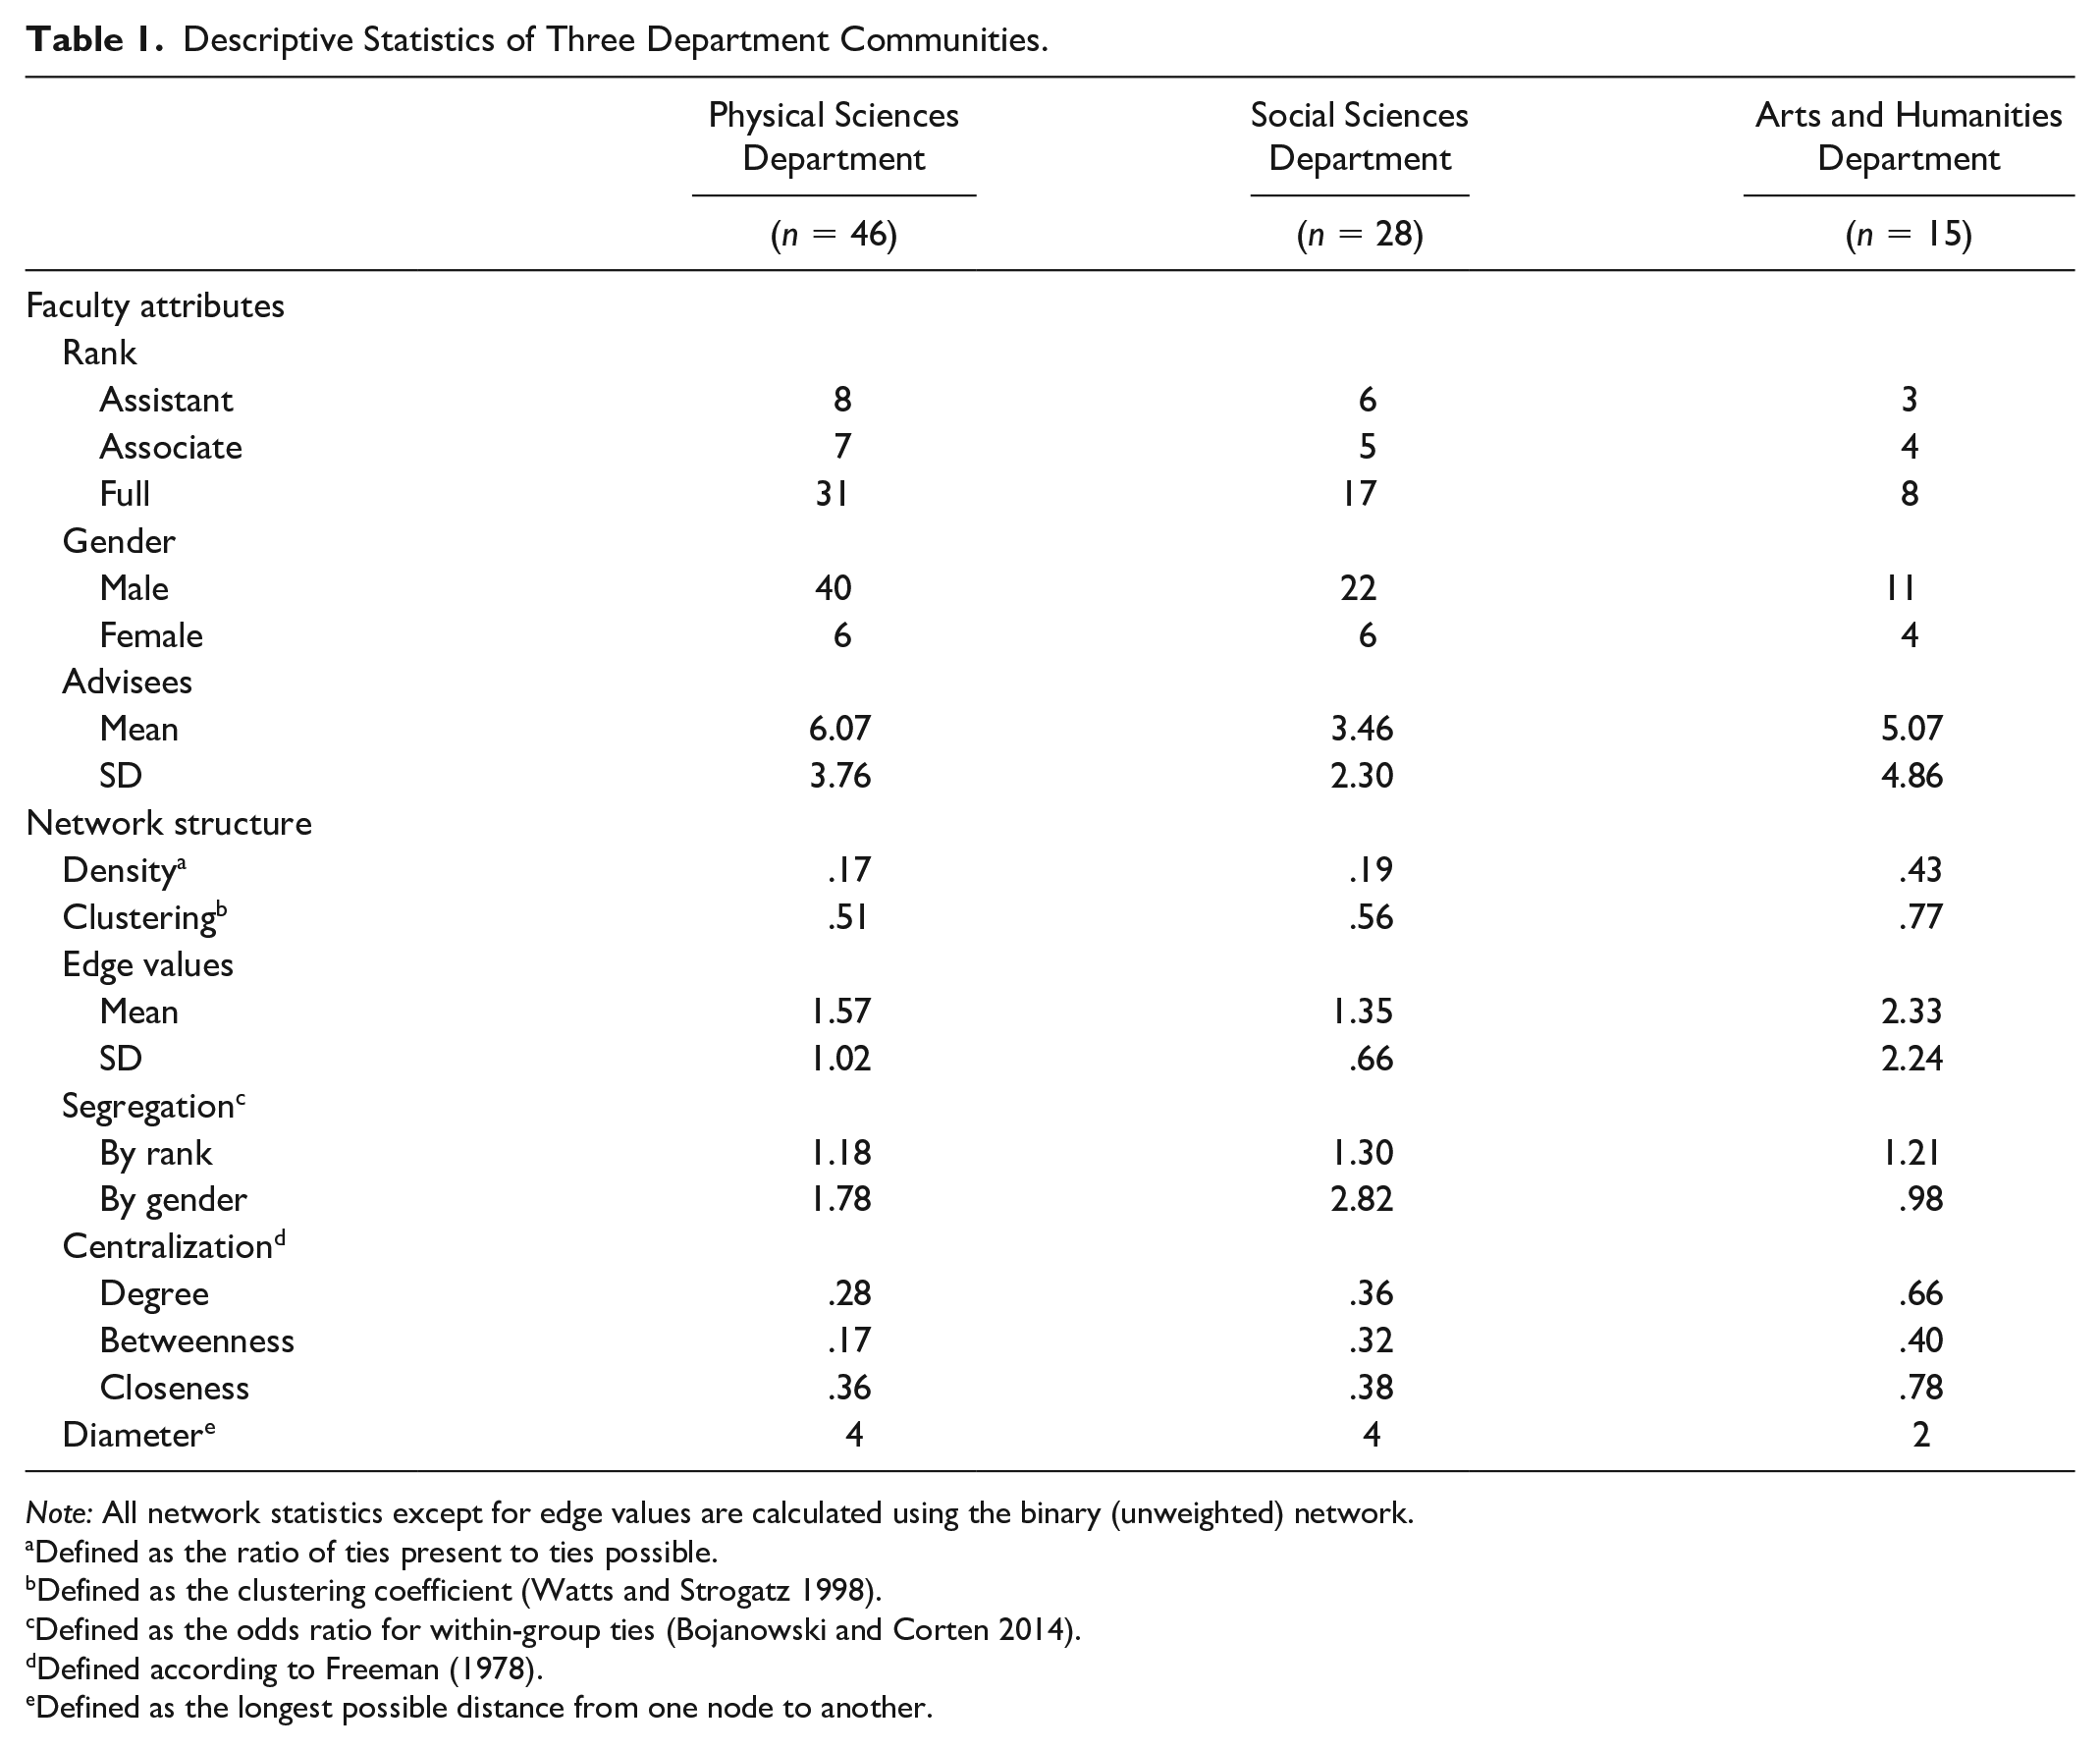
Although this approach could be taken for any number of departments—or for the entire campus, including both intra- and interdepartment comemberships—we focus here on three illustrative departments representing a diversity of sizes, network structures, and academic divisions: one each from the physical sciences, social sciences, and arts and humanities. Visualizations are presented in Figure 3. Here, nodes represent individual faculty, and edges (undirected ties) indicate that two faculty have served on the same committee (thicker edges mean more shared committees). In network terminology, we are looking at the one-mode projection (“one” because these networks feature a single kind of entity, faculty) of the underlying two-mode data. Accompanying descriptive statistics are presented in Table 1.

Illustrations of intradepartment faculty comembership networks.
Descriptive Statistics of Three Department Communities.
Note: All network statistics except for edge values are calculated using the binary (unweighted) network.
Defined as the ratio of ties present to ties possible.
Defined as the clustering coefficient (Watts and Strogatz 1998).
Defined as the odds ratio for within-group ties (Bojanowski and Corten 2014).
Defined according to Freeman (1978).
Defined as the longest possible distance from one node to another.
Similarities and differences across departments are evident in both visualizations and quantitative metrics. In all three departments, men outnumber women, and full professors outnumber assistants and associates combined (both imbalances increase the larger the department). On average, physical science faculty have one more advisee than arts and humanities faculty, who in turn have more advisees than social scientists (even though their department is half the size).
In terms of social structure, the arts and humanities department is a small, bowtie-like network focused on three faculty: two male full professors and one female assistant professor. (Correspondingly, this network is the most “centralized” according to all three summary statistics; see Freeman 1978.) Faculty in this department, perhaps because of its size, tend to serve on committees together more often: the density (proportion of possible ties actually present), .43, is more than twice that of the other two departments; and when two faculty work together, they tend to do so more often (the average number of shared committees is 2.33, with a striking maximum of 12). A common measure of segregation in social networks is the odds ratio (OR) for within-group ties, which assesses how the odds of a tie being present (vs. absent) vary between “within-group” and “cross-group” dyads (Bojanowski and Corten 2014:21). Among the three departments, the arts and humanities community is the only one in which women are completely integrated (OR = .98), although it is similar to the others in being somewhat segregated by faculty rank (OR = 1.21). Finally, there are relatively few open triangles, reflected by its high clustering coefficient (Watts and Strogatz 1998).
Comparing the physical and social science departments, the latter is slightly denser, more clustered, and more centralized. Although social science faculty who work together do so less frequently (an average of 1.35 compared to 1.57 shared committees), the standard deviation is also lower. There is a core of three male full professors in this department, every pair of whom has served on at least three committees together. 8 Although very different in size, the two networks are equally “wide” (requiring, at most, four “steps” to get between any two faculty in the department). Finally, they both display segregation by rank and (especially) gender: the odds of a same-gender tie are 1.78 and 2.82 times greater (in physical and social science, respectively) than the odds of a cross-gender tie. This is clearly visible in the diagrams, in which in both cases a small group of women appears at the periphery of the network (although a notable exception in the physical science department, without whom the measure of gender segregation would be much higher, is a relatively central female associate professor who is connected only to men). 9
Part III: The Workplace Division of Labor
We now approach our relational data from a very different angle. Namely, we examine differential participation in the network of committee memberships as itself a potential source of inequality. We find that the quantity of students advised (or “degree centrality” in network terms) is unequally distributed by faculty rank, gender, and academic department.
We begin in Figure 4 by examining the gender distribution of chairs, co-chairs, and standard (nonchair) committee members compared with the distribution we would expect from chance (calculated two ways, each described in the supplement). Across time, we see that doctoral committees include about one woman for every three or four men, and there is generally a greater representation of women among chairs than nonchair members, though this pattern flips in 2016–2017. Compared with the “narrow” opportunity structure, women are consistently underrepresented as committee members and as co-chairs in all four academic years, by 1 percent to 6 percent; and though the proportions of eligible female faculty and of female chairs are close in 2013–2014 and 2014–2015, they diverge in 2015–2016 and (especially) 2016–2017. The more rigorous, “broad” estimate (available only for 2014–2015) supports this conclusion of female underrepresentation, most of all as co-chairs and least as chairs.

Gender composition (percentage female) of doctoral committees and eligible population estimates, by academic year.
Continuing to focus on 2014–2015 (the sole year for which we were able to discern the quantity of committees on which each faculty member served, including faculty who appear to have been present at the university but did not serve on any), we produced two additional figures. 10 First, in Figure 5, we present the distribution of committee memberships by gender and rank. Across all four ranks, women are underrepresented on doctoral committees compared with men. This difference is least pronounced among adjunct and assistant professors and most pronounced among full professors. Interestingly, these trends vary depending on whether faculty are appointed to committees within or external to their own department. For internal appointments, female assistant and adjunct faculty (notably, the two untenured populations) serve on more committees than their male counterparts. Externally, female associates serve on slightly more committees than male associates, but otherwise male appointments occur more often, especially among adjuncts. 11

Distribution of committee memberships by gender and (selected) rank.
Second, in Figure 6, we feature differences by department. We highlight several trends in this information-heavy display. (The underlying data are presented in the Appendix.) The quantity of departments in which women (on average) advise more students than men (i.e., nodes above the line) is identical to the quantity of departments in which men advise more students than women (i.e., nodes below the line), suggesting that the aggregate disparities in Figures 4 and 5 are partially attributable to interdepartmental differences. Larger departments tend to have smaller proportions of women (ρ = −0.51, p < .01); the greater the proportion of women in a department, the fewer advisees per male (ρ = −0.57, p < .01); and, interestingly, the most extreme imbalances (i.e., outliers) in the distribution of advising occur in very different departments: ethnic studies (a relatively small department with the second highest proportion of women) and electrical and computer engineering (a rather large department with the second lowest proportion of women). In both, the average female faculty member served on over 2.5 more committees than the average male faculty member.

Gender distribution of committee memberships, by academic department.
Part IV: The Patterning of Reconstitutions and Withdrawals
For our final analyses, we shift attention to student outcomes. Although the scope and depth of our exploration are limited by available data, we are still able to examine the nature and correlates of two possible events in the life course of a dissertation committee: reconstitution and termination (whether due to graduation or withdrawal). Most interestingly, we find that the very experience of committee reconstitution is the strongest predictor of student retention.
Reconstitutions
A reconstitution occurs when a student makes a formal change in their committee membership, whether by adding and/or dropping one or more members and/or altering who is chair, requiring the submission of new paperwork. How often do reconstitutions occur, what do they look like, and what are their consequences?
Among all students in our full data set, 30.1 percent reconstituted their committees at least once (and 3 percent more than once). Among students who appointed their first committees in February 2013 or later, 18.5 percent reconstituted their committees at least once (and are the focus of the ensuing analyses). Among such students who also graduated within the scope of our data (i.e., by April 2017)—that is, cases that are not right censored—26.3 percent reconstituted their committees at least once.
Among students who experienced reconstitutions, we can compare the size and composition of their first committees with their final committees in our data. (Of course, it would also be possible to look at intervening steps for those who experienced multiple reconstitutions.) Table 2 presents the distribution of these differences. Specifically, among those 450 students who experienced reconstitutions, 62 (13.8 percent) neither added nor dropped any members but merely appointed (a) different chair(s). Eight-six students (19.1 percent) merely added one member; 32 (7.1 percent) merely dropped one member; and most common of all, 189 students (42 percent) replaced exactly one committee member with another. The remaining 81 changes (18 percent of students) involved adding and/or dropping at least two members, although the quantity added usually matched the quantity dropped.
Distribution of Committee Reconstitutions.

Note: Statistics refer to differences between first and last recorded committees among students who appointed their first committee in February 2013 or later and experienced at least one reconstitution. Instances in which no faculty were dropped or added reflect a change in committee chair(s).
Aggregating all reconstitutions, there were 450 faculty additions (coincidentally, the same number as above) compared with 388 removals. Figure 7 compares the composition of these changes. Women were more likely to be added (28.7 percent of additions) than dropped (21.7 percent of removals), as were assistant professors (15.8 percent vs. 11.6 percent). Associate professors were more likely to be dropped (24.7 percent) than added (20.7 percent). Nearly half of all changes (whether drop [47.9 percent] or add [46.9 percent]) involved full professors, and nearly half of all changes (whether drop [44.6 percent] or add [45.5 percent]) involved members external to the students’ departments (including external to the university). 12

The composition of committee reconstitutions.
Finally, we can divide the 2,439 students who appointed their first committee in February 2013 or later into three categories depending on their status by the end of our observation window: 803 (32.9 percent) had graduated, 71 (2.9 percent) had withdrawn, and 1,547 (63.4 percent) had neither graduated nor withdrawn. 13 Reconstitutions were experienced by 26.3 percent of graduates (as noted earlier), 15.5 percent of withdrawals, and 14.5 percent of current students (although more will plausibly join this group before withdrawing or graduating). In other words, reconstitutions are 1.7 times more common among students who graduate than those who withdraw, a finding we return to below.
Withdrawals
A centrally important outcome is whether doctoral students ultimately complete their degrees. We focus here on two kinds of students: those who have graduated, on one hand, and those who have “permanently” withdrawn, on the other. 14 (Currently enrolled students might end up in either category and so are uninformative for this analysis.)
To assess the correlates of withdrawal—while attempting to account for biased selection into our data set as well as the impact of degree program (de Valero 2001; Golde 2005) and time—we match every withdrawn student with at least one “control” from the same program who constituted their committee in the same year but instead went on to graduate. 15 (If a student reconstituted their committee, we focus on their first committee only.) We then compare the properties of withdrawn students’ committees with those of matched controls. As a robustness check, we examine all students who either graduated or withdrew and use multivariate logistic regression to predict withdrawal, where explanatory variables include all of the same committee properties as well as fixed effects for degree program and year. We note that in both approaches, controlling for degree program may help ameliorate the absence of data on student characteristics, insofar as such characteristics are associated with field of study (Posselt and Grodsky 2017:367–69).
Selected results from the matched comparisons are presented in Figure 8, and full results from the regression models are presented in the supplement. Comparing withdrawn students with matched graduates, we find no significant differences in terms of average committee size or the average quantity of female, assistant, associate, full, or non-ladder-rank faculty members. We also find no significant differences in terms of the proportion of committees with a co-chair, female chair, or full professor chair. However, only 7.5 percent of withdrawn students had assistant professor chairs, compared with 11.8 percent of graduated students (p < .05); 25.5 percent of withdrawn students had associate professor chairs, compared with only 17.4 percent of graduated students (p < .001); and 35.1 percent of withdrawn students had all-male committees, compared with only 29.5 percent of graduated students (p < .05). Most strikingly, withdrawn students were less than half as likely to have experienced a reconstitution (12.9 percent vs. 27.3 percent; p < .001). Results from our robustness check support these conclusions. 16

Proportion of committees with various binary features, by whether the student ultimately graduated or withdrew.
Discussion
As Stevens et al. (2008) cautioned, “the presumption that higher education does its work on individuals should not lead us to ignore the fact that people experience schooling as a thick web of relationships” (p. 142). We considered a particularly important feature of this web in the case of graduate education: the “knots” of intersecting ties created by dissertation committees. Inspired by Breiger (1974)’s insights, we argue that doctoral committees reflect the mutually constitutive nature of students and faculty—and can be used to explore at least four features of higher education. Results based on a case study of UCSD provide a concrete illustration of this potential.
First, patterns of external appointment provide maps of interdisciplinary knowledge production. At the center of this network in the case of UCSD is the Department of Computer Science and Engineering, surrounded by the core physical sciences of chemistry and physics, the Scripps Institution of Oceanography, and the School of Medicine, whose faculty serve on committees throughout the natural sciences. Social sciences, arts, and humanities openly intermix and are somewhat removed from the STEM departments on campus. Future steps might include considering the physical locations of departments, connections with non-UCSD affiliates (here suppressed), or how this map evolves over time.
Second, patterns of committee comembership illuminate the contours of local communities. Although our approach could be extended to any (or all) others, the departments we examined varied in size, composition, and network structure, including levels of centralization and frequency of collaboration. However, a noteworthy commonality between two of the three departments—and indeed, a global feature of the university—is the extent to which the minority of female faculty are cut off from the broader community. Committee comembership is also more common among faculty who share the same rank. As with all forms of segregation, this means the many kinds of resources that flow through networks will tend to be localized (cf. McPherson, Smith-Lovin, and Cook 2001) and reminds us that inclusion is not synonymous with integration.
Third, participation on doctoral committees is itself a source of inequality, in terms of both the division of labor (given the considerable time doctoral advising consumes) and the distribution of impact on the next generation of scholars. At UCSD, women are underrepresented as committee chairs and members, especially at tenured ranks. However, the gender balance in advising varies markedly by department and cannot be understood through department size or gender composition alone. Although based on a single year, these findings underscore the need for future research on how the meaning and experience of committee membership vary by gender identity, department ecology, and the sex typing of academic fields (Jacobs 1996:168–70).
Fourth, we suggest that features of doctoral committees may be consequential for student outcomes. Doctoral students are more likely to graduate if they have an assistant-level (but not an associate-level) chair, if their committee contains at least one female member, and if they have ever experienced a reconstitution. Ironically, assistant professors—least experienced but closest to their own graduate education—may make the best advisers, while associate professors, having just earned tenure, may be least attentive. The mere presence of a woman may alter how other committee members engage a student. Finally, we speculate that the strong association between reconstitution and graduation stems from the following dynamic: students at risk for withdrawing because of a challenging committee situation might instead “resolve” it via reconstitution; if so, it may be no coincidence that the changes students tend to make (per Figure 7) are in directions that promote retention (per Figure 8). An alternative explanation is that reconstitution itself requires a certain degree of student investment (i.e., it is a signal, not a remedy). These results clearly warrant further exploration.
Ethics
Insofar as dissertations are publicly available (e.g., on ProQuest), and commonly report the names of committee members, our general approach should be replicable elsewhere (cf. Dahlander and McFarland 2013; Sugimoto et al. 2011). In three sections of our results, individual identities were completely obscured by looking at aggregate trends. However, when dealing with visualizations of small-scale communities, complete anonymization is impossible. The distinct fingerprints of network ties mean that “organizational members can often deduce the identity of one person . . . and once that person has been identified, their known associates can sometimes be deduced as well, eventually unraveling the whole network” (Borgatti, Everett, and Johnson 2018:48). By aggregating committee data, the whole point is that we may reveal features of social worlds that are invisible to their inhabitants. Although it is unclear what harm could result in the present case—and we deliberately omitted the identities of our three illustrative departments—the unique ethical considerations raised by certain variants of network research warrant at least brief mention.
Future Research
Beyond the clear need to replicate our analyses in other national and institutional settings, future research might explore additional dimensions of inequality among faculty (e.g., by race/ethnicity) or the intersection of specialization or scholarly productivity with the dynamics considered here. Given that job placement (in perception, if not always in practice) can depend heavily on the influence of mentors, combining data on committee properties, student and faculty attributes, and student employment outcomes could be a particularly important extension of this work.
We suggest two other paths of inquiry. First, we focused on documenting patterns, deliberately eschewing speculation on their causes. This is especially important to remember when interpreting differences across departments, where committee appointments (and therefore network structures) are constrained by the quantity and composition of students and available faculty. The genesis of such ties is potentially much more complex than other kinds of social relationships—involving a delicate balance of similarity and complementarity of research interests, compatibility of personalities and working styles, and the will of the central adviser, all constrained by norms, policies, and idiosyncratic events (cf. Leahey and Reikowsky 2008; Maher et al. 2013). Just as network analysts have increasingly focused on generative processes rather than outcomes (e.g., Rivera, Soderstrom, and Uzzi 2010), so the antecedents of these patterns, from disciplinary cleavages to gender exclusion, are worthwhile to explore. 17
Second, and perhaps ironically, our analyses are far removed from the everyday, on-the-ground issues of how doctoral students and faculty navigate committee dynamics in practice—issues that are central to the graduate experience. As Shulman and Silver (2005) suggested, How about more papers . . . on the dynamics of dissertation committees, in terms of analyzing the different contributions of the faculty members, the pulls of faculty who claim that he or she is “my” student. What should the student do who is caught in conflicts in the substantive, political, and personality differences among committee members? (p. 9)
Although such questions clearly surpass the scope of our data, we share many network analysts’ vision of a future where traditional network measures are supplemented with data on meaning (Emirbayer and Goodwin 1994; Fuhse 2009). We hope our work will help bring sociologists of education into this conversation.
Supplemental Material
sj-docx-1-srd-10.1177_2378023120963752 – Supplemental material for The Duality of Students and Faculty: Illustrating the Sociological Utility of Doctoral Committee Data
Supplemental material, sj-docx-1-srd-10.1177_2378023120963752 for The Duality of Students and Faculty: Illustrating the Sociological Utility of Doctoral Committee Data by Kevin Lewis and Jordan Packer in Socius
Footnotes
Appendix

| Code | Title | X | Y | Size | Percentage Female |
|---|---|---|---|---|---|
| ANTH | Anthropology | 1.5 | 1.1 | 18 | 38.9 |
| AUDL | Audiology | 1.0 | .5 | 3 | 66.7 |
| BENG | Bioengineering | 2.3 | 3.0 | 25 | 12.0 |
| BINF a | Bioinformatics | ||||
| BIOL | Biological sciences | 1.5 | 1.3 | 67 | 28.4 |
| BIOM a | Biomedical sciences | ||||
| CENGa,c | Chemical engineering | ||||
| CHEM | Chemistry and biochemistry | 2.3 | 2.6 | 50 | 16.0 |
| CLIN a | Clinical psychology | ||||
| COGS | Cognitive science | .9 | 1.3 | 21 | 42.9 |
| COMM | Communication | .9 | 1.3 | 23 | 52.2 |
| CSE | Computer science and engineering | 2.1 | 2.3 | 40 | 10.0 |
| ECE | Electrical and computer engineering | 1.9 | 4.7 | 44 | 6.8 |
| ECON | Economics | 1.6 | 1.1 | 36 | 19.4 |
| EDS | Education studies | 2.0 | 1.2 | 7 | 71.4 |
| ETHN | Ethnic studies | .7 | 3.3 | 12 | 75.0 |
| GPS b | Global policy and strategy | ||||
| HIST | History | 1.7 | 1.6 | 31 | 41.9 |
| LCD a | Center for Research in Language | ||||
| LING | Linguistics | 1.7 | 1.5 | 11 | 18.2 |
| LIT | Literature | .4 | .5 | 34 | 44.1 |
| MAE | Mechanical and aerospace engineering | 2.0 | 1.7 | 38 | 18.4 |
| MATH | Mathematics | 1.7 | 2.6 | 44 | 11.4 |
| MATS a | Material science and engineering | ||||
| MED b | School of Medicine | ||||
| MSED a | Mathematics and science education | ||||
| MUS | Music | 2.7 | 2.7 | 21 | 28.6 |
| NANO b | Nanoengineering | ||||
| NENGa,c | Nanoengineering | ||||
| NEU a | Neurosciences | ||||
| PHAR b | Skaggs School of Pharmacy and Pharmaceutical Sciences | ||||
| PHIL | Philosophy | .8 | 1.3 | 18 | 22.2 |
| PHYS | Physics | 1.8 | .8 | 43 | 9.3 |
| POLI | Political science | 1.4 | 1.1 | 27 | 29.6 |
| PSYC | Psychology | 1.5 | .4 | 25 | 20.0 |
| PUBL a | Public health | ||||
| RSM | Rady School of Management | .3 | .6 | 23 | 21.7 |
| SE | Structural engineering | 2.8 | 3.0 | 19 | 5.3 |
| SIO | Scripps Institution of Oceanography | 1.4 | 1.0 | 75 | 22.7 |
| SOC | Sociology | 1.1 | 1.7 | 22 | 27.3 |
| THEA | Theatre and dance | .0 | .6 | 11 | 81.8 |
| VIS | Visual arts | 1.7 | 1.0 | 15 | 26.7 |
Note: The final four columns refer to Figure 6, in which only departments with both faculty and doctoral programs are featured. X and Y represent the average number of internal committee memberships per male and female faculty member, respectively. Size represents the total number of faculty.
Degree program only (no faculty).
Faculty affiliation only (no doctoral students).
Degree offered by NANO department.
Acknowledgements
We are grateful to the UCSD Graduate Division, and especially to Erin Espaldon, Alfredo Alegria, Mary Lillis Allen, Kim Barrett, Susan Van Duren, and Michael Weinfeld, for providing the data set used in this study and for patiently answering our questions about it, and to Steve Lopez, with whom this project originated.
Supplemental Material
Supplemental material for this article is available online.
Notes
Author Biographies
References
Supplementary Material
Please find the following supplemental material available below.
For Open Access articles published under a Creative Commons License, all supplemental material carries the same license as the article it is associated with.
For non-Open Access articles published, all supplemental material carries a non-exclusive license, and permission requests for re-use of supplemental material or any part of supplemental material shall be sent directly to the copyright owner as specified in the copyright notice associated with the article.