
Abstract
Criminal organisations tend to be structured as a network in order to optimise flows of resource exchanges. The consolidation of these structures strengthens the criminal organisation’s capability of becoming more and more efficient over time. Recently, researchers in the field of covert networks have begun to analyse the dynamics of these networks. Thus far, the models and methods used to analyse the temporal dynamics of covert networks have come with a number of limitations. Our approach for analysing temporal dynamics attempts to address some of these limitations. In this article, we extend the use of dynamic line-graphs to bipartite networks for incorporating time directly into the network, and we suggest an alternative way to visualise the evolution of actors’ participation in successive covert actions and events. Our article intends to contribute to the research on dynamic networks by proposing a new approach for representing temporal dynamics in covert networks. After illustrating our method, we present some examples of its use on real-world data for visualising network evolutions over time.
Keywords
Introduction
Social Network Analysis (SNA) consists of theories and methods for analysing social relationships. Based on the mathematical framework known as graph theory, SNA utilises a formal language for developing concepts and ideas in order to describe patterns of interaction between individuals. Graph theory affords the representation of relational information in a sociogram or graph, as was originally posited in the early 1930s by Jacob Moreno, who is considered the pioneer of the use of graph theory for identifying properties of social networks. Relational information is incorporated in a sociogram by drawing points and lines. Points, also named nodes or vertices in different nomenclatures, represent individuals. Lines, edges or arcs, when present, depict the existence of relationships between these individuals (Scott, 2000; Knoke and Yang, 2008; Borgatti et al., 2013).
Increased interest in analysing criminal networks has encouraged the use of SNA as an analytic tool to investigate them. Scott and Carrington (2011) suggested that criminal networks are formed by people who are involved in ‘networked activities’. This definition leads to a better explanation of the nature of criminal relationships by highlighting the fact that individuals committing crimes need to be organised. Since a network provides a reliable mechanism for optimising resource exchanges (Bright, 2015), we speculate that the more criminal activities are planned and coordinated by individuals, the better organised and effective a criminal group becomes. This aspect is particularly relevant for criminal networks in which actions should remain maximally undercover to limit the possibility that individuals committing a crime would be detected. We suggest that in order to investigate criminal networks, it is necessary to focus on people’s participation in criminal actions and how they maximise their efficiency under secrecy.
We conceptualised a network model (Brandes et al., 2013) as based on two distinct aspects of social interactions in a covert context. The first aspect refers to the idea of cooperation since individuals joining actions together are cooperatively involved in the realisation of a specific criminal and/or covert intent. The second aspect considers the fact that covert actions are simultaneous. Individuals involved in the same action, in fact, act simultaneously and in a specific point in time. When few members of a criminal organisation are involved in performing the same task, such as terrorist attacks, secret meetings and violent protests, the relationship between each pair of these individuals involved can be defined as a concurrent partnership since their relationships overlap in time. The main implication of including the idea of partnerships overlapping in time (Moody et al., 2005) in our network model is that of emphasising the relevance of the time dimension as a central aspect for the analysis of covert networks.
Our article seeks to contribute to the work on the analysis of longitudinal networks by proposing an alternative method for representing temporal dynamics. The article proceeds as follows. First, we review some of the existing SNA works that considered the issue of time, and, second, we provide an overview of recent contributions related to temporal dynamics in the specific field of criminal networks. Third, after a theoretical introduction of our approach, we demonstrate the utility of the method on three real covert network data sets.
Related work
The issue of time is of increasing importance in SNA, resulting in considerable interest in analysing dynamic networks (Snijders and Doreian, 2010, 2012). Research belonging to the area of longitudinal network analyses use several methods for analysing the fluid nature of networks over time. We categorised the research themes into five research areas by examining how the aspect of time is considered and what methods are used.
The first area of research focused on network temporal dynamics mainly for analysing the propagation of diseases and the risk of transmission of infections by using statistical simulations (Morris and Kretzschmar, 1995, 1997; Moody, 2002; Kontoleon et al., 2013). In this research, the start and end times of relationships influenced the level of reachability among individuals since overlapping relationships offered alternative routes of diffusion, as well as making some traversing paths impossible. The second area of research addressed the issue of time by partitioning a given time window in a series of temporal snapshots, or intervals. Through the analyses of network properties in each time interval, these authors focused on the evolution of group and community structures (Nakao and Romney, 1993; Tantipathananandh et al., 2007) as well as node level measures (Kim and Anderson, 2012). The third area went beyond a descriptive analysis of how time constraints affected network properties by utilising an actor-oriented model, namely the stochastic actor-oriented model (SAOM), for examining the co-evolution of social networks and individual behaviours (Snijders, 2001; Snijders et al., 2010). Examples of processes modelled using the SAOM include homophily tendencies (Lazega et al., 2012) and mechanisms based on social capital (Agneessens and Wittek, 2012). The fourth area of research referred to a specific framework and data structure, namely the Relational Event Model. This model for analysing longitudinal networks defined human actions, such as a chain of events, related to each other through the fact that individuals took part together in these actions (Butts, 2008). The ties are events and as such instantaneous as opposed to standard social network ties that are considered states. Finally, the last area relied upon new visualisation methods for providing a better representation of temporal networks. An important contribution came from Moody et al. (2005). These authors proposed to combine an animation technique, which shows the heterogeneity between temporally adjacent network slices, with summary statistics of network properties that capture the proportion of arcs changing from iteration to iteration. Another recent contribution in terms of visualisation techniques has been provided by Brandes et al. (2012). By referring to SAOM, in this article, the authors focused on the co-evolution of networks and individual behaviours over a sequence of time slices. In particular, they provided algorithms in order to capture the level of homogeneity among individuals as well as to detect individuals with different behaviour through the visualisation of discrepancies between simulated and observed statistics.
The idea we propose in this article falls in this last category. Specifically, our contribution introduces a different technique for the representation and visualisation of longitudinal networks composed of two different entities such as individuals and events.
Longitudinal analyses in the field of criminal networks are rare. Some authors measured individuals’ centrality over a series of tasks temporally ordered (Toth et al., 2013) or compared the level of stability and prominence reached by individuals in several time snapshots (Sharara et al., 2012). Others examined structural changes over time (Helfstein and Wright, 2011) and analysed the network’s growth from the perspective of roles played by individuals in order to keep the network flexible and balanced between secrecy and efficiency (Bright and Delaney, 2013). Moreover, Cunningham et al. (2015) used the SAOM to capture the importance of pre-existing ties in a terrorist network. In addition, some authors focused on longitudinal studies to reveal how individual positions change over time using a blockmodeling approach (Xu et al., 2004) and along several snapshots (Carley, 2014; Stevenson and Crossley, 2014). Finally, criminologists have begun to develop a new perspective for analysing the evolution of a criminal action. In this perspective, the analysis of criminal activities integrates SNA with the crime script analysis. A criminal action is interpreted as several logical phases, each characterised by specific tasks that need to be accomplished. Since each actor is then associated with a specific task, this technique can reveal the involvement of actors over the sequential steps and highlighting the presence of subgroups of offenders specialised in a specific task (Bruinsma and Bernasco, 2004) as well as the role each actor played for the success of the operation (Morselli and Roy, 2008).
The above-mentioned methods for analysing temporal network dynamics present some limitations that influence their possible applications in the field of covert networks. First, the applicability of these approaches is affected by the fact that these methods mostly require to split arbitrarily the whole time window into several temporally adjacent intervals. These time intervals tend to not totally capture the dynamicity of network changes over time since they do not control what happen in the given network between one interval and the next. Depending on how the time intervals have been identified, in fact, the distinction of time windows into separate snapshots can either underestimate or overestimate the connections among actors resulting in a partial understanding of how the given network evolves over time. Second, a more specific limitation concerning the use of applying these methods for analysing covert networks is due to the paucity of time data information. Most of the time, in fact, researchers in the field of covert networks do not know the exact start and end time of a relationship and/or the duration of these interactions (Gerdes, 2014); often they have information only about the occurred events.
In this paper, we provide an alternative method for partially overcoming these limitations in order to represent the temporal evolution of a covert network and the turnover of actors. In particular, the main advantage of our proposed method is the possibility of visualising the given network by maintaining the linear progression of succeeding actions exactly as these occurred and in which individuals took place together.
Model
The purpose of this section is to state the assumptions on the basis of our model, to reveal from where we get an inspiration for building our technique and to clearly define which are the entities composing our pattern of relationships.
In this study, we assume that for analysing temporal dynamics, it is necessary to focus on two aspects of people’s participation in actions, events or tasks: (1) the temporal proximity between individuals; and (2) the individuals’ trajectories of participation in these actions over time. The first aspect corresponds to tendencies towards collaboration and reflects who collaborates with whom. The second aspect refers to how often an individual attended an activity and/or performed a task during the time considered. By following the individual participation in activities over time, it is possible to have a good sense of individuals’ engagement in actions over the time considered. Through the bi-dynamic line-graph representation, it is possible to capture those dynamics and make them directly visible into the graph.
The pioneering work by Moody (2009) theorised a dynamic network projection for one-mode networks in order to analyse the channels of transmission of diseases. In this case, every edge between a pair of individuals is represented as a node, and new directed edges are added in the case in which the nodes share an individual. By recording the duration of relationships as an attribute for each edge, Moody used this dynamic line-graph in order to analyse the diffusion of infections.
In this article, we build a similar dynamic line-graph projection for two-mode networks. Although Alexander proposed the use of the line-graph representation as a reliable option for visualising bipartite networks (Alexander, 2005), we partially referred to Moody’s principles in order to incorporate the time dynamics in the line-graph. In the next paragraphs, we explain the steps that are necessary in order to realise our adaption of a dynamic line-graph representation for two-mode networks.
The process of constructing the bi-dynamic line-graph from the original two-mode network is composed of three separate steps. First, we consider a two-mode network in its bipartite network structure. The bipartite network is an individuals-by-events matrix of affiliations where rows and columns contain both individuals and events and only ties between individuals and events exist (Borgatti et al., 2013). Second, from the bipartite network, we generate a line-graph projection. With the line-graph, edges between individuals and events are transformed to nodes. As a result, in this visualisation, a node represents an edge between an individual and an event of the original two-mode graph. By construction, all nodes representing the same actor joining events are connected by an edge. In order to track individual’s histories of participation in events, we use a reduction criterion for ties. This criterion implies the exclusion of ties providing redundant information. Thus, in the third step, we reduce ties by maintaining only edges which connect nodes representing the same actor joining events based on the sequence in which these events occurred. The point of this construction is that every individual attending an event in a specific point of time is represented by a node. If an individual participates in succeeding events, there are as many nodes as the number of events in which the individual took place and these nodes are sequentially connected by a path. For example, a node referring to individual A participating at event 1 (A1) will have an outgoing tie only towards the node referring to individual A participating at event 2 (A2). If A also joined event 4, there will be another outgoing tie between A2 and A4, throughout a link between A1 and A4 is not present.
In a bi-dynamic line-graph, two sets of ties can be distinguished: reciprocal and uni-directional (we refer to the latter as ‘directed’ henceforth). Reciprocal ties connect nodes representing different actors who have been engaged in activities together simultaneously. In this case, reciprocal ties generate clusters and reflect the level of collaboration between individuals. Directed ties, on the contrary, link nodes referring to the same individual who have attended several events over time. These two sets of ties depict temporal dynamics in terms of common participation in activities as well as individual’s engagement during time. In other words, while reciprocal ties capture the extent of the individual’s propensity of collaboration, directed ties follow the individual’s participation in events over time. An example of the dynamic line-graph representation is given in Figure 2.
In the case of covert networks, reciprocal ties connect nodes referring to individuals who took part together in activities such as terrorist attacks, secret meetings and violent protests. A typical example is a member of a terrorist group who is actively engaged in a bombing attack and through the interactions with other participants establishes reciprocal relationships. By contrast, directed ties link nodes corresponding to a same individual who participated in several activities over time. For each active actor, there is a directed tie starting from the first action in which he participated to the following one until the last action in which the individual took part. Directed ties reveal the history of the individual’s presence in the criminal organisation.
Why are bi-dynamic line-graph representations really necessary?
In this section, we briefly discuss some advantages as well as some limitations related to the use of our visualisation technique of representing two-mode networks. An intuitive way to understand the advantages of a bi-dynamic line-graph representation is to compare an original two-mode network with its one-mode projection as well as with its bi-dynamic line-graph representation. In the two-mode representation, Figure 1(a), individuals are depicted as points, whereas events are represented by squares. When an individual attended an event, a tie connects the individual (point) and the event (square). Since most SNA methods are developed for one-mode networks, traditionally authors prefer to convert the two-mode network into a one-mode network. Through this conversion, the two-mode network is transformed into a one-mode network in which individuals are linked to each other to the extent that they participate in at least one event together (Borgatti et al., 2013). Here, all vertices are individuals (point), and a tie between a pair of vertices represents the fact that these individuals share person-to-person interactions by attending the same event. Unfortunately, the one-mode projection suffers from a loss of information regarding the participation in events (Borgatti and Everett, 1997; Opsahl, 2013; Hollway and Koskinen, 2015). First, if there is a case in which a person accomplished an activity (event) by himself, this information would not be recorded in the one-mode projection. Second, visually speaking, unless the researcher changes the thickness of the edges, it is impossible to quantify how many times individuals have been involved in common activities. By comparison, the bi-dynamic line-graph better captures the evolution of an individual’s engagement in the events over time. Figure 1 shows an example of two-mode network (a) and, respectively, its corresponding one-mode network (b) and the bi-dynamic line-graph (c).
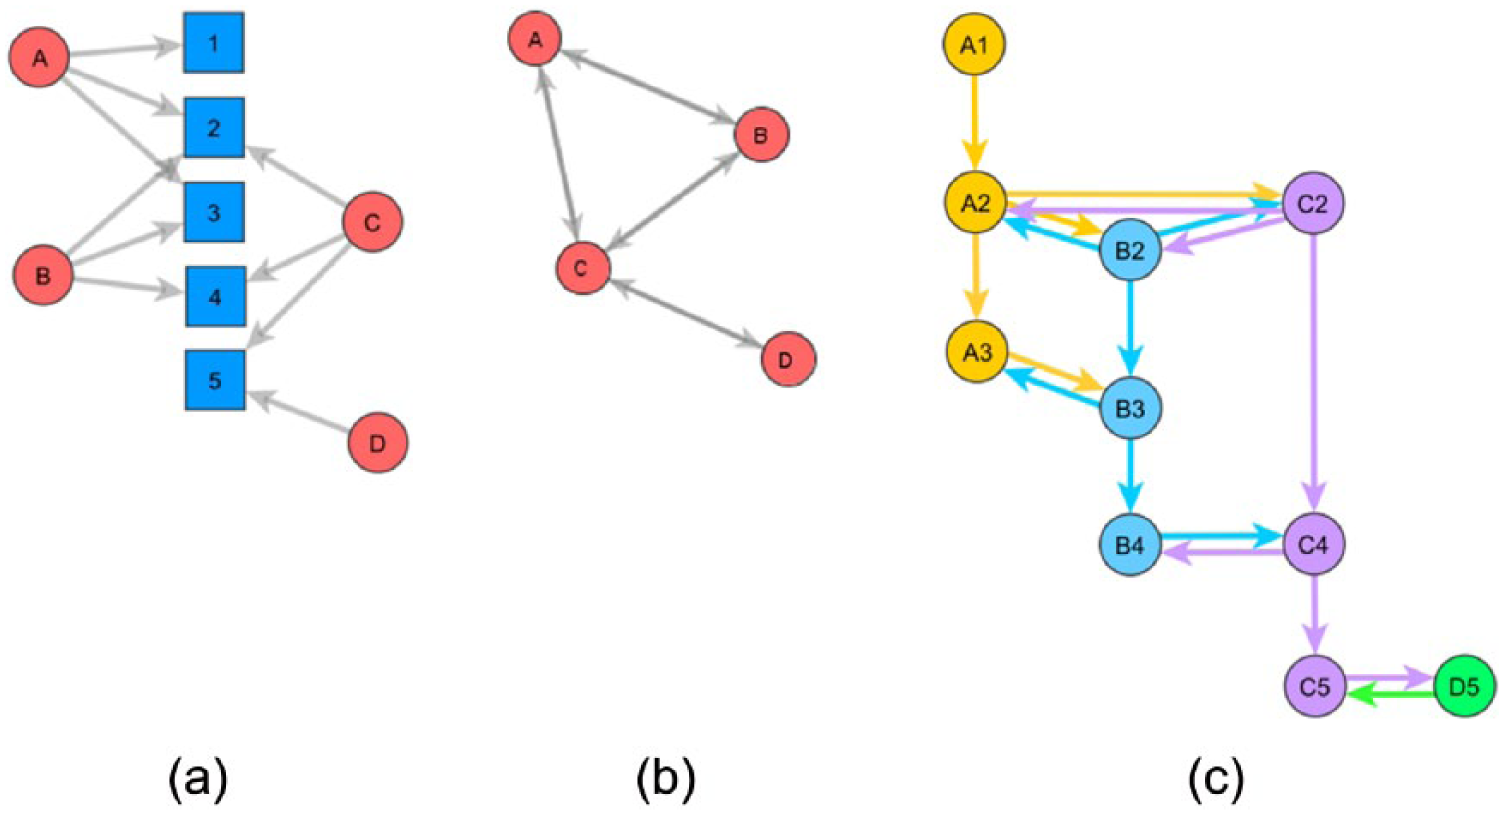
(a) The two-mode network representation, (b) the one-mode projection of the two-mode and (c) the bi-dynamic line-graph representation of the matrices in Figure 2.
Using a matrix representation, relational information is expressed by an adjacency matrix where rows and columns represent points and values ‘1’ into cells intersecting these points indicate the presence of a tie between them. Sociograms and matrices can be considered as two sides of the same coin since adjacency and affiliation matrices may be represented as graphs and graphs can be translated into matrices. The matrices of the network visualisations showed in Figure 1 are reported in Figure 2.
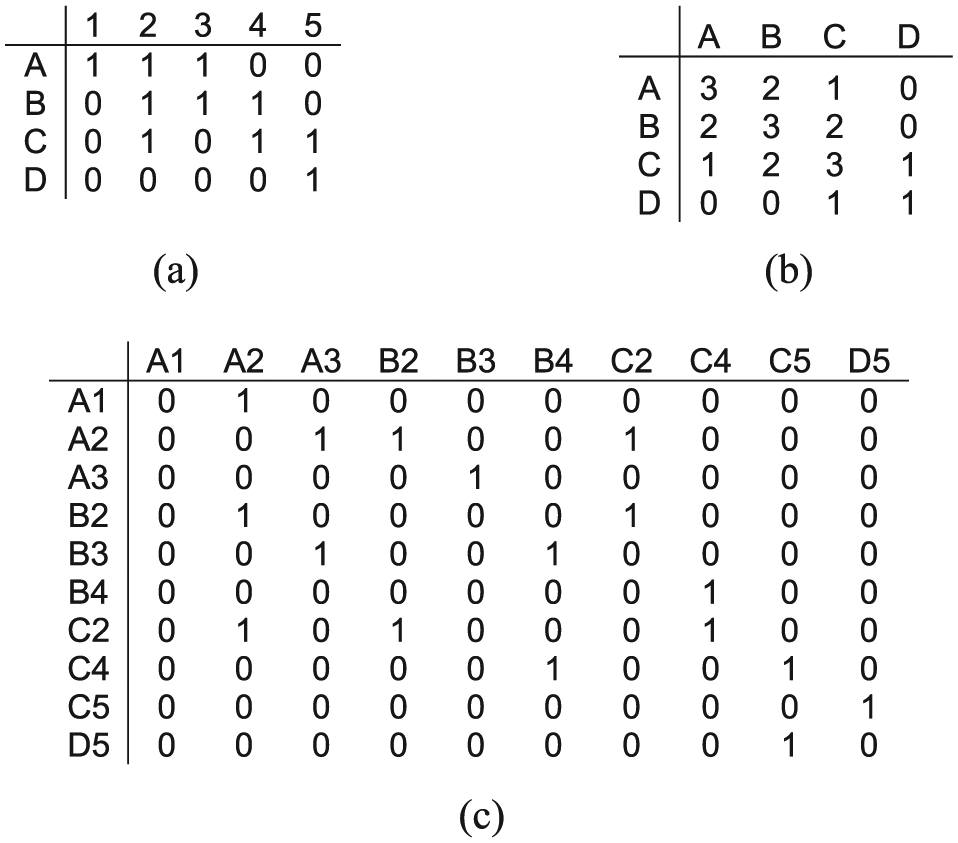
(a) The two-mode network matrix, (b) the one-mode projection and (c) the bi-dynamic line-graph matrix.
The bi-dynamic line-graph replaces the standard node-as-point representation in favour of a node-as-edge representation. This dynamic representation can offer a different way for visualising to what extent a network changes and evolves over time. The advantages of using a bi-dynamic line-graph representation can be discussed under three headings.
Substantively, the first advantage is due to the fact that the time dimension is directly incorporated into the graph, instead of, for example, being added as an attribute or a property to the edges. In the bi-dynamic line-graph, in fact, the sequence of human interactions directly reflects how individuals have been engaged in actions over time. Nodes, representing edges between individuals and events, are added as they appear and straightforwardly can reveal how the network materialises during the time.
The second advantage concerns the fact that with the bi-dynamic line-graph, it is not necessary to divide the whole time window into time intervals as is, for example, required with the SAOM method. This representation of the dynamic network is also distinct from decay-based approaches (e.g., Holme and Saramäki, 2012). The main implication of that is the chance for researchers of avoiding to make arbitrary decisions in identifying time slices. All time steps corresponding to events, are, in fact, directly taken into account, and actions, linked together by the common participation of individuals, are represented as a chain, in a sort of continuous social process.
Finally, since our bi-dynamic line-graph is specifically designed for two-mode networks, this last advantage refers to the possibility of utilising directly the two-mode network format instead of the one-mode projection of the two-mode. The use of the original affiliation matrix makes unnecessary the loss of information that occurs when a two-mode network is transformed in its one-mode conversion and to consider both events and individuals as equally important entities (Everett and Borgatti, 2013).
Beside the advantages, we also need to consider the disadvantages of our representation. To begin with, the bi-dynamic line-graph does not capture clearly the temporal dynamics among events. On the one hand, events may happen closely together in time, but, on the other hand, they might be separated by long periods of inactivity during which nothing has been recorded. In the current form of a bi-dynamic line-graph, time interval between events is not considered. This implies that even though the bi-dynamic line-graph takes into account the successive aspect of the sequential events, it is not possible yet to reveal how these events are positioned by considering the whole time window.
Moreover, for the purpose of the present work, we do not consider the aspect of the duration of events. We follow the convention of relational events and treat the events as instantaneous, allowing us to consider only the order and possibly the time in-between events. For convenience, our basic assumption is that any actor can only be in one place at any one point in time. Although there is a possibility that two events may happen simultaneously and that, for instance, actor A participating in an event B precludes participating in any other event taking place at the same time, we speculate that this possibility would be relevant only in very specific cases. As an example, we may consider the case in which a terrorist cannot take part in a terrorist attack since this person is already attending a training camp that lasts for a few months and occurs at the exact same time of the attack. Similarly, our approach is not suited to explain such things as coordinated attacks. However, this is not a serious restriction in our case due to the nature of events considered. In fact, for the examples considered here, events, which correspond to violent protests, terrorist kidnappings and Mafia meetings, never overlap in time.
Finally, a third limitation concerns the specific matrix format of the bi-dynamic line-graphs. As mentioned earlier, the bi-dynamic line-graph matrix presents contemporarily two set of ties, reciprocal and directed. Due to this format, standard SNA measurements need to be adjusted in order to be utilised. As such, at the moment, our representations can only be seen as a basis for narrative about individuals’ involvement in criminal activities over time. Looking at who joined the actions, at which point in time and with whom, gives us the possibility of following and tracking the individual’s histories of participation in actions over time and, therefore, it may provide insights about the hidden strategical organisation and structural dynamics within these covert networks.
In this article, we hope to demonstrate how this representation can be a useful initial step for investigating the stability of peoples’ engagement as well as the turnover of individual embeddedness in activities during the time. We will now present some examples of the use of a bi-dynamic line-graph on real-world data in order to analyse some aspects of the flows of individual’s participation in actions over time.
Effectiveness of dynamic network representation on real covert networks
In this section, we illustrate the use of the dynamic line-graph representation for visualising the evolution of a given network and its temporal changes.
Data sets
UK Suffragette co-participation in meeting and actions in Bristol and Bath
The network refers to the Women’s Social and Political Union (WSPU), a women’s organisation in United Kingdom during the 19th and early 20th century in order to promote women’s suffrage. In the United Kingdom, members of the WSPU engaged in the campaign were arrested and prosecuted by the authorities in order to maintain the current status quo. As a result, Suffragettes used to act in secrecy, particularly when they organised meetings for planning their protests. This particular data set concerns the co-participation in events occurring in Bristol and Bath from 1907 until 1914. It involves 52 Suffragettes and 40 events. In this data set, events correspond to meetings, demonstrations, protests and vandalism acts. Data have been reconstructed by considering historical sources of information such as Suffragettes’ diaries, autobiographies and local newspapers (Edwards, 2014). This network is an example of a Covert Social Movement Network, characterised by a strong orientation towards a political and social change by acting protests and violent acts (Crossley et al., 2012).
Philippines terrorist network
This network mostly refers to Abu Sayyaf Group (ASG), a terrorist movement operating in the Southeast Asia. In particular, these data are related to the Salafist extremist movement, founded by Aburajak Janjalani, a native terrorist of the Southern Philippines in 1991. The network is based on a data set accumulated over 20 years, from 1991 to 2011, and involves 247 individuals engaged in the implementation of 108 kidnappings in Malaysia and the Philippines. In particular, victims were essentially Filipino businessmen, news reporters and Christian clergy members. The data set, reconstructed using four open sources by Gerdes et al. (2014), is a result of a collection process regarding individuals involved in kidnappings, the date of the kidnapping event, as well as the place and the context in which those happened.
‘Ndrangheta network
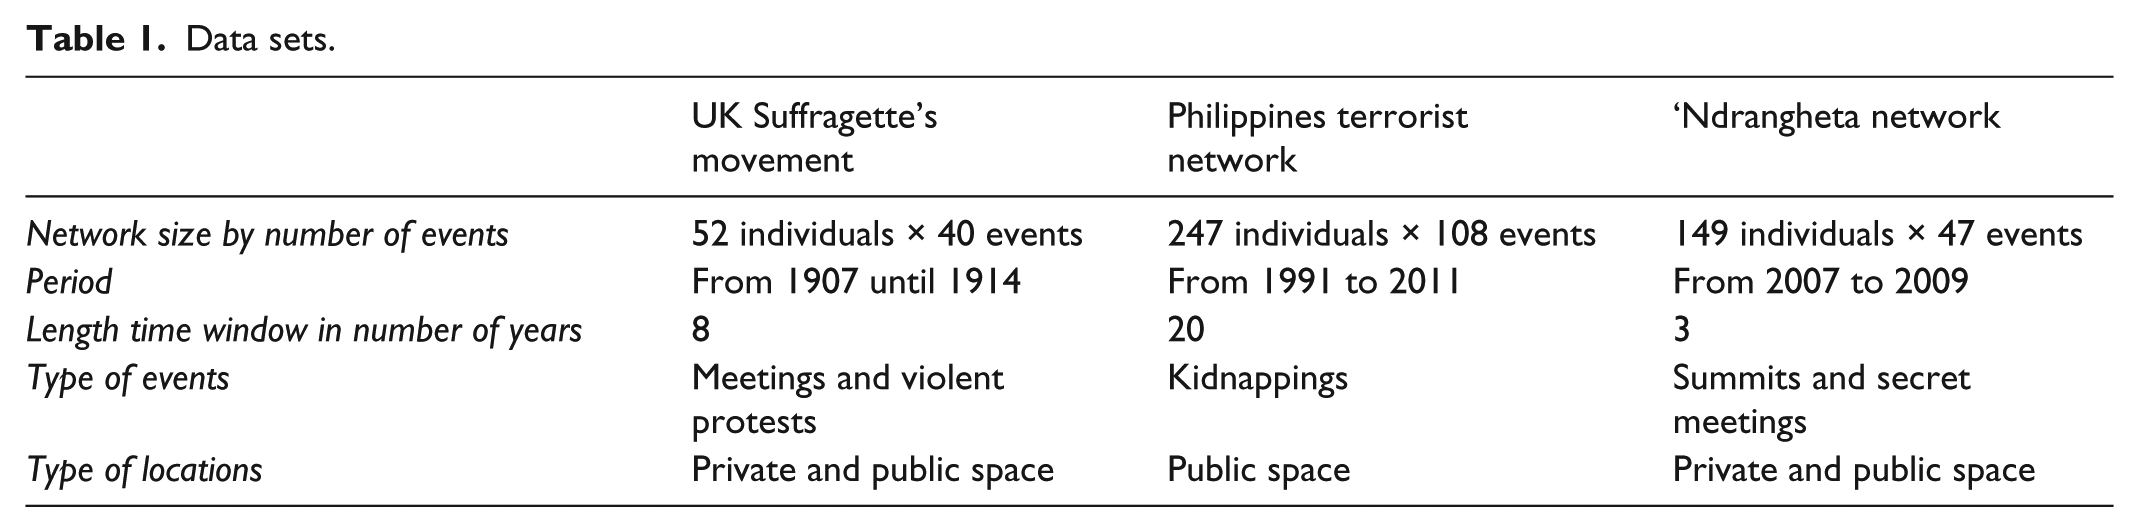
This network refers to the Calabrian Mafia clan, the ‘Ndrangheta, which is based in the Reggio Calabria region, in Southern Italy. However, police investigations reported the evidence of the expansion of the ‘Ndrangheta organisation even in the north of Italy and, in particular, in the Lombardy region. The present network is composed of 149 ‘Ndrangheta members participating in 47 internal meetings occurring between 2007 and 2009 in the Lombardy region. Those meetings were mostly organised in public places such as pubs and restaurants. Also, they had the aim of solving internal problems, making important decisions and identifying new affiliations (Calderoni, 2014). We reconstructed the data set by utilising a judicial document concerning the pretrial detention order produced by the preliminary investigation judge of Milan. This act allows the implementation of measures of custody and arrest warrants for some people, identified such as ‘Ndrangheta’s members. Their identification is a result of a police investigation, called ‘Operazione Infinito’ (Infinite Operation), through which investigators collected information about the evolution of the ‘Ndrangheta structure organisation by wiretappings and observations of the common participation in summits and secret meetings. Although these meetings had meaningful durations, most meetings would last less than 24 hours, wherefore we deem the sequential nature more important than duration dynamics (Table 1).
Data sets.
Revealing the individual engagement in covert activities over time
In this section, we begin by representing the two-mode network graphical representation for all three data sets. Two-mode networks are showed in Figures 3(a), 4(a) and 5(a). Blue squares correspond to events, whereas nodes with a round shape in red refer to individuals. The labels indicate individuals and events. Then, we depict the traditional social network visualisation corresponding to the one-mode projection of those affiliation matrices. One-mode networks correspond to Figures 3(b), 4(b) and 5(b). Here, the colour of nodes reflects the individual’s centrality: Darkest nodes are the most central. The centrality is based on the basic measure of the degree of a node that is equivalent to the number of direct connections a node has (Borgatti et al., 2013). In this case, an individual with a high degree corresponds to an individual who has been engaged in covert activities with many other participants. Finally, for each of the three data sets, we report the bi-dynamic line-graph representation. Bi-dynamic line-graphs are showed in Figures 3(c), 4(c) and 5(c). In these representations, the colour of the nodes matches with the respective one in the one-mode representations. On the contrary, the number in the labels reflects the number of the events considered. The events are displayed from left to right, in a horizontal progression.
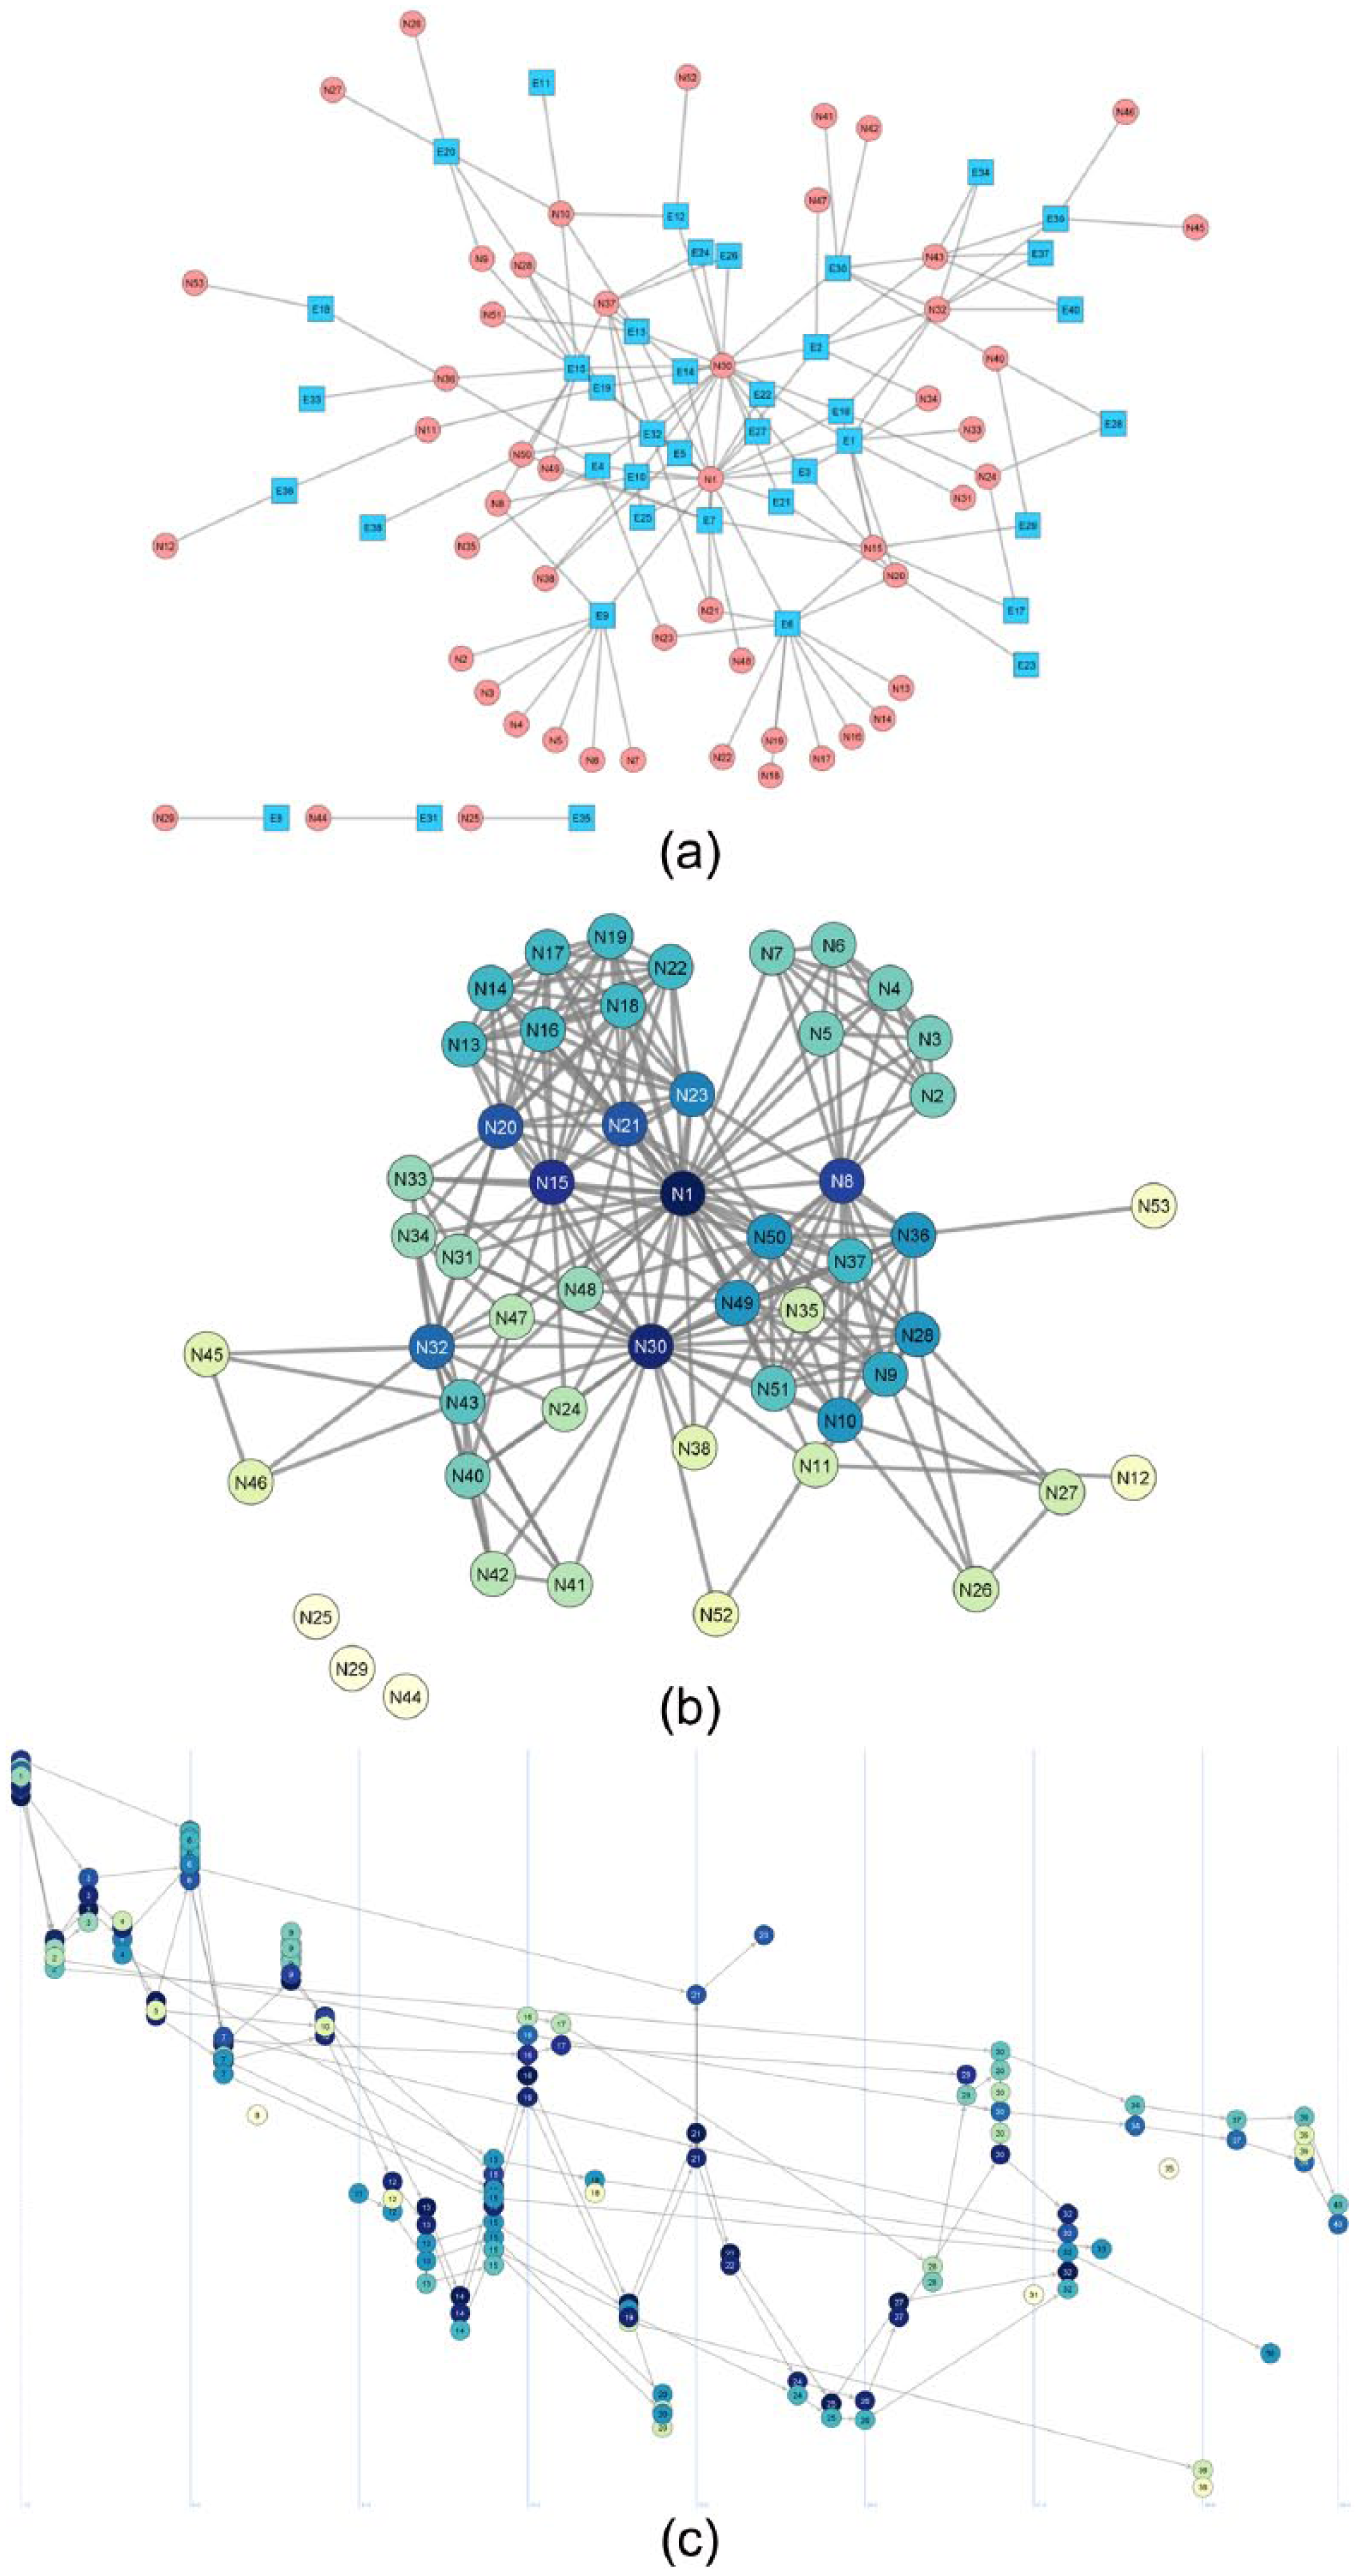
UK Suffragette co-participation in meeting and actions in Bristol and Bath. Comparison of (a) the two-mode network graph, (b) the one-mode projection, and (c) the bi-dynamic line-graph.
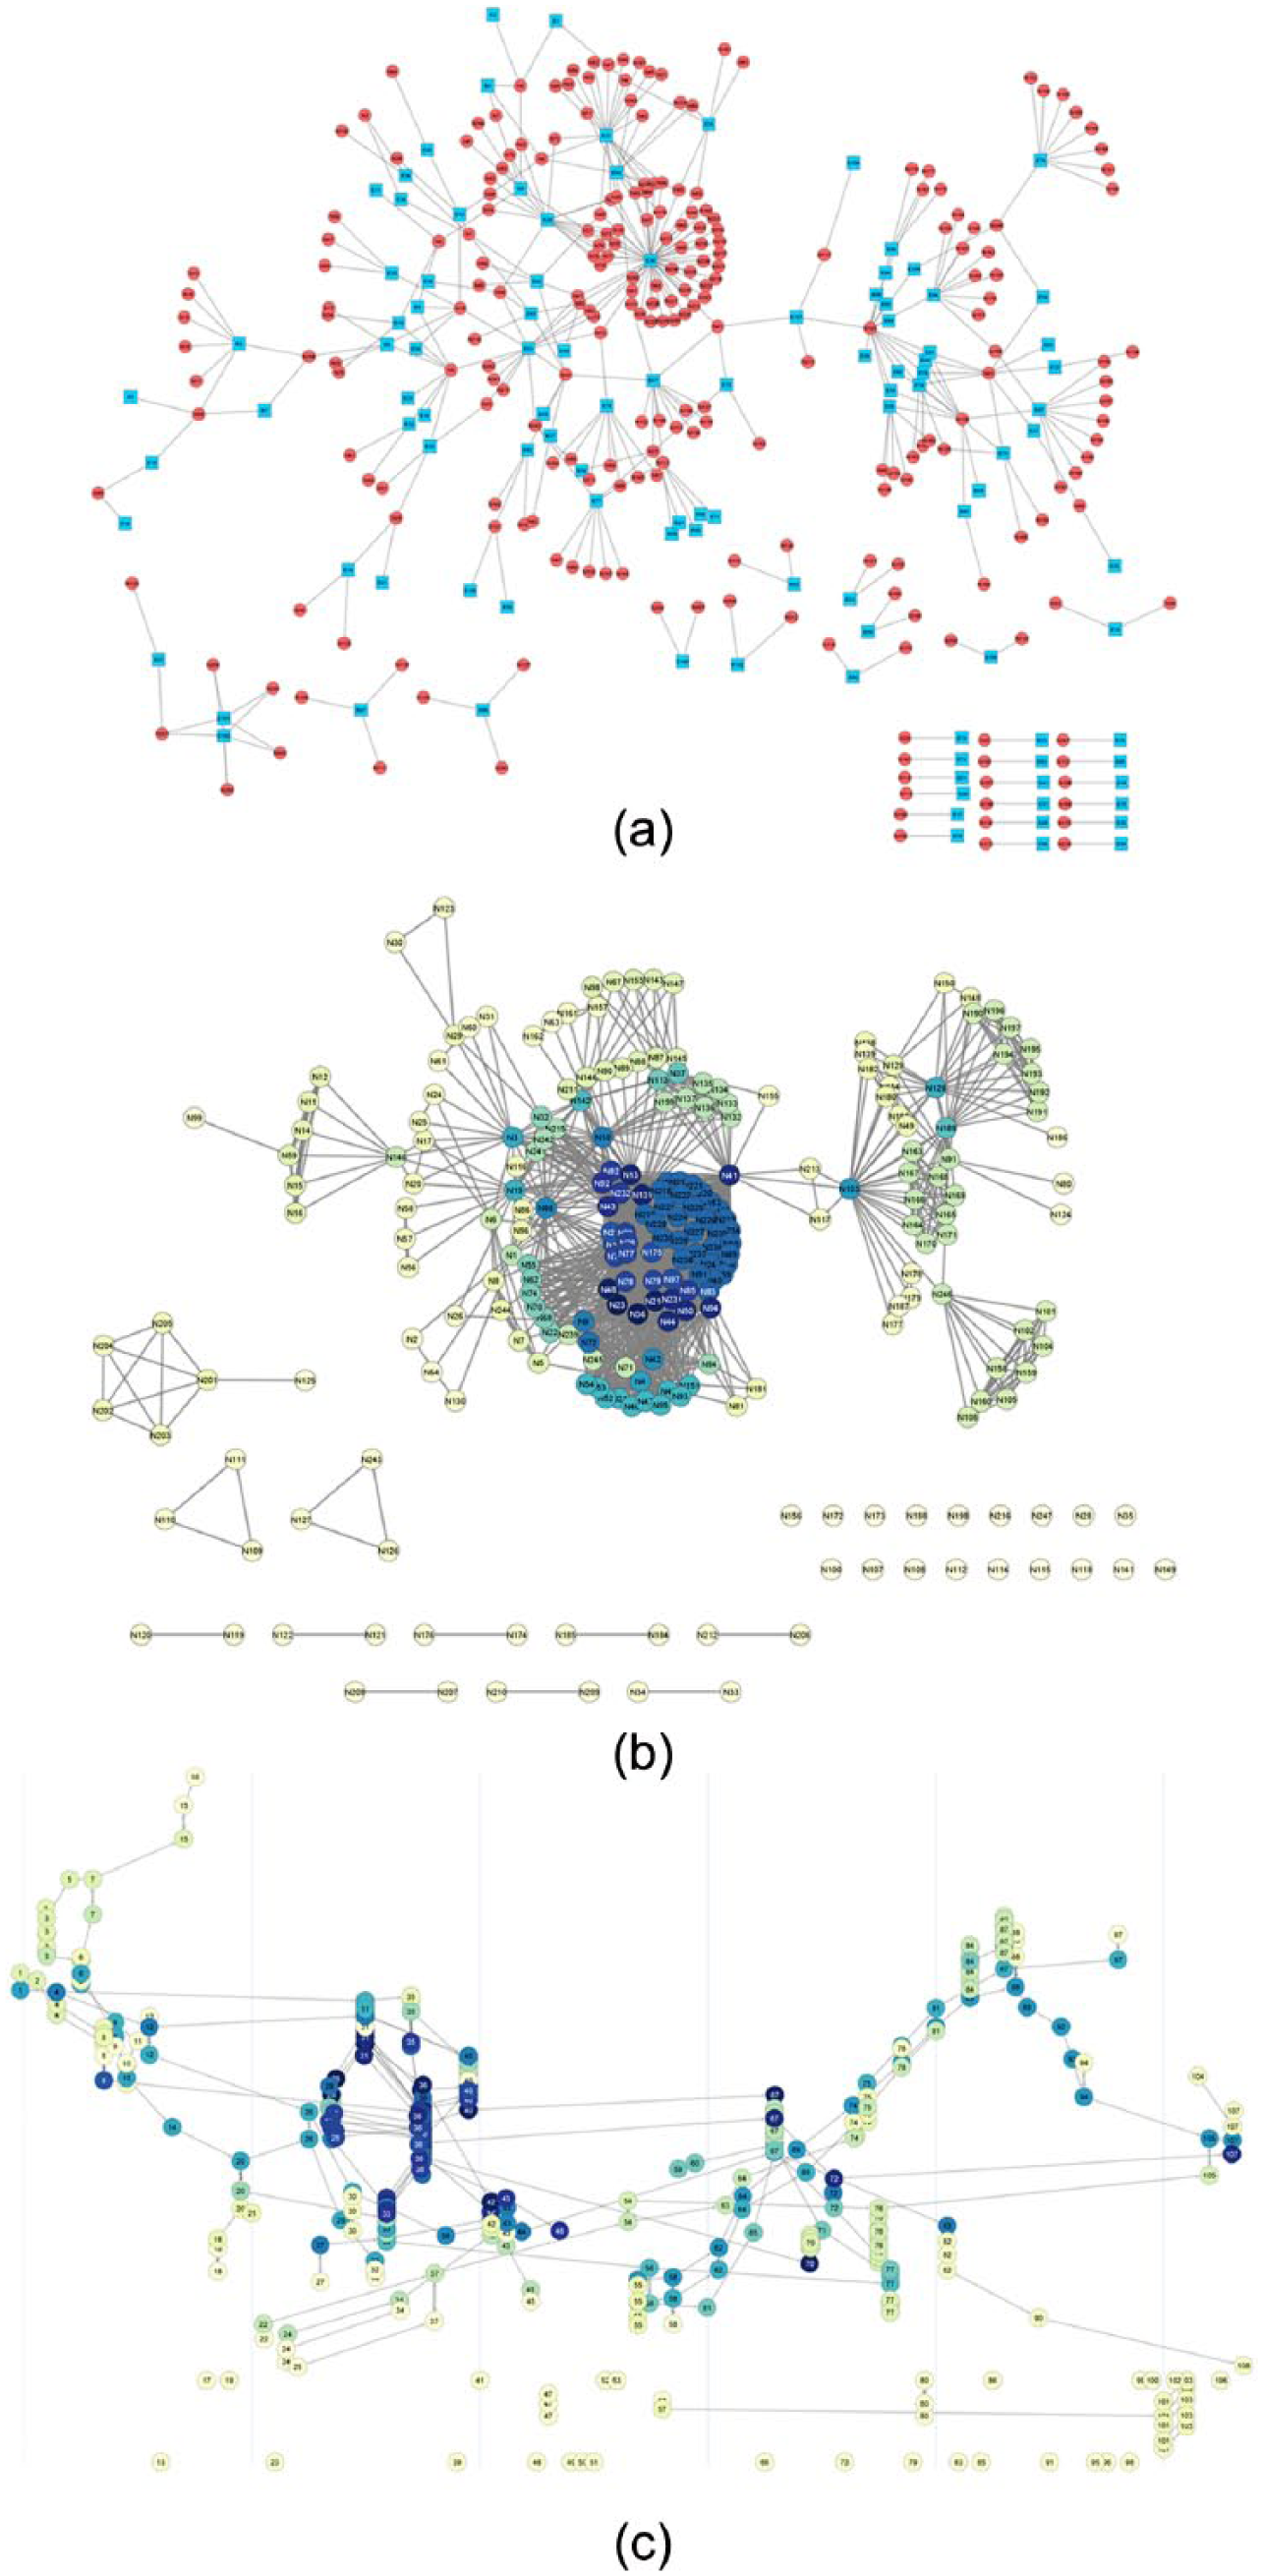
Philippines terrorist network. Comparison of (a) the two-mode network graph, (b) the one-mode projection and (c) the bi-dynamic line-graph.
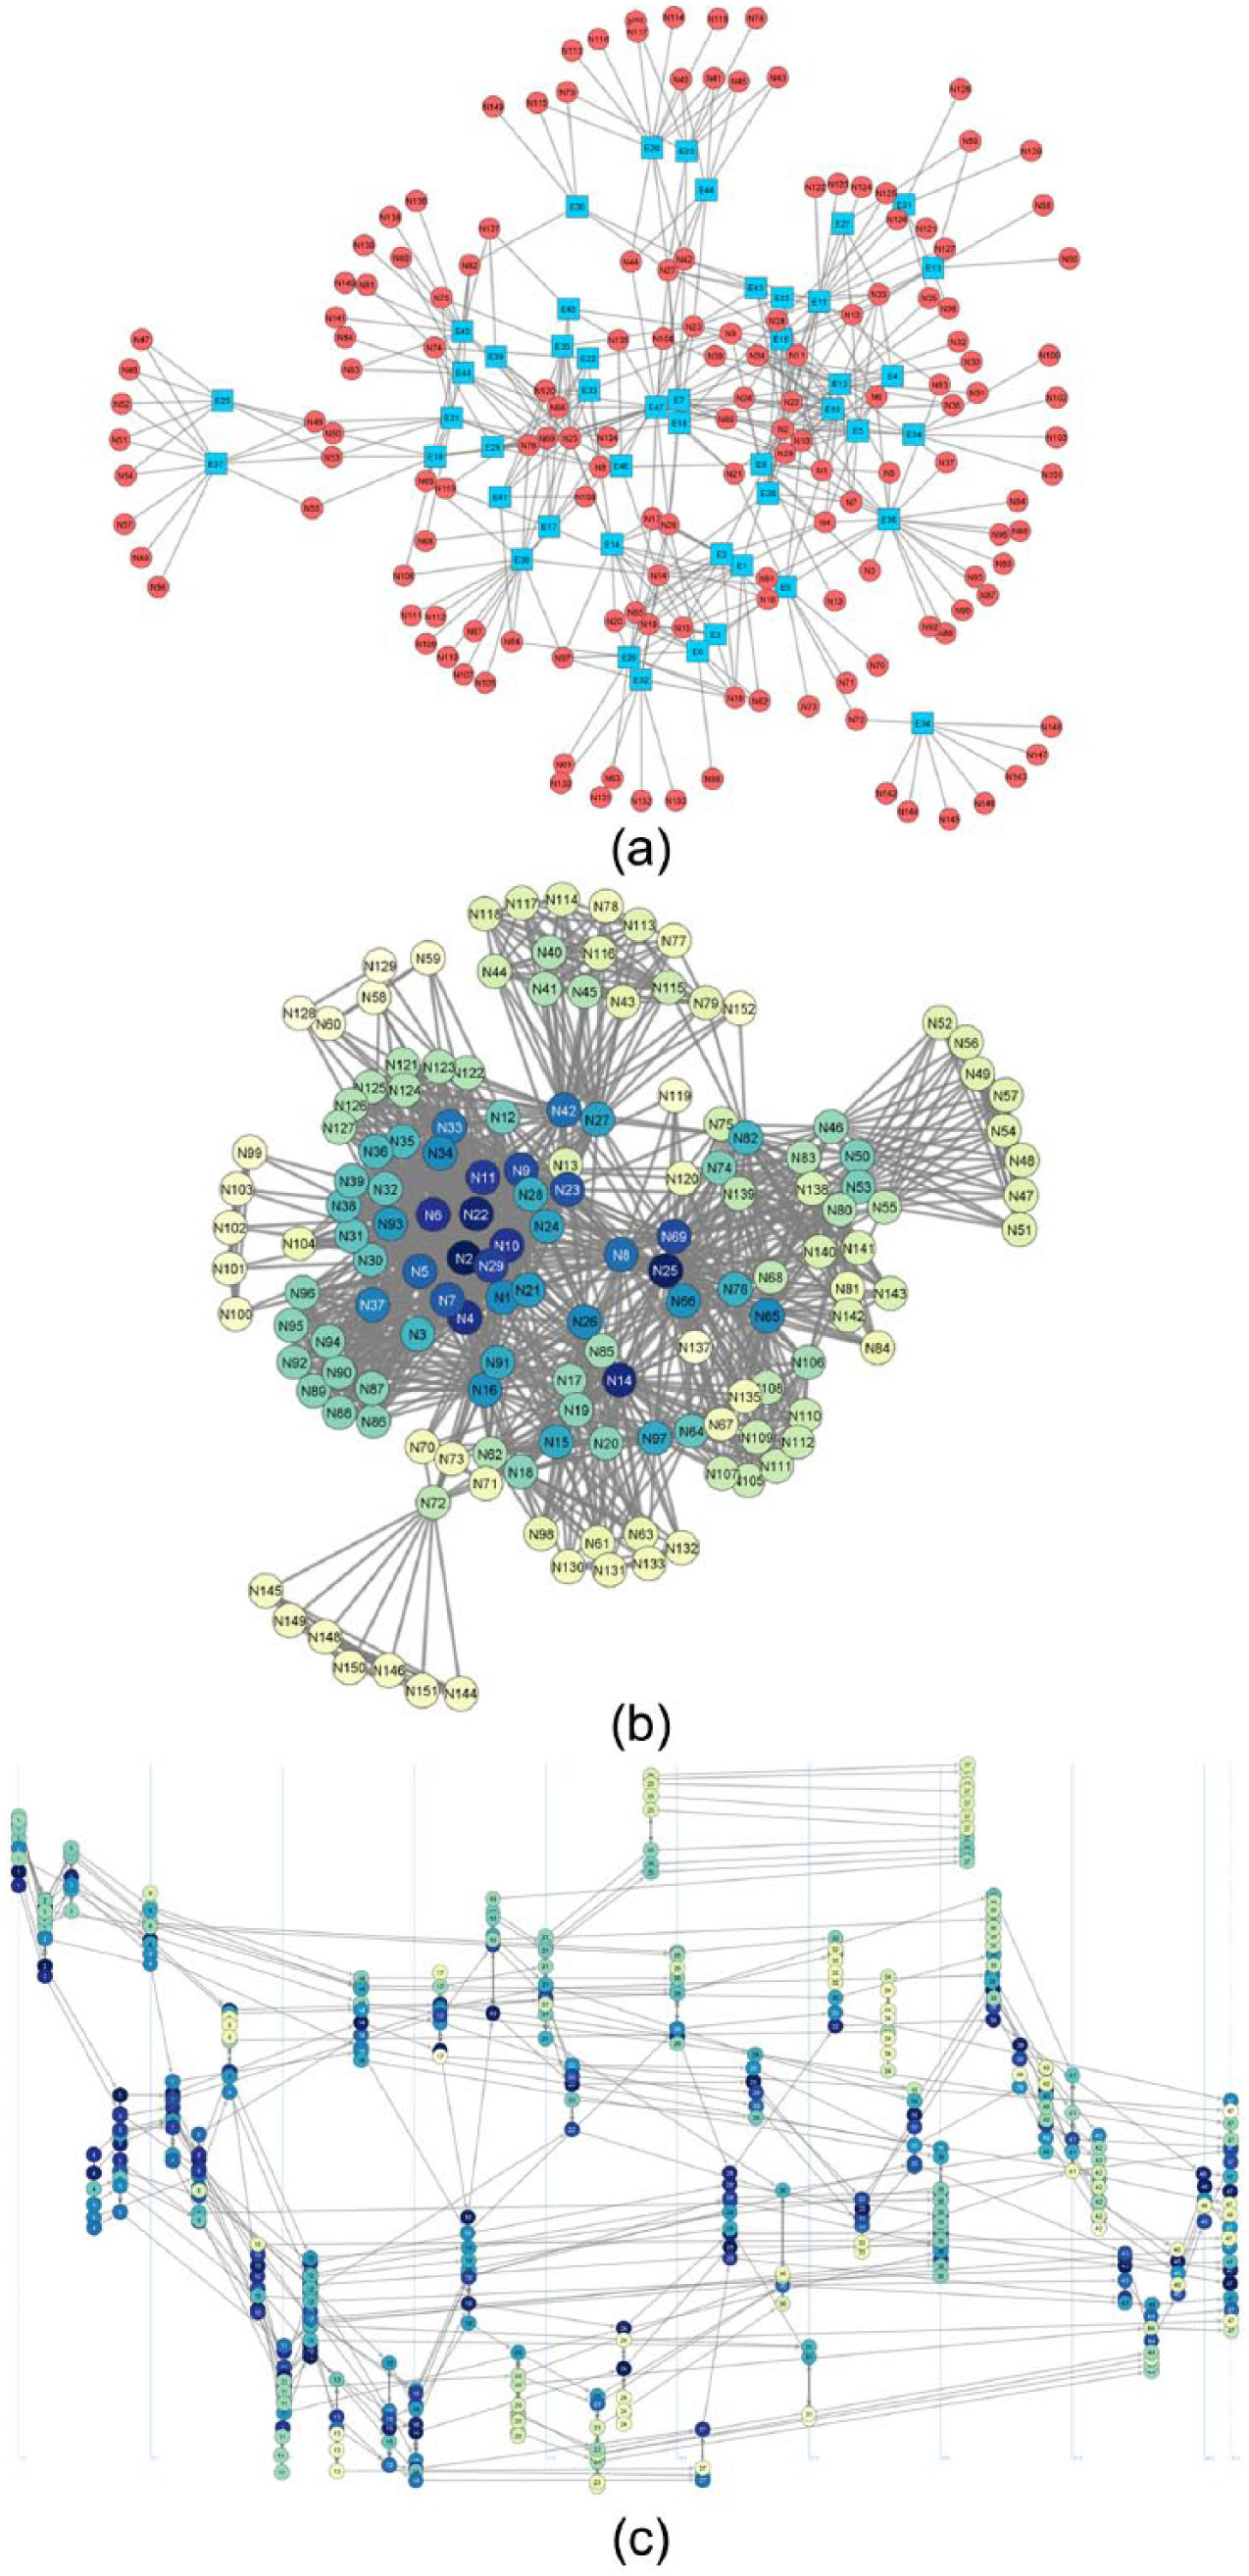
‘Ndrangheta network. Comparison of (a) the two-mode network graph, (b) the one-mode projection and (c) the bi-dynamic line-graph.
UK Suffragette co-participation in meetings and actions in Bristol and Bath
Figure 3(a) shows the two-mode visualisation for the Suffragettes participating in meetings and public protests in Bristol and Bath, in the United Kingdom. Here, we notice that only a handful of central individuals took part in many of these events, whereas the large part of Suffragettes joined in only a few protests, and sometimes even on their own, as the three nodes located on the lower left side of the graph reveal. The insight gained from Figure 3(b) is two-fold. First, the prominence of two individuals, N1 and N30, in dark blue, is visible due to the fact they attended numerous events. As a consequence, in the one-mode projection, they result to be directly connected to many other individuals. Second, it is possible to identify the presence of a few clusters of individuals densely connected to each other. This means that the Suffragettes did not regularly attend all events, and the participation was sporadic. This latter characteristic of the graph seems to suggest that Suffragettes were organised in subgroups whose members used to attend meetings and perform violent attacks together. However, the one-mode projection does not show the extent to which the dynamics of the individual’s participation over time evolve. A better insight of those dynamics is captured by the bi-dynamic line-graph, Figure 3(c).
In here, it can be seen that the general pattern of participation over time is delineated by a pair of individuals who were present in many of the events reported. The flow of the Suffragettes’ participation can be distinguished in several periods. During the first period, corresponding to the first 15 events, the direction of individual’s participation presents a certain linear polarisation around few key individuals. Afterwards, during the second period, characterising the following 17 events, the participation evolves by presenting three subgroups who led the mobilisation. Only few of these individuals involved are still active members of the third period, represented by the last eight events, whereas most of them abandoned the campaign. At this point, the dynamic line-graph shows a certain reorganisation in the Suffragettes’ mobilisation since only nine individuals appear to maintain a commitment to the campaign. In addition, it seems that the Suffragettes run the mobilisation by acting generally in two separate subgroups. Almost at the end of the time window, after the 30th event, only the individuals corresponding to one of these subgroups continued its militancy in the Suffragettes campaign. Interestingly, the number of members who remained involved at that time is critically lower than the beginning.
The major relevance of only few central people and the presence of a quite stable tendency of the Suffragette’s engagement in events can be the consequence of either the presence of a specific role’s distinction of individuals in the campaign and the general leadership’s influence. It is known, in fact, that Annie Kenney, who was employed as secretary by the WSPU, assumed an important role for supporting the expansion of the Suffragette movement in the West of England, and in particular in Bristol and Bath. Ms. Kenney was sustained and helped by Mary Blathwayt, albeit Ms. Blathwayt refused to be highly involved in risky activity. The prominence of Kenney and Blathwayt during the time is then explained by the role they assumed in the Suffragette’s campaign. Their presence in many of the these events is also justified by the nature of events considered, which reflects violent public demonstrations as well as private meetings which were sometimes located at Blathwayt’s house. The leadership’s influence, instead, may explain the decrease of people’s engagement in the campaign. Emmeline and Christabel Pankhurst, in fact, leaders of the WSPU, influenced the Suffragette’s commitment in protests by restricting their participation in actions. The decision of taking part in violent attacks was most of the time a result of an internal decision related to the strategy adopted by the Suffragette’s leadership rather than a personal decision. This aspect is particularly relevant since it goes against what ought to be the intention of a social movement which is to engage the critical mass and recruit people in support to their campaign. In our opinion, the dynamic line-graph brings to light the relevance of the leadership’s influence much better than the other traditional social network representations since it reflects the extent of the evolution of people’s participation influenced by the leadership of the Suffragette movement who used to decide who was in and who was out during the campaign.
Philippines terrorist network
Figure 4(a) represents the two-mode network of the Philippines terrorist network. In here, the high density of individuals around some events (squares) reveals that terrorists mostly act in partnerships. The two-mode network representation also depicts separate components which suggest the presence of autonomous groups of terrorists. The one-mode projection of this two-mode network is reported in Figure 4(b). This representation, which captures the presence of disconnected components, seems also to highlight the prominent position assumed by some individuals, N41 and N103, belonging to the main component. Those individuals have a relevant role in keeping the network connected. However, neither of these representations are capable of capturing the evolution of people’s action history.
The bi-dynamic line-graph, depicted in Figure 4(c), better reveals the story of the terrorists’ tactics. Overall, terrorist actions seemed to be accomplished by different terrorist groups over time. This representation also suggests that the individual’s commitment to terrorist attacks is subject to changes through time since the number of terrorists involved each time rapidly increases and/or decreases. Terrorists have been involved in the events progressively and have followed different directions of actions. In other words, they mainly tended to act separately. The general pattern of terrorists’ participation in terrorist attacks can be characterised by four periods. During the first period, referring to the first 21 events, the presence of only one main trajectory of collective action, with two small opposite branches can be noticed. Only six of the terrorists involved in this period led the terrorist propaganda during the second period. In this second group of events, composed of the following 15 events, there seemed to be a surge in terrorist activism. During this second period, terrorists tended to act separately, mainly divided in three groups until the last event of this period, number 36, which represents the highest one in terms of the number of people involved. Interestingly, many of the terrorists who supported the propaganda until now finished their active commitment during the third period. This third subgroup of events, from event 37 until event 67, is generally characterised by a low level of individuals’ engagement in action. In addition, it can be noted that the flow of action mainly follows two trajectories of participation. Afterwards, during the fourth period, corresponding to the remaining attacks, the individual’s commitment to terrorist attacks presents a further decrease with, again, a certain tendency of acting separately in three groups. In general, the bi-dynamic line-graph depicts a high turnover of terrorists’ engagement in actions that contributes in keeping the flow of participation fluctuating and discontinuous. In addition, this flow is characterised by the presence of key individuals who maintain certain dynamics of continuity of collaboration among those different periods.
The presence of those separated groups of terrorists performing kidnappings can be explained by the characteristics of the data set. Due to the difficulty in defining boundaries among terrorist groups’ members, it is possible that the identified terrorists were members of different terrorist groups. As Gerdes et al. (2014) pointed out, in fact, the ASG used to have close relationships with other terrorist groups such as the Jemaah Islamiyah (JI), the Southeast Asian terror group responsible for the Bali bombing in 2002, and the Pentagon Gang (PG), another radical organisation which used to perform kidnappings. Therefore, the network can be composed by individuals who moved fluidly among several terrorist organisations. However, the presence of a certain level of flexibility in the participation dynamics characterising this network might be explained by the criminal organisations’ necessity to adapt to new situations and to quickly re-configure themselves in response to police authorities dismantling efforts (Enders and Su, 2007; Milward and Raab, 2006). This necessity can be on the basis of the evolving strategy of performing kidnappings and of the way in which individuals have been involved in these terrorist actions.
‘Ndrangheta network
Figure 5(a) and 5(b) show, respectively, the original ‘Ndrangheta Mafia network and its one-mode representation. In this case, the difficulty in understanding the properties of the pattern of interaction only by looking at these graphs is evident since these visualisations do not suggest any particular pattern of interactions although these could be better revealed by applying some SNA measures such as centrality. On the contrary, the bi-dynamic line-graph, Figure 5(c), seems to give a better insight into the internal dynamics of the Mafia organisation.
In general, in the flow of participation in Mafia summits, we can distinguish two periods. During the first period, corresponding to the first 28 meetings, it is noticeable that Mafia members joined the organisation consistently and mainly led to the presence of two distinguished subgroups with two different trajectories of participation. In addition, one of these two subgroups seemed to be characterised by a further division in two separate branches. Afterwards, during the second period concerning all the succeeding events, the presence of four different directions of action may be seen. Notwithstanding that, a certain tendency of clustering seems to appear during the last event since Mafia members belonging to these different subgroups took part in the meeting together.
The added understanding of the pattern of interactions that the bi-dynamic line-graph provides may be further emphasised using the background information provided by the police investigation. As far as it has been reported in the document from where data have been extracted, the ‘Ndrangheta Mafia organisation presented a hierarchical structure with small satellite groups, called locali. Each locale, similarly hierarchically structured, had the aim to manage its specific territorial area. Bosses and individuals with certain roles from a locale were expected, in most cases, to take part in meetings and summits organised from another locale in order to honour the commitments assumed. We surmise that the distinction between members mainly involved at local level and others related, instead, at the general level of the whole Lombardy territory can explain the people’s tendency of organising separated meetings. Moreover, the original police report offers some information about the nature and the content of the meetings. Therefore, this information helps in the comprehension of the relevance of the two events, one in the middle of the time window and one at the end. The first general summit, meeting number 28, organised on the 20th of January 2009 in a restaurant located in Cardano al Campo, in the province of Varese, in Lombardy, had been organised in order to discuss a new ordering of the leadership structure due to the murder of the former Mafia’s Lombardy boss. The second relevant meeting, number 47 at the end of the time window, had been organised on the 31st of October 2009 at the residential care ‘Falcone e Borsellino’ in Paderno Dugnano, in the province of Milan. Here, the most influent Mafia members proceeded with the election of the new ‘Ndrangheta boss in Lombardy and discussed the future guidelines of the ‘Ndrangheta organisation in northern Italy. The content of these two events can explain the presence of changes in the evolving pattern of interactions depicted by the bi-dynamic line-graph. Therefore, we presume that the pattern of participation’s flow reflects the necessity of the Mafia leadership structure reorganisation and the way in which Mafia members reinforced their membership and reciprocal trust.
Conclusion
We extended the use of the line-graph to bipartite networks in order to analyse temporal dynamics. Our work was based on the use of a line-graph projection for bipartite network with the application of a reduction criterion of redundant ties. Our method not only provided a better visualisation of temporal dynamics, but it also captured the temporal proximity between individuals, that is, the presence of overlapping relationships and the individuals’ trajectories of participation in events.
We sought to explore the power of this visualisation by applying it to three longitudinal covert networks. For each network, we compared the bi-dynamic line-graph with two traditional social network visualisations: the two-mode network format and the one-mode network resulting from the conversion of the two-mode. By referring to previous publications (Crossley et al., 2012; Calderoni, 2014; Edwards, 2014; Gerdes et al., 2014) and the original document from which the Mafia’s data set has been reconstructed (Infinite Operation), we provided some narrative explanations about the tendencies of people’s trajectories of actions brought to the light by the bi-dynamic line-graph.
These representations seemed to offer a better image of the rate of individuals’ turnover participating in covert actions over time without arbitrarily distinguishing the whole time window in temporally adjacent intervals. The diversity and/or similarity of people’s trajectories of actions over time have been revealed through this representation and researchers could have a better insight concerning the pattern of these interactions over time. Furthermore, beside the information about individual’s centrality within people’s trajectories of actions, the bi-dynamic line-graph also helped in understanding which events had been more relevant since they indicated the exact moment in which individuals started to act differently resulting in a noticeable change in the patterning of social interactions.
Thinking in terms of the relevance of events opens up the important question of the duality of events (Breiger, 1974). This idea of duality emphasises the intrinsic dualism present between individuals and events. If, on the one hand, individuals become linked to each other due to their common involvement in the same social event, on the other hand, a similar link exists among events when characterised by common people’s participation. In this second case, the linkage among events can rely upon the specific meaning of the events (Diani, 2015). Individuals co-participating in events, in fact, not only share person-to-person interactions but they also assign a specific meaning to the events in which they took place. By looking at the structure of the bi-dynamic line-graph, events acquire a central importance when they happen at and define a crucial point in time, that is, a watershed. Leading up to and after this watershed, individuals became involved in the actions differently during the time and changes in the organisational network dynamics can be registered. The bi-dynamic line-graph seems to capture the aspect of the duality of events since it reveals not only who are the prominent individuals whose trajectories of action increase network connectivity but also at which point in time this network connectivity rises and respectively to which event. Therefore, the events can be seen such as a chain of connected activities over time linked together by people attending those activities. The link between individual histories of participation in action and the community network structure as it is provided by the bi-dynamic line-graph can be the basis of a further development of a relational model for collective action for investigating how individuals became involved in different types of events over time and to what extent.
Beside the advantages, as has been pointed out above in the section related to the description of the proposed model, the bi-dynamic line-graph presented some limitations. First, the different space in time existing between occurred events has not been considered in this representation. A next step would be the development of a specific visualisation tool in order to improve the visualisation of temporal dynamics, in particular by removing overlapping people’s trajectories and taking into account the temporal distance between each event by considering the exact point in time in which these events occurred. Second, the set of standard SNA measures currently in existence were not applicable. Due to the fact that the bi-dynamic line matrices contain two sets of ties, directed and reciprocal, the SNA measures need to be specifically adjusted before being applied for analysing some formal properties of these graphs. Thus, we plan to extend the use of the bi-dynamic line-graphs by providing analytical solutions for quantifying the centrality of individuals in virtue of their position in the channels of latent knowledge and expertise. This different measure of centrality will quantify the level of expertise individuals accumulated by participating in activities over time and the amount of shared knowledge individuals achieved by working and acting cooperatively and consistently with others. In such a context, we hope to generate new insights into the understanding of who the key actors are, who contributed the most to the spread of knowledge and expertise in the given covert networks.
Footnotes
Acknowledgements
The authors would like to thank Nick Crossley, Gemma Edwards and Luke M. Gerdes for sharing their data sets. The authors are also grateful to the anonymous reviewers who provided many valuable comments and suggestions.
Declaration of Conflicting Interests
The author(s) declared no potential conflicts of interest with respect to the research, authorship and/or publication of this article.
Funding
The author(s) disclosed receipt of the following financial support for the research, authorship, and/or publication of this article: This work is funded by the Leverhulme Trust Grant RPG-2013-140.