
Abstract
Given the high cost of traditional survey administration (postal mail, phone) and the limits of convenience samples such as university students, online samples offer a much welcomed alternative. Amazon Mechanical Turk (AMT) has been especially popular among academics for conducting surveys and experiments. Prior research has shown that AMT samples are not representative of the general population along some dimensions, but evidence suggests that these differences may not undermine the validity of AMT research. The authors revisit this comparison by analyzing responses to identical survey questions administered to both a U.S. national sample and AMT participants at the same time. The authors compare the two samples on sociodemographic factors, online experiences, and prosociality. The authors show that the two samples are different not just demographically but also regarding their online behaviors and standard survey measures of prosocial behaviors and attitudes. The authors discuss the implications of these findings for data collected on AMT.
The high costs of administering surveys on the general population with random sampling can prohibit scholars and others from doing so. With the mass diffusion of the Internet coupled with the rise of services that encourage people to take online surveys (e.g., Amazon Mechanical Turk [AMT], commercial survey company panels such as Centiment and Qualtrics), researchers rely increasingly on online convenience panels for their studies. The authors of these studies usually acknowledge that the samples are not representative of the general population, but they have no way of evaluating the extent of any bias or whether bias affects questions of interest in the study (e.g., Rand, Greene, and Nowak 2012). To address these issues, a literature has developed exploring the biases of AMT samples and, in some cases, evaluating statistical adjustments to address such biases (e.g., Clifford, Jewel, and Waggoner 2015; Goel, Obeng, and Rothschild 2017; Levay, Freese, and Druckman 2016). We add to that literature by administering the same survey questions concurrently to a national sample of about 1,500 U.S. adults (for a cost of about $50,000) and to a similarly sized sample of AMT participants (for about $6,000). After reviewing the methodological literature on AMT samples, we describe our data collection on the two samples and then show how they compare on demographics, Internet experiences and skills, and prosocial attitudes and behaviors.
Prior Research
Social scientists have evaluated AMT as a participant pool for experimental studies and surveys on a variety of topics, including demographic attributes, psychological attitudes, religion, and political beliefs (e.g., Berinsky, Huber, and Lenz, 2012; Clifford et al. 2015; Horton, Rand, and Zeckhauser 2011; Levay et al. 2016; Weinberg, Freese, and McElhattan 2014). In general, these studies find that AMT samples reproduce established research findings on many beliefs and personality traits, despite the fact that AMT samples do not represent the general U.S. population along multiple demographic dimensions. Some recent work suggests that techniques such as covariance adjustment and weighting can dramatically reduce or eliminate biases introduced by sampling study participants from AMT (Clifford et al. 2015; Goel et al. 2017; Levay et al. 2016). These findings motivate the present study, in which we revisit the demographic attributes of AMT study participants and consider variations along two novel dimensions: (1) Internet experiences and skills, and (2) prosocial attitudes and behaviors. Prior work, which we discuss below, indicates that AMT participants may vary substantially in terms of both, but no benchmarked survey estimates have explored these variations directly.
A first wave of studies benchmarked AMT workers as study participants by comparing their demographic attributes and performance on classical experimental tasks against baselines of earlier research participants (Horton et al. 2011, Paolacci, Chandler, and Ipeirotis 2010). The AMT participants in these studies possessed greater diversity along dimensions such as age and education than most earlier experimental subject pools, many of which had consisted disproportionately of undergraduate psychology majors from U.S. research universities. The AMT studies also tended to reproduce experimental benchmarks from laboratory studies for classical findings in psychology and behavioral economics, such as framing and priming effects (Horton et al. 2011). Several studies also considered the quality of data from AMT samples by evaluating the consistency of psychometric scales, test-retest outcomes, and the impact of different compensation rates (e.g., Buhrmester, Kwang, and Gosling 2011; Mason and Suri 2012). Overall, AMT samples produced data of comparable (if not higher) quality than traditional laboratory samples along most dimensions.
In terms of survey research, several studies have pursued ambitious comparisons of AMT study participants with high-quality national samples gathered by private research firms in online survey panels and large-scale survey experiments in the United States (Berinsky et al. 2012; Clifford et al.,2015; Goel et al. 2017; Levay et al. 2016; Mullinix et al. 2015; Weinberg et al. 2014). Some of these studies provided precise quantitative estimates of the variations between the AMT participants and national baselines. Such variations tend to be substantial along dimensions on which AMT samples diverge from national population averages, such as gender, race, income, religious observance, education, marital status, and political ideology (Berinsky et al. 2012; Clifford et al. 2015; Weinberg et al. 2014). When these background attributes correlate with outcomes of interest, the potential for biased estimates of relationships between different variables increases. Statistical modifications such as adjusting for multiple demographic attributes can mitigate biases in the AMT data for some outcomes (Clifford et al. 2015; Goel et al. 2017; Levay et al. 2016).
Several aspects of prior research motivate this study. First, we seek to expand the number and topical coverage of benchmarked comparisons of the attributes of research samples drawn from AMT to those from high-quality national survey panels. Benchmarked comparisons remain important as the number of studies run on AMT continues to grow and the composition of the AMT worker population and work environment continues to shift over time (Gray and Suri 2019; Irani and Silberman 2013). Although several demographic patterns among AMT workers have remained stable across multiple years and studies, prominent scholars conducting research on AMT have speculated that some attributes of participants recruited through the site may have changed (e.g., Rand 2018) and that other sources of bias (such as ingroup preferences) may lurk (Almaatouq et al. 2019). In general, Amazon does not provide public demographic data about the workers on AMT. For all of these reasons, the characteristics of AMT research study participants merit ongoing monitoring and assessment.
Second, we find a glaring omission in nearly all of the prior benchmarking studies, which have overlooked one of the most likely sources of variation and bias in the AMT worker population: Internet experiences and skills. Earlier findings indicate that AMT workers have extensive Internet experiences and relatively higher levels of Web use skills (for reviews of the literature on Internet skills, see Hargittai and Micheli 2019; Litt 2013) and that these factors are strong predictors of other behavioral and attitudinal differences (Antin and Shaw 2012; Behrend et al. 2011; Shaw, Horton, and Chen 2011; Shaw and Hargittai 2018). The only study that benchmarked these differences directly (Behrend et al. 2011) did so in comparison with a fairly small sample of undergraduate students at a major research university. Although such a baseline sample likely contains variation in Internet experiences and Web use skills (Hargittai 2010), it still may not capture variation representative of the U.S. population, warranting more precise benchmarks.
In addition, a large body of literature has found consistent evidence that Internet experiences and Web use skills vary along numerous demographic, behavioral, and attitudinal dimensions (e.g., Livingstone et al. 2017; Martínez-Cantos 2017; van Deursen and van Dijk 2013; Zillien and Hargittai 2009). These variations help explain stratified outcomes across a number of domains, including civic and political engagement, employment outcomes, online knowledge production, and more (e.g., Hargittai and Shaw 2013; Shaw and Hargittai 2018). Prior studies have demonstrated that research participants in an online labor market such as AMT vary in systematic ways from a general population sample but have not directly measured AMT workers’ Internet experiences and Web use skills (e.g., Berinsky et al. 2012; Clifford et al. 2015; Goel et al. 2017; Levay et al. 2016; Mullinix et al. 2015; Weinberg et al. 2014). Absent such direct measurement and empirical testing, regression-based techniques such as covariance adjustment and weighting that do not account for these sources of variation may still draw biased conclusions. We overcome this omission by incorporating detailed measures of Internet experiences and Web use skills into a benchmarked comparison of AMT study participants and a national survey.
Finally, we focus our analysis on a second domain of empirical inquiry, prosocial attitudes and behavior, which has generated some of the most highly cited and influential studies involving AMT worker samples (e.g., Rand et al. 2012; Rand and Nowak 2011; Rand et al. 2014; Suri and Watts 2011). New evidence indicates that AMT workers may exhibit preferential ingroup bias (Almaatouq et al. 2019), underscoring that prosocial attitudes and behaviors may be sensitive to other types of bias well. Nonetheless, as far as we are aware, no prior studies have benchmarked AMT participants and a high-quality national survey sample along dimensions of generosity, trust and caution, and voluntary behaviors. In this respect, our analysis breaks new ground by evaluating the claims to generalizability in earlier studies of these phenomena that recruited AMT workers as study participants.
Data and Methods
We draw on two data sets collected at overlapping times to compare respondents from a national U.S. sample with an AMT sample consisting of U.S.-based participants. For replication purposes, we have made the data, our code to generate the figure and tables, and the survey instrument available at https://doi.org/10.7910/DVN/UFL6MI.
Data Collection
Both surveys were administered online. For the national sample, we contracted with the independent research organization NORC (formerly the National Opinion Research Center) at the University of Chicago to administer questions to their AmeriSpeak panel. AmeriSpeak is a national, probability-based survey panel that aims to provide a representative panel of civilian, noninstitutionalized adults living in the United States (NORC n.d.). After pretesting the survey with 23 respondents through NORC and updating items on the basis of the results in early May 2016, we ran the AmeriSpeak survey from May 25 to July 5, 2016, and the AMT survey on June 27 and 28, 2016. In both surveys, we included an attention-check question. 1 NORC reported a total sample of 3,999 panelists drawn from the 2015 AmeriSpeak panel, of whom 1,512 completed the survey and passed the attention check, resulting in a response rate of 37.8 percent. On the NORC survey, 10 percent of respondents failed the attention check. 2 NORC offered all participants the cash equivalent of $2 as compensation for participating in the study. Additional details about the NORC AmeriSpeak sampling, recruitment and survey administration procedures are provided by Dennis (2019).
For the AMT sample, we used Qualtrics to conduct the survey. We replicated the formatting of the NORC survey instrument as closely as possible within the Qualtrics interface. We required that all AMT participants be based in the United States and offered a $3 payment (on the basis of our estimate that the survey would take 15 to 20 minutes to complete, this approximated a $9–$12 hourly wage). In total, we collected 1,250 responses. We dropped 42 of these responses (3.4 percent) because of data quality issues, including duplicate submissions (n = 35), failed attention checks (n = 4), and invalid payment codes (n = 3). This left us with a sample of 1,208 responses that we include in our analysis.
Measures: Demographic and Socioeconomic Factors
Background variables about respondents, such as their age, gender, education, income, and race/ethnicity, were supplied by NORC on the basis of previous data collection about the AmeriSpeak panel. We asked AMT respondents similarly about their sociodemographic characteristics. We used the following coding for these variables in our analyses. We report age as a continuous variable. We created three education categories: high school or less, some college, and college degree or more. Income was reported in 18 categories, which we recoded to their midpoint values to make it a continuous variable. In the regression analyses, we use the square root of income, because that best approximates a normal distribution. 3 Race and ethnicity are dummy variables for white, Hispanic, African American, Asian American, Native American, and other.
Measures: Internet Experiences
General Internet Experiences
We include measures for how much autonomy respondents have in freely accessing the Internet when and where they want to, how much time they spend online, and their Internet skills. Prior literature has found these variables to be important in understanding people’s online experiences (DiMaggio and Bonikowski 2008; Hargittai and Hsieh 2013).
To measure autonomy of use, we asked, “At which of these locations do you have access to the Internet, that is, if you wanted to you could use the Internet at which of these locations?” followed by nine options, such as home, workplace, and friend’s home. To assess frequency of use, we asked, “On an average weekday, not counting time spent on email, chat and phone calls, about how many hours do you spend visiting Web sites?” and then asked the same question about “average Saturday or Sunday.” The answer options ranged from “None” to “6 hours or more,” with six additional options in between. We calculated weekly hours spent on the Web by multiplying the answer to the first question by 5 and the second question by 2 and adding these two figures together.
Internet Skills
For measuring Internet skills, we use a validated, established index (Hargittai and Hsieh 2013). Respondents were presented with 6 Internet-related terms (such as cache, PDF, spyware) and were asked to rank their level of understanding of these items on a five-point scale ranging from “no understanding” to “full understanding.” We then calculate the mean for all items as the Internet skills measure (Cronbach’s α = .94).
Social Media Use
We asked participants whether they use various social media: Facebook, Pinterest, LinkedIn, Instagram, Reddit, Twitter, and Snapchat. We started by asking them whether they had ever heard of these sites. Next, we asked, Have you ever
We calculate current users by adding up those who reported visiting the site currently sometimes or currently often.
Online Participatory Activities
To get a sense of how active people are online regarding the sharing of their own content, we asked about several online participatory activities. These were dichotomous yes/no questions about the following 10 activities: “Contributed to a citizen science project online (like Zooniverse or Foldit),” “Contributed to a crowdfunding campaign (like on Kickstarter or Indiegogo),” “Made a loan on a microfinance site (like Kiva or Opportunity International),” “Signed a petition on an online petition site (like Change.org or Care2),” “Added a coupon code to a site with coupon codes,” “Submitted a product review on a specific brand retailer’s site (such as clothing, luggage, but exclude general shopping sites such as Amazon),” “Asked or answered a question in an online forum such as on Facebook or comments on an article,” “Asked or answered a question in a social Q&A site (like Quora, Yahoo Answers, or StackOverflow),” “Posted a video privately (like on YouTube or Facebook),” and “Posted a video publicly (like on YouTube or Facebook).” We created a summary score representing the number of these 10 activities with which respondents reported experiences.
Measures: Prosocial Behaviors and Attitudes
To evaluate prosocial behavior and attitudes, we collect multiple measures of general trust, generosity, and recent cooperative behaviors. We include a combination of standard index measures, survey self-report items taken from previous literature, as well as a social dilemma that we describe below.
General Trust
We measure generalized trust with the widely used six-item scale developed by Yamagishi and Yamagishi (1994). Participants indicate level of agreement with the statements “Most people are basically honest,” “Most people are trustworthy,” “Most people are basically good and kind,” “Most people are trustful of others,” “I am trustful,” and “Most people will respond in kind when they are trusted by others.” We score items from 1 (“Strongly disagree”) to 5 (“Strongly agree”) and then average the responses for each participant. We describe the distribution of the measure below and normalize it (center around the mean and divide by the standard deviation) for all statistical tests and models.
Cooperative Behaviors
We use a battery of five items to measure cooperative behavior. The items come from the 2014 General Social Survey and from Peysakhovich, Nowak, and Rand (2014) and include the following behaviors: “Looked after a person’s plants, mail, or pets while they were away”; “Let someone you didn’t know well borrow an item of some value like dishes or tools”; “Left a much larger than normal tip at a restaurant because of good service”; “Donated money to a social cause or charitable organization”; and “Worked as a volunteer for a social cause or charitable organization.” For each item, we ask participants, “In the past year, have you done the activities below?” and accept “yes” and “no” responses. We then group the measures together and sum the number of “yes” responses from each participant. The resulting distribution of values is described below. For all statistical tests and models, we normalize the sum (center around the mean and divide by the standard deviation).
Generosity (Behavioral Measure)
We adapt Bekkers’s (2007) survey version of a dictator game to measure generosity. This involves presenting participants with 2,000 “points,” which have a predetermined exchange rate. We explain that the points will be converted to payment and issued out as a bonus upon completion of the study but that they have the opportunity to share their points with a subsequent study participant who has not received any. We then ask how many points (if any) out of the total 2,000 they wish to share. For each participant, this breaks down into two questions: we first explain the scenario and ask participants a test question to confirm whether they understand how the payoffs work. Those who respond correctly are then presented with the actual question and opportunity to decide how many points to allocate to a subsequent participant in the study. The number of points donated then constitutes our measure of each participant’s generosity. Among AMT participants, 12 percent responded incorrectly while in the national sample, 16 percent got the answer wrong. In both groups, these people were not asked about point donation. We report descriptive and summary information about the distribution of responses and normalize the variable for all statistical tests and regression models.
Analysis
We compare the two samples in multiple ways. First, we calculate descriptive statistics for all of our measures and conduct two-sample differences of means/proportions tests against a null hypothesis of no difference across the two groups (Table 1). We also plot standardized group means for all of the Internet experiences and prosociality measures (Figure 1). To test whether these relationships are robust to controlling for other variables, we then estimate multiple regression models. To understand the demographic and socioeconomic variations between the AMT and NORC groups, we first regress a dichotomous indicator for sample on the sociodemographic predictors (Table 2). Then, in Tables 3 and 4, we regress each of the Internet experience as well as the prosocial attitudes and behavior measures on the sociodemographic factors and the dichotomous indicator for sample (AMT vs. NORC).
Descriptive Statistics of Both Samples.

Note: AMT = Amazon Mechanical Turk.
p < .05. **p < .01. ***p < .001.

Differences between the two samples (AMT vs. NORC) on key variables of interest.
Logistic Regression on Whether a Participant Is in the Amazon Mechanical Turk Sample.

p < .05. ***p < .001.
Regression Models on Internet Experiences.
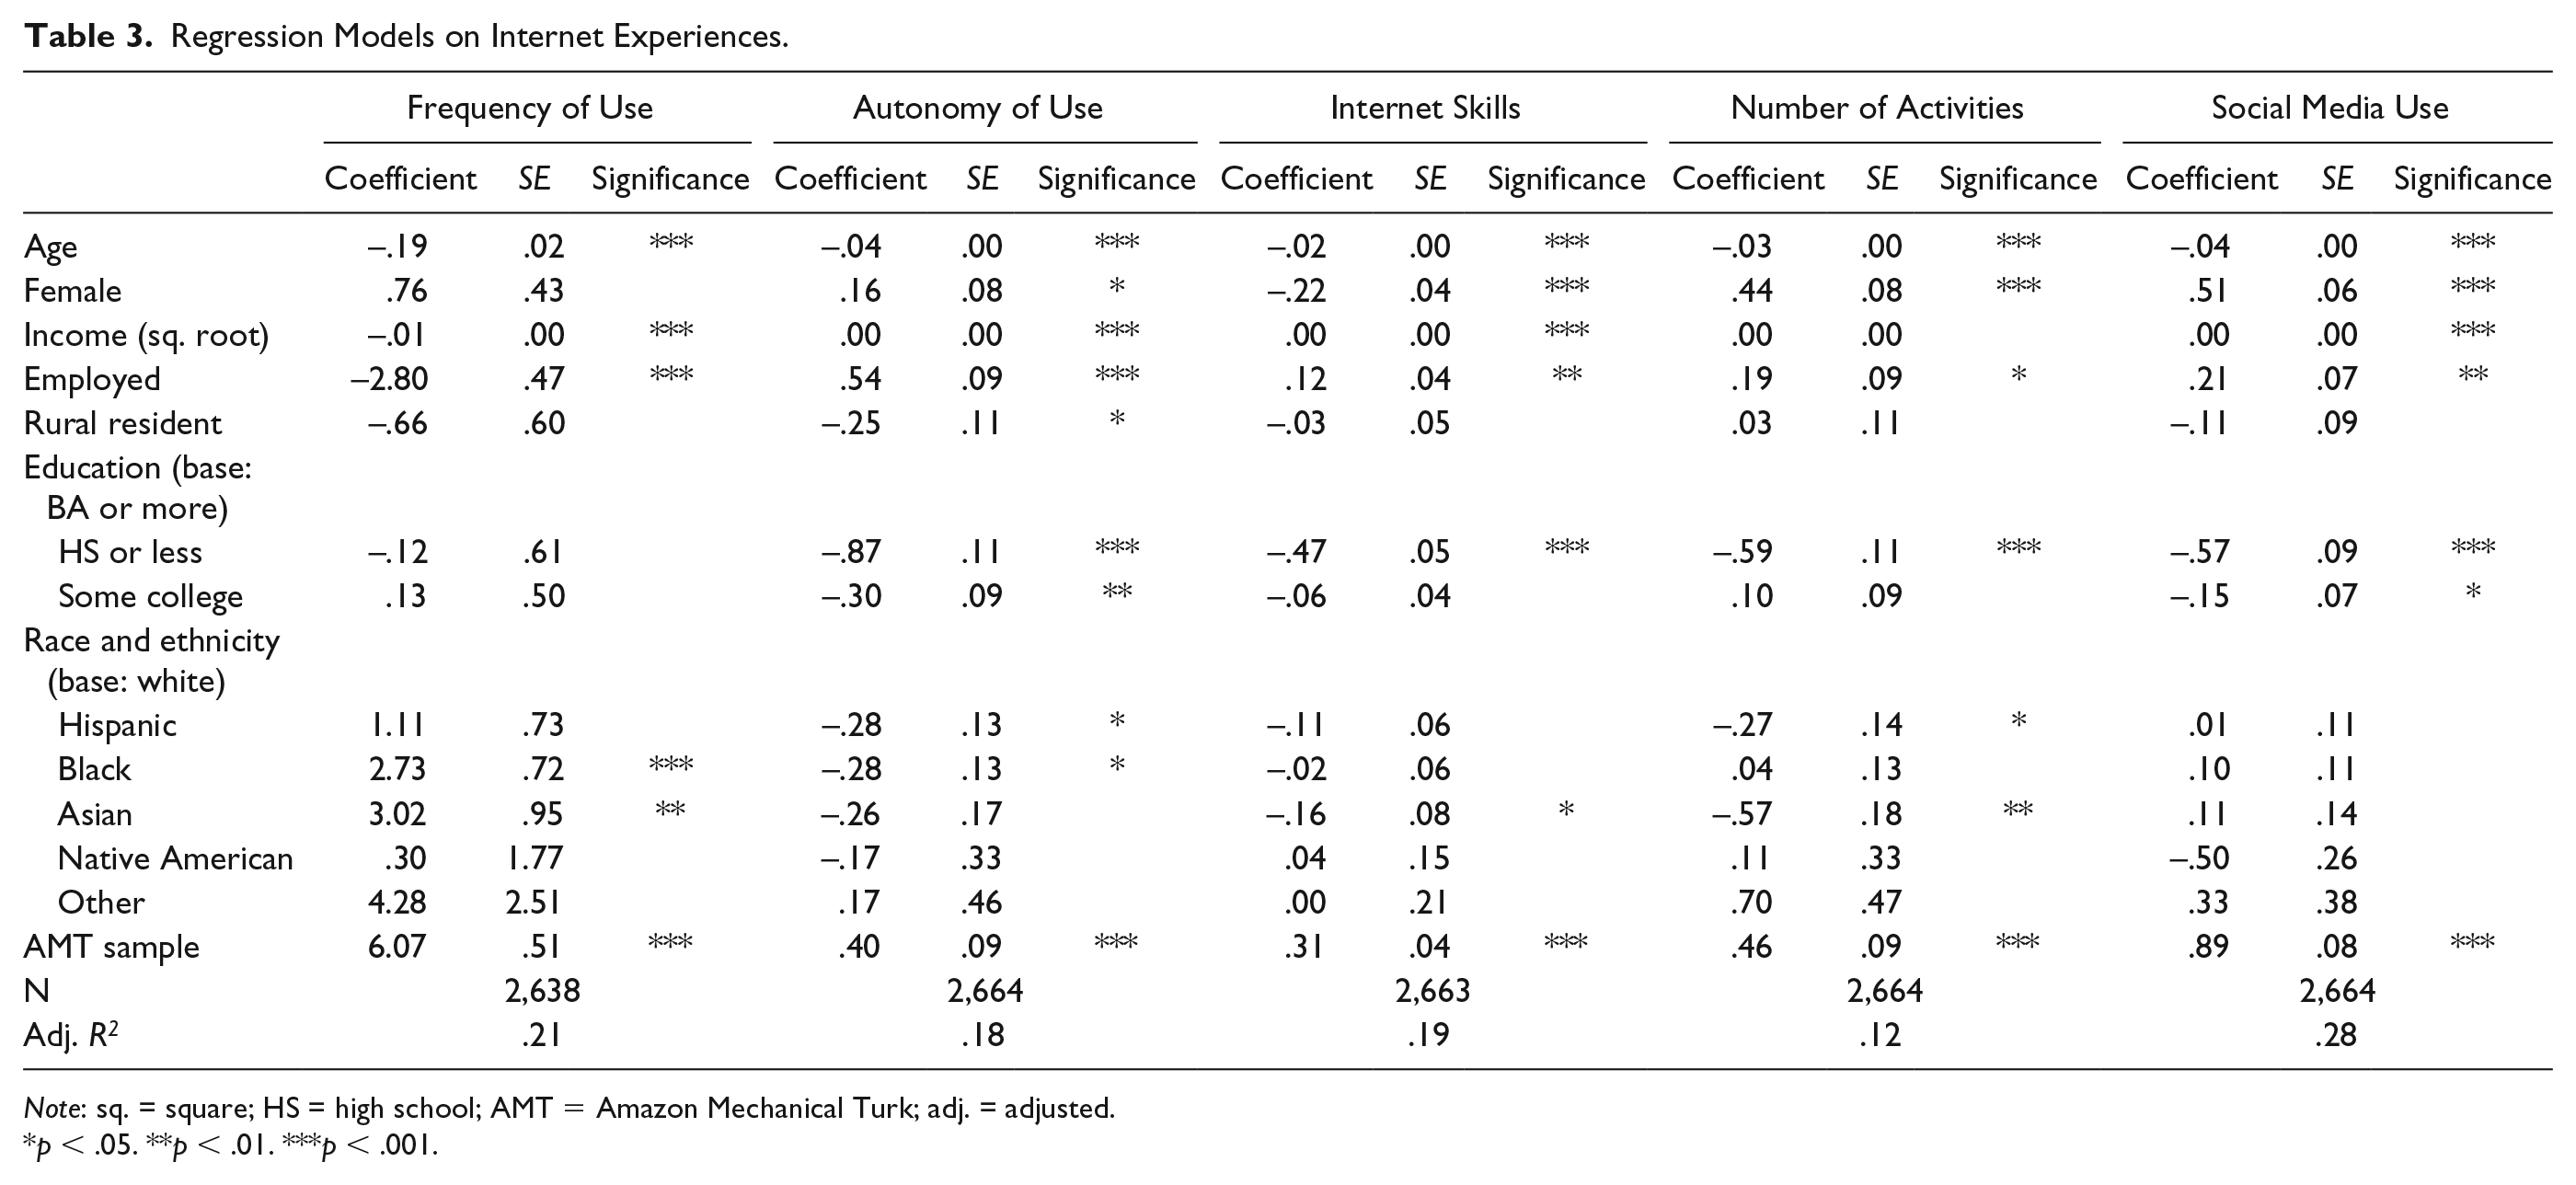
Note: sq. = square; HS = high school; AMT = Amazon Mechanical Turk; adj. = adjusted.
p < .05. **p < .01. ***p < .001.
Regression Models on Prosocial Behaviors and Attitudes.

Note: sq. = square; HS = high school; AMT = Amazon Mechanical Turk; adj. = adjusted.
p < .01. ***p < .001.
We note that although NORC provides survey weights designed to approximate the U.S. population from the AmeriSpeak sample, all of our comparisons and estimates use unweighted data. This is because the focus of our study is to compare the two samples directly rather than evaluate any specific weighting approach. Prior work benchmarking AMT samples provides no consensus on the best practice in this respect, with some studies using various weighting schemes (Goel et al. 2017; Levay et al. 2016; Mullinix et al. 2015) and others not (Clifford et al. 2015; Coppock 2019). In addition, the impact of many types of weighting on regression results remains inconclusive (Bollen et al. 2016. We leave weighted comparisons to future studies and hope that the release of the data and analysis code for this article can facilitate such extensions of our work.
Results
Demographic Characteristics of the Two Samples
Table 1 shows descriptive statistics about the two samples. Compared with the national AmeriSpeak sample, the AMT sample is younger, has lower earnings, is much more highly educated, is less likely to be African American or Hispanic, is more likely to be Asian American, and is more likely to reside in rural areas. To see whether these differences hold when controlling for other factors, we regressed being in the AMT sample on the various sociodemographic factors (Table 2). Additionally, in this model we find that AMT participants are less likely to be employed than AmeriSpeak sample members. All of the aforementioned differences are robust and consistent with prior studies. Unlike prior studies that found AMT participants more likely to be female, we find no association between gender and sample.
Online Experiences of the Two Samples
Regarding their general Internet experiences, AMT respondents have more locations of Internet access available to them and spend considerably more time online (Table 1), findings that hold even when controlling for sociodemographics (Table 3). They also have higher Internet skills, a factor that again holds after controlling for other variables. Figure 1 visualizes these differences between the two samples. AMT respondents are also statistically significantly more likely to be on more social media platforms (3.9 vs. 2.5 for the national sample). These findings are consistent with prior work showing that social media adoption is not random; specific user characteristics influence who uses which site (Blank and Lutz 2016, 2017; Hargittai 2015, 2018; Hargittai and Litt 2011). When it comes to active online participation, that is, sharing one’s own content, AMT respondents are much more engaged again. The average number of such activities in which AMT respondents had ever engaged is 3.6, compared with 2.6 for the national sample. So not only on social media are AMT respondents more active, but they are more likely to contribute to various online conversations across the Web from posting reviews to sharing videos.
Prosocial Behaviors and Attitudes of the Two Samples
With respect to prosocial behaviors and attitudes, we also find evidence of substantial variation across the two samples. In Table 1 and Figure 1, we see that AMT participants reported lower levels of prosociality than the AmeriSpeak participants. Most of these differences persist even when adjusting for demographic and socioeconomic factors. Table 4 shows the regression results and indicates that AMT participants were somewhat more trusting but were otherwise less prosocial than NORC participants, reporting fewer cooperative behaviors and donating less to their peers in the dictator game. The latter two estimates are substantial, with the dictator game outcomes varying, on average, by about two thirds of a standard deviation.
Discussion
Overall, our results (summarized graphically in Figure 1) indicate that AMT study participants diverge substantially from a national survey sample along dimensions of Internet experiences as well as prosocial attitudes and behaviors. These differences persist despite covariance adjustment using a large set of demographic and socioeconomic control measures in multiple regression models. The background attributes that explain variations across our two samples are largely consistent with findings from prior studies (see Table 2). Gender provides an exception to this, as most prior work had found that AMT samples included more female participants than national samples comparable with NORC. Sample (AMT vs. NORC) stands out as the only variable that explains variation in every single outcome in our models even while adjusting for the different background attributes.
Our analysis cannot fully explain the differences across the two samples with respect to the outcomes included in the study. That said, we do not find it surprising that AMT participants have greater Internet experience than a national sample. Workers in an online labor market that focuses on digital piecework should have more online experiences and skills than a sample designed to resemble the population of adults in the U.S more closely. Similarly, the variation in terms of prosociality might be explained by the salient norms of the two organizations involved in the sampling. AMT presents an atomized labor market optimized for arm’s-length transactions and piecework (Gray and Suri 2019; Irani and Silberman 2013). Such an environment may reward narrowly self-interested behavior without providing much in the way of social support or interactions as the workers in AMT cultivate social support and interactions through other means “off site” (Gray and Suri 2019). NORC recruits and retains panel participants with the aim of sustaining a diverse pool of individuals available to participate in their ongoing studies. The institutions of each could, in this way, elicit the sorts of responses we received (from AMT workers who may be otherwise similar to those in the NORC sample but act more selfishly on AMT) or indirectly bias the participant pool of AMT toward more narrowly self-interested individuals (or vice versa with the NORC participants). Recent evidence of preferential ingroup cooperation (Almaatouq et al. 2019) and off-site coordination among AMT workers (Gray and Suri 2019) suggests that the variations we report here may be further complicated by other factors as well.
Unlike prior studies, we find that adjusting for background attributes does not minimize variations in the dependent variables discussed here across the AMT and NORC samples. We find that AMT participants report more Internet-related experiences, activities, and expertise, whereas NORC participants report more prosocial attitudes and behaviors. For several outcomes, these differences are substantial, implying that the sort of covariance adjustment strategies endorsed by earlier work (e.g., Levay et al. 2016) would not eliminate bias correlated with the dependent variables in our models. It is possible that the multilevel regression and poststratification approach used by Goel et al. (2017) would generate more accurate estimates of population-level parameters from the AMT sample. Even the more rigorously sampled AmeriSpeak data almost certainly deviate from ground truth to some degree (Goel et al. 2017), implying that the differences are matters of degree, rather than absolute. As discussed earlier, we leave it to future work to explore the comparative performance of different weighting schemes on the data collected for this study.
Our findings suggest that prior work using AMT samples cannot make a priori claims to unbiased or generalizable inference when variables of interest correlate with dimensions of Internet experiences or prosociality. As a general rule, it is best not to confound the substantive research questions of interest with the method of data collection. For example, if the research question has to do with some type of online behavior, then it is problematic to rely on a sample that is biased regarding Internet experiences and skills (i.e., one in which sample participants spend more time online, have more autonomy of use, have higher Internet skills, use more social media platforms, and engage in more online participatory behaviors). Any resulting bias may or may not have an impact on the effects of specific experimental manipulations conducted with AMT study participants; this is an empirical question that future work may consider. Given the evidence of substantial variation in terms of Internet experiences and skills between the samples in this study, the risk for omitted variable bias, even in the presence of sophisticated statistical adjustment and correction, deserves closer scrutiny. In the absence of further evidence, it may be wiser to refrain from broad claims to general behavioral, attitudinal, or cognitive insights based exclusively on studies from AMT.
Footnotes
Acknowledgements
The authors are grateful to Merck (Merck is known as MSD outside the United States and Canada) and the Robert and Kaye Hiatt Fund at Northwestern University for support.
1
This was the attention-check question: “The purpose of this question is to assess your attentiveness to question wording. For this question, mark the ‘Very often’ response.” followed by these response potions: “Never,” “Rarely,” “Sometimes,” “Often,” and “Very often.”
2
This attention-check failure rate is a little high in our experience with other surveys. That said, in the absence of benchmarks for this specific measure of data quality, it is difficult to provide any interpretation.
3
In the review process, we also estimated alternative specifications of all of the models using a log-transformed version of the income measure. These are provided in the supplementary materials. All of the substantive findings discussed below were robust to this change, and nearly all of the alternative point estimates were within the standard error of those presented in the tables.