
Abstract
One of the most notable recent developments in survey research is the increased usage of online convenience samples drawn from Amazon’s Mechanical Turk (MTurk). While scholars have noted various social and political differences (e.g., age, partisanship) between MTurk and population-based samples, the breadth and depth of these variations remain unclear. We investigate the extent to which MTurk samples differ from population samples, and the underlying nature of these differences. We do so by replicating items from the population-based American National Election Studies (ANES) 2012 Time Series Study in a survey administered to a sample of MTurk respondents. With few exceptions, we not only find that MTurk respondents differ significantly from respondents completing the 2012 ANES via the Web but also that most differences are reduced considerably when controlling for easily measurable sample features. Thus, MTurk respondents do not appear to differ fundamentally from population-based respondents in unmeasurable ways. This suggests that MTurk data can be used to advance research programs, particularly if researchers measure and account for a range of political and demographic variables as needed.
Introduction
Surveys remain fundamental to the study of public opinion and political behavior. At the same time, a number of significant developments over the past few decades have transformed survey methodology. One notable development is the rise of Web-based surveys (see Baker et al., 2010). With increased public accessibility of the Internet, researchers collect survey data from thousands of participants at a lower cost and quicker pace than ever before (Couper, 2000, 2011).
Amazon.com’s Mechanical Turk (MTurk) is one example of a useful Internet-based resource. MTurk allows researchers to easily recruit participants and administer surveys at little cost: Consequently, it has emerged as a prominent data source among researchers of U.S. public opinion (e.g., Arceneaux, 2012; Gerber, Huber, Doherty, & Dowling, 2011; Huber, Hill, & Lenz, 2012; Huber & Paris, 2013). However, MTurk samples include only individuals who opt into MTurk and complete a given survey, leading to samples that are typically unrepresentative of the U.S. population. A fair amount of work shows that MTurk samples consistently differ from population-based samples of the American public on many demographic and political variables (Berinsky, Huber, & Lenz, 2012; Buhrmester, Kwang, & Gosling, 2011; Huff & Tingley, 2015; Ipeirotis, 2010; Krupnikov & Levine, 2014; Mullinix, Leeper, Freese, & Druckman, 2015). 1 Nevertheless, a growing literature focusing on the generalizability of experimental research using MTurk data finds that with some exceptions, researchers can make credible, generalizable experimental inferences with some confidence (e.g., Berinsky et al., 2012; Krupnikov & Levine, 2014; Mullinix et al., 2015).
We update and expand on this body of work by comparing an MTurk sample and a population-based sample designed to be representative of the U.S. population on a larger range of demographic and political variables than most previous work, namely, a host of attitudinal and behavioral measures. Of greater importance, we address whether easily measurable features can explain raw descriptive sample differences; that is, can differences between the samples in more specific variables be explained by more basic and well-known demographic and political variables? If so, MTurk samples could provide a fruitful resource for hypothesis generation and testing for observational researchers of public opinion, so long as they account for at least these basic variables where differences usually exist. If not, MTurk respondents may fundamentally differ from those in population-based samples in ways that will misdirect inferences in observational studies and that cannot be corrected simply by weighting the sample by measurable features. In either case, researchers of public opinion, including experimentalists, will gain more clarity about when and how they might adjust their sampling strategy and procedures to meet their particular needs.
To address these issues, we replicate items from the American National Election Studies (ANES) 2012 Time Series Study in a survey administered to a sample of MTurk respondents. We compare MTurk respondents with a population-based sample who completed the 2012 ANES survey via the Web. We document numerous and many less-noted raw differences, though most are consistent with one another and extant research. Yet, we also find that, with some exceptions, once we control for a short set of relevant variables, approximately nine, the effects of being an MTurk respondent diminish considerably. In short, most differences between respondents in our MTurk and population-based samples do not seem to reflect unobservable distinctions, but rather variation on factors that researchers might expect and can easily capture.
Our results suggest that, if used with care, observational researchers can use MTurk for developing a research program in that the data will generate useful inferences on which to build (i.e., they should not generate an unusual number of false negatives or false positives). However, we do not suggest that MTurk is a wholesale substitute for population-based samples, nor that controlling for the covariates we identify here is a universally effective formula. In addition to some evidence showing that MTurk samples might under- and overrepresent some groups differently at distinct points in time, we also find some inexplicable and less well-noted differences. Our point, then, is that if researchers account for most basic sample features, they can effectively use these measures to adjust observational data (e.g., using sampling weights) so that inferences can often, though not always, be generalized to larger populations (see Callegaro et al., 2014, for discussion). 2 In other words, while perhaps not ideal for observational research, with extensive and careful measurement, MTurk can be used with some confidence for theory development.
In addition, our results further clarify when experimentalists expecting heterogeneous treatment effects by some characteristic should be more or less careful when using MTurk. Although by no means definitive, our findings suggest that even where MTurk underrepresents individuals with a given characteristic, these researchers can proceed with some confidence that increasing the number of people with that characteristic in their sample might be sufficient for properly estimating treatment effects across or among those individuals. In any case, researchers of all kinds should always analyze and situate their findings in the context of their sample, both in process and composition.
We begin with a brief discussion of MTurk and the ways in which samples drawn with MTurk most commonly differ from population-based samples. Next, we describe our data—how we recruited and collected data from our MTurk sample, as well as the features of our comparison population-based sample who completed the 2012 ANES. We then present the results of our analysis, showing a number of basic raw observational differences, but also evidence that many, though not all, of these differences are reduced considerably with the inclusion of easily measurable covariates. We conclude with suggestions for researchers interested in using MTurk to conduct surveys who might be concerned with MTurk sample composition.
MTurk and MTurk Samples
MTurk is an online crowdsourcing labor market launched by Amazon.com in 2005. Individuals and organizations (requesters) use MTurk to hire humans (workers) to complete various computer-based tasks (Human Intelligence Tasks or HITs). Requesters post HITs on the MTurk site and can make HITs available to all MTurk workers or only workers who meet a given set of requirements (e.g., an IP address located in a specific geographic area). Upon completion of a HIT, requesters then either reject or accept individuals’ work and reward them accordingly. Given that MTurk now boasts a large number of workers willing to complete any number of computer tasks for small sums of money, it has become a popular resource among survey researchers, as surveys can be posted as HITs for completion. For example, a Google Scholar search of “Mechanical Turk” yields 1,080 hits from 2010; 2,750 from 2012; and 5,520 from 2014.
Nevertheless, MTurk respondents include those who opt in to MTurk and a given survey, meaning that MTurk samples are unrepresentative of many specified populations. This also means calculating respondents’ chances of being sampled is virtually impossible (see Baker et al., 2010; Couper, 2011). Thus, as reviewed in more detail below, while MTurk samples are usually more representative than other commonly used convenience-based samples, such as college students (Berinsky et al., 2012; Buhrmester et al., 2011; Casler, Bickel, & Hackett, 2013; Paolacci, Chandler, & Ipeirotis, 2010), they consistently and clearly differ from population-based samples aiming to be representative of the U.S. population. Indeed, the use of MTurk has sparked considerable debate, though there is emerging consensus that MTurk is largely suitable for experimental work (Berinsky et al., 2012; Buhrmester et al., 2011; Casler et al., 2013; Krupnikov & Levine, 2014; Mullinix et al., 2015; Paolacci et al., 2010). There is no such consensus when it comes to observational work, however.
How do MTurk samples usually differ from the U.S. population? Extant work shows a number of stable demographic differences between MTurk samples and U.S. population-based samples. MTurk samples tend to have lower average incomes, higher average education levels, lower average ages, and much smaller percentages of most non-White groups, especially Blacks (Berinsky et al., 2012; Buhrmester et al., 2011; Huff & Tingley, 2015; Ipeirotis, 2010; Krupnikov & Levine, 2014; Paolacci & Chandler, 2014). 3 Similarly, differences in political identity appear to be mostly stable, with MTurk samples frequently containing many more Democrats and liberals than population-based samples (Berinsky et al., 2012; Krupnikov & Levine, 2014; Mullinix et al., 2015).
Existing comparisons are useful, but they do not consistently capture all potentially relevant differences between MTurk and U.S. population-based samples, nor do they consider relationships between differences. This is especially true when it comes to specific political attitudes (e.g., government spending preferences, opinions about climate change, gun control, etc.) and/or behaviors (e.g., contacting a government official; although, see Berinsky et al., 2012, who include some political variables, but do not analyze relationships between differences on these and other variables). These gaps are notable, given that researchers using MTurk most often want to make observational and/or experimental inferences about attitudes and behaviors, as well as about and across subgroups with particular characteristics.
How consistent are the various differences of MTurk samples? Do MTurk samples differ in other ways than those that are most often measured? More importantly, do they differ in more specific attitudes and/or behaviors, and if so, can these be explained by more basic demographic and political differences, or are they reflective of fundamental, potentially unmeasurable features of MTurk respondents? If the former, MTurk could be a relatively useful data source even among observational researchers, as they can account for factors that differentiate MTurk respondents from others. If the latter, the ability of researchers using MTurk to make inferences would be more limited, particularly those wishing to make observational inferences of various kinds, but also researchers wishing to draw inferences about specific subgroups or who expect treatment effects to differ among specific subgroups who are less well represented among MTurk respondents.
Data and Method
To address our questions, we turn to the ANES 2012 Time Series Study. The ANES Time Series Study has been conducted in every national election year since 1948 and is one of the most extensive social and political surveys of the American electorate. In 2012, for the first time in its history, the Time Series Study was conducted both face-to-face and over the Internet with two independent samples. The sample who completed the Internet survey were members of GfK’s (formerly Knowledge Networks) KnowledgePanel, a sample of U.S. households drawn using random digit dialing and address-based methods. Sampled households were drawn randomly from a listing of addresses from the U.S. Postal Service’s Delivery Sequence File and U.S. residential landline telephone numbers. Households without a computer and/or Internet access were offered a laptop and free monthly Internet access from GfK in return for participation. A sample of KnowledgePanel members, who were U.S. citizens and at least 18 years old by the time of the 2012 presidential election (November 6, 2012), was sent invitations to participate in the 2012 ANES. The sample includes 3,860 individuals who completed the 2012 ANES during the 2012 U.S. presidential election in four waves, two conducted prior to the election (October 11, 2012 through November 6, 2012) and two after (November 29, 2012 through January 24, 2013). 4
The 2012 ANES is well suited for our purposes. To begin, it provides data from a population-based sample that, with the use of weights, is representative of the U.S. population. As important, it offers data on a number of variables of direct relevance to political and social science researchers and that remain largely unexplored with respect to MTurk. Finally, given completion of the survey via Internet by an independently drawn, population-based sample, we can analyze and compare the data from the 2012 Web ANES sample with data from an MTurk sample while controlling for survey mode (see Struminskaya et al., 2014 and Liu & Wang, 2015 on survey mode effects).
We designed and administered a survey on MTurk replicating numerous questions from the 2012 ANES. While limited by timing (i.e., not during or directly after the 2012 campaign; see below), our survey included a range of questions, many of which do not appear in extant work, thereby allowing us to offer one of the broadest sample comparisons to date and to test whether a number of sample differences can be captured by a host of basic demographic and political variables. In addition to a number of commonly measured demographics, such as age, income, and racial and ethnic identification, we included less consistently measured, as well as more specific demographics, such as employment status, home ownership, and both religious identity and group affiliation. We also included a number of opinion measures on salient topics, such as abortion, gun control, government spending in numerous areas, lesbian, gay, bisexual, transgender, queer (LGBTQ) rights, the environment, and the general role of government, as well as behavioral measures, such as contact with an elected official, volunteering, and media consumption habits. All questions were worded and randomized identically to the 2012 ANES, as well as ordered according to the order in which they appeared in the survey questionnaire. 5
We made our survey available to MTurk workers on June 10, 2013. Following others (e.g., Berinsky et al., 2012; Huff & Tingley, 2015; Krupnikov & Levine, 2014), we set three requirements for participation: a HIT Approval Rate greater than or equal to 90, at least 50 HITs approved, and an IP address based in the United States. The survey was advertised to workers as a national public opinion survey that would take 20 to 30 minutes to complete, terms similar to that of other work. 6 We closed the HIT after 2 days, on June 12, 2013, when we reached 2,000 unique survey completions.
Given the advertised completion time, and to gather data as quickly as possible, participants were compensated US$2.50 upon completion of the survey. Although relatively high, this amount is smaller than some (e.g., Huff & Tingley, 2015) and the rate per minute based on the advertised survey completion time is roughly comparable with most other work (e.g., Berinsky et al., 2012). Moreover, though not studied systematically, there is little evidence to suggest that higher compensation rates do more than decrease the amount of time it takes to recruit participants (Buhrmester et al., 2011; Mason & Watts, 2009; also see Paolacci & Chandler, 2014). In short, given comparable recruitment methods, we believe that our findings can be reasonably compared with those of extant work.
Below, we first assess the breadth of social and political differences between the samples and then consider the extent to which they can be explained by measured characteristics. We do so using regression analyses, first without covariates so as to calculate the simple differences between MTurk and 2012 ANES Web respondents on various items—which we call the “raw” differences—and then with basic covariates to estimate whether and how much this resolves those differences. For all analyses, we exclude respondents for which no response was given or “Don’t Know” was chosen. We also weight the ANES data to be representative of the U.S. population.
Results
Raw Socio-Demographic Differences
Table 1 presents descriptive data for socio-demographic variables among each sample, as well as coefficients for an MTurk dummy variable used in regression models of each variable with no controls. The latter provides the size of a given difference between the samples and whether it is statistically significant by conventional standards. Table 1 mostly confirms differences found in prior work; the MTurk sample is younger, more likely to be unmarried, lower income, and much less racially and ethnically diverse than the ANES sample. The average age of the MTurk sample is almost 20 years younger than the ANES sample (31.6 years vs. 47.4 years). A much larger share of the MTurk sample has also never been married (60.3% vs. 25.7%). The average reported household income of the MTurk sample is about US$10,000 less than the ANES sample (~US$54K vs. ~US$65K) and a significantly smaller percentage of MTurk respondents owns a home (37.8% vs. 72.1%). Finally, compared with the ANES sample, the MTurk sample contains about the same percentage of Whites (71.8% vs. 70.5%), but significantly smaller percentages of Blacks (7.1% vs. 12.2%) and Hispanics or Latino/as (5.6% vs. 11.2%). In addition, many more MTurk respondents report no race or ethnicity at all (7.1% vs. 1.9%) or something other than only those categories (8.6% vs. 3.7%). 7 We also find a much larger percentage of MTurk respondents are students (22.3% vs. 6.4%). Thus, as others find, despite being less well-off economically, the MTurk sample is much more educated than the ANES sample, with 45% of the MTurk sample possessing at least a bachelor’s degree versus only 29.5% of the ANES sample. 8
Socio-Demographic Characteristics of MTurk and 2012 ANES Web Samples.

Note. MTurk = Mechanical Turk; ANES = American National Election Studies 2012 Time Series Study. ANES data are weighted for all analyses. All data exclude respondents providing no answer or “Don’t Know.”
Respondents able to select more than one racial category. Hispanic/Latino was asked as a separate question on ANES and MTurk survey. Response options recoded to reflect the following: White indicates that participant selected only White; Black, non-Hispanic/Latino indicates that participant selected only Black for his or her racial identification and no to Hispanic/Latino; Hispanic/Latino indicates that participant answered yes to identifying as Hispanic or Latino and did not select White; Other indicates participant selected one of the following additional options: Asian, American Indian/Alaska Native, Native Hawaiian/other Pacific Islander, or other or selected multiple categories (excluding those indicating Hispanic/Latino); no race given indicates participant did not answer any questions about racial identification.
Individual-level income data not accessible from ANES at time of analysis; data reflect income midpoints of categorical income variable that was available at the time of this writing.
Respondents were able to select more than one response option so percentage total may equal more than 100. Percentages calculated by dividing number of respondents to select response option out of total possible number of respondents in each sample (2,144 for MTurk and 3,860 for 2012 ANES).
Significant at the .1 level. **Significant at the .05 level. ***Significant at the .01 level.
Interestingly, while some earlier work highlights that MTurk samples underrepresent men (e.g., Ipeirotis, 2010; Paolacci et al., 2010), our data exhibit the opposite pattern (53.9% male). This finding, however, is consistent with more recent work (e.g., Berinsky et al., 2012; Casler et al., 2013; Krupnikov & Levine, 2014). Similarly, though less consistently measured across studies, our data appear to contrast when it comes to religious identity. We find no differences between the samples in any organized religious group identifications (also see Berinsky et al., 2012). However, we do confirm previous findings on religious beliefs and religiosity; a strikingly substantial percentage of the MTurk sample—over 40%—identifies as agnostic or atheist, whereas only 10% of ANES respondents does and many fewer MTurk respondents attend church or religious services (29.4% vs. 54.9%; see Paolacci & Chandler, 2014).
Given comparable recruitment methods, though speculative, the above suggests that the composition of the MTurk worker population might shift over time, at least on some variables. Also, MTurk samples might differ at different points in time on particular variables more than on others, even where measured characteristics might seem related (e.g., wider and more stable differences in religious beliefs/religiosity vs. organized religious group identification). While these are generally beyond researchers’ control, as we discuss in the conclusion, it underscores the utility of regularly measuring multiple demographic features in multiple ways when using MTurk.
Raw Political Differences
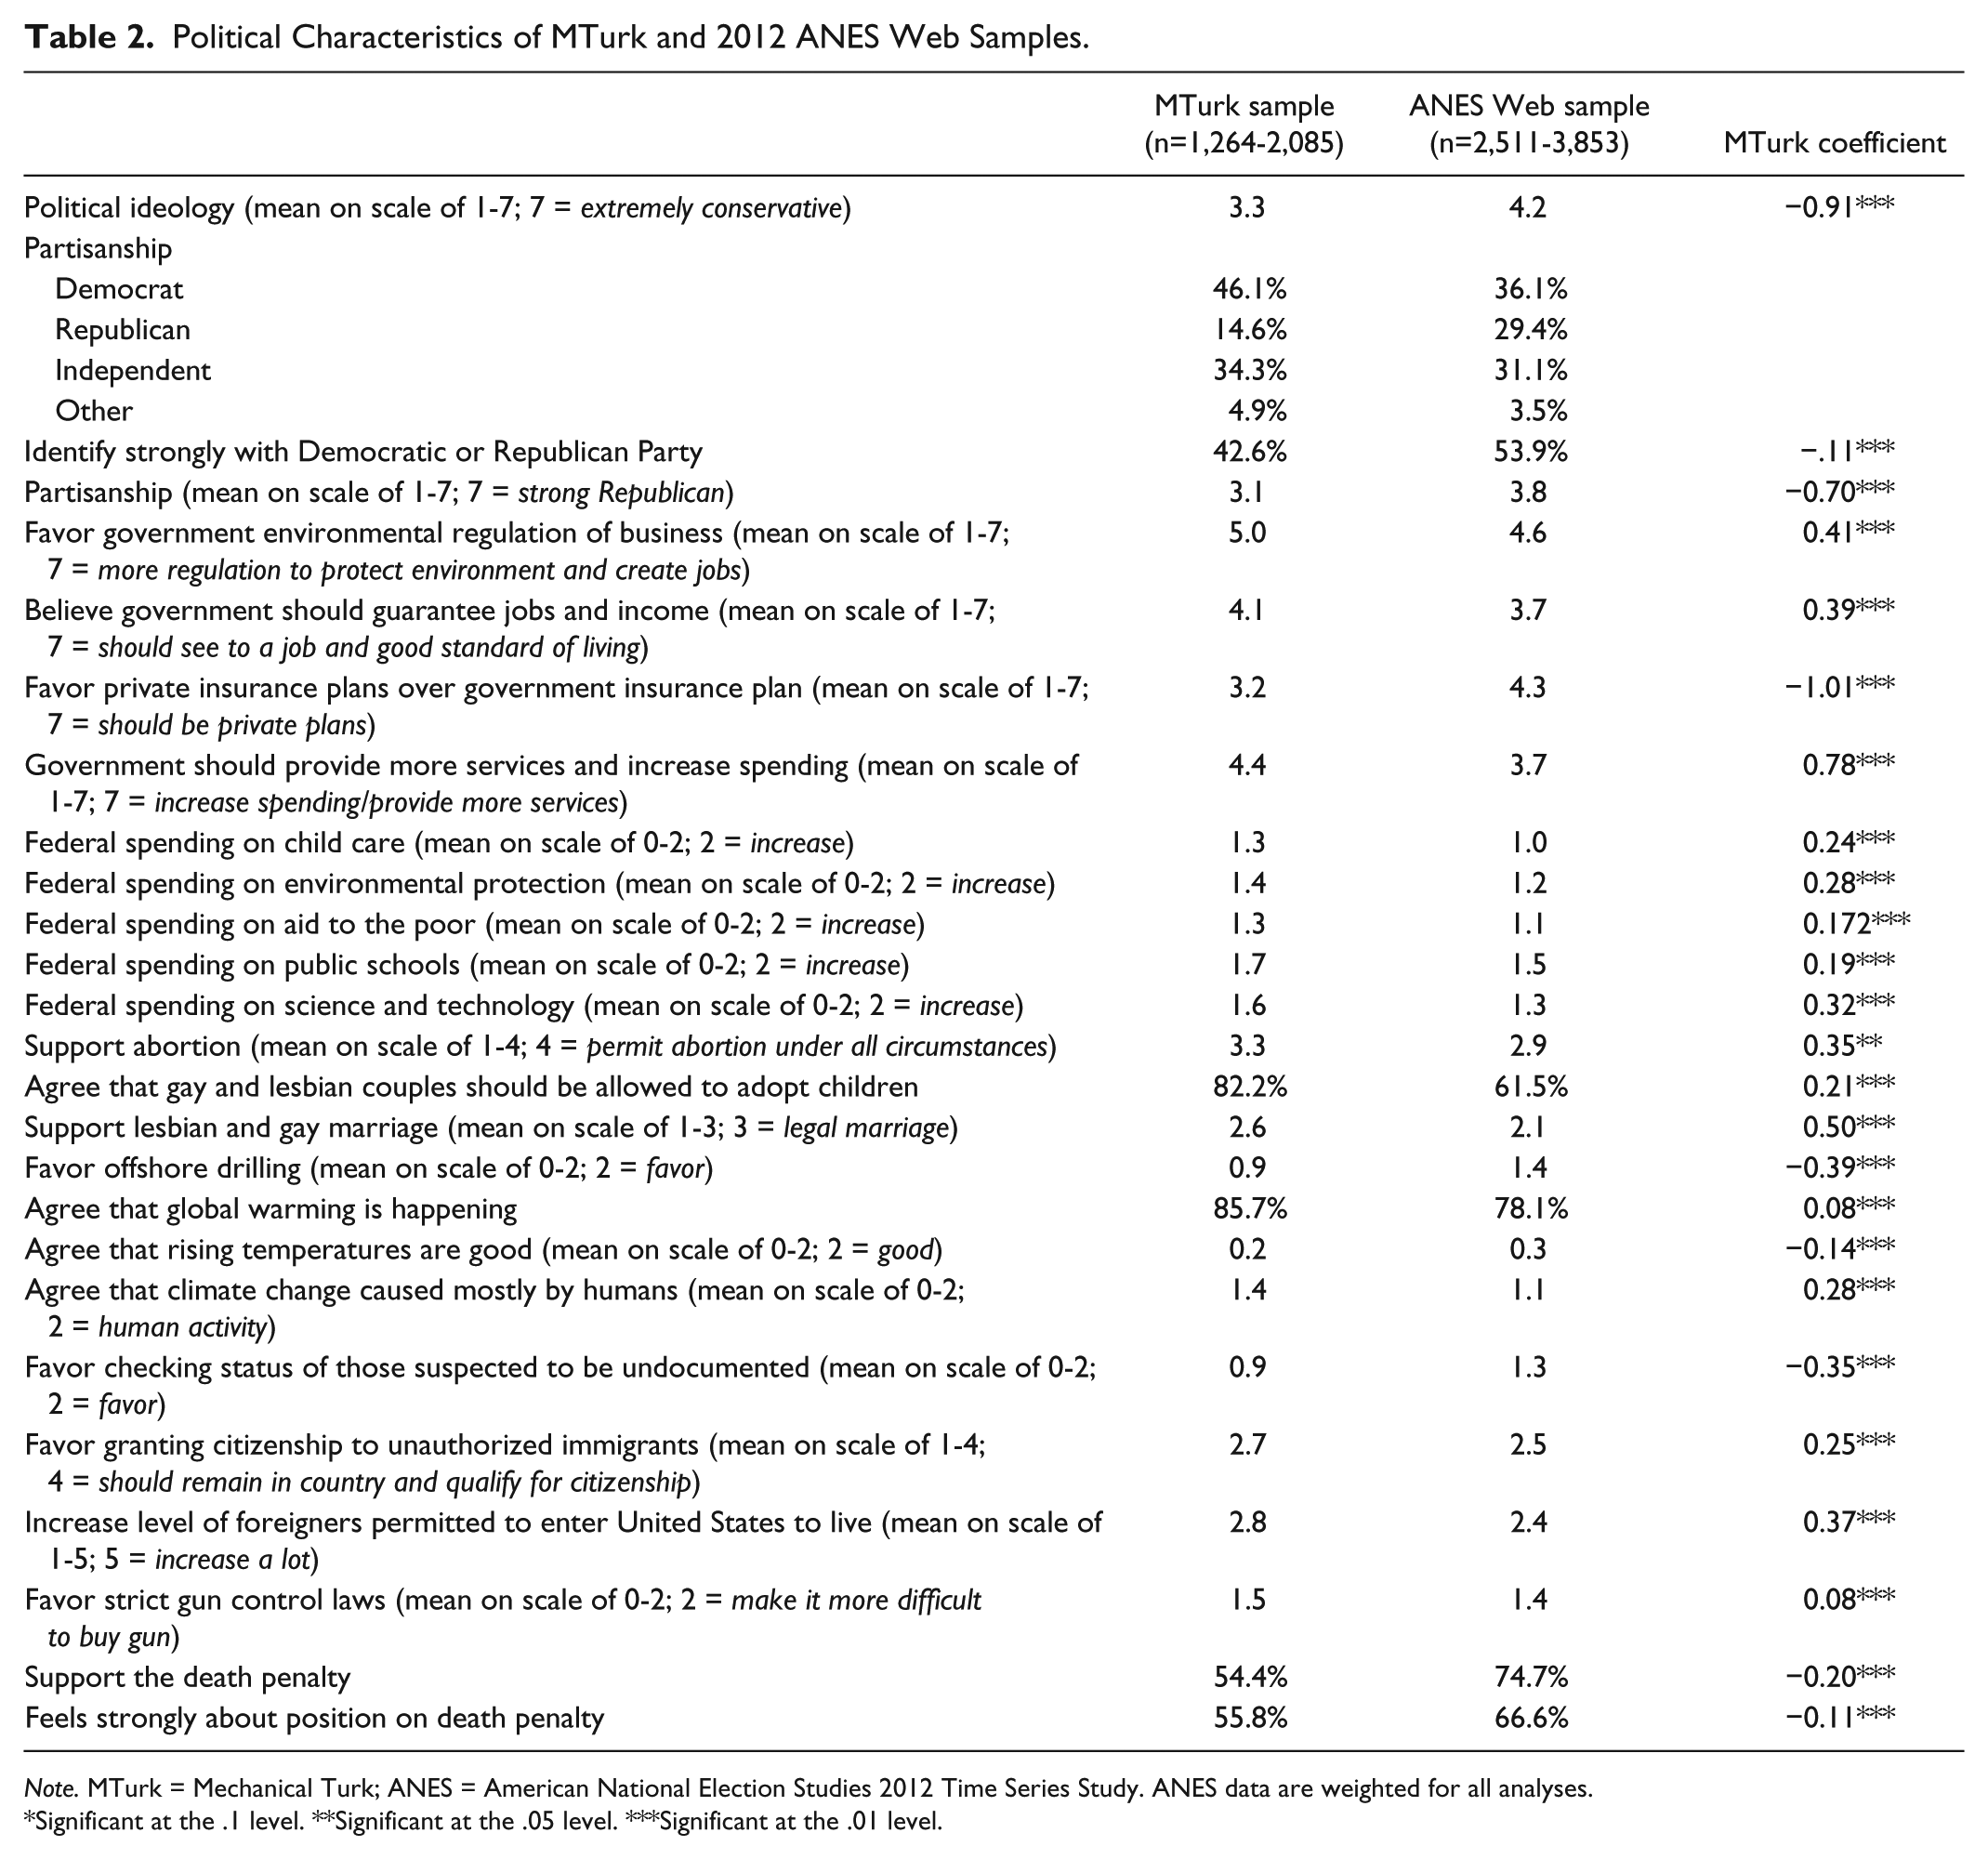
Tables 2 and 3 include descriptive data for political variables, as well as the MTurk coefficients for regression models of each variable without any controls. Consistent with previous work, our MTurk sample is significantly more liberal and Democratic than the ANES sample. The mean ideology of the MTurk sample is almost a full point lower on a scale of 1 to 7 (3.3. vs. 4.2, where 1 is extremely liberal) with 58.4% of the MTurk sample identifying as between slightly liberal and extremely liberal compared with only 27.8% of the ANES sample. Similarly, a significantly larger percentage of MTurk respondents identifies as Democratic (46.1% vs. 38.1%), and a smaller percentage identifies as Republican (14.6% vs. 27.6%).
Political Characteristics of MTurk and 2012 ANES Web Samples.
Note. MTurk = Mechanical Turk; ANES = American National Election Studies 2012 Time Series Study. ANES data are weighted for all analyses.
Significant at the .1 level. **Significant at the .05 level. ***Significant at the .01 level.
Political Behaviors of MTurk and 2012 ANES Web Samples.

Note. MTurk = Mechanical Turk; ANES = American National Election Studies 2012 Time Series Study. ANES data are weighted for all analyses.
Significant at the .1 level. **Significant at the .05 level. ***Significant at the .01 level.
Our MTurk sample also differs significantly in political preferences, though in ways that are consistent with other work (e.g., Berinsky et al., 2012) and the samples’ broader political differences (i.e., preferences reflect the more liberal, Democratic composition of the MTurk sample). Relative to the ANES sample, the MTurk sample more strongly favors environmental regulation of business, guaranteed jobs and income by government, increased spending and services by the government, and a government health insurance plan, as well as increased government spending in many specific areas (e.g., on science and technology). In addition, the MTurk sample expresses stronger support of gay and lesbian marriage, abortion with no restrictions, and stricter gun control laws than the ANES sample. Finally, more respondents in the MTurk sample oppose offshore drilling, deporting immigrants, increasing immigration restrictions, and the death penalty than in the ANES sample, as well as agree that global warming is happening, rising temperatures are bad, and climate change is caused mostly by humans.
The MTurk sample differs less in terms of political behavior. Similar and statistically indistinguishable percentages of MTurk and ANES respondents are likely to contact elected officials (20.9% vs. 22.9%) and participate in community work (28.5% vs. 30.1%). Relatedly, the samples are similar in terms of whether they have any say in what government does, as indicated by virtually equal means of 3.3 among the samples on a scale of 1 to 5. Although these findings appear to contradict those showing that MTurk respondents are less politically active (e.g., Berinsky et al., 2012), they are likely due to measurement differences. Others have mostly gauged activity with measures of voter turnout and registration, activities for which socio-demographic characteristics, namely age, are both strongly related to being an MTurk respondent and less significant predictors of the political activities measured here (Schlozman, Verba, & Brady, 2012).
That said, the samples differ when it comes to news media consumption, though in ways similar to recent work (Huff & Tingley, 2015). The difference between the samples in the average number of days spent getting news during a typical week is higher for the MTurk sample, but only with respect to Internet news (4.9 vs. 3.7). Alternatively, this average is about a day higher for both print and TV news for the ANES sample (2.1 vs. 1.1, and 3.8 vs. 2.6, respectively). Relatedly, the average level of attention paid to news among those who gather it from print or television at least 1 day or more during a typical week is lower among the MTurk sample (2.7 vs. 2.9 and 2.9 vs. 3.2, respectively, on a scale of 1-5), but higher when it comes to Internet news gatherers (3.1 vs. 2.8 on a scale of 1-5). These findings not only confirm previous work but also underscore that even as it underrepresents some groups, MTurk might be useful for attracting subgroups with more specific qualities. That is, MTurk samples might do relatively well at attracting large numbers of younger people who are highly interested in news and older people who are not, at least compared with population-based samples (see Huff & Tingley, 2015).
Multivariate Analyses of Socio-Economic Differences
We now turn to the important question of whether differences diminish when including measured covariates or reflect some fundamental and unmeasured distinction of MTurk respondents. We select sets of the broadest, most commonly measured covariates for which one can reasonably expect effects on more specific socio-demographic and political variables.
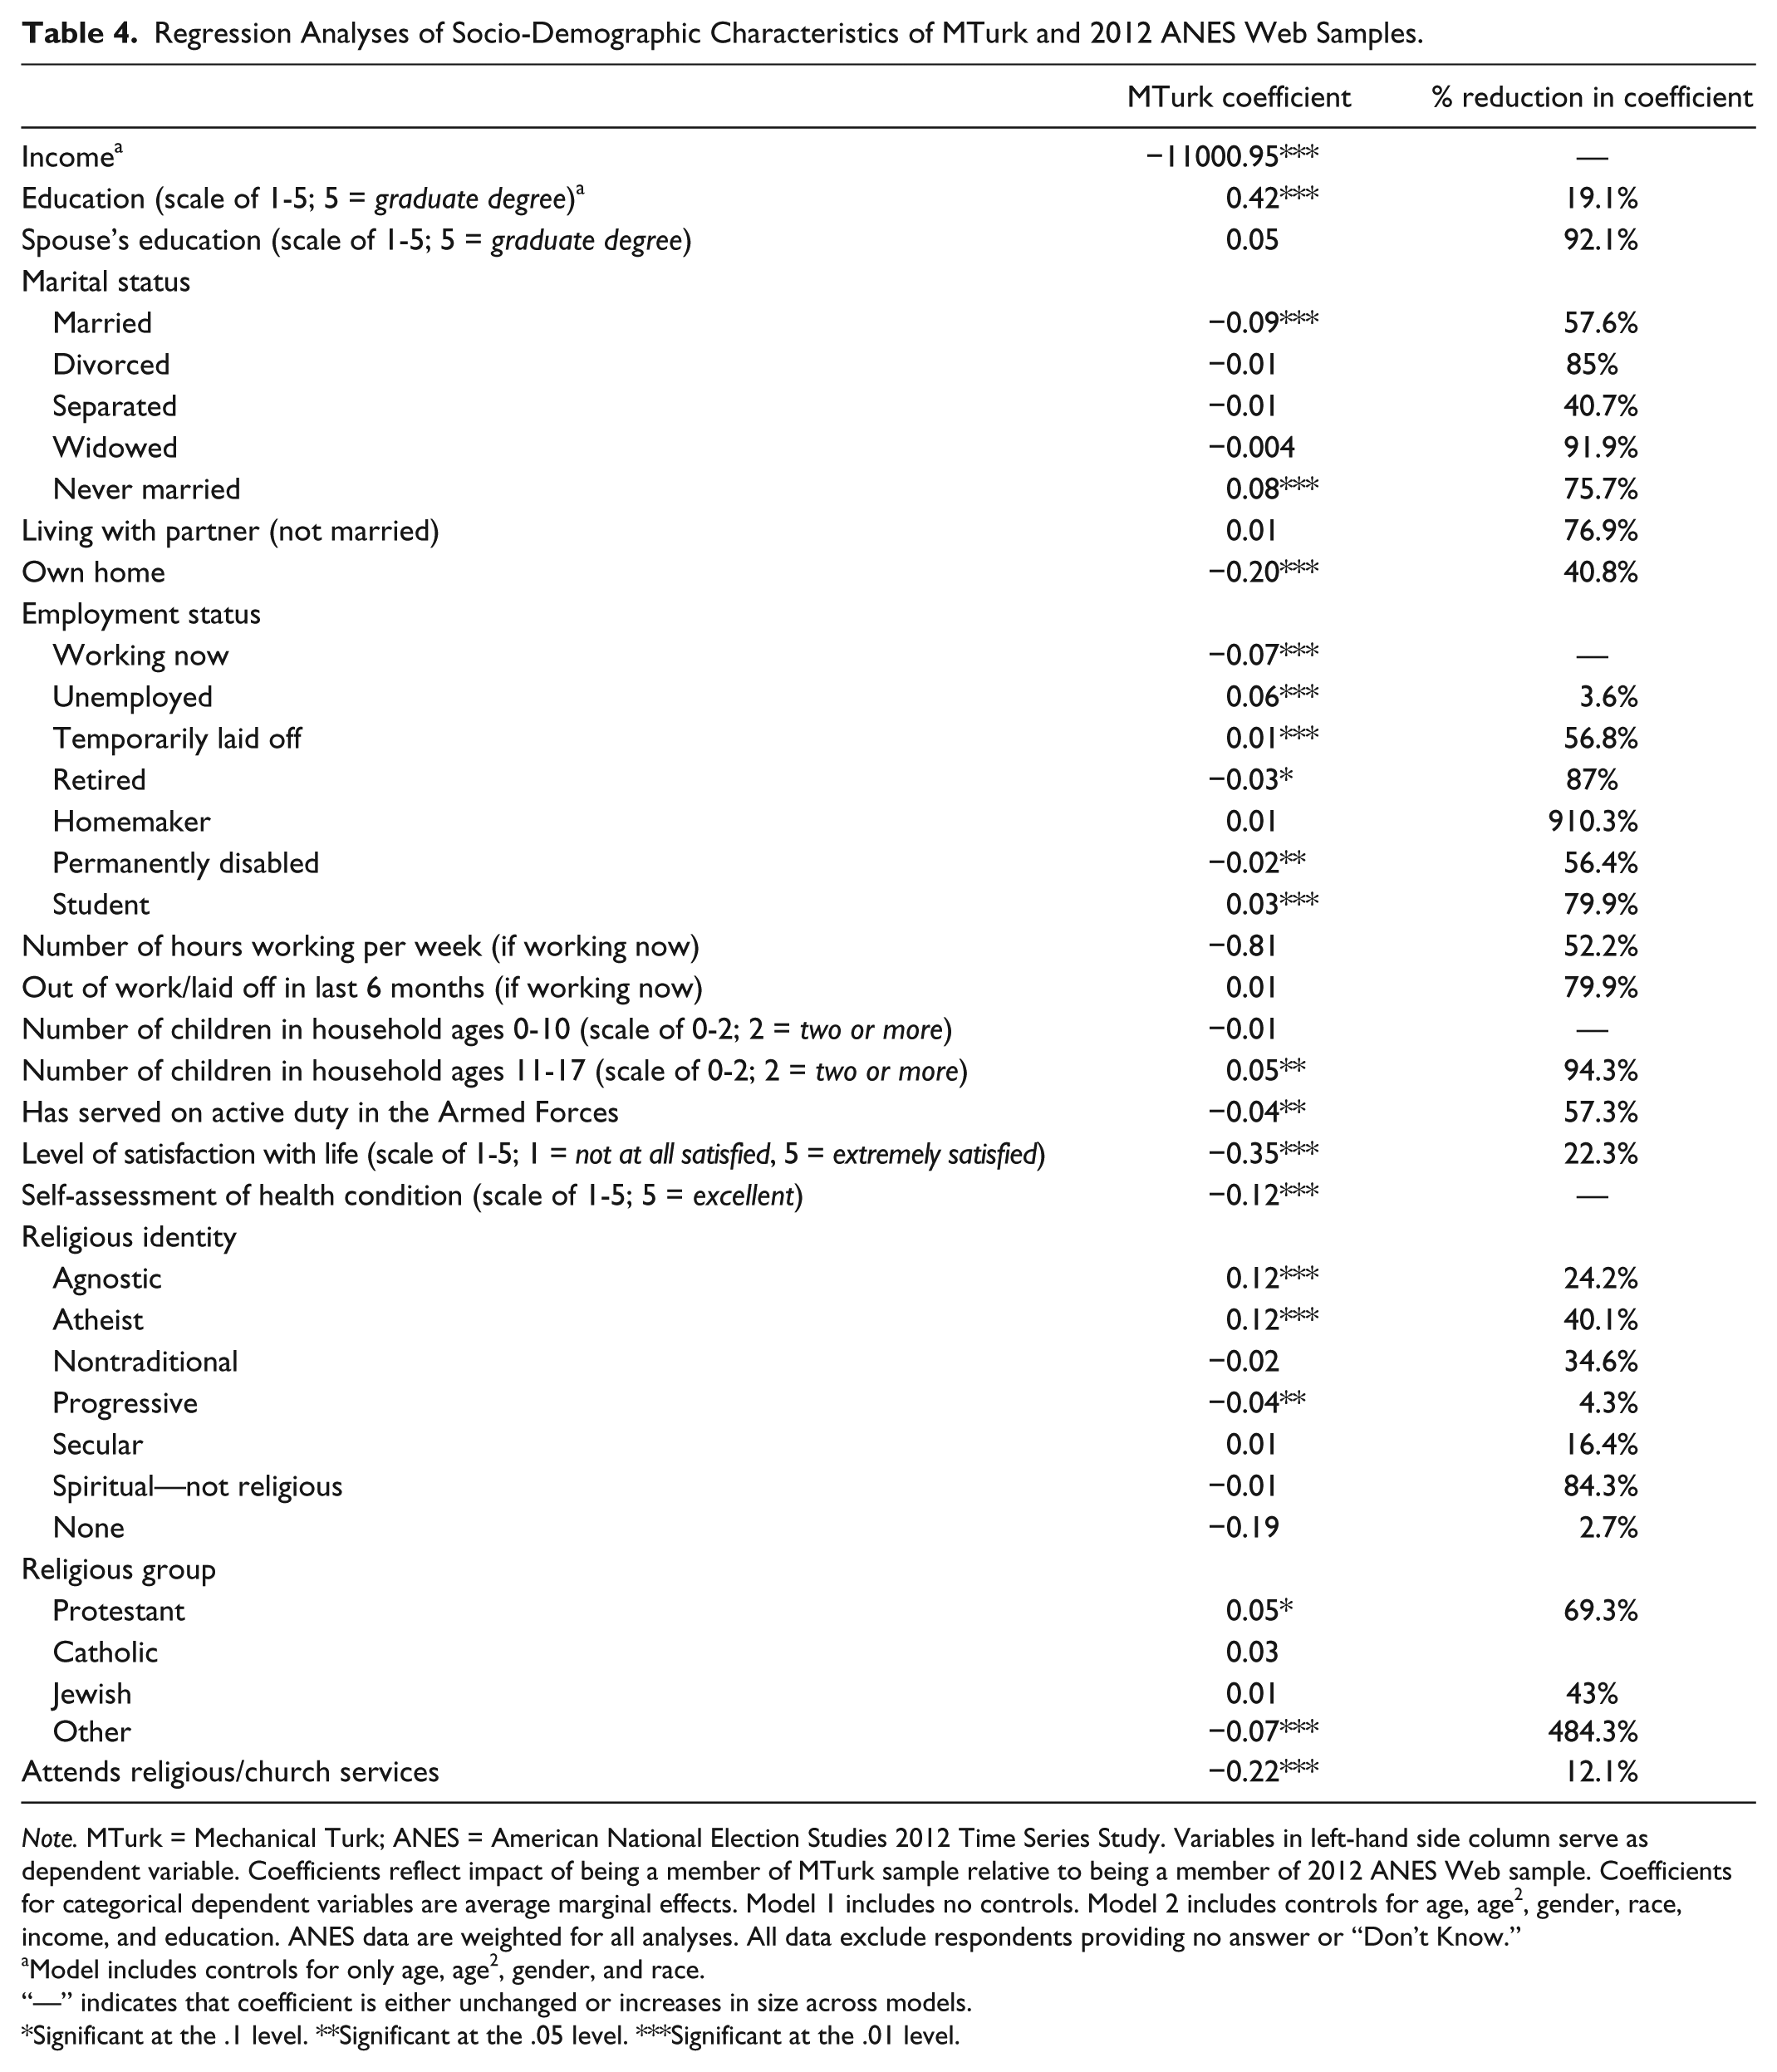
Table 4 reports the coefficients for MTurk sample membership (vs. ANES) from regressions of every socio-demographic variable, adding respondents’ age, age2, gender, and race and ethnicity as covariates; income and education are covariates in all models except for when they are outcomes. 9 For categorical outcomes, reported coefficients represent the average discrete change in the predicted probability resulting from being an MTurk respondent. We also report the percentage reduction of the coefficients from the models without any controls.
Regression Analyses of Socio-Demographic Characteristics of MTurk and 2012 ANES Web Samples.
Note. MTurk = Mechanical Turk; ANES = American National Election Studies 2012 Time Series Study. Variables in left-hand side column serve as dependent variable. Coefficients reflect impact of being a member of MTurk sample relative to being a member of 2012 ANES Web sample. Coefficients for categorical dependent variables are average marginal effects. Model 1 includes no controls. Model 2 includes controls for age, age2, gender, race, income, and education. ANES data are weighted for all analyses. All data exclude respondents providing no answer or “Don’t Know.”
Model includes controls for only age, age2, gender, and race.
“—” indicates that coefficient is either unchanged or increases in size across models.
Significant at the .1 level. **Significant at the .05 level. ***Significant at the .01 level.
A quick glance at Table 4 suggests that differences between the samples are not simply a by-product of their more basic demographic characteristics. Indeed, being an MTurk respondent remains a significant predictor for 21 of 35 variables, suggesting that other, unmeasured differences might exist among the samples. However—perhaps more revealingly—there are substantial reductions in the size of the MTurk coefficient across the models for most every variable (i.e., the substantive difference of being an MTurk respondent becomes quite small). The main exceptions are for employment status, earnings, and health assessment. Thus, while remaining statistical differences should not be dismissed, respondents in the MTurk sample diverge much less from those in the ANES sample on most variables once basic demographics are accounted for—differences are more likely to reflect easily measurable features.
Multivariate Analyses of Political Differences
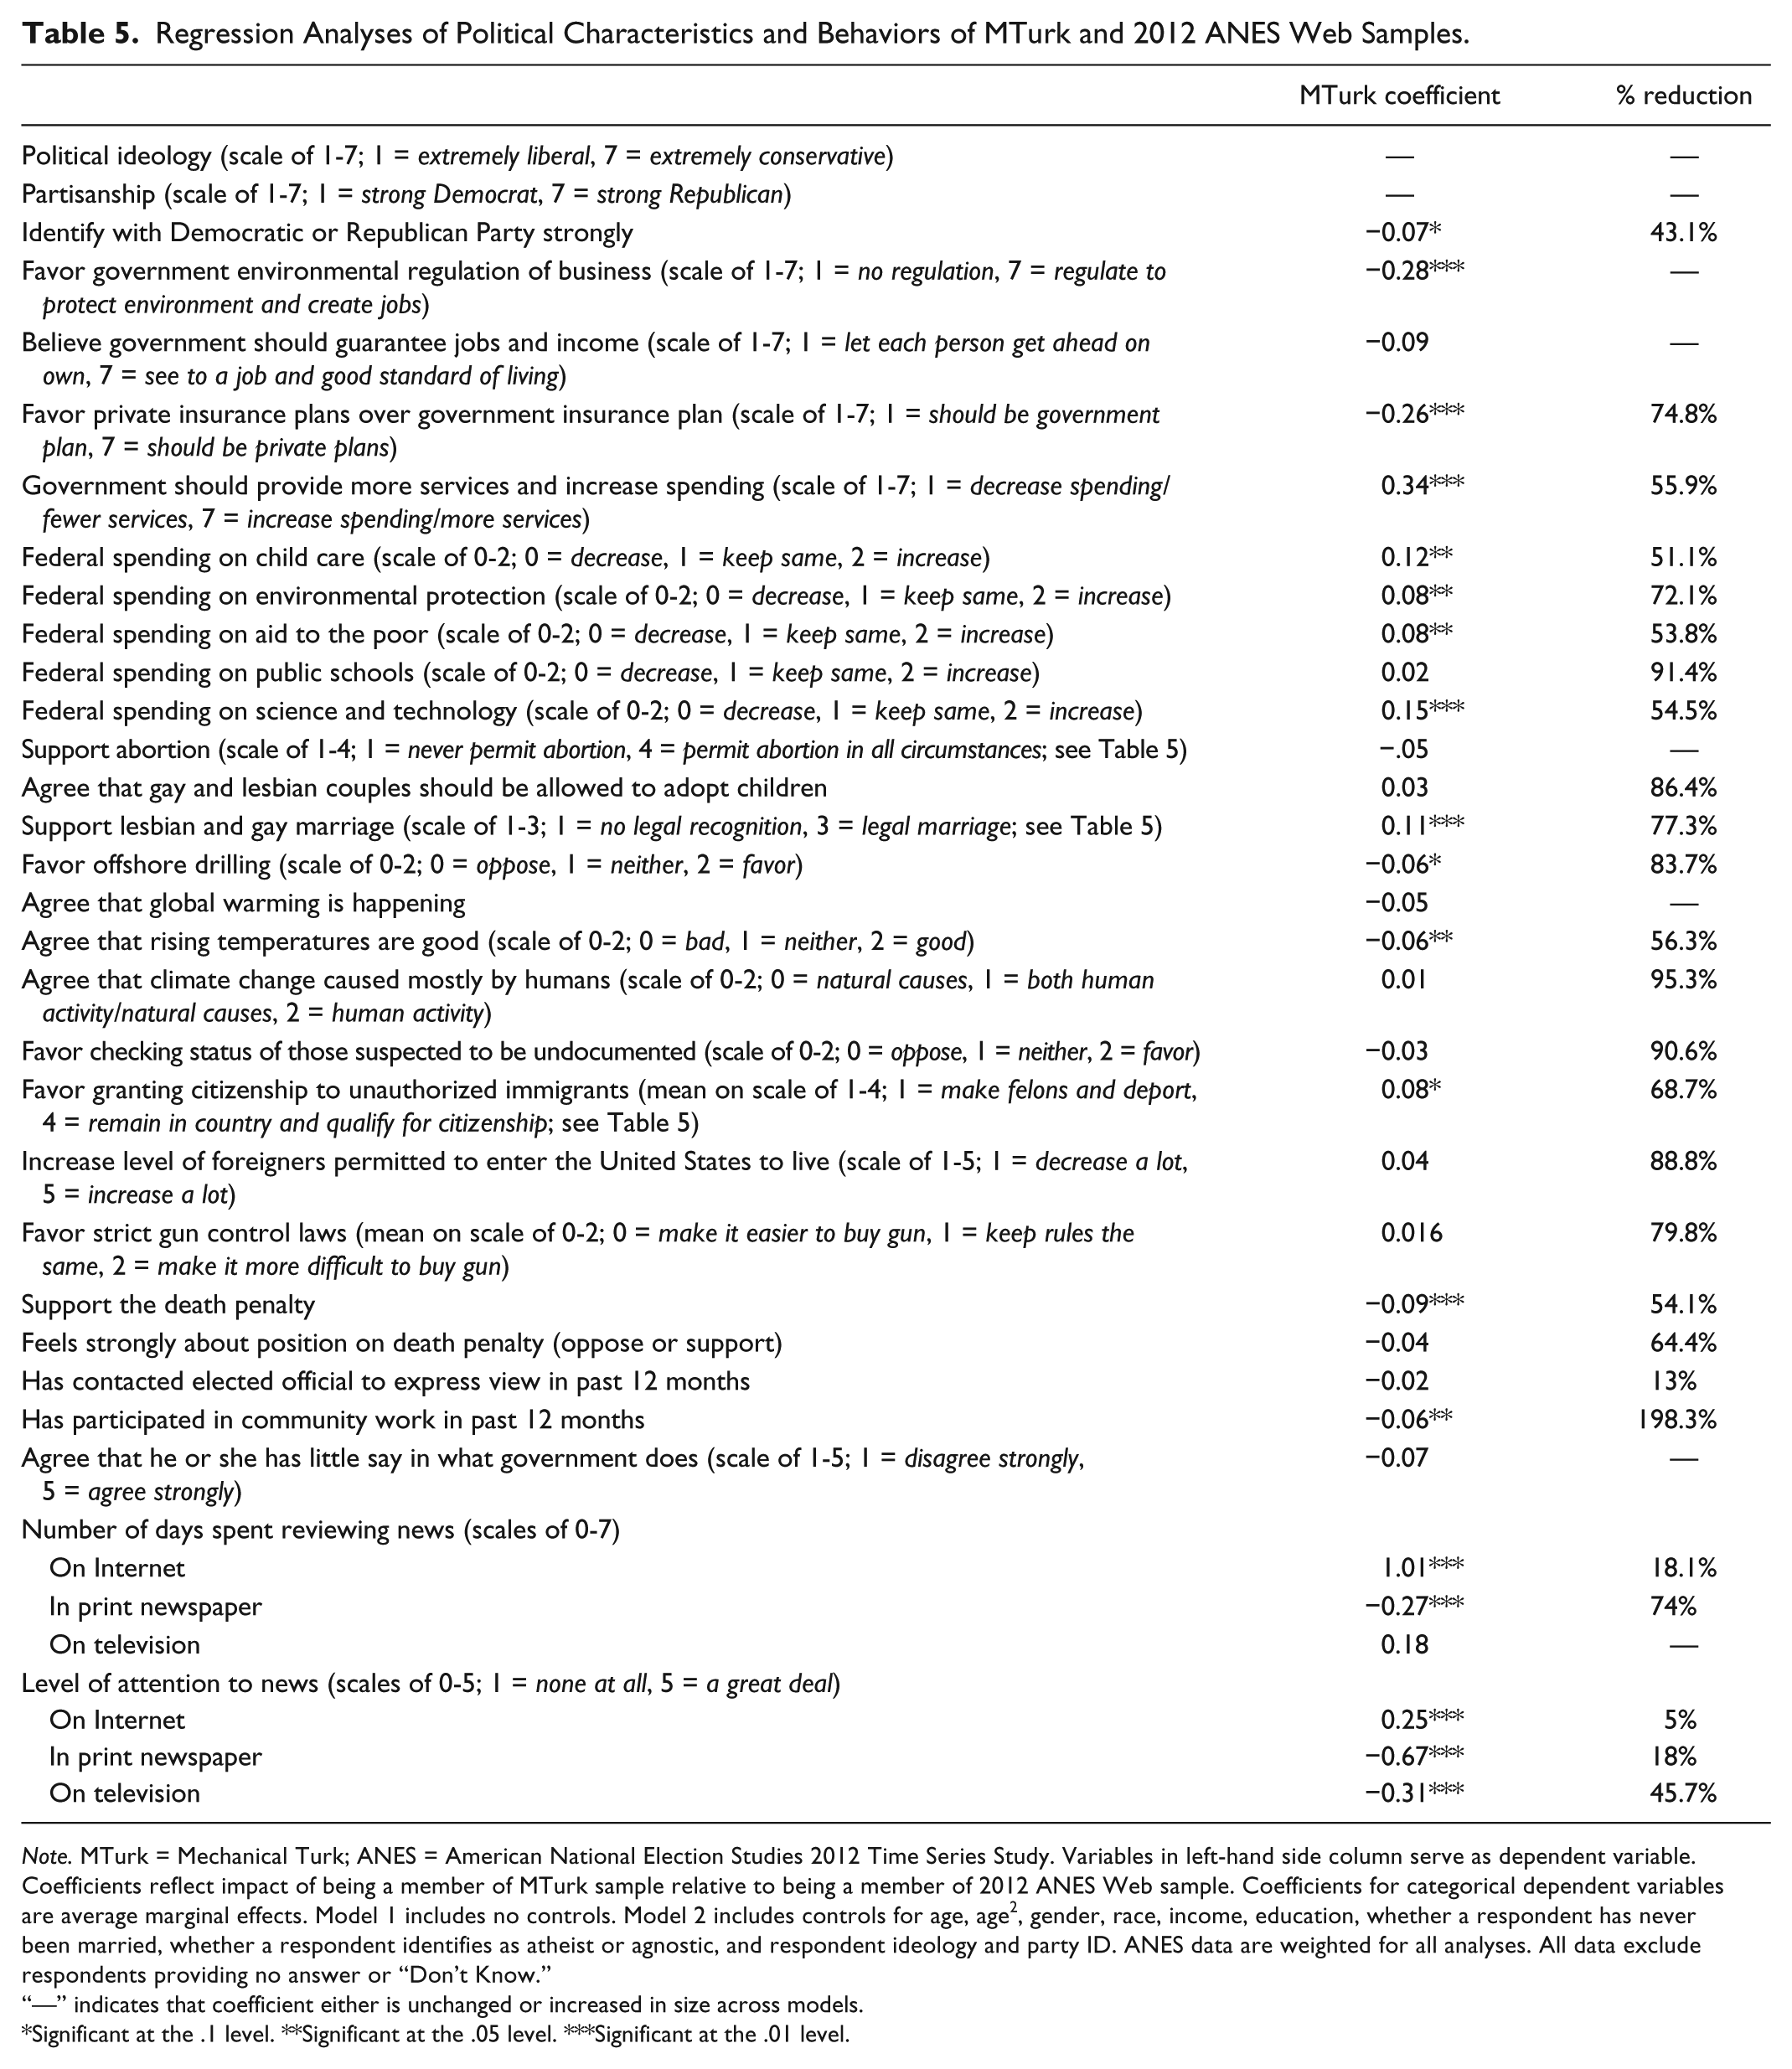
We next reconsider differences in the political attitudes and behaviors presented in Tables 2 and 3. We run regression models for each variable, now adding nine covariates: age, age, 2 gender, race and ethnicity, income, education, whether a respondent has never been married, whether a respondent identifies as atheist or agnostic, political ideology, and partisanship (the latter two are excluded when each is an outcome variable).
The results in Table 5 show that, as with socio-demographic variables, being an MTurk respondent remains statistically significant for most of the variables, 25 of 39. Nevertheless, the size of the coefficients is also reduced considerably across the models for nearly every variable, except for the number of days an individual spends gathering news from the Internet during a typical week. Even when statistically important, both the relative substantive impact of being an MTurk respondent is much smaller than other variables and these other variables predict outcomes in expected ways. For example, while statistically significant, an MTurk respondent is only 0.25 points more supportive of government insurance than an ANES respondent on a scale of 1 to 7, a small increase not only by itself, but also compared with the impact of other variables on such support, such as ideology (see the appendix). There are only a few notable exceptions to this pattern, such as death penalty attitudes and Internet news consumption. Overall then, as with our analysis of demographics, MTurk respondents do not appear to fundamentally differ (in terms of the substantive size of the effect) on political variables once we control for just a handful of variables, particularly ideology and partisanship. 10
Regression Analyses of Political Characteristics and Behaviors of MTurk and 2012 ANES Web Samples.
Note. MTurk = Mechanical Turk; ANES = American National Election Studies 2012 Time Series Study. Variables in left-hand side column serve as dependent variable. Coefficients reflect impact of being a member of MTurk sample relative to being a member of 2012 ANES Web sample. Coefficients for categorical dependent variables are average marginal effects. Model 1 includes no controls. Model 2 includes controls for age, age2, gender, race, income, education, whether a respondent has never been married, whether a respondent identifies as atheist or agnostic, and respondent ideology and party ID. ANES data are weighted for all analyses. All data exclude respondents providing no answer or “Don’t Know.”
“—” indicates that coefficient either is unchanged or increased in size across models.
Significant at the .1 level. **Significant at the .05 level. ***Significant at the .01 level.
To summarize, our samples differ in ways that are similar to previous work, though not exactly. In line with past work, for example, our MTurk sample is much younger, less racially and ethnically diverse, and more liberal and Democratic than the ANES Internet sample. However, the sample differs less or differently from previous work when it comes to gender and organized religion. We also identified other less well-explored, though expected differences, namely, attitudes on a number of different political issues and policies. As important, we showed that the importance of being an MTurk respondent is reduced in most instances and negligible in many when controlling for relatively few, broad, and relevant factors. In other words, the MTurk sample differs from the ANES sample but this is explained fairly well by measurable differences.
Conclusion
Amazon’s MTurk allows researchers to recruit large samples quickly at low cost. In turn, its presence among many types of behavioral science research has rapidly expanded (Bohannon, 2011). However, the relative representativeness of MTurk samples raises some concerns over inferences based on MTurk data, at least compared with those based on data from population-based samples, namely, generalizability (see Berinsky et al., 2012).
We sought to update and extend our knowledge of MTurk samples by comparing an MTurk sample with a nationally representative one on a large range of demographic and political variables. Our samples differed on variables in similar ways as in past work, but also some not included in extant scholarship. More importantly, these differences are significantly reduced when accounting for nine broad, measurable features by which MTurk samples differ starkly: age, gender, race and ethnicity, income, education, marital status, religion, ideology, and partisanship. Importantly, this set of variables is slightly broader than that most commonly identified as most consequential (e.g., age and ideology).
As a whole, these results imply that observational researchers of public opinion can profitably use MTurk, as long as they measure at least the nine covariates we identify. Doing so will allow for the development of sample weights commonly employed when using other types of opt-in samples. As Callegaro et al. (2014) explain, those who use non-probability samples (e.g., opt-in) “argue that the bias in samples . . . can be reduced through the use of auxiliary variables that make the results representative. These adjustments can be made with . . . [w]eight adjustments [using] a set of variables that have been measured in the survey” (p. 13). What we have done, then, is identified those variables that allow observational researchers to weight data from MTurk and reduce potential biases.
Still, measuring the covariates identified here is not a universal, foolproof solution for observational researchers interested in using MTurk. We employed a particular recruitment method and while broad in approach, nevertheless explored particular variables. Moreover, differences remain, however negligible, and some can apparently be inconsistent. Taken together, this suggests that additional covariates are more or less important to include depending upon the question at hand and the timing of sampling.
Our results are also useful for experimentalists of public opinion concerned with treatment effects that are expected to differ by particular characteristics. While the representativeness of MTurk does not threaten experimental inferences in most cases (e.g., Mullinix et al., 2015), one might nevertheless misestimate treatment effects if groups who are expected to respond to an experimental treatment differently than others are underrepresented and/or differ in unmeasurable ways from others like them who are not included in the sample. Importantly, however, we find not only that the impact of being an MTurk respondent is reduced when controlling for other factors, but also that these factors behave in expected ways. While not definitive by any means, this provides at least some evidence that even while underrepresented, individuals belonging to groups who opt into being an MTurk worker that are underrepresented might not differ all that much from those who do not. As such, researchers can proceed with some confidence that increasing the number of people with a given characteristic in their sample might be sufficient for properly estimating treatment effects across or among those individuals. In any case, researchers should always analyze and situate findings in the context of their sample, both in process and composition.
With the above in mind, as highlighted by others (e.g., Huff & Tingley, 2015), a promising approach for researchers concerned with representativeness or with specific sample needs is to employ software and sampling procedures aimed at creating larger and/or targeted survey pools. While varying in the type and amount of resources required, programs developed by researchers and other programmers, such as MTurk R (see Leeper, 2013) and TurkPrime, as well as implementing multiple demographic surveys on MTurk with unique samples of workers, readily provide a means of creating samples with more diverse and/or specific demographic and political characteristics. Thus, depending upon researchers’ needs, these methods can be usefully leveraged to address potential sampling issues introduced by using MTurk.
To be sure, we reiterate that MTurk does not provide a substitute for population-based samples; indeed, as mentioned, even with our set of covariates, sample differences remained. However, with proper care and measurement approaches, researchers can use it to adequately build research programs. Our identification of key sources of sample differences offers a blueprint for what scholars can do in using MTurk and in turn, maximize the likelihood that they can draw useful inferences from MTurk. In sum, as with any source of data, to get the most out of MTurk, researchers should critically examine their sampling strategy and composition in relation to their expectations and the question at hand.
Footnotes
Appendix
Models of Support For Government Regulation of Business.

| Model 1 | Model 2 | Model 3 | Model 4 | Model 5 | Model 6 | Model 7 | Model 8 | Model 9 | Model 10 | |
|---|---|---|---|---|---|---|---|---|---|---|
| Favor government environmental regulation of business (scale of 1-7; 1 = no regulation, 7 = regulate to protect environment and create jobs) | 0.41*** | 0.42*** | 0.25** | 0.21** | 0.18* | 0.23** | 0.03 | 0.01 | −0.24*** | −0.28*** |
Note. Variable in left-hand side column serves as dependent variable. Coefficients reflect impact of being a member of MTurk sample relative to being a member of 2012 ANES Web sample. Model 1 includes no controls. Model 2 includes a control for gender. Model 3 includes controls for gender, age, and age2. Model 4 includes controls for gender, age, age2, and education. Model 5 includes controls for gender, age, age2, education, and income. Model 6 includes controls for gender, age, age2, education, income, and race. Model 7 includes controls for gender, age, age2, education, income, race, whether a respondent identifies as atheist, and whether a respondent identifies as agnostic. Model 8 includes controls for gender, age, age2, education, income, race, whether a respondent identifies as atheist, whether a respondent identifies as agnostic, and whether a respondent reports having never been married. Model 9 includes controls for gender, age, age2, education, income, race, whether a respondent identifies as atheist, whether a respondent identifies as agnostic, whether a respondent reports having never been married, and respondent ideology. Model 10 includes controls for gender, age, age2, education, income, race, whether a respondent identifies as atheist, whether a respondent identifies as agnostic, whether a respondent reports having never been married, and respondent ideology and party ID. ANES data are weighted for all analyses. All data exclude respondents providing no answer or “Don’t Know.”
Significant at the .1 level. **Significant at the .05 level. ***Significant at the .01 level.
Declaration of Conflicting Interests
The author(s) declared no potential conflicts of interest with respect to the research, authorship, and/or publication of this article.
Funding
The author(s) disclosed receipt of the following financial support for the research and/or authorship of this article: The authors acknowledge support from a National Science Foundation grant for Time-Sharing Experiments in the Social Sciences (SES-1227179).