
Abstract
Studies of Latinx–white residential segregation and of Latinx residential attainment consistently report findings consistent with spatial assimilation. Nevertheless, most studies of this theory use statistical models that cannot account for multiple dimensions of neighborhoods that may influence residential attainment. In this article, we test predictions of the spatial assimilation model using discrete choice analyses, a multidimensional model. We use data from the National Educational Longitudinal Study on the residential attainment of 1,080 Latinx young adults, most of whom have recently left their parents’ homes. After accounting for the multiple dimensions of neighborhoods, we find little evidence that assimilation from income, generation, or barrio background influences young adult residential attainment. The consequences of language assimilation are modest. However, we find that Latinx young adults with a bachelor’s degree live in “whiter” and “less Latinx” neighborhoods than those without a BA net of these multiple dimensions. The findings suggest that increased assimilation among Latinx young adults is unlikely to improve their residential attainment unless it specifically includes greater education.
Racial and ethnic residential segregation reduces interracial contact and unequally distributes resources, producing racial and ethnic gaps in important life outcomes, such as health and education. Researchers find that Latinx–white segregation is not as high as black–white segregation, but black–white segregation has slightly declined and Latinx–white segregation has slightly risen, especially where the Latinx population has grown (Logan 2013; Massey and Tannen 2018). Since Latinxs are now the largest subordinated racial and ethnic group in the United States, more needs to be done to identify the causes of Latinx–white segregation.
Background
One approach to understanding residential segregation is to look at residential attainment—the residential location of individuals with respect to measures of neighborhood quality. In the study of Latinx residential attainment, many researchers use the spatial assimilation model because Latinxs vary extensively on the key elements of individual assimilation: generation, language, social integration, income, and education. The theory predicts that as Latinxs become more assimilated, they become (1) less likely to move to predominately Latinx neighborhoods and (2) more likely to move to predominantly white neighborhoods.
While many studies have found support for one or both of these predictions (Iceland and Wilkes 2006; Lichter et al. 2010; Massey 1985; Pais, South, and Crowder 2012; South, Crowder, and Chavez 2005), the predictions have not been tested while accounting for multiple dimensions of neighborhoods that may also influence residential attainment. It may be that the different residential attainments of more- and less-assimilated Latinxs result merely from differences in the neighborhood options available to them and not to their level of assimilation. We test this possibility using discrete choice analysis (DCA). McFadden (1978) was among the first to use these models to study residential attainment, and the models have become increasingly popular over time because they allow researchers to simultaneously consider the influence of more than one neighborhood dimension (Bruch and Mare 2012; Goldsmith, Pylman, and Veléz 2017; Quillian 2014, 2015).
In this particular study, we test these two predictions by looking at the current neighborhoods of a sample of Latinx young adults in the National Educational Longitudinal Study (NELS). Using a young sample illuminates mobility patterns well because mobility rates peak in the early and mid-20s as youth leave their parents’ homes and establish independent residency (Long 1988). Young adult residential attainment also exerts a powerful and lasting effect on residential attainment over the life course (South et al. 2016), indicating that it is worth studying in its own right.
We begin by explaining the basic tenets of the spatial assimilation model. Afterward, we review other theories of residential attainment, including place stratification, preferences, distance, housing prices, economic segregation, and perpetuation theory. We use these theories to identify the multiple dimensions of neighborhoods that influence residential attainment. We analyze the data with mixed logit models, a form of DCA that is relatively assumption free.
We find, as the spatial assimilation model predicts, that less culturally and socioeconomically assimilated Latinx young adults live in neighborhoods with relatively fewer whites and more Latinxs. But after we control for additional neighborhood dimensions, the differences between more- and less-assimilated Latinxs with respect to income, generation, and barrio background disappear and those from language mitigate considerably. However, we find robust differences by education level net of additional neighborhood dimensions. Latinxs with a bachelor’s degree (hereafter referred to as a BA) are less likely to live in predominantly Latinx neighborhoods and more likely to live in predominantly white neighborhoods, other things equal. The findings suggest that increased assimilation among Latinxs is unlikely to improve their residential attainment unless it specifically includes greater education.
Spatial Assimilation Model
The spatial assimilation model (Massey 1985) has roots in what is now called straight-line assimilation theory. Straight-line assimilation theory contends that immigrants, through processes of chain migration, shared culture, and hostility from the native-born, initially settle in ethnic enclaves to ease their transition to the United States. Over generations, most of the differences between the immigrating ethnic group and whites disappear. First, this occurs because immigrants strive to assimilate by learning English, adopting American customs, and moving up the socioeconomic ladder. Second, it occurs because the boundary between the ethnic group and whites shifts or changes so that the new ethnic group becomes white.
The first generation—immigrants who arrive as adults—remains culturally distinguishable over their lifetime. Immigrants who arrive as young children (the 1.5 generation) and children born in the United States to immigrant parents (the second generation) exceed their parents in education and income and become bilingual or English dominant. The third and later generations usually speak only English, have limited knowledge of the original culture, and have close interpersonal relationships with whites.
In this study, we examine the predictions of the spatial assimilation model as they pertain specifically to the racial and ethnic composition of neighborhoods. The spatial assimilation model predicts that as members of the ethnic group culturally, economically, and socially assimilate, they migrate to neighborhoods with relatively fewer coethnics and relatively more whites. Some research extends the spatial assimilation model by examining if more-assimilated individuals integrate into nonpoor neighborhoods or neighborhoods with higher median incomes (for example, South and Pais 2008). In this article, we limit the analyses of the spatial assimilation model to its predictions about the racial and ethnic composition of neighborhoods. We control for the economic composition of neighborhoods rather than use it to make additional predictions from the spatial assimilation model.
Researchers investigate the spatial assimilation model at macro and micro levels. Iceland and Wilkes (2006), for example, examine levels of Latinx–white segregation in metropolitan areas using data on tracts from the 2000 Census. Consistent with the model, they find that among Latinxs age 25 or older, the dissimilarity index measuring segregation from whites averages 0.62 across metropolitan areas for Latinxs without a high school diploma and 0.36 for those with a BA or higher. Research at the micro level usually examines the model by testing whether or not individual-level measures of assimilation (e.g., language, generation, education, and income) can predict the racial composition of movers’ destination neighborhoods. For example, South and colleagues (2005) regress neighborhood percentage white onto various measures of individual assimilation. They find that for every year of education, Latinxs move to neighborhoods where the percentage white is 0.86 percentage points higher, other things equal. They also find that income and English fluency positively associate with the percentage white in destination neighborhoods.
Despite empirical support, the theory’s applicability to the Latinx population is questionable. Tienda and Fuentes (2014:415) state that there is “extensive evidence from the residential segregation literature supporting the premises of spatial assimilation for Latinos,” but they argue that recent trends suggest a weakening of spatial assimilation and a strengthening of racialization. In our view, existing macro and micro approaches show that Latinx assimilation associates with less metropolitan segregation and more movement into “less brown” and “whiter” neighborhoods, but we question whether or not this integration results from individual-level assimilation. The contribution of this study is to compare the residential attainment achieved by more- and less-assimilated Latinxs, controlling for other dimensions of neighborhoods that affect residential attainment. Since the spatial assimilation model implies that individual-level differences in assimilation determine the propensity to move to “browner” or “whiter” neighborhoods, Latinx assimilation should influence residential attainment net of these controls. Based on the theory, we expect that as income, education, English fluency, social ties with whites, and generation increase, Latinxs will become more likely to move to a neighborhood as its percentage white increases and its percentage Latinx decreases, other things equal. Our review of research also suggests that educational attainment may matter more than other characteristics of assimilation (Crowell and Fossett 2017; Iceland and Wilkes 2006; South et al. 2005). Next, we discuss additional theories of residential attainment to identify additional dimensions of neighborhoods that may account for residential attainment.
The Place Stratification Model
The place stratification model argues that whites will use a range of discriminatory tactics to limit the residential integration of Latinxs into “white” neighborhoods. These tactics include discriminatory behavior from real estate agents, mortgage lenders, landlords, and banks (Pais et al. 2012) as well as intimidation from police and vigilantes (Herman 2005). This theory emphasizes racial processes of whites treating Latinxs as a monolithic group. As such, it predicts that all Latinxs, not just those who are less assimilated, will move to neighborhoods with relatively few whites and many Latinxs.
Preferences for Neighborhood Racial Compositions
Some research shows that racial and ethnic differences in preferences for neighborhood racial compositions play an important role in creating residential segregation in metropolitan areas (Fossett 2006). Theories of preferences maintain that racial group identities associate with neighborhood selection such that individuals prefer in-group neighbors to out-group neighbors. Survey research suggests that Latinxs generally prefer neighborhoods between 40 and 60 percent Latinx (Charles 2000). These preferences imply an inverted U-shaped relationship where Latinxs will become more and then less likely to move to a neighborhood as its percentage Latinx increases, with the peak likelihood occurring when neighborhoods are about 50 percent Latinx.
Distance
Many residential moves cover short distances, and the distance of a neighborhood from a mover’s previous residence is among the best predictors of movers’ destination neighborhood (Goldsmith et al. 2017; Quillian 2014). Movers are likely to select nearby neighborhoods because they have spent time in them and they know people living there (Krysan and Crowder 2017). There may also be an intergenerational inheritance of place (Sharkey 2013), which implies that young adults will often move to a neighborhood nearby the one in which they grew up. If more-assimilated Latinxs tend to grow up near neighborhoods with relatively few Latinxs and relatively many whites, then they will often move to these neighborhoods because they are nearby, not because they individually assimilate. If assimilation matters, we should observe its effects net of distance.
Housing Price and Income Segregation
In general, housing prices are lower in predominantly Latinx neighborhoods and higher in predominantly white neighborhoods (Cutler, Glaeser, and Vigdor 1999). Since Latinxs generally have low incomes, it is possible that they move to neighborhoods with many coethnics because these neighborhoods are simply more affordable. Since the spatial assimilation model predicts that more-assimilated Latinxs (including those with higher income) will move to neighborhoods with relatively more whites than their less assimilated coethnics, we control for neighborhood housing prices.
Income segregation is an uneven geographic distribution of income groups within a metropolitan area (Bischoff and Reardon 2014). It is created, in part, by people moving to neighborhoods where their income is similar to that of the current residents. In addition, there is likely to be a general aversion to high-poverty neighborhoods and a general preference (when not stymied by discrimination) for selecting neighborhoods with greater affluence. While research with a unidimensional model often has difficulty separating mobility patterns related to neighborhoods’ racial and class components, the two dimensions can be separated and examined independently in DCA models (Quillian 2015), allowing us to estimate the extent of spatial assimilation net of mobility patterns associated with economic segregation.
Perpetuation Theory
Perpetuation theory maintains that individuals tend to be in similar racial contexts across institutions (neighborhoods, schools, churches, and so on) and over the life course (Braddock 1980). Recent research shows a powerful and perhaps causal relationship between the racial and ethnic compositions that adolescents experience in their neighborhoods and schools and the same thing in their adult neighborhoods and workplaces (Gamoran, Collares, and Barfels 2016; Goldsmith 2016; Goldsmith et al. 2017; Stearns 2010). Perpetuation theory posits three mechanisms to explain this relationship (Goldsmith 2016). First, individuals may develop more tolerance toward the racial and ethnic groups they have more contact with. Second, rules for behavior vary across institutions with different racial and ethnic compositions, not only in general but also for people with particular identities, and navigating them requires specific tool kits. These tool kits may not reduce discrimination, but they will lead people toward contexts where their tools work. Third, different racial and ethnic compositions influence the diversity of an individual’s social ties, and these ties influence where people live and work. Perpetuation theory predicts that the racial and ethnic compositions of youth will affect all people in those contexts regardless of their individual level of assimilation. We use perpetuation theory to predict that young adults will move to neighborhoods that have a similar percentage of whites as the neighborhoods and schools of their youth.
Method
Data
Data for this study come from the restricted version of the NELS and file 3B of both the 1990 and 2000 decennial censuses. The NELS contains longitudinal data on eighth graders in 1988 with follow-ups when the subjects are about 16, 18, 20, and 26 years old. The benefits of these data are that 80 percent of the respondents have recently moved by leaving their parents’ homes and establishing independent residences. In addition, the data contain information on Latinxs’ family, school, and neighborhood backgrounds. We use multiple imputations (m = 6) to impute missing data and have an analytic sample of 1,080 Latinxs (all sample sizes are rounded to the tens place). 1
We limit our sample to respondents who live in a metropolitan statistical area (MSA) in the final panel (year 2000), whether or not they grew up in the same MSA or still live with their parents. If we exclude intermetropolitan movers, we may eliminate many relatively assimilated Latinxs. If we eliminate respondents living with their parents, we may eliminate many unassimilated Latinxs. According to Britton (2013), relatively more Latinx immigrants (31.7 percent) than nonimmigrants (19.8 percent) remain with their parents at this age. Since the purpose of the study is to determine how much spatial assimilation can be explained by other neighborhood dimensions of residential attainment, including sample members who live with their parents and who make intermetropolitan moves will help ensure we do not underestimate spatial assimilation. Of course, we recognize that these and other choices may influence the substantive findings. At the end of the Results section and in the appendix, we explain the results from alternative models.
Like other researchers (Ainsworth 2002), we link the NELS data to the U.S. Census using respondents’ residential five-digit zip code tabulation areas (ZCTAs), which are the smallest aggregation unit available. It is likely that ZCTAs can capture important dimensions of neighborhood racial composition because they are constructed to ease mail delivery. To help mail carriers, ZCTA zones tend to follow barriers, like rivers, freeways, railroad tracks, and dead-end streets. These physical barriers often delineate racially distinct neighborhoods, as well (Grannis 1998). The 1990 Census provides contextual data on respondents’ ZCTAs for the 1988, 1990, and 1992 panels. The 2000 Census provides them for 2000.
Table 1 describes the level of assimilation in the sample. Of the 1,080 Latinx respondents in our sample (all sample sizes rounded to the tens place), 20 percent have earned a BA or more education. A full 66 percent grew up in Spanish-speaking homes; 33 percent grew up in predominantly Latinx ZCTAs or attended predominantly Latinx schools, which we call “barrio background”; and 61 percent are classified as second generation, which is defined as having one or more immigrant parents. The entire sample has been in the United States at least since eighth grade, so the second generation will include a few 1.5-generation children but no immigrants who arrived as adults. We measure the respondents’ income as a natural log so that its effects correspond to the central tendency rather than to high-income earners. The average of the natural log of income is 9.2, which is about $9,900.
Descriptive Statistics for Measures of Assimilation.
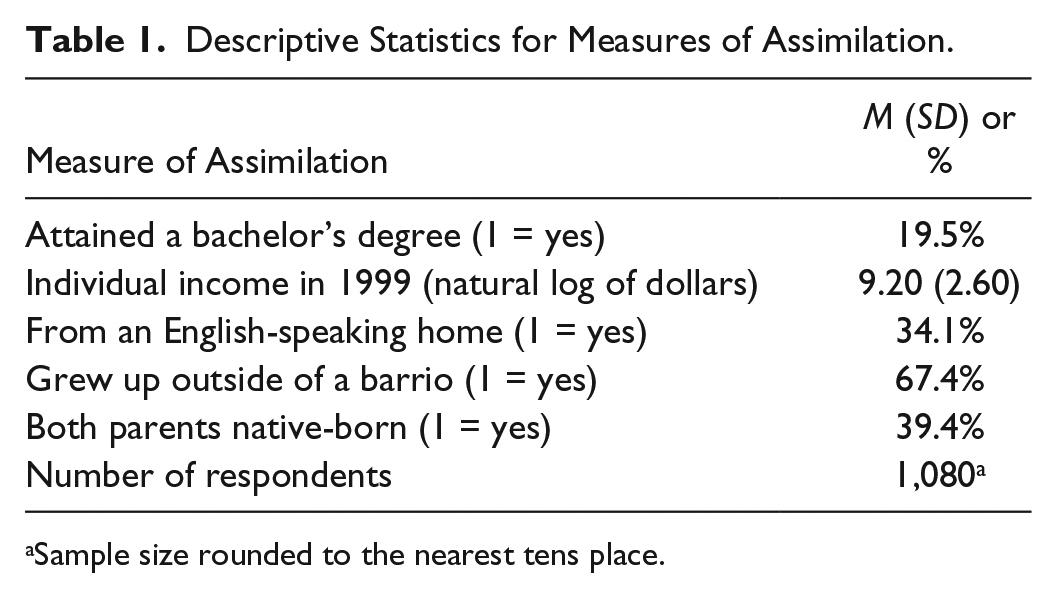
Sample size rounded to the nearest tens place.
DCA
DCA (Train 2003) is a family of models that estimate the probability of picking one outcome from a set of mutually exclusive, exhaustive, and finite set of options. We use the models to estimate the probability of Latinx young adults living in each neighborhood in their current MSA (at age 26) given characteristics (a) of the neighborhoods in the MSA and (b) of combinations of individuals and neighborhoods. As explained in the appendix, DCA models allow researchers to examine multiple characteristics of neighborhoods and to better control for differences in neighborhood options (Goldsmith et al. 2017; Quillian 2014). They also allow researchers to include spatial characteristics of neighborhoods (e.g., distance from origin neighborhood) and to estimate curvilinear effects of neighborhood characteristics.
The “choice set” in our models are all of the ZCTAs in each person’s current MSA, which sum to 144,290 options spread across 150 MSAs. On average, each MSA has 988.3 ZCTAs, and the median household units per ZCTA is 9,185. Conceptually, DCA compares the neighborhoods that individuals live in to the ones in their choice set that they do not live in. Because individual characteristics are constant with respect to an individual’s neighborhood options, individual characteristics can be entered into the model only in combination with neighborhood characteristics (for example, as interactions). In the appendix, we compare the neighborhoods in which Latinx respondents do and do not live in using descriptive statistics.
Our formal description of DCA is based on Train (2003). Let n = 1 . . . N Latinx young adults who can move to j = 1 . . . J potential neighborhoods in their current MSA. If we assume that, given their structural constraints, they maximize utility (U) in their choice of neighborhoods, then Unj = βXnj + ε nj , where Xnj and ε nj are observed and unobserved factors affecting utility, respectively. This model can be estimated as a conditional logit by assuming that ε nj is an independent and identically distributed (iid) extreme value. Setting ynj = 1 if individual n moves to neighborhood j and = 0 otherwise, the conditional logit is

However, the conditional logit estimates fixed effects for all parameters. If individuals vary in how much they value neighborhood characteristics, the conditional logit will violate the iid assumption. 2 A mixed logit model allows some or all of the coefficients to vary across individuals by estimating β n , a vector of parameters for each individual. We tested for significant variation in all of the coefficients in preliminary models and found that only the coefficient for distance varied significantly. Hence, we estimate the coefficients for distance as a normal distribution and estimate fixed effects for all other coefficients. 3 Models are estimated in the SAS procedure multinomial discrete choice using Monte Carlo simulation with Halton quasirandom sequences.
To estimate the likelihood of living in a predominantly Latinx neighborhood, we include linear and squared terms for percentage Latinx because both of them are often significant. To test for spatial assimilation, we see if this likelihood varies between more- and less-assimilated Latinxs using interactions. In separate models, we see if more- and less-assimilated Latinxs vary in their likelihoods of moving to a neighborhood as its percentage white rises. We would like to test for spatial assimilation using the significance of the interaction terms, but the inclusion of four variables about percentage Latinx creates multicollinearity. This problem upwardly biases standard errors for the coefficients about percentage Latinx and makes their hypothesis tests too conservative. We overcome this problem by using tests of model fit. Even when multicollinearity is present, the difference in −2 log likelihoods (−2LLs) of nested models is distributed as a chi-square statistic with degrees of freedom equal to the difference in the number of parameters. In order to build uncertainty from the multiple imputations into the measure of model fit, we use the −2LLs to calculate the F test of model fit for data with multiple imputations proposed by Allison (2002:68). To test for spatial assimilation, we see if adding the interactions improves the model fit.
The magnitudes of the coefficients are log-odds ratios and can be converted into odds ratios by exponentiating them (Allison 2005). Under the assumption that individuals have no constraints on their choices (for example, that they have full information and that there is no discrimination), the coefficients can be interpreted as preferences (Train 2003). These assumptions are difficult to defend, so following Quillian (2014:20), we interpret the results as descriptions of the residential outcomes that result from both agency and constraints on this agency.
Results
Mixed Logit Models
The purpose of this study is to estimate the extent of spatial assimilation net of alternative explanations of residential attainment. To do this, we estimate models with limited controls to show that DCA models can identify what might be spatial assimilation. Next, we estimate models with the full set of controls to estimate the extent of spatial assimilation net of other neighborhood dimensions. We look at models designed to understand assimilation and leaving Latinx neighborhoods first and moving to white neighborhoods second. The coefficients from all of the models are in the appendix.
Assimilation and Not Moving to Latinx Neighborhoods
Table 2 shows model fit statistics for limited models at the top of the table and full models at the bottom of the table. All of the models include proportion Latinx and its square plus three variables about housing availability (number of housing units, vacancy rate, and vacancy rate squared). In the limited models, Model 1 contains only these variables to estimate a baseline for comparison. The spatial assimilation model predicts that as Latinxs become more assimilated, they will live in neighborhoods with a lower percentage Latinx. We test this prediction by adding interactions between proportion Latinx and each of the measures of assimilation one at a time in Models 2 through 6. If the model with interactions fits better than Model 1 (and the coefficients are in the expected direction), we conclude that the DCA models can detect spatial assimilation when there are limited controls included.
Statistics of Comparing the Fit of Models a with and without Interactions between Neighborhood Proportion Latinx and Levels of Assimilation and with Limited and Full Controls.
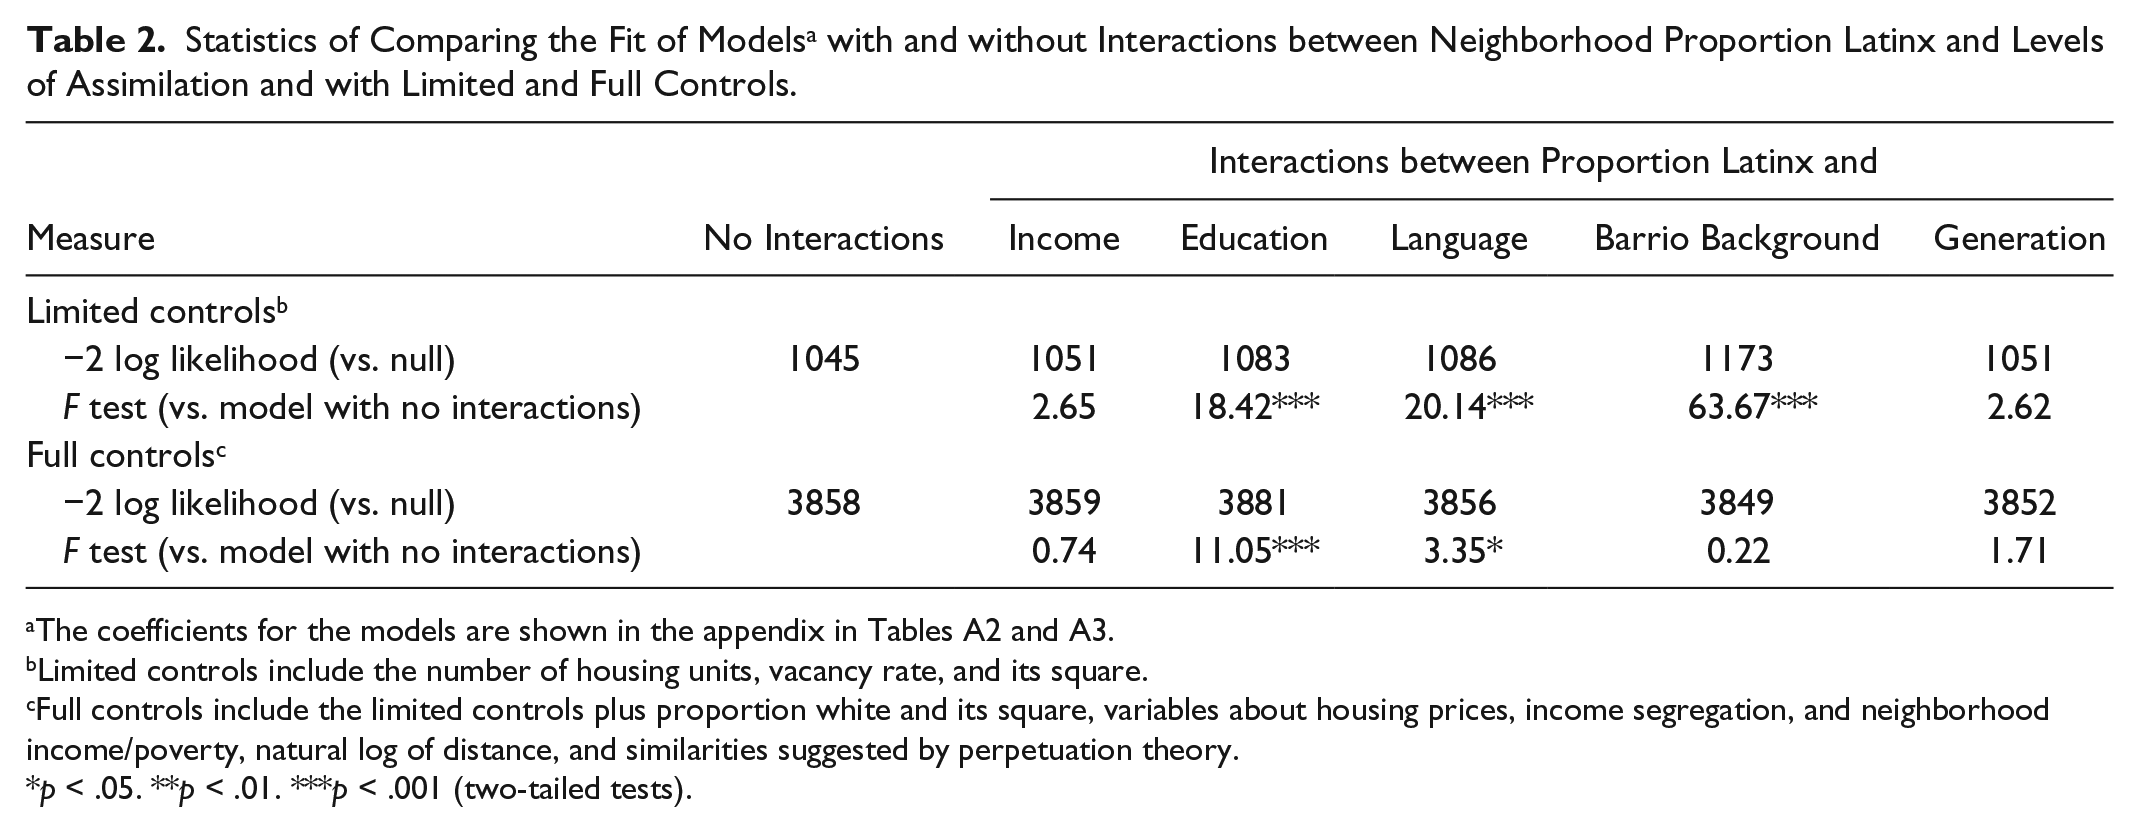
Limited controls include the number of housing units, vacancy rate, and its square.
Full controls include the limited controls plus proportion white and its square, variables about housing prices, income segregation, and neighborhood income/poverty, natural log of distance, and similarities suggested by perpetuation theory.
p < .05. **p < .01. ***p < .001 (two-tailed tests).
As shown in Table 2, the F tests show significantly improved model fit with the addition of interactions by education (18.42), language background (20.14), and barrio background (63.67) but not by income (2.65) and generation (2.62). The magnitudes of the coefficients can be viewed in Figure 1. It shows how the odds ratios change as proportion Latinx goes from 0 to 1. The y-axis is the odds of living in a neighborhood (at age 26) with a given percentage Latinx (on the x-axis) relative to the odds of living in a neighborhood with 0 percent Latinx. The odds ratios for “all Latinx” are estimated from Model 1 (because it includes no interactions). Their odds ratios increase with percentage Latinx until the percentage equals 78 and the odds ratio equals 16. 4 This means that Latinxs are 16 times more likely to live in a neighborhood that is 78 percent Latinx than one that is 0 percent Latinx. As percentage Latinx rises further, the odds ratios decline, but they remain high (9.97) even when percentage Latinx equals 100.
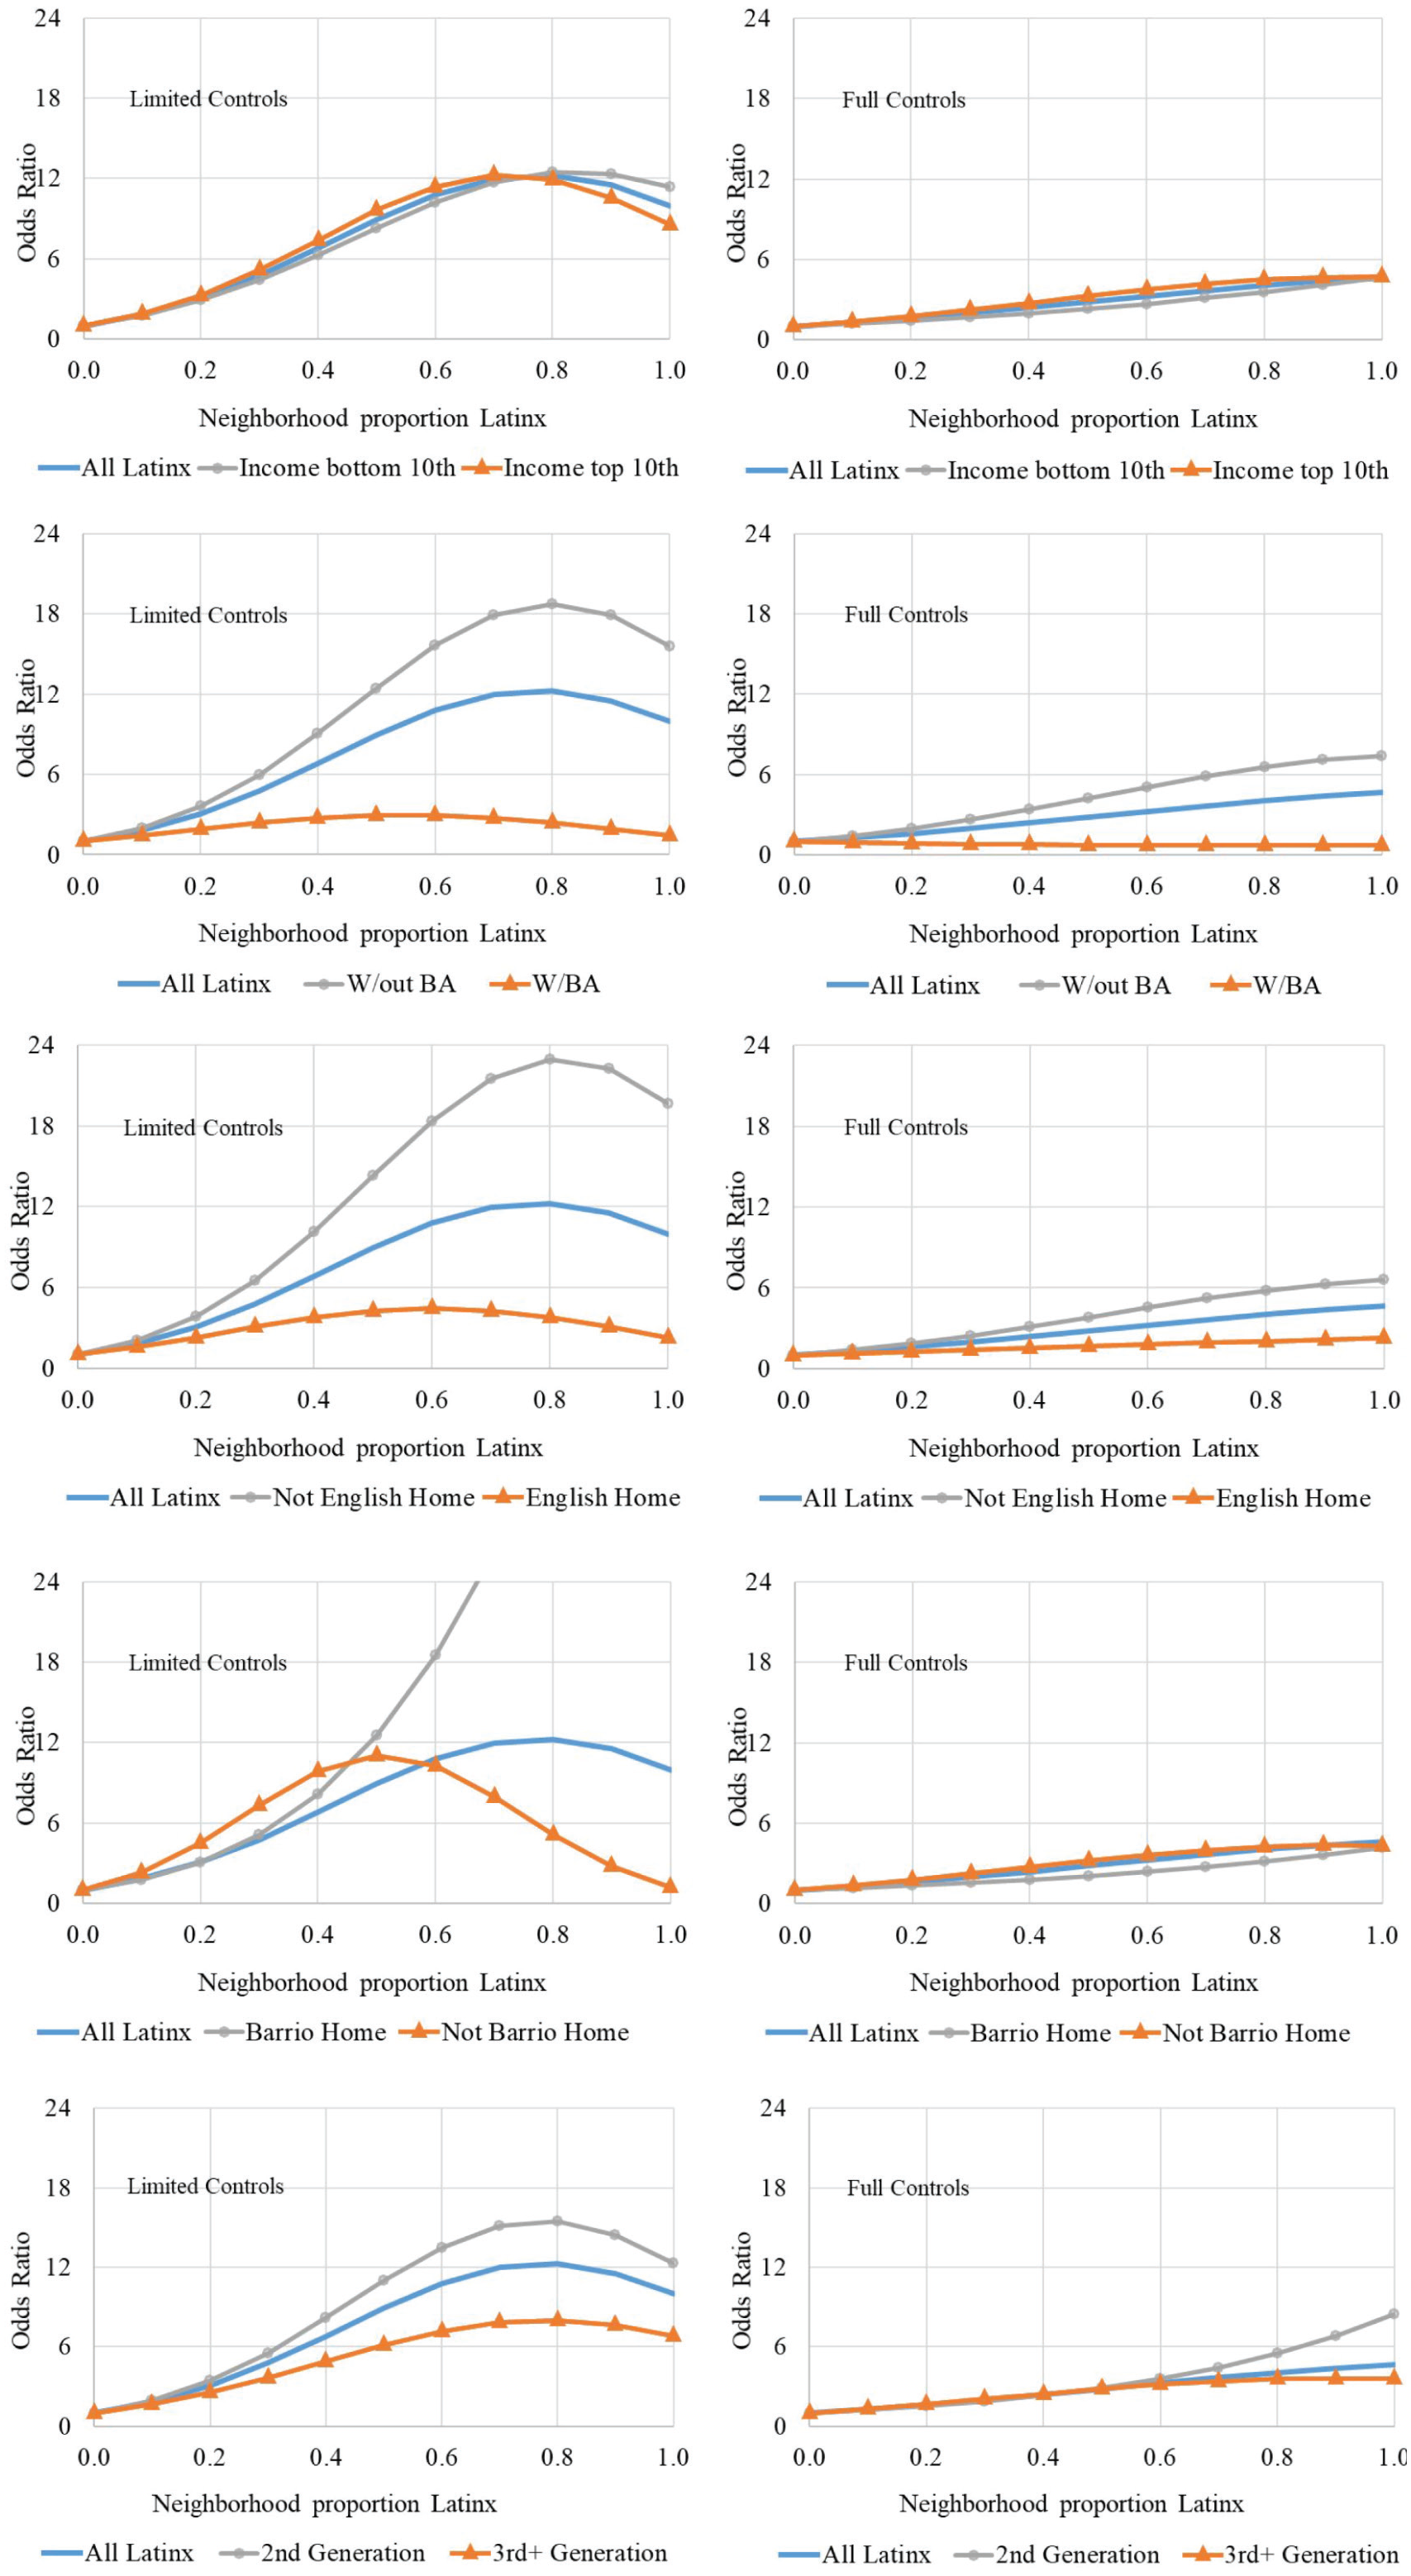
Odds ratios (y-axis) of the chances of moving into a neighborhood with a given proportion Latinx (x-axis) relative to the odds of living in a neighborhood with zero proportion Latinx by type of assimilation from models with limited and full controls.
In the scatterplot showing differences by income, the odds ratios for “all Latinx” is almost identical to the curves for high- and low-income earners (top 10th and bottom 10th in the sample). In contrast, the odds ratios differ by education level. For those without a BA, the inverted U-shaped curve peaks at 80 percent Latinx with an odds ratio of 18.8. When percentage Latinx equals 100, their odds ratio is 16.6. The curve for those with a BA is flatter. It peaks at 55 percent Latinx with an odds ratio of 2.99. It is slightly above 1 (1.46) when percentage Latinx equals 100.
The curves for English and Spanish background are similar to those for education. The curves peak at 82 and 66 percent with odds ratios of 23.0 and 4.5, respectively. For those with a barrio background, the curve rises rapidly and it peaks beyond 100 percent Latinx, which is outside of the range of the data. When proportion Latinx reaches 100, the odds ratio is 60. For those not from barrios, the curve peaks at 51 percent Latinx and an odds ratio of 11.7. It declines rapidly thereafter. The lines for the second and third-plus generations are in the expected direction, but as mentioned earlier, they are not significantly different from each other.
The robust results for the interactions by education, language, and barrio background indicate that DCA can detect what may be spatial assimilation. The null effects for income and generation are most likely the result of little spatial assimilation along these lines in this sample of Latinx young adults rather than an inability of DCA to spot it.
We now turn to the full models. Before discussing the results pertaining to spatial assimilation, we will briefly discuss the findings about the control variables. First, adding the control variables improves model fit substantially, as seen by the increase in the −2LLs from about 1050 to over 3850. The increase suggests that the multidimensional approach of DCA allows us to test for spatial assimilation under more stringent conditions that have not been previously investigated.
Most of this improvement in model fit results from adding distance (measured using ZCTA center points as the natural log of miles from where the individual lived when he or she was 18 years old), which is estimated as a distribution of coefficients. The mean of the distribution is negative (–1.24), indicating that Latinxs are relatively less likely to move to a neighborhood as its distance increases. The distribution has a significant standard deviation (0.53), indicating that staying near “home” is more important for some Latinxs than others. The model also shows that the coefficients for neighborhood’s proportion white and its square form an inverted U-shaped curve that peaks when percentage white is 43 percent with an odds ratio of 1.79. The odds go below 1 when percentage white reaches 86 percent. Since this relationship is net of other factors, and predominantly white neighborhoods are likely to be superior on unobserved characteristics, the negative effect of percentage white after 86 percent is consistent with the place stratification model and suggests racial discrimination.
The model also shows that Latinxs’ odds of living in a neighborhood rise as their income becomes more similar to the neighborhood’s (a) median rent and (b) median family income. Other variables about the economic characteristics of neighbors are not significant. 5 The control variables also show that Latinxs are overrepresented in neighborhoods that have a proportion white that is similar to the proportion white they had in their (a) adolescent and young adult schools and (b) adolescent residential neighborhoods, which is consistent with perpetuation theory.
Now we examine whether or not adding interactions between percentage Latinx and measures of assimilation improve the model fit in the full models. As seen in Table 2, the F tests show a robust effect for interactions with education (p < .001) but no significance for interactions with income, barrio background, language, or generation. Thus, one of five tests supports the spatial assimilation model.
Figure 1 displays the curves created by the coefficients in the full models in the right column. First, notice that all of the curves are much flatter in the full models than in the limited models, indicating that controlling for multiple dimensions of residential attainment partially “explains” Latinxs’ propensity to live in predominantly Latinx neighborhoods. The lines displaying interactions for income and barrio background are nearly on top of each other. The lines for generation and language differ by level of assimilation in the expected direction, but the differences are not significant.
The lines for Latinxs with and without a BA are significantly different from each other. For those without a BA, the odds of moving to a neighborhood rise over the entire range of percentage Latinx, reaching 7.4 when percentage Latinx equals 100. For those with a BA, the curve is flat over the entire range of percentage Latinx. Thus, we find that for Latinxs without a BA, their relative odds of moving to a neighborhood rise as its percentage Latinx rises; these odds do not rise (or fall) for Latinxs with a BA.
Assimilation and Moving into White Neighborhoods
The spatial assimilation model also predicts that as assimilation increases, Latinxs increasingly move to “whiter” neighborhoods. As before, we test this hypothesis by adding interactions between Latinx assimilation and neighborhood proportion white in models with limited and full controls.
In the limited models, the coefficients for the linear and quadratic forms of proportion white are positive and negative, respectively. These produce an inverted U-shaped curve, shown in Figure 2, that rises until proportion white equals 0.18 and then declines. The curve goes below 1 when proportion white gets to 0.36. When proportion white reaches 1, Latinxs’ odds of moving to the neighborhood are 1/8.6 times less than the odds of moving into a neighborhood with no whites. Thus, the odds of Latinx young adults living in predominantly white neighborhoods are relatively low.

Odds ratios (y-axis) of the chances of moving into a neighborhood with a given proportion white (x-axis) relative to the odds of living in a neighborhood with zero proportion white by type of assimilation from models with limited and full controls.
Do these odds vary by levels of assimilation? Table 3 shows the F tests. As seen there, the one for income is not significant (2.46), but the ones for education (12.27), language (21.31), barrio background (37.52), and generation (3.08) are. These findings, like the limited models about proportion Latinx described earlier, suggest that DCA is able to identify residential attainment consistent with spatial assimilation.
Statistics of Comparing the Fit of Models a with and without Interactions between Neighborhood Proportion White and Levels of Assimilation and with Limited and Full Controls.

Limited controls include the number of housing units, vacancy rate, and its square.
Full controls include the limited controls plus proportion white and its square; variables about housing prices, income segregation, and neighborhood income/poverty; natural log of distance; and similarities suggested by perpetuation theory.
p < .05. **p < .01. ***p < .001 (two-tailed tests).
As seen in Figure 2, the significant interactions are all in the expected direction. More-assimilated Latinxs are more likely to move to a neighborhood as its percentage white increases up until percentage white reaches 0.81, 0.73, and 0.69 for those with a BA, from English-speaking backgrounds, and not from barrios, respectively. After this point, even these more-assimilated Latinxs are less likely to move the neighborhood as its percentage white increases. For Latinxs without a BA and from Spanish-speaking backgrounds, the corresponding estimates at which they become less likely to enter the neighborhood are only 0.23 and 0.26, respectively, showing even less integration into white neighborhoods. For Latinxs from barrios, the effect is negative over the entire distribution. The differences by generation, although significant, are small except at the highest values of proportion white. 6
Now we examine the full models to test our hypotheses. The coefficients from all of the control variables are similar to their coefficients in the full models about percentage Latinx, which we discussed earlier. The one difference is that in those models, we controlled for neighborhood percentage white and its square to account for discriminatory barriers to Latinx integration. Here, since proportion white is our focus, we instead control for proportion Latinx and its square to account for in-group preferences.
As seen in Table 3, the F tests estimating the contributions of spatial assimilation are significant only for education (7.4). The estimated curve for Latinxs without a BA increases until proportion white equals 0.35 and then declines, falling below 1 when proportion Latinx equals 0.69. Thus, all else equal, Latinxs without a BA are less likely to live in predominantly white neighborhoods than in neighborhoods with no whites at all. For those with a BA, the odds ratio rises until proportion white reaches 0.60 with an odds ratio of 5.7. Afterward, Latinxs’ odds ratios decline rapidly to 2.7 when proportion white equals 1. Thus, other things equal, Latinxs with a BA show more integration into “whiter” neighborhoods than those without a BA, consistent with spatial assimilation.
What Creates the Appearance of Spatial Assimilation?
The limited models show evidence of spatial assimilation in 7 of 10 tests, with 6 of the tests being robust (that is, p values less than .001). When the full controls are added, 3 of the 10 tests support the predictions of the spatial assimilation model, with two of them robust. In this section, we examine which of the control variables explain the spatial assimilation observed in the limited models. To do this, we estimate models that add independent variables to the limited models, one type of explanation at a time. Next, we add the assimilation-by-group-proportion interactions to each model and check for improvement in model fit. We consider the explanatory impact of four types of explanations in this order: distance; either proportion white or proportion Latinx, whichever is the opposite of the focus of the model; housing prices and economic segregation; and the similarities predicted by perpetuation theory. The F tests at the top of Table 4 focus on proportion Latinx and the ones at the bottom on proportion white.
F Tests of the Contribution of Interactions between Assimilation and Neighborhood Proportion Latinx/White to Models That Add Additional Controls, One Type of Explanation at a Time.
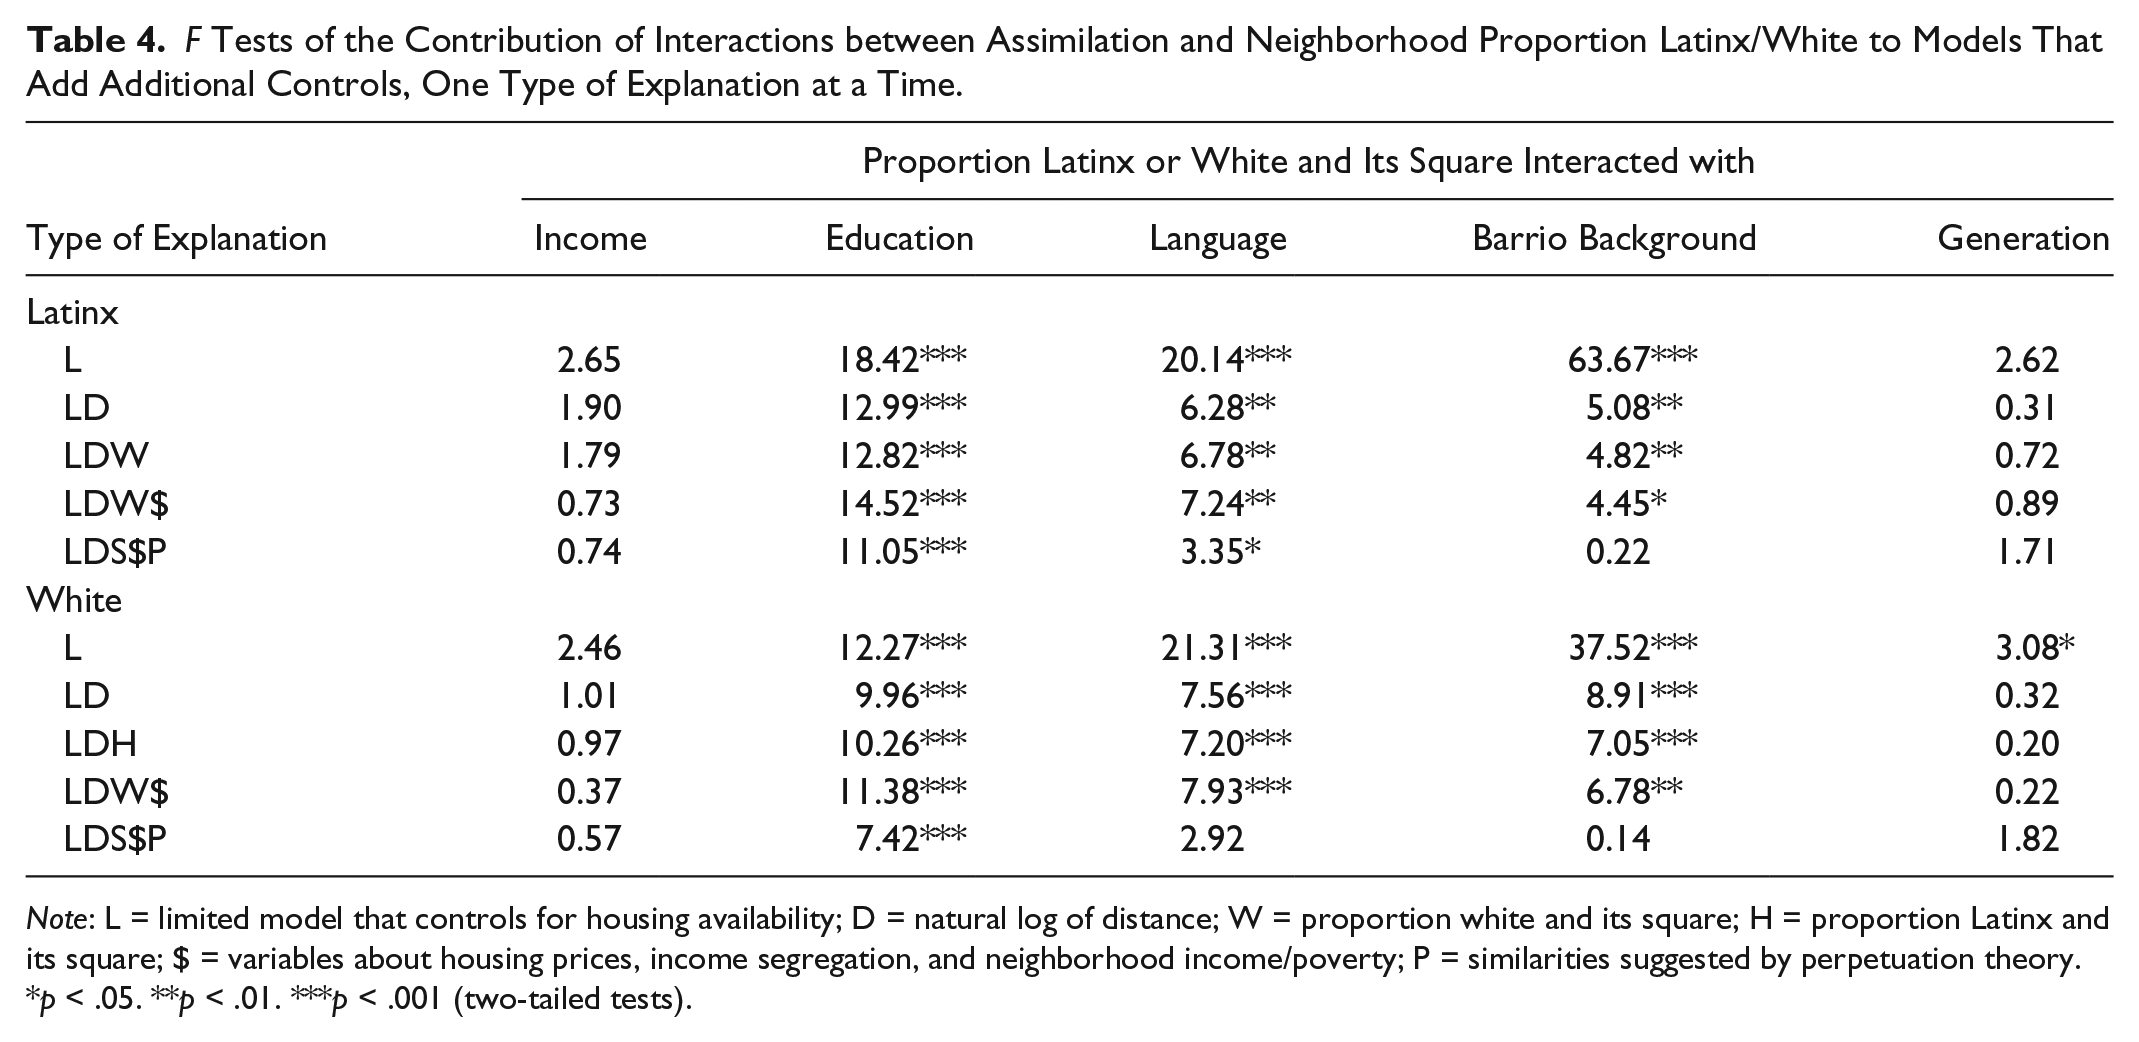
Note: L = limited model that controls for housing availability; D = natural log of distance; W = proportion white and its square; H = proportion Latinx and its square; $ = variables about housing prices, income segregation, and neighborhood income/poverty; P = similarities suggested by perpetuation theory.
p < .05. **p < .01. ***p < .001 (two-tailed tests).
The findings show that distance can explain much of what appears to be spatial assimilation. When distance is added, the F statistic for language declines from 20.14 to 6.28 (top) and from 21.31 to 7.56 (bottom). The F statistic declines even more for barrio background (63.67 to 5.08 and 37.52 to 8.91, respectively). Distance explains less of the F statistic for education (18.42 to 12.99 and 12.27 to 9.96). Since distance captures the tendency for Latinxs to live nearby where they grew up, the finding implies that the neighborhoods nearby where more- and less-assimilated Latinxs grew up are different. We examined this possibility by looking at neighborhoods within two miles of their origin. We find that the average percentage Latinx in these nearby neighborhoods is lower (34 percent) for those from English backgrounds than those from Spanish backgrounds (45 percent). For those from and not from barrio backgrounds, the difference is larger (31 and 66 percent, respectively), and for those without and with a BA, the difference is smaller (36 and 43 percent, respectively).
The contributions of the spatial assimilation model to model fit are relatively unchanged when proportion white and proportion Latinx are added in the top and bottom models, respectively. The economic dimensions of neighborhoods also explain little of the remaining spatial assimilation. When the similarities suggested by perpetuation theory are added, the contributions of the interactions with barrio background are no longer significant and the ones with language background become weaker, with the bottom one losing significance. Latinxs from barrio backgrounds (by definition) and Spanish-speaking homes tend to go to schools with relatively fewer whites than those not from barrio backgrounds and who come from English-speaking homes. When we hold constant the tendency to live in neighborhoods in adulthood with a percentage white like that of their adolescent schools and neighborhoods, spatial assimilation from barrio background and language background disappears. However, the contribution of spatial assimilation from education remains significant and is only modestly reduced by the inclusion of any of the control variables.
Alternative Model Specifications
We also estimated models that use different samples of Latinx respondents or different independent variables. The substantive findings from our two hypotheses tests (that is, the results from the full models) are not substantively altered except in regard to language. In the full models discussed earlier, adding interactions with language slightly improved model fit when we focused on percentage Latinx. In the models investigated in the appendix, the significance of these interactions is inconsistent, which we might expect when the effect is modest to begin with.
In addition, we find that the limited models show evidence consistent with spatial assimilation in all 10 tests when we limit the sample only to Mexicans. Previous research (South et al. 2005) has shown that indicators of assimilation are better predictors of residential attainment among Mexicans than among Cubans and Puerto Ricans. While we cannot make interethnic comparisons, the robust results for Mexicans in the limited models are consistent with past research. Further details are in the appendix.
Discussion
In this article, we test predictions from the spatial assimilation model using data on 1,080 Latinx respondents from the NELS and the decennial censuses of 1990 and 2000. The study improves our understanding of spatial assimilation because we analyze it while accounting for multiple dimensions of neighborhoods that influence residential attainment using mixed logit models. This is an important contribution because past attempts to test for spatial assimilation have held constant other characteristics of individuals, origin tracts, and metropolitan areas but not other characteristics of neighborhood options. Following the logic of the spatial assimilation model, we tested whether more-assimilated Latinxs move to “whiter” and “less Latinx” neighborhoods than less-assimilated Latinxs.
There are three important findings. First, when the controls for multiple dimensions of neighborhood options are limited to those about housing availability, we find residential attainment patterns consistent with spatial assimilation in 7 out of 10 tests. Six of the seven, those for education, language, and barrio background, are robust (p < .001). These findings are noteworthy because they show that DCA, like the macro and micro methods reviewed earlier, can detect residential attainment patters that look like spatial assimilation.
Second, we find that adding the full set of controls reduces support for spatial assimilation from 7 to 3 out of 10 tests, with 2 about education being robust and 1 about language being inconsistent. The effects of spatial assimilation from generation and barrio background are completely explained by other neighborhood dimensions. Third, we find that distance and perpetuation theory explain away what looks like spatial assimilation in the limited models.
Before discussing these findings further, it is important to address this study’s limitations. Our analysis improves our understanding of the spatial assimilation model but it is still a descriptive study incapable of pinning down causation with confidence. The analysis also tests for spatial assimilation among young adults who have lived in the United States at least since eighth grade. More evidence of spatial assimilation might be observed if the sample included immigrants who arrived as adults. Our analyses also rely on ZCTAs rather than the more commonly used tracts to operationalize neighborhoods. It is possible that more spatial assimilation would be observed if we used smaller units, like tracts, to operationalize neighborhoods. This may be true because the areal units selected can influence the results (Wong 2009). Nevertheless, researchers have shown that ZCTAs can be used as areal units to capture neighborhood dynamics (e.g., Ainsworth 2002). This study focused solely on Latinx assimilation and moving into less “brown” and more “white” neighborhoods. Future research might instead look at how assimilation relates to moving into low-poverty or high-income neighborhoods, which researchers have investigated with unidimensional approaches (for example, South and Pais 2008). Perhaps Latinx assimilation is related to moving to neighborhoods based on their socioeconomic characteristics more so than their “whiteness.”
Theoretical Implications
Our findings indicate that without controls for the multiple dimensions of neighborhoods, spatial assimilation provides considerable leverage in describing the residential attainment of Latinx young adults. Once we control for these multiple dimensions, we find that more- and less-assimilated Latinxs have similar residential attainment except in regard to higher education. In other words, we see differences between more- and less-assimilated Latinxs in ways that correspond to the theory, but much of that difference is not due to individual differences in assimilation. We find that the distance people move creates a spurious relationship between individual-level assimilation and residential attainment. Latinxs from Spanish-language backgrounds, from the second generation, and from barrios, compared to their counterparts, tend to grow up nearby neighborhoods with relatively more Latinxs and fewer whites. When neighborhoods’ distance is held constant, the differences in residential attainment by language, generation, and barrio background decline considerably.
Even after distance is held constant, we still observe some spatial assimilation from language and barrio background (but not generation). Perpetuation theory explains the remaining spatial assimilation from barrio background and most of it from language. This theory argues that the racial context in which people grow up influences their psychology about interracial interaction, their knowledge and skills for how to live in different racial contexts, and the racial and ethnic diversity of their social ties (Goldsmith 2016). The net consequence of these factors is that individuals perpetually inhabit similar racial contexts across institutions and over time. Consistent with the theory, we find that Latinxs are more likely to move to a neighborhood as its percentage of whites becomes more similar to the percentage white in their adolescent neighborhoods and schools. The perpetuation of racial contexts over time explains spatial assimilation because more-assimilated Latinxs grow up in “whiter” neighborhoods and schools and less-assimilated Latinxs grow up in “browner” neighborhoods and schools. Once we hold constant these differences in the racial contexts during adolescence, part of the difference between assimilated and unassimilated young adults disappears.
Finally, we observe robust effects of spatial assimilation net of other factors when it is measured as education. We find no evidence that distance, housing prices, economic segregation, place stratification, preferences, or perpetuation theory can explain why more-educated Latinxs, compared to less-educated Latinxs, live in neighborhoods with higher percentages of whites and lower percentages of Latinxs relative to the other neighborhoods in their metropolitan areas. According to the spatial assimilation model, immigrants “strive” to assimilate. If so, then Latinxs with a BA may be those who strive most diligently, and this striving results in their earning a BA and moving to predominantly white neighborhoods. It may also be possible that a BA acculturates Latinxs to the point where they can more easily pass as white. In either case, Latinxs with a BA have residential attainment that is more like that of whites than the residential attainment of Latinxs without a BA.
Nevertheless, it is worth considering why education is more assimilative than income, generation, language, and barrio background. The best predictor of where young adults live in these data is distance, so it may hold the key. Distance is important because moving far away is expensive, and it separates individuals from the people and places that have meaning for them. A college education is likely to give people the means to move farther away, but perhaps more importantly, it begins to break individuals from their local attachments. People with higher levels of education have larger social networks and lower percentages of kin in their networks (McPherson, Smith-Lovin, and Brashears 2006). When young people go to college, they are likely to broaden their social ties to include people from relatively faraway places. In addition, college-educated Latinxs may get jobs further from their original home than those who did not go to college. If so, then they may also move further away from their original home in order to live closer to work. In support of these ideas, we find that the median distance of the neighborhood they lived in is 7.6 and 2.8 miles away for those with and without a BA, respectively.
Policy Implications
Residential segregation has negative effects on Latinxs in important outcomes, like adult health, educational attainment, and exposure to violence. Finding ways to reduce residential segregation is likely to improve Latinxs’ quality of life. This study suggests that policies that would improve Latinx education would be likely to reduce their segregation from whites. It is well known that Latinx levels of educational attainment lag far behind those of whites (and blacks), and there have been important calls for improving Latinx education (Telles and Ortiz 2008). We echo this call.
Footnotes
Appendix
Acknowledgements
The open-access publishing fees for this article have been covered by the Texas A&M University Open Access to Knowledge Fund (OAKFund), supported by the University Libraries and the Office of the Vice President for Research.
1
Parents’ nativity and respondent’s income are missing the most, about 15 percent. We cannot impute neighborhood-level information because we do not know in which metropolitan statistical area they live.
2
3
We report the mean and standard deviation of the distribution of coefficients for distance as well as their statistical significance. Because the distribution is normal, 68 and 95 percent of the coefficients fall within plus or minus one and two standard deviations of the mean, respectively.
4
For a line estimated as y = ax + bx2, the peak of the curve is p = −a / 2b. If a and b are log-odds ratios, the odds ratio (OR) at the peak (or at any other value of x) is OR = exp(ap + bp2). The line crosses the x-axis (changing from positive to negative) at −a / b.
5
The variables describing the economic resources of residents may be collinear, increasing their standard errors and making their hypothesis tests too conservative. This collinearity does not influence our findings about spatial assimilation. In fact, including many variables about neighborhood economic resources improves our tests for spatial assimilation along the lines of race and ethnicity.
6
The small differences observable in the figure occur in neighborhoods with high proportions of whites. There are many of these neighborhoods, so small differences can be significant.