
Abstract
Survey measures of gender have been critiqued for failing to reflect the diversity of the population. Conventionally, respondents to national surveys are categorized as female or male. Calls for improvement have centered on adding additional categories, such as transgender. We propose that in addition to revising categorical gender measures, national surveys should incorporate gradational measures of femininity and masculinity to better reflect gender diversity and sharpen models of gender inequality. Our results from two national pilot studies show that conventional measures mask significant variation within the categories of female and male. For example, less than a quarter of respondents reported that they are very feminine or masculine, respectively, and not at all the other. We also demonstrate that scale responses can be treated as independent variables in studies of inequality or as dependent variables that allow gender identification to be an outcome of social processes.
Keywords
Ever since national surveys emerged in the mid-twentieth century as a means of tracking the attitudes and habits of the American population (Igo 2007), it has been the default to collect information on whether respondents are female or male. 1 The treatment of gender as a fundamental, universal demographic attribute in survey research is not surprising; in everyday interactions, individuals make nearly automatic assessments about others’ gender in order to navigate the social world (Ridgeway 2011), and gender is widely recognized as an axis of inequality. Despite the consensus that surveys ought to measure respondents’ gender, until recently there has been insufficient consideration of how surveys should measure this concept.
Calls to improve the measurement of gender have focused on representing categorical gender diversity by offering additional response options (e.g., transgender 2 ), distinguishing between assigned sex at birth and current gender identity, and allowing respondents to self-identify (see e.g., GeNIUSS Group 2014; Harrison, Grant, and Herman 2011). These are important issues to address when updating the use of gender in surveys, yet the reach of these revisions is limited (see Westbrook and Saperstein 2015). For example, there are concerns that in many surveys, expanded categorical measures will yield some populations that would be too small for statistical analysis. Improved categorical measures also do not allow for variation within gender categories; such questions continue to treat gender as a set of discrete attributes, each assumed to describe a relatively homogenous population.
To facilitate more nuanced analysis in national surveys of the general population, we propose that in addition to revising the standard categorical measure, survey researchers use more gradational measures of gender identification. In particular, we recommend measuring femininity and masculinity on separate scales to account for diversity within and overlap between gender categories. We tested femininity and masculinity scales on two national samples, alongside categorical measures of sex at birth and current gender. Less than one-quarter of respondents reported seeing themselves as very feminine or masculine and not at all the other, yet this strictly dichotomous gender identification is the only notion of gender allowed by current measures. In addition to showing that femininity and masculinity scales reflect the range of gender diversity better than standard categorical measures, we demonstrate that scale scores can serve as either an independent or a dependent variable, opening new avenues of research on gendered attitudes, behaviors, and inequality.
Critique of Conventional Gender Measures
Survey research methods have long been a source of concern among gender scholars. The critique that survey researchers use gender as a variable rather than treating it as a socially constructed system (e.g., Stacey and Thorne 1985), along with broader criticisms of quantitative analysis, have led some scholars to avoid survey data entirely. 3 Others maintain that there is nothing inherently problematic about survey research (Oakley 1998; Sprague 2005) and that statistical analysis of large-scale surveys is necessary to provide entry into policy debates (Harnois 2013; Williams 2006). We take a similar approach that recognizes the role survey research can play in revealing broad patterns of inequality but also emphasizes that the method is only as good as its measures. Although previous work exposed patriarchal assumptions built into surveys, such as the assignment of men as “household heads” (Presser 1998), and has questioned the measurement of gender inequality (e.g., Permanyer 2010), until recently, the measurement of gender itself has remained largely taken for granted.
Survey measures of sex and gender began to attract attention in concert with calls for data collection on LGBT populations to help monitor health disparities and discrimination in employment (e.g., Balarajan, Gray, and Mitchell 2011; Human Rights Watch 2011; Institute of Medicine 2011). Subsequent proposals have focused primarily on the lack of transgender-inclusive response options in conventional measures. Surveys fielded among transgender respondents have demonstrated the feasibility of using a two-question method to measure sex at birth and current gender separately (Deutsch et al. 2013; GenIUSS Group 2014) and of including responses beyond female and male, such as intersex, transgender, genderqueer, and “a gender not listed here” (Harrison-Quintana, Grant, and Rivera 2015; Ingraham, Pratt, and Gorton 2015; Schilt and Bratter 2015).
Changing the categories used to measure sex and gender, “especially [moving] from binaries to multiplicities,” challenges the belief that sex and gender categories are natural and dichotomous (Lorber 2006:451) and grants recognition to otherwise uncounted populations. However, adding more categories alone cannot solve all the dilemmas of representing population diversity. Any attempt to create a survey measure that is inclusive of all possible categorical responses will inevitably fall short of that goal. In the case of gender, individuals use myriad terms to self-identify—most commonly woman and man but also transgender, genderqueer, androgynous, bigender, gender fluid, and many others (see Singer 2015). Much like racial identification, some of these terms are in flux, so no closed set of answer options could anticipate all the terms respondents might use. Allowing open-ended responses addresses part of the problem, but analysts confronted with few respondents in any given gender category will likely exclude small populations from analysis or aggregate all of them into a single umbrella category, such as transgender (Singer 2015). Furthermore, nontraditional gender practices are not confined to transgender people; all genders are part of a complex and unstable system of expectations and experiences (Butler 1993). This heterogeneity within and overlap between gender categories will not be captured by a categorical measure, regardless of how many answer options are offered. Thus, although expanded response options on surveys better reflect gender diversity than conventional measures do, survey measures of gender can be further improved by moving beyond categorical distinctions.
We argue that a more thorough retooling of the use of gender in surveys should include using femininity and masculinity scales as measures of gender identification. Scale items will allow respondents to report a more nuanced sense of self regardless of how they might be classified in categorical gender terms. Our recommended measures avoid pitfalls of prior gender scales not only by allowing respondents to self-identify but also by measuring femininity and masculinity separately, ensuring the two concepts are neither treated as mutually exclusive nor operationalized as opposites. Incorporating such scales as a regular feature of social surveys will allow for assessments of variation in gender identification over time and across regions or contexts.
Development of Scales
Although psychologists have long used and debated scale measures of femininity and masculinity (e.g., Spence 2011; Spence and Buckner 2000; Wylie et al. 2010), gradational measures of gender identification have not been widely employed in large-scale survey research (for exceptions, see Hunt et al. 2007; McLaughlin, Uggen, and Blackstone 2012). Early instruments in psychological studies scored femininity and masculinity along a single, bipolar scale (Gough 1952; Terman and Miles 1936). By the 1970s, the assumptions implied by the use of a bipolar scale—namely, that femininity and masculinity are mutually exclusive and opposite—were being called into question (Constantinople 1973). The Bem Sex Role Inventory (BSRI), a 60-item index of gendered trait ratings that are combined to assign feminine, masculine, and androgynous scores to respondents, subsequently became a standard instrument (Bem 1974). However, even the more abbreviated 30-item BSRI cannot feasibly be incorporated in the large-scale surveys that are key sources of data for social science research. Our aim is to build on the foundational work in psychology on scale measures of gender but adapt those insights for use in a wider range of studies.
Like the BSRI, the gender scales that we propose treat femininity and masculinity as distinct, orthogonal dimensions. However, we depart from the BSRI not only in the number of items we use but also by allowing respondents to determine which criteria contribute to their gender self-identification. Although the BSRI includes self-reported femininity and masculinity scales in its index, most of the instrument asks how well stereotypically feminine and masculine attributes describe respondents. Thus, the BSRI and other similar instruments have been critiqued for imposing definitions of femininity and masculinity on respondents by relying on gender stereotypes to assign scale scores (see e.g., Connell [1995]2005; Gill et al. 1987; Hoffman and Borders 2001). For example, if a person reports on the BSRI that they are “often” or “always or almost always” gentle or compassionate, their femininity score increases, while reporting that one is “often” or “always or almost always” assertive or analytical increases a respondent’s masculinity score. The resulting score does not describe a person’s gendered sense of self but rather the extent to which they conform to a set of stereotypes. Moreover, because the BSRI’s index of stereotypes only includes personality traits, such as being gentle or assertive, the resulting score does not provide an overall measure of a person’s femininity or masculinity. Researchers have updated the traits included on the BSRI to reflect contemporary stereotypes about gendered personalities (Auster and Ohm 2000; Harris 1994), but even the updated index cannot account for how other factors, such as a person’s appearance or occupation, may bear on their gender identification (see Spence 2011).
In contrast to instruments like the BSRI, our scales measure gender identification directly and produce general measures of femininity and masculinity by allowing people to draw on whichever factors contribute to their gendered sense of self when responding. This approach is similar to other commonly used gradational measures, such as political ideology scales that ask respondents to rate themselves as liberal or conservative (see Jost, Federico, and Napier 2009). In addition, by granting respondents control over their gender identification rather than imposing a fixed set of criteria, we recognize that people construct complex gender identities and modes of expression as they navigate a system of gendered expectations and institutions (Risman 2004) and that responding to the scales is itself a means of “doing gender” (West and Zimmerman 1987).
Survey data are currently populated by females and males; to the extent that surveys are used to gauge social behaviors or institutional patterns, only females and males can act and institutions can only affect them on the basis of femaleness or maleness. Our brief measures of gender identification can be feasibly incorporated into general surveys to produce research that more closely approximates the complexity of the gendered social world. Repopulating survey data with a broader range of gendered individuals will enable researchers to sharpen explanations of gender inequality and study gender identification as an outcome of social processes.
Implementing the Scales
We fielded two national surveys to assess the feasibility and potential applications of including femininity and masculinity scales in social surveys aimed at the U.S. adult population. Each survey included a sex and gender module consisting of six questions measuring first-order femininity and masculinity (how do you see yourself), third-order femininity and masculinity (how do most people see you), as well as sex assigned at birth and current gender (Figure 1). Responses on first- and third-order scales were not statistically distinct on average, so for the sake of simplicity in demonstrating how gradational measures can augment categorical ones, we focus on findings from the first-order femininity and masculinity scales. 4

Sex and gender survey module.
The first survey was designed to gauge respondents’ ability to respond to unconventional sex and gender questions and therefore presented our sex and gender module as a standalone questionnaire with space for open-ended feedback. 5 Following the successful pilot, our second study aimed to approximate typical survey questionnaires used in the social sciences; thus, the sex and gender module was embedded within a series of more than 40 questions drawn from the General Social Survey (GSS). Unless otherwise specified, the findings presented refer to our second survey. 6
We recruited respondents for both studies using Amazon Mechanical Turk (MTurk) in May and November 2014. MTurk is an online platform for recruiting workers to complete tasks, such as labeling images, testing hyperlinks, and responding to surveys. MTurk has been embraced by social scientists as a means to quickly and inexpensively recruit respondents for pilot surveys and experimental research (Paolacci and Chandler 2014). Although Mturk workers are not nationally representative, MTurk provides a more diverse pool of respondents compared to the undergraduate student samples often relied on in experimental research (including pretests for the BSRI). The quality of data provided by MTurk workers also compares favorably to online, population-based samples (Weinberg, Freese, and McElhattan 2014), and the use of performance ratings from past MTurk assignments can help to ensure the task of completing a survey will be taken seriously. 7
The respondents we recruited to both surveys were required to be U.S. residents, 18 years or older, were only able to complete one of the two surveys, and were prevented from accessing either survey more than once. Respondents earned $0.25 and $1.50, respectively, which is consistent with standard pay rates on MTurk. After responses were collected, surveys submitted from IP addresses outside the United States or submitted from IP addresses with duplicate submissions were dropped from the samples. The surveys yielded 1,521 and 1,522 valid responses.
Because our second survey was designed to resemble the GSS, we compared our respondents to the 2014 GSS respondents on a number of key demographic characteristics. Our survey sample aligns well with the 2014 GSS distribution for respondent’s sex, and the regional and political party affiliation distributions are also quite similar between the two surveys (Table A1). Relative to the GSS, which recruits respondents using a multistage area probability sample, our sample overrepresents whites and Asians; respondents also are younger, on average, and more highly educated. These patterns are consistent with previous studies conducted on MTurk (see e.g., Berinsky, Huber, and Lenz 2012). Given the nature of our sample, we expect that it will provide somewhat higher estimates of nontraditional gender identification than a nationally representative survey. However, the diversity of our sample also allows us to highlight key differences along these lines that will be fruitful avenues for future research.
Weighing the Results
Conventional survey measures of gender are blunt tools. Our proposed femininity and masculinity scales enable respondents to better express nuanced gender identifications and researchers to better track patterns in gender inequality. The distribution of scale responses on both surveys confirms that conventional gender measures mask diversity among cisgender 8 and transgender respondents alike. Analyses using scale scores as an independent variable show that conventional gender measures can conceal gradational disparities in outcomes while treating scale scores as a dependent variable allows researchers to question the direction of causality underlying otherwise descriptive findings of gender difference.
Diversifying Data
In both surveys, our scales uncovered significant variation in gender identification among both cisgender and transgender respondents. Aggregate results show that respondents made use of the full seven-point scales to describe their femininity and masculinity, with substantial overlap between the scale responses of respondents assigned female and male at birth (Figure 2). Further, although more than 99 percent of both samples would be classified as cisgender based on their categorical responses, 9 femininity and masculinity scale responses suggest that significantly fewer than 99 percent of respondents see their gender in traditionally dichotomous, categorical terms.
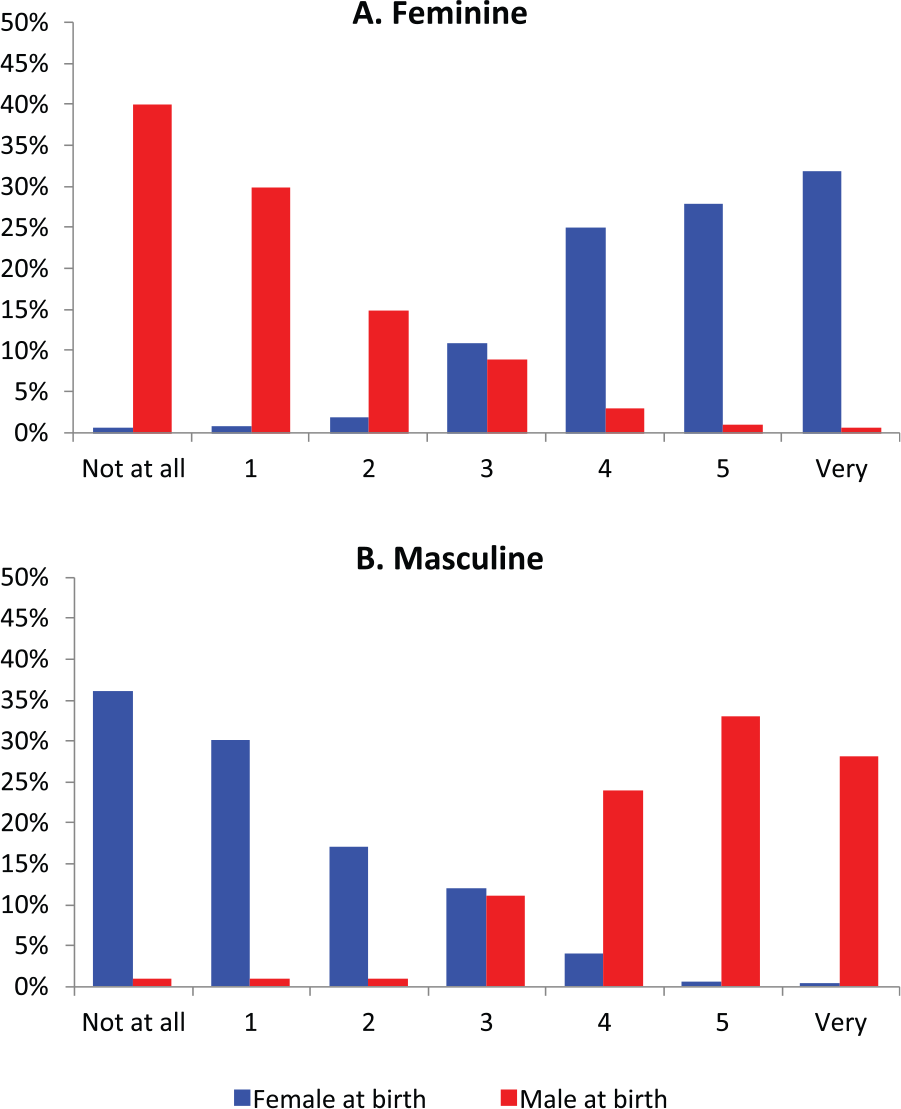
Distribution of gender identification by sex at birth.
We also calculated gender polarization scores as the absolute value of the difference between each person’s responses on the femininity and masculinity scales (Table 1). If the female/woman and male/man implied by standard measures are assumed to be only feminine or masculine, respectively, and not at all the other, polarization scores reveal how much respondents’ gender scale responses deviate from these assumptions. Less than a quarter (24 percent) of respondents received a polarization score of 6, meaning they reported seeing themselves as very feminine/masculine and not at all the other. Gender identification for the remaining 76 percent of respondents included either tempered or overlapping femininity and masculinity. Among them, 7 percent of the sample reported identical feminine and masculine responses, giving them polarization scores of zero, while nearly 4 percent of respondents reported a lower score on the gender scale that “matches” their sex at birth than on the “cross-gender” scale—that is, 33 females saw themselves as more masculine than feminine, and 24 males saw themselves as more feminine than masculine. Thus, scales reveal greater gender diversity than is counted by conventional measures.
Gender Polarization and Scale Response Distributions.

Source: Survey fielded on Amazon Mechanical Turk, November 2014.
Note: N = 1,522; 805 females at birth and 717 males at birth. Scales were coded from 0 to 6. Polarization is the absolute value of the difference between the two scales.
The scales additionally expose the social contingency of gender identification. We find statistically significant patterns in scale responses by region, age, sexual orientation, and self-identified race, among other factors (Table 2). 10 For example, respondents in the South were significantly more likely to give very polarized responses than people elsewhere in the country, affirming that gender is not a natural attribute but rather is culturally inflected. Respondents over the age of 30 (the median age in our sample) also reported significantly more polarized gender identifications than their younger counterparts. Repeated inclusion of femininity and masculinity scales will allow researchers to determine if this age gap is related to cohort differences or changes in gender identification over the life course (or both). Heterosexual respondents reported more polarized gender identifications than their gay, lesbian, or bisexual counterparts as well, suggesting that scale responses will enable researchers to disentangle whether inequality associated with sexual orientation is mediated or moderated by conformity to gender expectations. With more racially diverse samples, femininity and masculinity scales will also allow researchers to advance studies of intersectionality by exploring how racial and gender identification co-vary (e.g., Galinsky, Hall, and Cuddy 2013).
Gender Polarization by Demographic Characteristics.

Source: Authors’ survey fielded on Amazon Mechanical Turk, November 2014.
Note: For polytomous variables (region, race, and party affiliation), each comparison is tested separately, as if it were dichotomous (e.g., South versus all else, white versus all else, black versus all else).
p < 0.05. **p < 0.01. ***p < 0.001 (two-tailed tests).
Situating Scale Responses
Open-ended feedback from the first survey sheds light on how respondents understood the scales and selected responses. Though it was optional, over a third of respondents provided feedback, with 14 percent (N = 209) opting to explain their responses to the sex and gender questions. These results indicated that people took into account a range of factors when reporting their femininity and masculinity, including their appearance, hobbies, and occupation, in addition to citing personality traits, such as those measured in the BSRI. For example, a cisgender woman who sees herself as a 4 on the femininity scale and a 2 on the masculinity scale explained, “I grew up as a tomboy, and I’m an electrical engineer, a field that is almost all male. I also can have quite an assertive personality at times, so I feel somewhat masculine, but more feminine still.” 11 This respondent identifies with the gender category “woman” but also sees herself as masculine with regards to her assertiveness and occupation. A cisgender man who sees himself as a 2 on the femininity scale and a 5 on the masculinity scale commented, “I consider myself in the metrosexual sort of group. I’m a male who likes females, who is concerned about his skin, clothes, and looks a bit more than most of my friends.” This respondent reflected on his categorical sex, his sexuality, and his self-presentation and ultimately decided that he has both feminine and masculine characteristics. By asking for an overall sense of their femininity and masculinity, our scales allowed respondents to weigh multiple dimensions of their gender identification. 12
The scale responses and feedback provided by transgender respondents further highlight the heterogeneity hidden by categorical measures. For example, a respondent who was assigned male at birth and currently identifies as transgender reported a femininity score of 5 and a masculinity score of 0. In explanation, this person said, “I am small and have a female’s body, it has always been a curse when trying to make it with the ladies. But now, I have accepted it and embrace it.” On a conventional gender measure, this respondent could be recorded as either female or male, but neither response would fully reflect their gendered sense of self. The same is true for a respondent who was assigned female at birth, wrote in “genderqueer or gender neutral,” and selected a 3 on the femininity scale and 4 on the masculinity scale. They commented, “This is the best survey ever—I get so sick of surveys asking which ‘gender’ I am and then providing only two options, neither of which are my gender identity.” On a survey with expanded categorical gender measures, these respondents would be better able to report their current gender and sex at birth. However, categorical measures alone would render these two respondents difficult to distinguish—both identify outside the conventional gender binary, and thus they likely would be collapsed into a single group for statistical analysis. Including gradational measures of femininity and masculinity alongside categorical items allows these respondents to report their gender in a more nuanced way and reveals that in terms of femininity and masculinity, they are far from similar. The first respondent’s gender identification is highly polarized and feminine, while the second reports femininity and masculinity scores in the middle of each scale. Averaging their experiences under an umbrella categorical variable would hide the extent to which their differing gender identifications bear on their life experiences.
Complicating Gender Inequalities
Because traditional survey measures of gender allow just two mutually exclusive responses—female and male—quantitative studies of inequality can only depict and model gender gaps in binary, categorical terms. Incorporating femininity and masculinity scales into surveys can expose hidden dimensions of gender inequality. Health researchers, for example, have found that relying on binary sex categories in analysis masks an association among men between self-identified femininity and decreased risk of death from heart disease (Hunt et al. 2007; see also Hammarström and Annandale 2012). Similarly, studies that incorporate femininity and masculinity scales have revealed associations between gender identification and abuse in dating (Burke, Stets, and Pirog-Good 1988) and workplace harassment (McLaughlin et al. 2012) as well as how gender identification may be altered by marriage (Burke and Cast 1997).
We further illustrate how scales can sharpen models of inequality by examining the association between femininity and masculinity scale responses and marital status. Marital status has been mechanically related to conventional categorical measures of gender in the United States—because the vast majority of marriages have been heterosexual, women and men have been represented equally among married people. However, our results indicate that marital status is related to gender polarization scores (Table 3). People with very polarized responses have 50 percent greater odds of being married, net of sex at birth, compared to people with less polarized gender identifications. The direction of causality in this association is unclear—traditional, dichotomous gender identification could increase the odds of marriage, or marriage could increase conformity to traditional gender norms (Burke and Cast 1997). Repeat measures of femininity and masculinity in panel studies will allow researchers to further investigate the association, extending conversations about the role of marital status in maintaining inequality (Waite and Lehrer 2003).
Revealing a Relationship Between Martial Status and Gender Polarization.

Sources: General Social Survey (GSS) 2014 cross-sectional sample and authors’ survey fielded on Amazon Mechanical Turk, November 2014.
Note: Logistic regressions predicting being currently married. Coefficients presented as odds ratios. Z-scores in parentheses. Estimates using data from the GSS presented for comparison, to demonstrate similar effects for our covariates; marital status coded using POSSLQ variables (MARITAL provides similar results). Models for the Mturk sample include controls for survey condition (not shown); there were no significant differences between the different question orders or sex/gender module placement within the questionnaire.
p < 0.05. **p < 0.01. ***p < 0.001 (two-tailed tests).
More broadly, if gender scales become a regular feature of large-scale surveys, researchers will be able to study gender identification as both a determinant and a consequence of one’s life experiences, allowing for the possibility that gender inequality is produced and reproduced in a positive feedback loop. For example, feminine behaviors and tasks are often devalued in the workplace, but sanctions for violating expectations compel women to engage in them nonetheless (Eagly and Carli 2007; England 2010). Similarly, men often engage in behavior known to be risky or detrimental to health in the interest of conforming to masculine expectations (Courtenay 2000). We need better measures of gender to understand, and potentially to interrupt, such cycles of inequality. We know that some women break into professional leadership and some men avoid health risks; would they describe their gender differently, in terms of femininity or masculinity, than their peers? If so, would differences in gender identification precede or follow differences in gendered behaviors or experiences? Femininity and masculinity scales will allow researchers to account for variation within gender categories and offer the potential to disentangle causal mechanisms that are missed in standard studies of gender inequality.
Conclusion
We argue that including femininity and masculinity scales in survey research better reflects the complexity of the social world than current categorical measures alone and thus can shed new light on axes of inequality. Unlike standard gender scales that rely on a series of trait ratings, reducing femininity and masculinity to stereotype conformity, our proposed items give primacy to a more comprehensive measure of self-identification. Recording such gradational measures of gender, in addition to improving categorical measurements, demonstrates that gender does not affect all women, all men, or all members of any other category in a uniform way. Rather, gender may insinuate itself into social processes along various dimensions. Future studies can use scales to investigate outcomes of conventional and unconventional gender identification while also treating gender identification as the outcome of social processes. To understand how gender inequality is created and maintained, researchers need measures of gender that reflect its complexity and contingency.
Footnotes
Appendix
Demographic Comparison between General Social Survey and MTurk samples.

| GSS 2014 | MTurk Sample | |
|---|---|---|
| Gender | — | |
| Woman | — | 52.6 |
| Man | — | 46.9 |
| Transgender (direct) | — | 0.1 |
| Transgender (indirect) | — | 0.2 |
| All other responses | 0.2 | |
| Sex | ||
| Female | 55 | 53 |
| Male | 45 | 47 |
| Intersex | — | 0 |
| Region | ||
| South | 36 | 38 |
| West | 24 | 25 |
| Midwest | 23 | 21 |
| Northeast | 17 | 17 |
| Education (mean years) | 13.7 | 14.6 |
| Age (mean) | 49.0 | 34.4 |
| Married | 44 | 38 |
| Heterosexual or straight | 95 | 90 |
| Hispanic origin | 16 | 7 |
| Self-identified race | ||
| White | 70 | 81 |
| Black or African American | 14 | 7 |
| Specific Asian response | 3 | 5 |
| Selected two or more | 7 | 5 |
| All other responses | 6 | 2 |
| Party affiliation | ||
| Democrat | 33 | 41 |
| Republican | 21 | 17 |
| Independent | 43 | 38 |
| All other responses | 2 | 4 |
|
|
||
| N | 2,538 | 1,522 |
Sources: General Social Survey (GSS) 2014 cross-sectional sample and authors’ survey fielded on Amazon Mechanical Turk, November 2014.
Note: Frequencies are reported as percentages unless otherwise noted, and may not sum to 100 due to rounding. Indirect transgender categorization is based on reporting a sex at birth that does not “match” one’s current gender. Region is based on self-reported state of residence. Specific Asian responses included categories such as Asian Indian, Chinese, Filipino, and so on.
Acknowledgements
We are grateful to Shelley Correll, Jocelyn Hollander, Cecilia Ridgeway, Tom Smith, Robb Willer, and Christine Williams for their helpful comments and discussions and to Chrystal Redekopp for her research assistance.
Funding
This research was supported by the American Sociological Association Fund for the Advancement of the Discipline and the Clayman Institute for Gender Research.