
Abstract
Are people less likely to attend large churches? Using nationally representative data, I find a negative relationship between size and the probability of attendance for Conservative, Mainline, and black Protestants and for Catholics in parishes larger than 500 attenders. The addition of control variables does not change these patterns. These results support the theory that group cohesion lies at the heart of the size-participation relationship in churches. With the rapid growth of megachurches in the United States, a negative relationship between size and frequency of attendance could serve to accelerate aggregate declines in attendance. Methodologically, this article demonstrates how Bayesian hierarchical models can handle complex data structures and imputation procedures in a unified model.
Keywords
Background
Sociologists have theorized that group size and member participation share a close link (Blau 1970; Caplow 1957; Terrien 1959; Tsouderos 1955). Simmel (1902) noted this connection more than a century ago. He argued that relatively small groups are more effective at reinforcing commitment and conformity. Small groups can use a wide array of relational pressures because face-to-face interaction between all members of the group is possible. As groups become larger, the social ties between group members weaken and commitment and conformity become more difficult to enforce. The organization can no longer exercise the same level of control over individuals. According to this theory, by their very nature, large organizations create a less involved, more heterogeneous membership. Applied to churches, Stark and Finke (2000) argued that social network density declines as congregations get larger, which in turns results in fewer direct mechanisms for promoting commitment, and participation declines.
In spite of this strong theoretical link between size and member participation, past research has failed to reveal clear and consistent patterns. To date, a negative relationship between size and attendance has not been established using nationally representative data on American congregations. Only a handful of studies collect individual self-reported frequency of attendance and a measure of congregation size, which is obtained from the respondent or the respondent’s congregation. These studies have often relied on small samples and/or samples of one religious subgroup, and they have produced variable results. One study reported no difference in the rates of attendance between individuals who attend churches with fewer than 100 in attendance and more than 1,000 in attendance (Stark 2008:46–48). Using the US Congregations and Life Survey (USCLS), another study found that attendance was not significantly related to size (Dougherty and Whitehead 2011). Using USCLS poses a problem. While the survey is a nationally representative sample of congregations, individual-level data are obtained after a worship service and therefore underrepresent the number of less-frequent attenders.
Several related studies use participation rate rather than attendance rate to operationalize member involvement. Participation rate is measured by a (usually) denominationally collected report of each congregation’s average weekend worship attendance and total official membership. To obtain the participation rate, the number of attenders is divided by the total membership. The first article to use this approach appeared in Administrative Science Quarterly in 1971. This study of 157 Lutheran churches in South Dakota found a modest negative relationship between size and participation rate (Wilken 1971). A priori, the relationship was predicted to be much stronger. The author speculated that other factors, particularly the age composition of the congregation, moderated the size-participation relationship. The second study appeared nine years later in Social Forces and focused on 58 Protestant churches in Indianapolis. Here, the investigators again found a negative relationship between size and participation (Hougland and Wood 1980). A study of 483 Nazarene congregations found that the ratio of membership to attendance was negatively correlated with size, which means that larger churches have members who are less likely to attend regularly (Pinto and Crow 1982). Two more recent congregational-level studies of Southern Baptist congregations revealed a negative relationship between size and participation rate (Dougherty 2004; Finke 1994).
Studies that use participation rate bear some important limitations. Church membership does not have the same significance in all congregations and traditions. Some congregations stress the importance of formal membership, while others downplay its significance. In addition, some have a large number of nominal members—members who rarely attend but retain their memberships (students away at college and shut-ins often fall into this category). Therefore, lower levels of participation may simply reflect the fact that a particular congregation has a large nonresident, student, and/or elderly population. By a similar logic, higher participation rates may result if a congregation does not stress the importance of formal membership. Therefore, using membership counts to calculate attendance rates provides an unreliable estimate of the relationship between congregational size and the propensity for individuals to attend regularly.
This research has contemporary significance given two major, related trends in American religion: There is an increasing concentration of people into very large churches (Chaves 2006, 2011), and megachurches have rapidly proliferated since the 1970s (Thumma and Travis 2007). Simmel’s (1902) theory suggests that much of the ‘action’ between size and attendance will occur in very large churches. Because large churches are relatively rare and samples of churches therefore contain few very large congregations, it is difficult to test this relationship.
Other research examines whether size is related to the degree of support an individual gives to and receives from his or her congregation. While these studies are measuring different outcomes, they bear mentioning because, according to the theory, participation rates are intertwined with social support. Again, these studies have produced mixed results. For instance, one study found that size was negatively related to an individual’s perceived sense of social support (Ellison et al. 2009); a similar finding was reported among Roman Catholics, where satisfaction levels were higher among individuals in smaller parishes (Peyrot and Sweeney 2000). In contrast, other research suggests that individuals who attend churches with 1,000 or more attenders have more friends in their congregation than those in small churches (Stark 2008:46–48). Another study suggested that congregational size was not related to the likelihood of an individual’s providing social support (McClure 2013).
To summarize, there is a strong theoretical link between size and attendance, but the research that has examined this relationship has significant limitations. Data quality issues abound: Attendance rates are often derived from membership counts, some studies only examine a single denomination, others reply on studies that overrepresent regular attenders, and most studies contain few large churches, which makes patterns hard to detect. The goal of this research is to provide a clearer picture of the empirical relationship between size and attendance using the best available data and state-of-the-art modeling techniques. I will use multilevel, nationally representative data that span multiple religious traditions to measure both size and attendance at religious services. I will also take advantage of advances in Bayesian hierarchical linear modeling to estimate how this relationship varies across groups.
Data and Methods
This research draws on combined data from the National Congregations Study (NCS) and the General Social Survey (GSS). The GSS is a representative sample of the noninstitutionalized adult population in the United States. If a GSS respondent indicates he or she attends religious services once a year or more, the GSS asks for the name of the congregation, which then forms a nationally representative sample of congregations (Chaves 2007; Chaves et al. 1999). The NCS was conducted in 1998, 2006, and 2012 and gathered a representative snapshot of congregations in the United States by interviewing a key informant from the congregation nominated in the GSS, most often the senior pastor. The NCS was not conducted in 2000; however, GSS asked respondents to report the size of the congregations they attend. NCS response rates are 80, 78, and 73 percent for 1998, 2006, and 2012; GSS response rates are 76, 70, 71, and 71 percent for 1998, 2000, 2006, and 2012. Excluding congregations from non-Christian religious traditions, these data contain 1,608 cases from 1998, 1,319 cases from 2000, 1,684 cases from 2006, and 1,558 cases from 2012, for a total N of 6,169. The NCS and GSS are linked, which allows the matching of individuals with their congregations’ characteristics.
In this study, I conceptualize congregational characteristics as individual-level data (so, for instance, we can think about a hypothetical respondent in this survey as a white, married male who attends an urban congregation with 500 regular adult participants). Repeat nominations of the same congregation occur. Of the congregations, 89 percent received a single nomination, 8 percent received nominations from two GSS respondents, and 3 percent received nominations from three to seven respondents. I treat duplicate nominations as independent cases, which, because the GSS employs a geographically clustered sampling procedure, may not be completely valid, but the anticipated impact of the study design is small.
Member participation is operationalized as a binary variable that indicates respondents who report attending worship services at their congregation “nearly weekly” or more. Weekly worship service attendance is a standard measure in the literature and is one of the few congregational participation variables available in the GSS. I tested specifying the model with an ordinal outcome variable, which retains all the categories of attendance, but the substance of the results did not change.
The key independent variable in this analysis is the number of regular adult participants in the congregation as reported in the NCS by the key informant. Specifically, respondents are asked to estimate the average number of attenders at all of the congregation’s regular worship services.
Table 1 summarizes the number of adults in the congregation that each GSS respondent attends, as assessed by key informants. As these data show, congregation size is highly skewed. The median respondent attends a congregation of 370 people, and the mean is 1,035. The size of congregation that an individual attends has increased during the 14 years of the NCS. In addition, 17 respondents reported attending congregations with 10 or fewer regular adult participants. I removed these cases from the analysis because they were exerting excessive leverage on the regression results. The NCS has good coverage of large congregations; 279 have attendance between 2,000 and 4,999, 100 have attendance between 5,000 and 9,999, and 16 have 10,000 or more attenders.
Number of Regular Adult Attenders in the Congregation Attended by the Respondent, Weighted to Be Representative of All Attendees.

Source: National Congregations Study 1998, 2006, and 2012, 17 congregations with 10 or fewer attendees excluded.
There are a large number of cases wherein the key-informant report of congregational size is missing. Rather than drop these cases, I use an imputation strategy, outlined below, to retain these cases and increase the predictive power of the model. Key informant reports of size were missing when the congregation named by the GSS respondent may have chosen not to complete the NCS, the NCS informant failed to report the size of the congregation, or—the case in 2000—the GSS respondent was asked for an estimate of the congregation’s size but there was no NCS conducted in that year. In total, this procedure adds 2,310 cases, 185 from the 1998 GSS, 1,319 from 2000, 294 from 2006, and 144 from 2012. the GSS does not ask the same size question as does the NCS. The GSS asks, “About how many members does this congregation have?” Past research has shown that this question and the NCS “how many regular adult attenders” question are strongly correlated, with a correlation coefficient of .7 when both variables are logged. In this analysis, I consider the key-informant report of size more accurate than the GSS respondent’s estimate. NCS respondents are generally senior clergy with an intimate knowledge of the congregation. But in cases where the NCS report of size is missing, the GSS congregational-size variable is used to model likely values that an NCS informant would have given if the response existed.
Controls
In this analysis, I introduce controls for factors that may mediate the relationship between size and member participation. We know that women, married people, and those with children attend services more frequently. Large churches typically offer more programs for children and families, something that may differentially attract women (who are often the primary caregivers of children), married couples, and those with children at home. Gender is a binary variable coded 1 for female and 0 for male; a child present in the home is coded as 1 with no children present coded 0. Marital status is a categorical variable coded as never married (reference), married, and divorced/separated/widowed. Large churches are predominantly an urban phenomenon, and rural location is coded as 1, with urban locations coded as 0. Age is introduced as a continuous predictor (centered at the grand mean) as younger people attend church less frequently, but when they do attend, they favor larger churches (Eagle 2012).
Some have suggested that more time-pressed individuals may gravitate to larger churches because they offer greater flexibility in terms of the degree of involvement (Chaves 2006; Eagle 2012). From other research we know that the amount of discretionary time is negatively correlated with higher education and higher income (Jacobs and Gerson 2004). Educational attainment is added as a categorical variable coded as less than high school (reference category), high school or GED, and bachelor’s degree. Family income is a continuous variable that is standardized, centered, and expressed in constant 2006 dollars.
It is plausible that congregations with more per capita resources are able to provide better programming and support, which leads to higher participation. It could also be true that adding staff may compensate for lower participation levels. To explore this relationship, I create a variable that measures the staff-to-adult-attender ratio. To construct this variable, I add up the number of full-time and part-time staff (with each part-time staff member counting for one half a full-time staff member) and divide it by the number of regular adult attenders. I remove the cases where this ratio is greater than or equal to .10 so as to limit the potential impact of outliers. This variable is not available in 2000 because the NCS was not conducted in that year. Missing values are imputed.
Patterns of religious attendance vary considerably by religious tradition. Table 2 shows that weekly attendance is highest among black and Conservative Protestants and much lower among Roman Catholics and Mainline Protestants. Churches are also structured differently. Roman Catholics attend larger churches with smaller budgets and fewer staff than their Protestant counterparts. Black Protestants, while they attend churches with similar budgets as Conservative Protestants, employ far fewer full-time staff per member. Because size, staffing, and congregational resources affect the kinds of programs and services a congregation offers, it is likely that the size-attendance relationship will vary among religious traditions. Rather than simply using indicator variables for religious tradition, I cluster respondents in religious traditions and employ a hierarchical linear modeling approach. A control variable approach cannot deal with heterogeneity between groups, whereas a hierarchical linear modeling framework can.
Differences in Key Characteristics by Religious Tradition, Weighted to Be Representative of All Attendees.

Source: National Congregations Study and General Social Survey 1998, 2006, and 2012.
Number full-time staff + 0.5 × Number of part-time staff.
Last, I add three dummy variables to indicate the survey was done in 2000, 2006, or 2012 (1998 is the reference year). In 2000, the NCS was not conducted, and estimates of size are available only from the GSS. The strategy employed to deal with this issue is outlined below. There are very few missing data on all controls except for income and staff ratio. The two cases with missing data on age and the single case with missing data on marital status were dropped. With income and staff ratio, a model-based imputation strategy outlined by Tanner and Wong (2008) is employed to estimate these values.
I run three models: one without controls included, one with all the controls save staff ratio, and a third with all the controls including staff ratio. I tested running a Bayesian lasso model, where a shrinkage parameter reduces potential colinearity between the predictors (Hans 2009). When run this way, the model did not produce substantively different results, so I run the models without a shrinkage correction.
Modeling Strategy
I use binary logistic regression to estimate the latent probability, p, that an individual attends worship services weekly or more and test whether it covaries with the size of the congregation attended, net of other covariates. Initial exploratory data analysis using nonparametric regression revealed a possible nonlinearity in the relationship between size and attendance. I add a squared size term to the model to accommodate this feature of these data. Other studies have revealed a nonlinear relationship between size and organizational participation for industrial organizations (Reiter, Zanutto, and Hunter 2005). Because congregational size has such a wide range, I take the natural logarithm of the size variable, lognum, to compress the scale and improve the ability of the model to estimate the regression coefficients. Lognum is mean centered, which reduces the correlation between lognum and lognum2 and leads to more reliable estimates of the linear and nonlinear components of the effects (Bradley and Srivastava 1979).
To deal with the difference between traditions but still retain all of the cases in a single model, I use a hierarchical linear model that clusters individuals within traditions. This model contains group-specific intercepts for each religious tradition and group-specific slopes on lognum and lognum2. Because the control variables are either not of central importance or not likely to vary among traditions, they are added as fixed effects, which also reduces the number of parameters to be estimated. The data are modeled as follows:


The dependent variable
The fact that these data contain missing values of the key independent variable presents a challenge. However, when this variable is missing, there is an estimate of size given by the GSS respondent. To accommodate cases where the NCS estimate is missing but the GSS estimate is available, I employ a two-part modeling strategy. For cases where the NCS size variable, lognum, is available, the basic hierarchical linear model is employed. When lognum is missing, I predict the value of the NCS variable from the GSS variable. Predicted values of lognum are drawn from the following predictive distribution:


h indexes all of the cases with nonmissing values of the NCS variable.
All of the regression models are evaluated using a Bayesian framework rather than a maximum likelihood–based approach. For hierarchical models, Bayesian models are typically more efficient at detecting small differences between group-level coefficients. They also produce a full posterior, which makes it much easier to produce confidence intervals around the computed predicted probabilities. The Bayesian approach also allows me to build in model-based imputation procedures for missing values. The final model handles all the survey linking, imputation, and calculation of predicted probabilities and uncertainties in a single model.
In terms of prior choice for the Bayesian regression model, I use a noninformative semiconjugate prior on the intercept and all of the regression coefficients (normals with mean = 0 and precision = 0.001). For the precisions (the inverse of the squared standard deviation), I use diffuse gamma priors with a = b = 0.001. The posterior distribution is estimated using a Gibbs sampler, run with three chains for 50,000 iterations, with the first 25,000 iterations removed for burn-in. Good mixing is observed in the chains, and there is no evidence that the priors are informing the results in any significant way. The posterior density of p contains the uncertainty resulting from the procedures used to impute values of size and income.
The key goal of this analysis is to produce an estimate of the probability than an individual will attend services weekly in congregations of different sizes. To that end, I use the estimated coefficients from equation 3 to estimate the predicted probabilities that an individual will attend weekly or more for congregations from 50 to 10,000 regular adult attenders. The relationship is then plotted for each religious tradition. From the posterior estimates of the coefficients, I report the mean value of the parameter of interest and the 95 percent credible interval. The credible interval indicates that 95 percent of the population is contained within this range of values. In the regression tables, credible intervals that do not contain zero are indicated in bold.
Results
Table 3 contains summary statistics of each of the variables used in the analysis. Approximately one third of the respondents are affiliated with either a Roman Catholic or a white Conservative Protestant congregation, with 11 percent and 18 percent attending black Protestant or white Mainline Protestant congregations. Attendance is highest for white Conservative and black Protestants, with, respectively, 59 percent and 52 percent attending weekly, whereas for Roman Catholics and white Mainline Protestants, 38 percent and 42 percent attend weekly, respectively. In keeping with the historic disadvantages faced by African Americans, marriage rates, income, and educational attainment are all lower among black Protestants. White Mainline Protestants are older and have higher incomes and levels of education than other religious groups (Keister 2011; Lehrer 2004; Lenski, 1961).
Descriptive Statistics, Weighted to Be Representative with Those Affiliated with a Congregation in the United States.
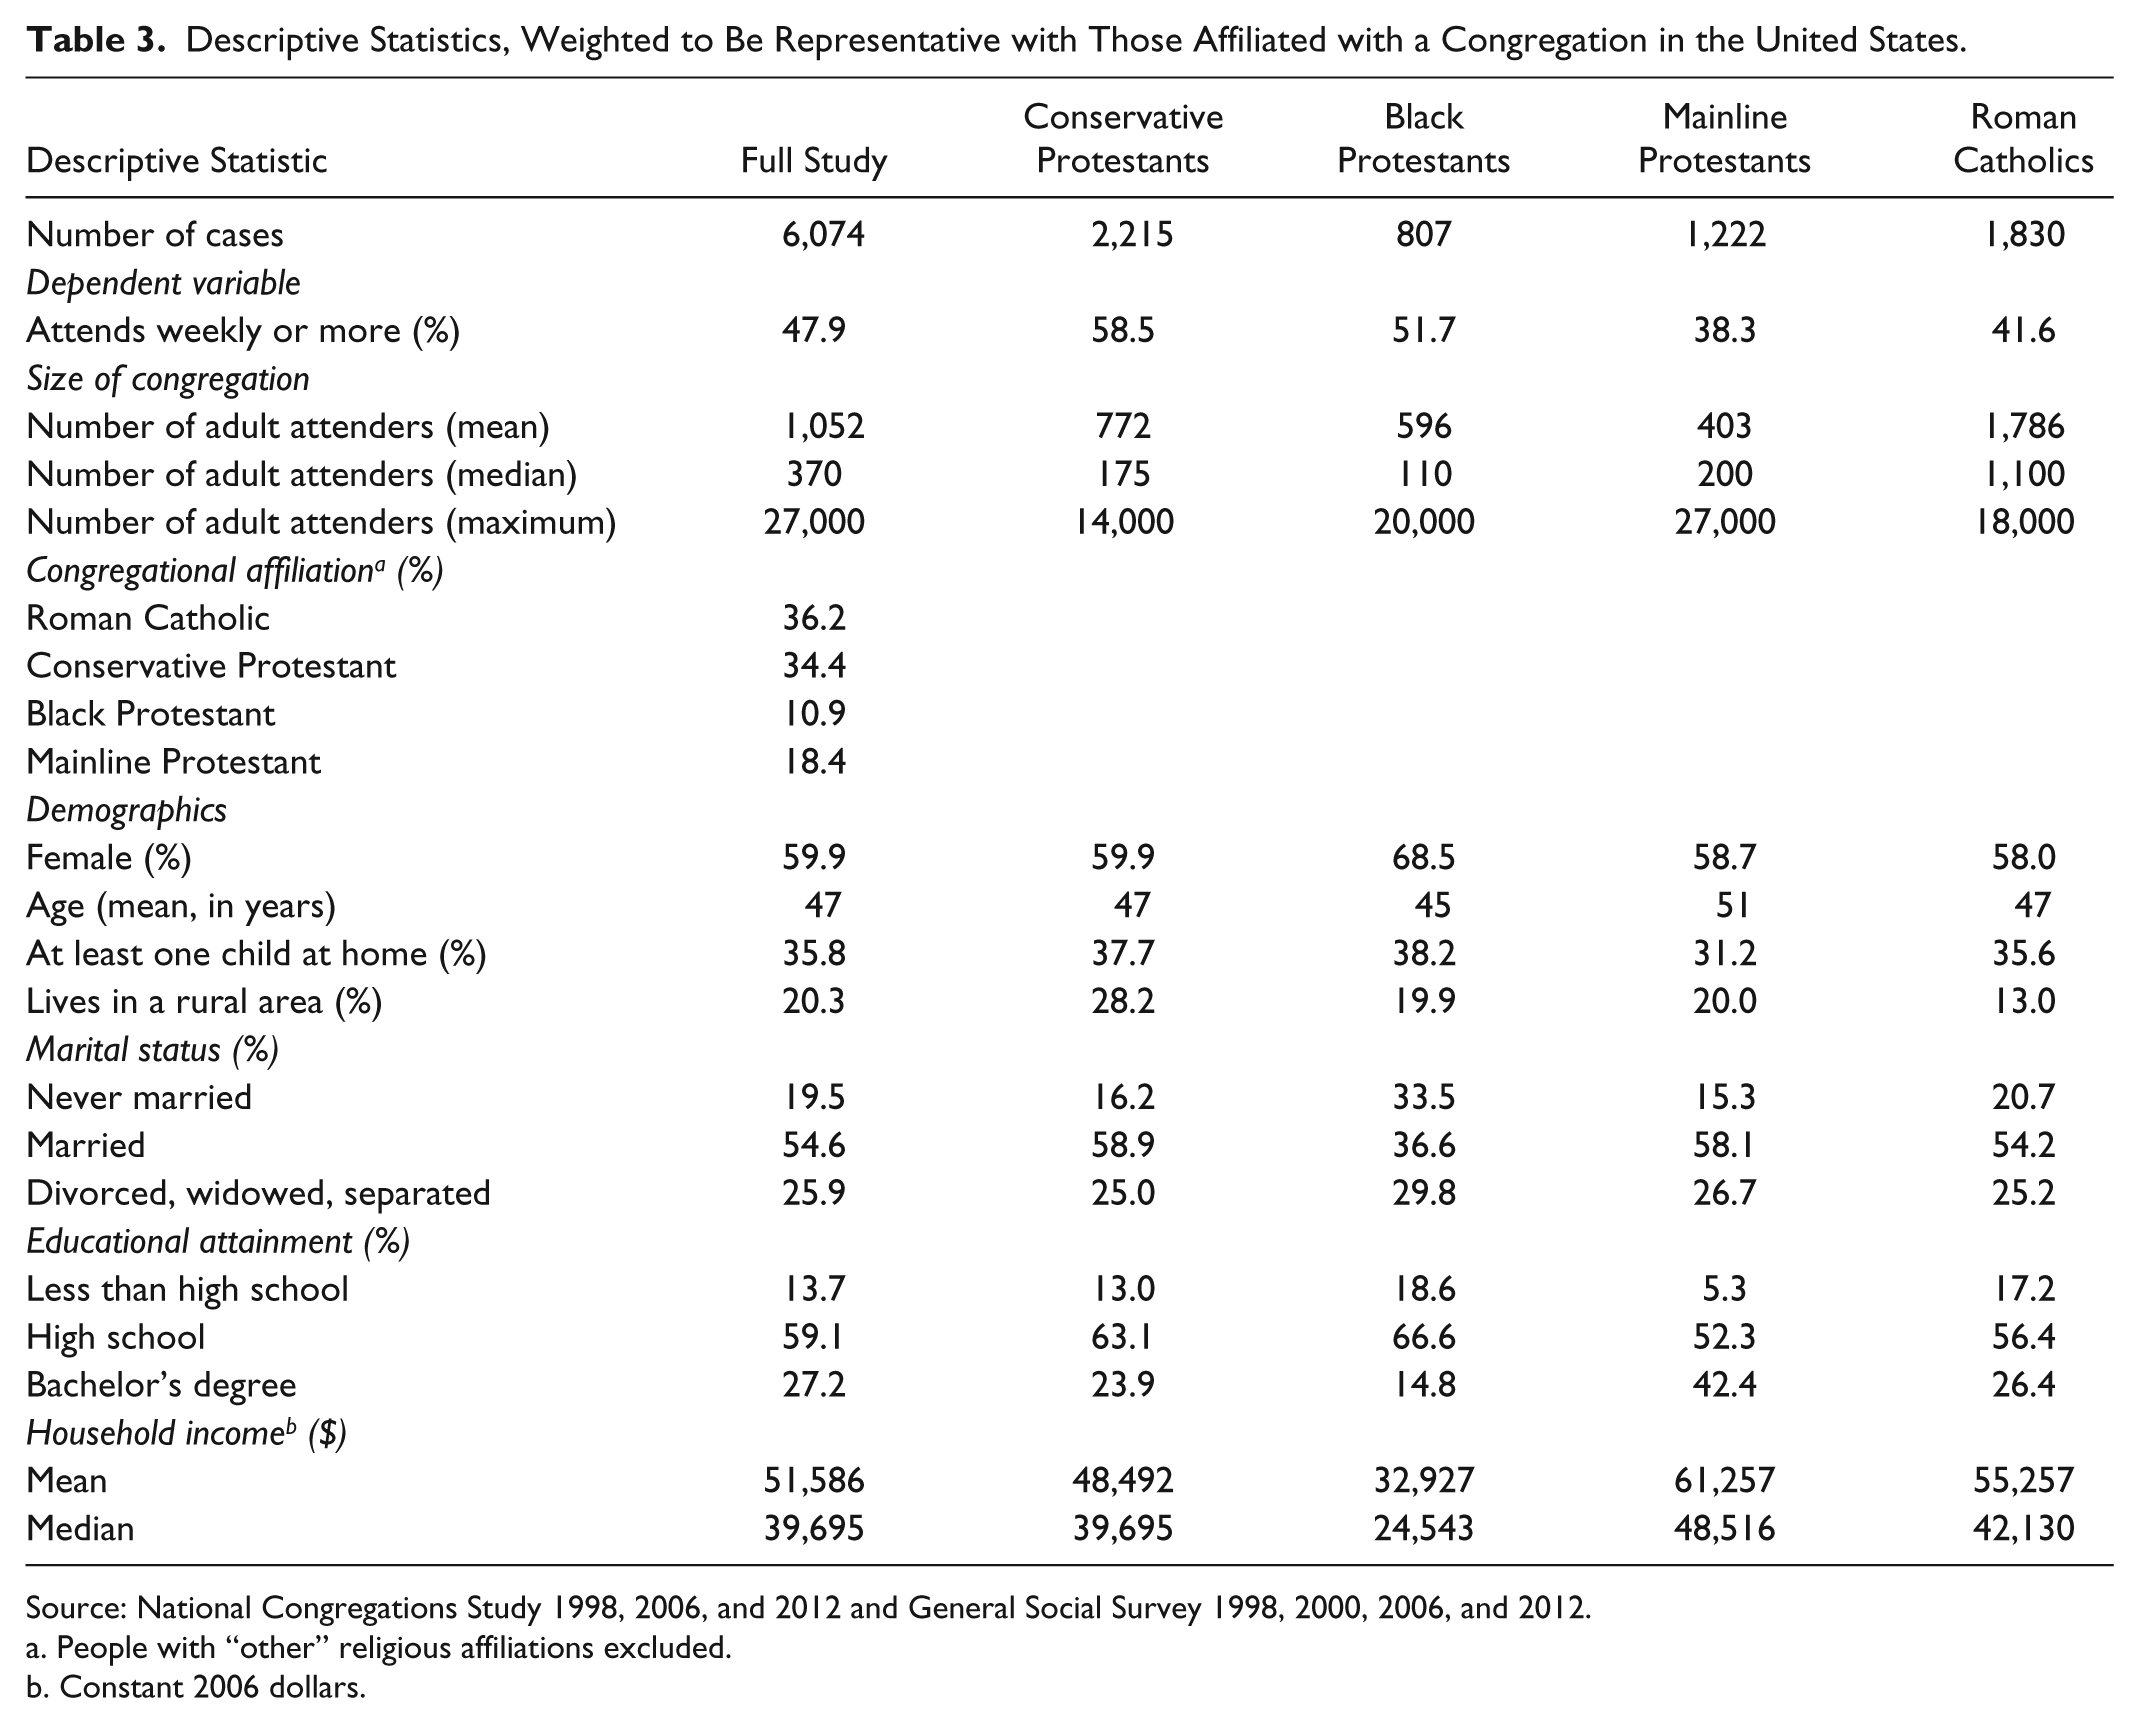
Source: National Congregations Study 1998, 2006, and 2012 and General Social Survey 1998, 2000, 2006, and 2012.
People with “other” religious affiliations excluded.
Constant 2006 dollars.
In Figure 1, I plot the predicted probability of attending weekly against the natural logarithm of the number of adult attenders in the congregation estimated from the full sample and from samples restricted to each of the four major Christian religious traditions in the United States: white Conservative Protestant, white Mainline Protestant, black Protestant, and Roman Catholic. The underlying regression coefficients used to produce the plots are reported in Table 4. Figure 1 reveals both important similarities and some variation in the relationship between size and the probability of weekly attendance by religious tradition. Important to note, the model does not credibly predict a positive relationship between size and attendance for any of the groups.

Plot showing predicted probability of weekly attendance by religious tradition by log of congregational size, no controls.
Logistic Regression Coefficients and 95 Percent Credible Intervals Predicting Probability of Attending Weekly.

Source: National Congregations Study 1998, 2006, and 2012 and General Social Survey 1998, 2000, 2006, and 2012.
Note: Coefficients in bold indicate a 95 percent credible interval that does not contain zero.
For white Conservative Protestants, there is evidence of a small negative relationship between size and the probability of weekly attendance, but the relationship is not credibly different from zero. For white Mainline Protestants, the models demonstrate a significant, negative relationship. The probability of attending a congregation of 50 is 0.40, attending a congregation of 1,000 is 0.32, attending a congregation of 5,000 is 0.30, and attending a congregation of 10,000 is 0.25—a decline of 38 percent. The pattern is similar among black Protestants. In a congregation of 50 attenders, the probability of attendance is 0.52; in a congregation of 1,000, the probability is 0.48; and in a congregation of 10,000, the probability is 0.40, a total decline of 23 percent.
A different pattern emerges for Roman Catholics. There is initially a positive relationship between size and attendance, but then it becomes negative at around the 500-attender mark. For Catholics, size is positively related to the probability that an individual will attend weekly for congregations with fewer than 500 participants, increasing 18 percent from 0.40 for those attending a congregation with 50 participants to 0.47 with a congregation of 500 participants (where the probability hits its maximum). From there, the relationship is negative: For a congregation with 1,000 attenders the probability of weekly attendance is 0.44; for 5,000 attenders, the probability is 0.40; and for 10,000 attenders, the probability is 0.33, a total decline from the peak of 38 percent.
I then consider whether any key respondent or congregational characteristics are mediating this relationship between the probability of weekly attendance and size. As shown both in Table 4 and Figure 2, in all cases, adding the control variables does little to alter the observed relationship between size and the probability of weekly attendance. In all models, the coefficients on A and A1 (the group-level coefficients on lognum and lognum2) remain significant and similar in magnitude.

Plot showing predicted probability of weekly attendance by religious tradition by log of congregational size, controls (excluding staff ratio) included.
Discussion and Conclusions
In this study, I uncover a negative relationship between church size and the probability of attending weekly. I found modest differences in this association across traditions, but in all cases, the relationship is negative. I also found little evidence that this trend was mediated by the characteristics of the respondent. The results show that there is a small negative association between size and attendance for white Conservative Protestants but that it is not statistically significant. For white Mainline and black Protestants the models demonstrate that a strong, negative relationship exists between size and the probability of attendance. For Catholics the model indicates a modest positive relationship initially, which then turns negative for congregations with more than 500 participants. The addition of control variables does little to change these patterns. Taken as a whole, these results fit within the theoretical perspective that argues smaller groups have an easier time promoting group cohesion and participation due to the greater density of social relationships contained within smaller organizations. It is also likely true that people who are less frequent attenders may gravitate to larger congregations where they do not face the same pressures to attend more frequently. Congregational resources—at least insofar as the ratio of staff members to number of attenders capture resources—do not mediate this relationship, which suggests that more general organizational dynamics are driving this result.
Placed in the context of previous findings, what insights do these results reveal? First of all, there is no evidence that large churches either promote more frequent attendance or attract more frequent attenders. The only models that indicate a credible, positive relationship is among Roman Catholic congregations with 50 to 500 attenders. It is possible that this positive relationship is related to the fact that many small Catholic churches do not have priests assigned to their congregations. A larger congregation is more likely to have a full- or part-time priest assigned to the parish, which may result in higher participation. However, overall, the coefficient on staff-to-attender ratio was negative, which speaks against this theory. For all other cases, the models do not predict that size and attendance have a positive relationship. Among Conservative Protestants I do not observe a significant negative relationship between size and the probability of attendance, which may suggest that these types of congregations are able to overcome the penalties associated with size. But overcoming the penalty associated with size is not the same as reversing the trend. One possible explanation is that Conservative Protestant congregations often heavily promote “small group” programs, where members participate in more intimate study groups, which may compensate for any penalities associated with size (Dougherty and Whitehead 2011). I attempted to capture this effect by adding the number of groups and the level of participation in these groups, but the controls did not alter the size-attendance relationship. This could simply be because these groups are extremely heterogeneous across congregations and religious traditions, making any relationship difficult to detect with the available data. It is also possible that White Conservative Protestants overreport their attendance more than other groups (Brenner 2011). This could also explain why the negative relationship is not statistically significant. Overreporting of weekly attendance results in more people’s reporting more frequent attendance, biasing the estimates upward. Further research could explore whether evangelical churches are bucking the trend or the weaker size-attendance relationship is present due to overreporting.
It does not appear that congregational resources mediate the size-attendance relationship. This is the motivation behind model 3 in Table 3, where I added number of staff per attender as a proxy for congregational resources. Staff members are a key congregational resource. Most clergy spend a significant proportion of their time promoting community cohesion and creating opportunities for involvement. However, adding this variable did not change the overall relationship between size and attendance. In addition, the coefficient on staff was significantly negative. This is consistent with the possibility that congregations add staff to compensate for decreased participation among the membership or that congregations with more staff attract people who are looking for a place where they can be less involved and see staff as a signal that paid, as opposed to volunteer, workers perform more of the core functions of the organization.
From this study, I cannot make definitive statements about the underlying causes for these patterns I observed. One likely pathway is that people who are less frequent attenders of religious services attend larger churches where they are more anonymous and do not face the social pressures to attend more frequently or social sanctions if they attend less frequently. Another possibility is that people who attend large churches find fewer personal connections in these environments and do not become as attached to the organization as they would in other settings. It may also be that in larger churches, because they offer a wider array of small-group programs, people, given limited discretionary time, might use small-group attendance as a substitute for worship attendance. As already alluded to, neither the GSS nor the NCS provides sufficient detail on group involvement to test this theory. In addition, the other major multilevel survey on congregations and participants, the USCLS—while it has more extensive information about congregational participation—is mostly made up of respondents who attend frequently. It does not contain sufficient variation to make strong claims about the impact of small groups on attendance (Dougherty 2004). Also, as the analysis relies on cross-sectional survey data, I cannot use these data to determine whether small group involvement, in and of itself, is related to an increase in attendance at services.
The fact that adding controls to the model did little to mediate the relationship between size and weekly attendance suggests that there is no significant relationship between any of the control variables and the size-attendance relationship. This finding is somewhat unexpected because previous research has shown that size is related to socioeconomic status (SES) (Eagle 2012) and SES is related to attendance (Schwadel, McCarthy, and Nelsen 2009). However, given these results, it appears that the size-attendance and SES-attendance relationships are independent from one another.
This research represents a major advance over previous studies because it combines information across the four major Christian religious traditions in the United States. Previous studies have focused on individual denominations or religious traditions. The fact that I found that the relationship between size and attendance is relatively consistent and negative across religious traditions raises questions about studies that identify a positive relationship between size and member participation. This research also allows for a more coherent theoretical framework to be applied to the connection between religious participation and congregational size. The fact that organizational characteristics vary considerably across religious groups, but the overall relationship between size and attendance is negative, suggests that more general organizational dynamics govern this trend. Simmel’s (1902) basic insights about the relationship between size and member participation continue to provide a compelling conceptual framework to understand these social dynamics.
Footnotes
Acknowledgements
The author would like to thank Mark Chaves, Lisa Keister, Jen’nan Read, and Grant Wacker for their helpful comments about this article.
Declaration of Conflicting Interests
The author(s) declared no potential conflicts of interest with respect to the research, authorship, and/or publication of this article.
Funding
The author(s) disclosed receipt of the following financial support for the research, authorship, and/or publication of this article: The research for this article was funded, in part, by the Social Sciences of Humanities Research Council of Canada.