
Abstract
Despite widespread use in survey research, the accuracy and validity of self-reported church attendance questions have often been debated. Since the seminal article by Hadaway et al. (1993), that this indicator leads to an overestimation of the number of regular churchgoers has entered common knowledge. However, no systematic work to improve the understanding and command of the measurement instrument has been carried out. This contribution analyses the effect of different formulations of the self-reported church attendance question in online questionnaires, by means of survey experiments on a sample of Italian Catholics. In particular the most common ‘how often’ version of the question is compared to an alternative version asking how many times respondents went to church in the last month. The experimental results show that, despite criticism, the ‘how often’ version remains the best option for obtaining information on individual religious practice in survey research. This version is robust to changes in the formulation of answer categories and produces more informative results for respondents with low attendance. Finally, the study supplies evidence consistent with the growing body of literature that underlines the role of religious identity and self-conception in answering questions on church attendance.
Introduction
Already at the end of the 1980s, Andrew Greeley described self-reported church attendance as ‘the classic measure of religious participation’ (1989: 42). In fact, if a survey includes any questions about religiosity then self-reported church attendance is sure to be present. In survey research, the indicator is used either to measure religiosity as an individual property, often in relation with other dimensions like mental health, social and familial conditions, politics, etc. (Elff, 2009; Immerzeel and Van Tubergen, 2013; Smith et al., 2003; Thornton et al., 1992), or to estimate the share of churchgoers in the reference population or in specific sub-groups (Kaufmann et al., 2011; Norris and Inglehart, 2011; Van Ingen and Moor, 2015; Voas and Chaves, 2016).
Despite its universal use, the accuracy and validity of this indicator have often been debated. Since the seminal article by Hadaway et al., (1993), many critics have underlined the fact that the indicator leads to the overestimation of the number of regular churchgoers, due to survey respondents overreporting their church attendance (Smith, 1998; Presser and Stinson, 1998). The evidence to support this argument, coming almost exclusively from the United States, has been based on the comparison of survey estimates to figures obtained by adopting alternative ways to count the number of people going to church in a given period, usually a week (Chaves and Cavendish, 1994; Hadaway and Marler, 2005; Hadaway et al., 1993). The bias has usually been attributed to two possible cognitive mechanisms. Firstly, social desirability bias (SDB), related to the social norms of a given society or social group (Hadaway et al., 1993: 748–749). Secondly, telescoping effects, or the tendency to place events or behaviour closer in time than when they actually happened (Bradburn et al., 1987; Hadaway et al., 1993).
Although these results have earned the status of received wisdom in survey research, the alternative methods used to obtain results are not immune from criticism. Some scholars have underlined the problems of validity and reliability that headcount methods encounter (Hout and Greeley, 1998; Smith, 1998; Woodberry, 1998). Other scholars have noted that, considering time diaries for countries beyond the United States, the overrepresentation of churchgoers could be less severe that what has been commonly believed (Brenner, 2011a; Hout and Greeley, 1998).
Beside these reasons for caution in evaluating the results of alternative methods, the crucial point is that while those methods focus on estimating the proportion of people attending church (Hadaway and Marler, 2005) they do not solve the problem of measuring church attendance in survey research, where, in fact, there are no realistic alternatives to the self-reported church attendance questions. Thus, the understanding of the working principles of those instruments and their improvement remain relevant issues that, in the opinion of the authors, have not yet received sufficient attention.
This contribution analyses the effect of different formulations of the self-reported church attendance question when administered through an online questionnaire. We do so by running two survey experiments on a sample of Italian respondents coming from a commercial online panel.
The first experiment looks at the effect of varying the format of the answer categories, in both number and wording, assuming that these features can produce expectations about the distribution of the behaviour and therefore affect the perception of its social desirability (Schwarz et al., 1985). The second experiment compares the outcomes of the most common ‘how often’ (HO) version of the question on self-reported church attendance to an alternative version asking how many times respondents went to church in the last month. The assumption is that the latter formulation, asking for an enumeration of events, focuses more on behaviour thus alleviating SDB (Brenner, 2011a; Smith, 1998).
The online setting in which the experiments are run partly constrains the generality of our study, as the mode has been indicated as one of the factors that can affect answers to a given question (Presser and Stinson, 1998). Though, this limitation is compensated by the increasing relevance of the online mode in survey research (Callegaro et al., 2015).
The geographical boundaries of our study go beyond the US context from where most known and discussed empirical evidence on self-reported church attendance come from. Our experiments are administered to a sample of Italian Catholic respondents, selected from a larger sample by means of a filter question on religious affiliation preceding the question about church attendance. This choice is consistent with the national context where the study is carried out: Italy is universally recognized as a religiously homogeneous country, with an abundant majority of Catholics detected in all surveys, from the 1960s onward. Moreover, the selection of a single religious denomination, assuring the possibility to focus on a more homogeneous population, is a well-established practice in academic literature dealing with the study of church attendance (Chaves and Cavendish, 1994; Hadaway et al., 1993).
The two experiments were run on the same individuals but on separate occasions, following a panel design. This is a significant advantage of our study, as it allows for a multiple indicator strategy drastically reducing problems caused by memory effects. The joint analysis of alternative measures offers an opportunity for a deeper look into their reliability and helps us understand the meaning attributed by the respondents to the survey answers (Voas, 2015).
The general idea behind this study is that the question on self-reported church attendance, as well as any other survey question or battery of questions meant to gauge a particular property, represents a measurement instrument, which needs accuracy and reliability. The fine-tuning obtained by testing slightly different formulations of the answer categories, or comparing the outcomes of one version against an alternative one, goes precisely in the direction of calibrating the measurement instrument. This operation has several advantages: it assures an improved understanding and command of the instrument at stake; it offers the possibility to understand better the cognitive mechanisms underlying the act of answering survey questions; it teaches researchers more about the particular property targeted by the questions (Brenner and DeLamater, 2016). Finally, our study also aims at supplying a sound basis for decisions concerning the harmonization of data coming from differently formulated church attendance questions, providing empirical arguments to the feasibility of these procedures.
Measuring church attendance in survey research: The state of the art
Different formulations of the question on self-reported church attendance can be found in surveys. One version is stated as a HO question and asks for the general frequency of attendance at religious services. The simplest version of this question reads: ‘How often do you attend religious services?’. 1 An alternative version, the ‘how many times’ (HMT) question, asks the number of occasions on which a person went to church in a given period. 2 Finally, there is the question asking whether a person attended church in the last week, which has become known as the Gallup formulation 3 (Hadaway et al., 1993: 741).
These questions are substantially different in cognitive terms. The HO version refers to the frequency of a behaviour and implicitly relies on an occurrence rate processing obtained without recalling any specific episode of attendance at a church service. The HMT version implies an enumeration (Blair and Burton, 1987), while the Gallup formulation asks for the recall of an event over a short period of time. The latter formulations, with their time-specific indication, are believed to reduce social desirability pressures (Chaves and Cavendish, 1994; Hadaway et al., 1993). In particular, the Gallup formulation has been preferred when comparing survey results to alternative methods like headcounts. 4 Nonetheless the HO version is by far the most common formulation. A question of this kind is present in practically every survey which includes questions on religion, and surely in all multi-purpose longitudinal studies, both national and cross-national (Brenner, 2016).
Since the 1990s, following the appearance of a number of studies challenging the validity of survey questions to estimate churchgoers, these questions have increasingly been looked on with suspicion and it has become conventional wisdom, at least in the United States, to consider that they overestimate church attendance as a result of overreporting. The biases in the survey questions have been evidenced by means of alternative methods to estimate church attendance. These methods range from rates based on counts of actual attendees to time diaries (Brenner, 2011a; Smith, 1998; Rossi and Scappini, 2011). At first, these studies concerned parts of the United States, focusing especially on the comparison between survey data and headcounts based on figures obtained either from churches or dioceses or direct counts by the researchers (Chaves and Cavendish, 1994; Hadaway, Marler and Chaves, 1993). The outcome of the comparison was dramatic, with an estimated overreporting of the surveys by a factor of 2 to 1. While these results gained large popularity, they were also criticized as being overstated. The criticism, on the one hand, underlined the role of sampling errors (Woodberry, 1998) and, on the other, questioned the validity of the headcount methods, thus suggesting the presence of a far smaller gap between different methods (Hout and Greeley, 1998; Smith, 1998). More recently, studies comparing survey data and diaries have addressed the issue of US exceptionalism in terms of overreporting church attendance in surveys (Brenner, 2011a). They have found that although the bias is present in several countries, its size is substantially significant only in the US and parts of Canada.
Different explanations have been suggested to explain the overreporting of church attendance in surveys. The first studies have mainly focused on cognitive mechanisms biasing survey answers. In particular, social desirability has often been mentioned as a source of potential distortion, assuming the existence of a social norm that attaches a positive connotation to participation in the activities of a religious community (Hadaway et al., 1993; Smith, 1998). Especially for the US, but also for Italy (Castegnaro and Dalla Zuanna, 2006), this has been considered a likely explanation for overreporting. Moreover, it has been suggested that SDB can increase through time if the effect of the moral norm persists while the actual religious practice declines, making SDB a more serious threat to the accuracy of the estimates of church attendance through self-reported questions (Hadaway et al., 1993).
Other researchers have put forward alternative explanations focusing on the meaning given to the question by the respondents in the survey setting, holding that ‘people tend to understand phrases like “attend religious services” inclusively, and not as referring only to attending a regular worship service’ (Smith, 1998: 135). This broadening of the meaning of the question may lead respondents to include activities done in church beyond personally attending worship services. Other researchers pointed to problems in the understanding of the question, as ‘reporting error may also be stimulated by misinterpretation at the comprehension stage. For example, “Did you attend church?” might be interpreted to mean “Are you a good Christian?”’ (Presser and Stinson, 1998). More recently, Brenner has given a reading based on the fact that, when answering church attendance questions in surveys, the role of religious identity and self-conception prevail over actual behaviour (Brenner, 2011a; Brenner, 2012a; Brenner and DeLamater, 2016).
All these explanations take self-reported church attendance as a homogeneous entity, and not much is said about the different possible formulations of the question. In fact, a systematic analysis of the working of self-reported church attendance questions has failed to emerge, if we except a review of the sparse experimental material available (Smith, 1998) and a recent publication of Brenner and DeLamater (2016). Consequently, very little is known about the actual mechanisms that affect respondents’ answers, especially concerning the precise wording of the question and its answer categories. This is not a secondary issue as practically every survey presents a slightly different wording of the self-reported church attendance question. The variations can be found either in the text of the question 5 or in the answer categories, as well as in the time frame if the question is expressed in HMT terms. Most often, there is not a precise substantive reason behind the choice, rather a deference to the formulation in the previous rounds of a study. This is not uncommon in survey research. However, under these circumstances, it becomes difficult to both compare the outcomes of different studies and to harmonize information coming from different sources to build time series or longitudinal datasets. Consequently, the conclusions of comparative studies on religious change based on data coming from different sources are weakened by the potential lack of equivalence between indicators coming from different surveys. Some efforts to overcome this problem have been made by triangulating results from different sources, studying religious change on a temporal window as long as possible and increasing the number of both data points (surveys) and respondents (Vezzoni and Biolcati-Rinaldi, 2015). However, also in this case, harmonization rests on ad hoc decisions and equivalence of the measures can only be taken as a reasonable assumption (Brenner, 2016).
Data
The experiments on self-reported church attendance were run within the Italian National Election Study (Itanes) online panel 2013–2015. In this period, 6 waves were fielded before and after each major election. 6 The interviews were collected using the CAWI mode (Computer Assisted Web Interviewing) and the questionnaires mainly concerned the political orientation and electoral behavior of the respondents.
The first wave covered the period of the electoral campaign of 2013. The final sample was built by adding daily independent quota samples based on gender, age and residence, from a commercial online community (SWG Research Institute). Each sample amounted to approximately 200 respondents for a total of 8,723 respondents. After the first wave, a subgroup of approximately 3,000 respondents was randomly selected and followed for the subsequent 5 waves. Along the panel, the drop-outs were substituted with respondents coming from the original sample in wave 1. By the end of the 6th wave (June 2015), 1,953 respondents had completed all 6 interviews.
The first experiment was run in the first wave of the panel. The second experiment was run in wave 5. The target population of our experiments is represented by Catholic respondents, selected with a filter question, administered in wave 1 before the church attendance question. The distribution of the filter question is presented in Table 1. The distribution of Catholics in the original sample and in the sub-sample of wave 5 are statistically not distinguishable. 7
Distribution of the affiliation filter question in wave 1.
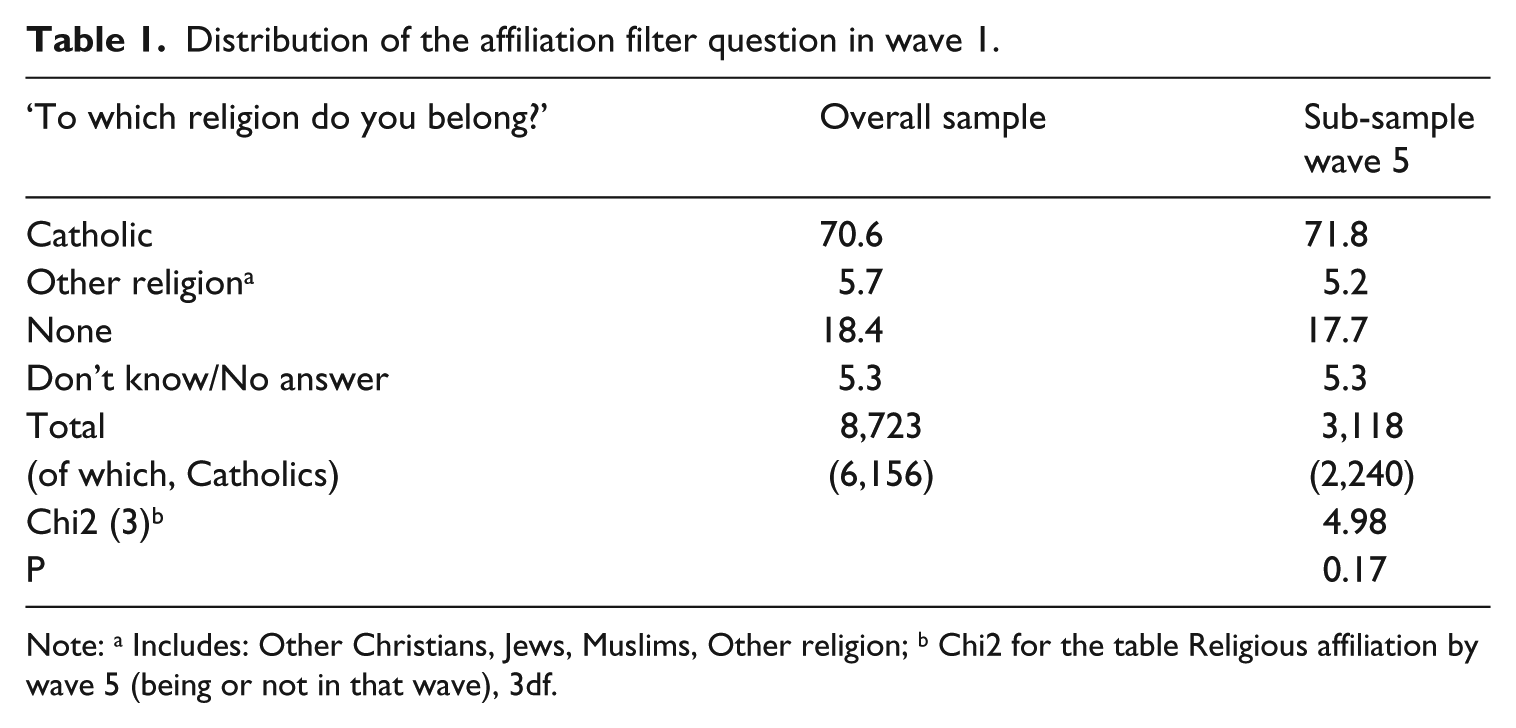
Note: a Includes: Other Christians, Jews, Muslims, Other religion; b Chi2 for the table Religious affiliation by wave 5 (being or not in that wave), 3df.
Experiment 1: Varying answer categories to the standard ‘how often’ question
Description of the experiment
The first experiment explores whether different formulations of the answer categories to the self-reported church attendance question can bias the distribution of the answers, in the direction of an overestimation of regular churchgoers.
The experiment manipulates the answer categories of a standard HO question. Since we are purely dealing with Catholics, the question refers specifically to Mass. This helps the respondents exclude from their minds all the church events that go beyond regular worship, such as individual praying or parish activities. The question reads: Excluding ceremonies (such as weddings, funerals and baptisms) how often do you attend Mass?
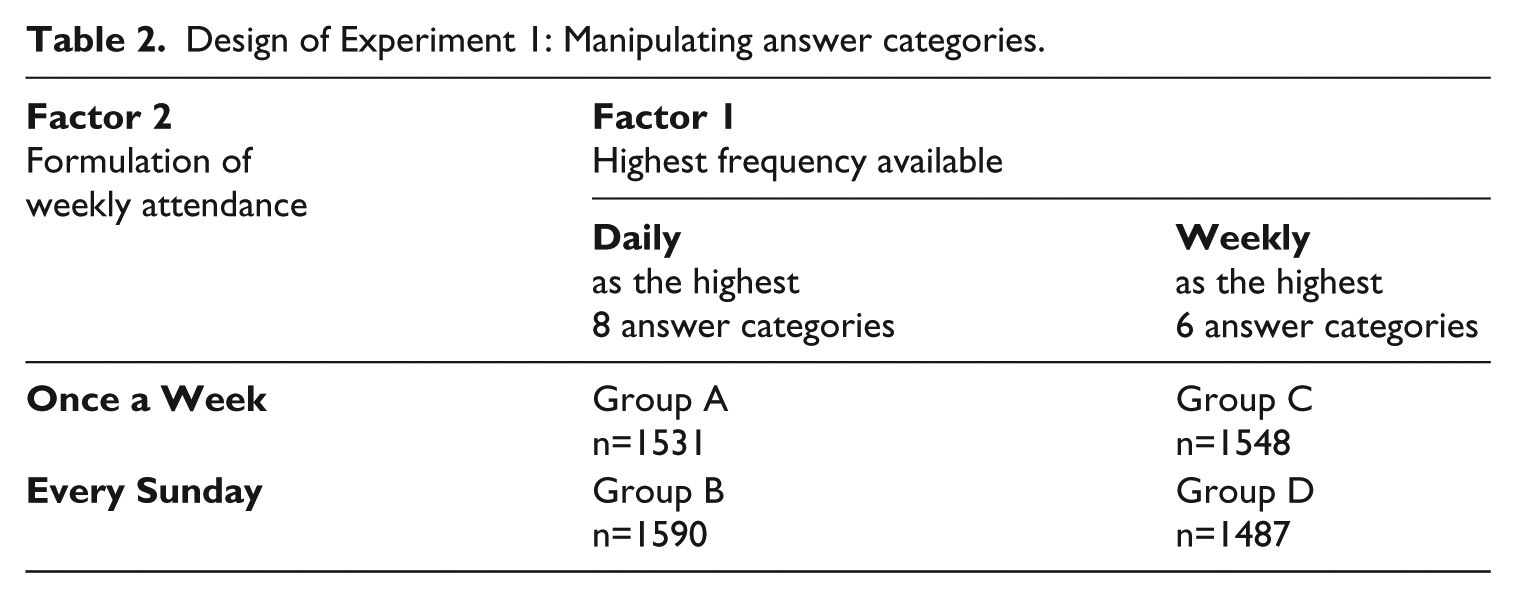
In general, for such a question the lowest attendance frequency is ‘never’; the highest attendance cate1gory can vary. The experiment manipulates the upper bound answer categories with respect to two factors:
a) the highest frequency available to express respondent’s attendance of Mass, either daily or weekly attendance. 8
b) the wording of weekly attendance (the most relevant answer category), expressed either as ‘once a week’ or ‘every Sunday’.
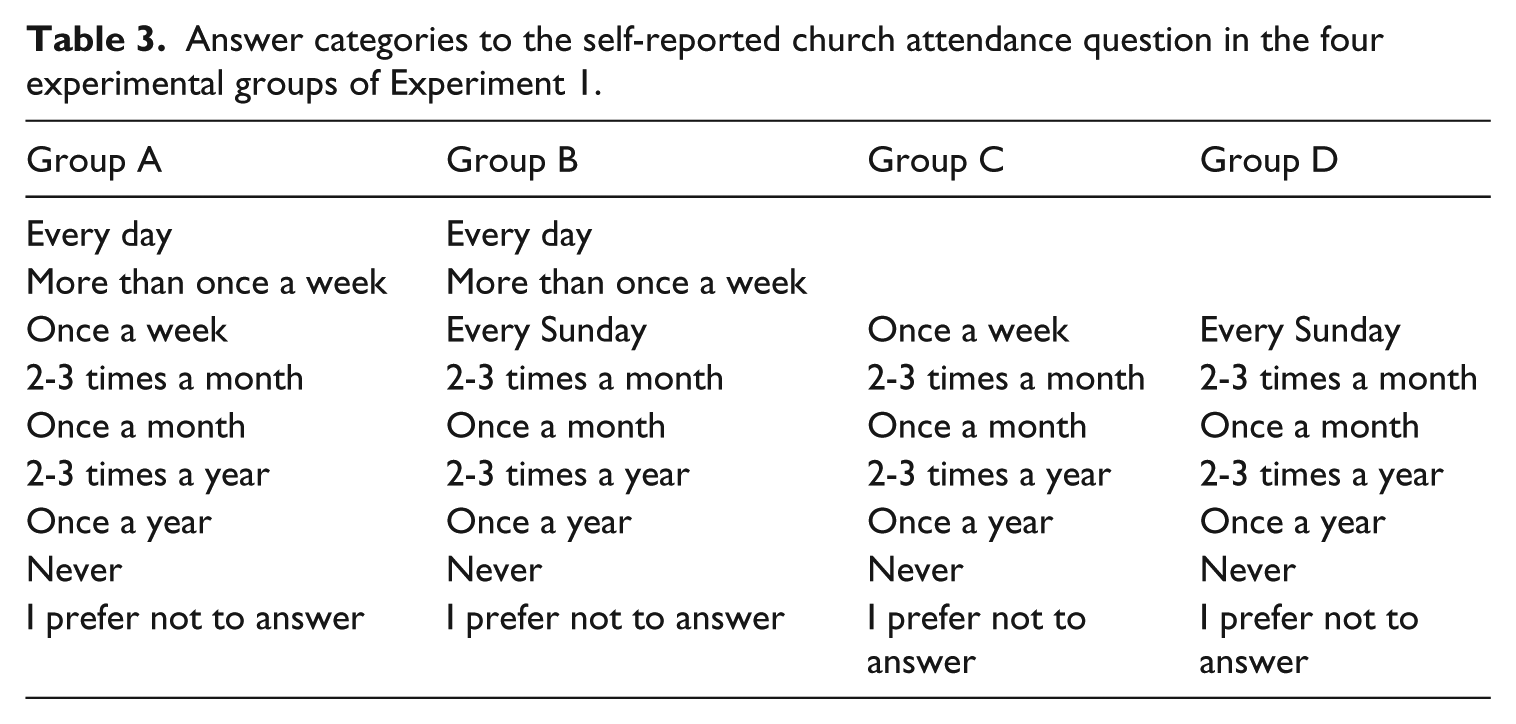
The study thus follows a 2 by 2 factorial design, with respondents randomly attributed to one of the four experimental groups in Table 2. The answer categories offered to each group are shown in Table 3.
Design of Experiment 1: Manipulating answer categories.
Answer categories to the self-reported church attendance question in the four experimental groups of Experiment 1.
Concerning attendance frequencies, a lower upper bound (weekly) could reduce the perception that frequent attendance at Mass is socially desirable (Schwarz et al., 1985). A study on religious change in Italy found some empirical evidence of this effect of different thresholds of attendance frequency (Vezzoni and Biolcati-Rinaldi, 2015). Following these considerations, we hypothesize that a lower upper bound for the answer categories could have an impact on the distribution of the answers.
As far as the wording of weekly attendance is concerned (factor 2), a more precise reference to the Sunday Mass could discourage an inclusive understanding of the question (Smith, 1998), making clear to the respondents that they have to exclude from their answers those church activities that go beyond the Mass. Moreover, a formulation constrained to a specific day (Sunday) and stressing the regularity of the practice (every) could diminish temporally distorted recalls of behaviour (telescoping effects) and further reduce overreporting.
Results
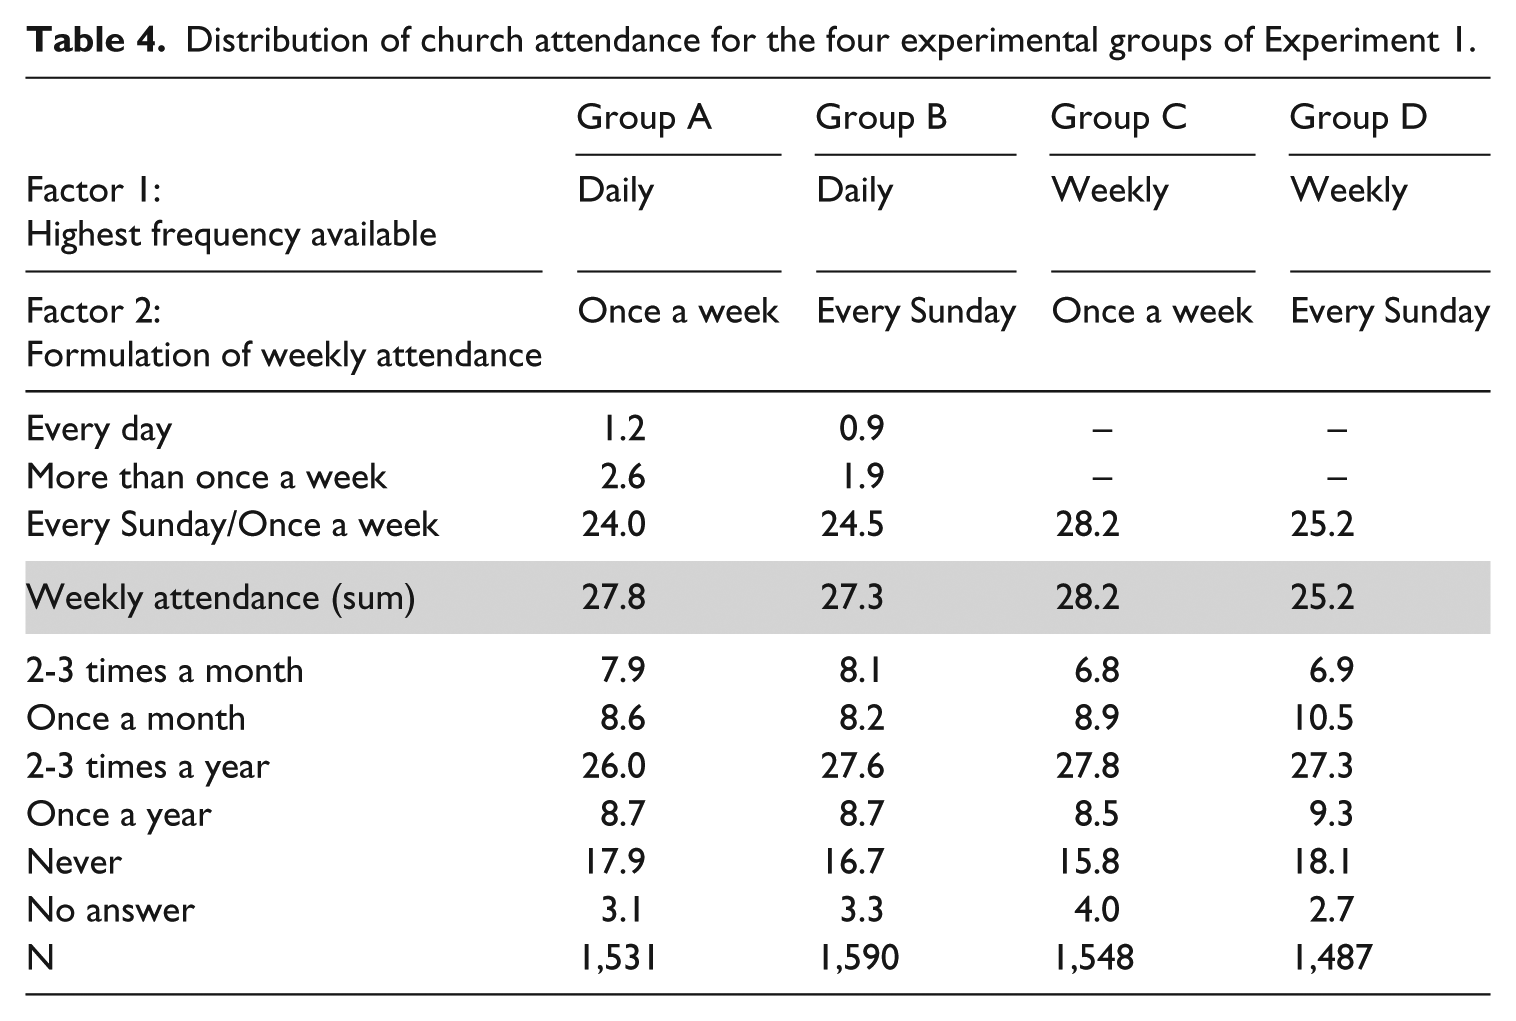
The outcomes of experiment 1 are presented in Table 4. The distributions for the four experimental groups characterized by different sets of answer categories do not look markedly different and this is confirmed by a set of independence tests of all possible relevant comparisons between groups, presented in Table 5.
Distribution of church attendance for the four experimental groups of Experiment 1.
Outcomes of chi-square test for all relevant group comparisons for the distribution of church attendance.
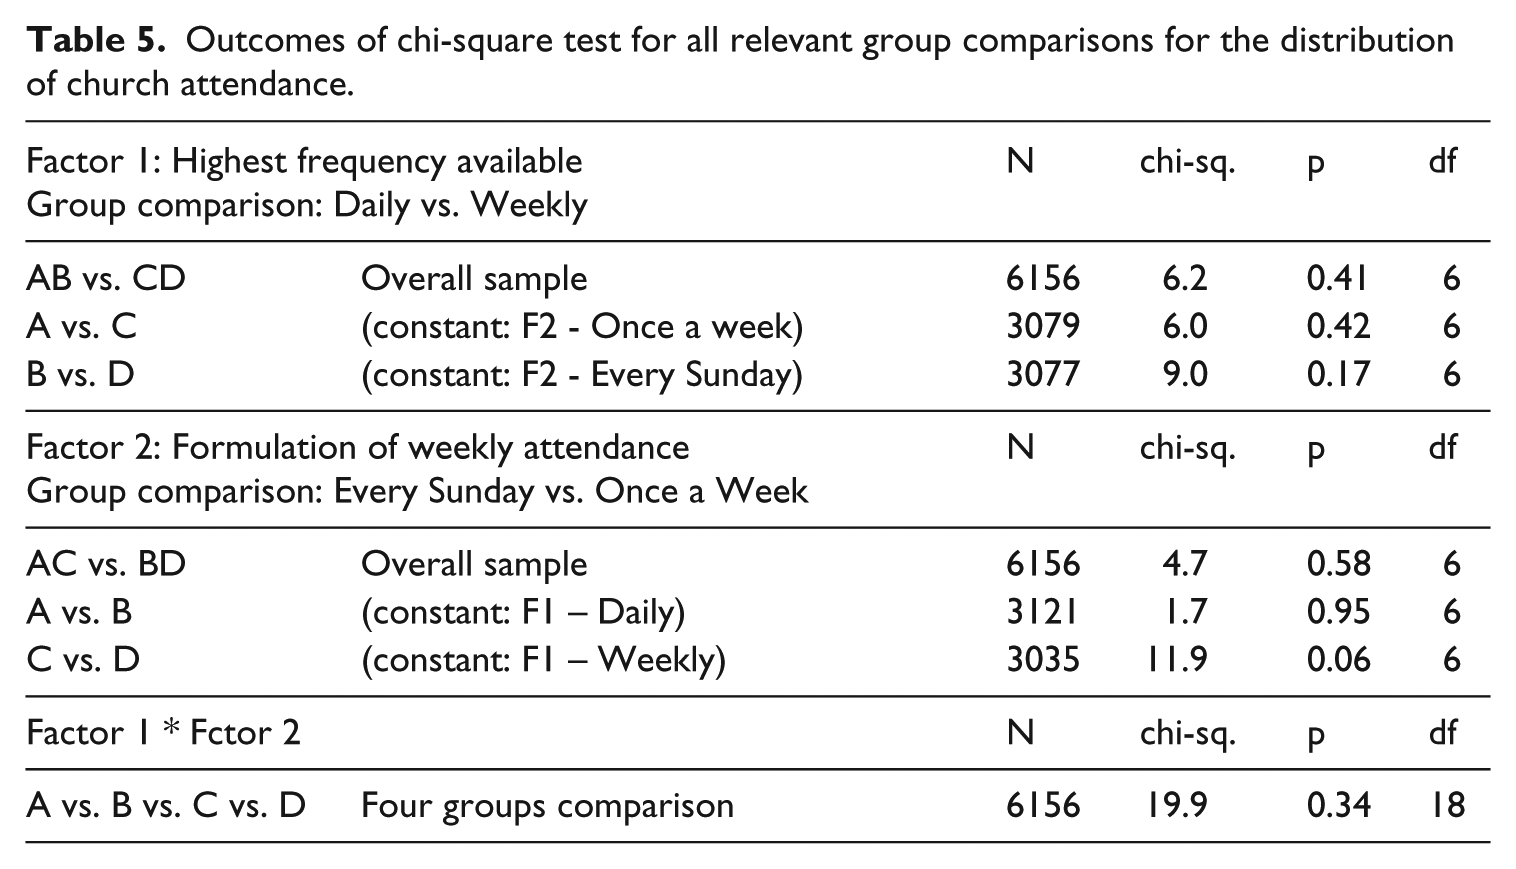
The only group that seems to slightly deviate from the others is group D, where the formulation ‘every Sunday’ connected with a lower frequency threshold seems to collect a smaller number of respondents declaring weekly attendance (25.2%) in line with expectations. However, the outcome shows no significant differences in the distributions at a confidence level of 5%, despite the relatively large number of cases used in the test (> 3000). The outcomes are robust and do not change when performing the tests on dichotomised distributions, either ‘at least weekly attendance’ vs. ‘the rest’ or ‘at least monthly attendance’ vs. ‘the rest’. 9
Against expectations, thus, the analysis of the first experiment suggests that in a self-administered interview (CAWI) the format of the answer categories of the standard HO self-reported church attendance question does not make any difference to the distribution of the answers. In particular it does not significantly affect the estimates for the proportion of weekly churchgoers. In the light of this outcome, we can conclude that the four sets of answer categories proposed are equivalent.
The first important implication of this outcome, when harmonizing church attendance indicators that present misalignment between answer categories, is that it shows that differences in the highest category option do not affect the estimates of the proportion of weekly church attendance. The data coming from the four experimental conditions can be joined together in a unique measure of church attendance, ranging from weekly to never, to be used in further analysis.
Table 4 also shows that the answer categories above weekly attendance are endorsed by very few respondents. It follows that, if a piece of research is not bound by previous choices, the most efficient set of answer categories to include in a questionnaire is the one starting from weekly attendance, skipping more frequent answer options. For the sake of correctness, to avoid a situation where those respondents who go to church more often than once a week do not find a corresponding answer category, it is sufficient to add ‘or more often’ to the weekly attendance option.
Experiment 2: Comparing different formulations of the self-reported church attendance
Description of the experiment
The second experiment compares the most common formulation of self-reported church attendance, that is the HO question, with a HMT formulation, that asks to report the number of times the respondent went to church in the last month.
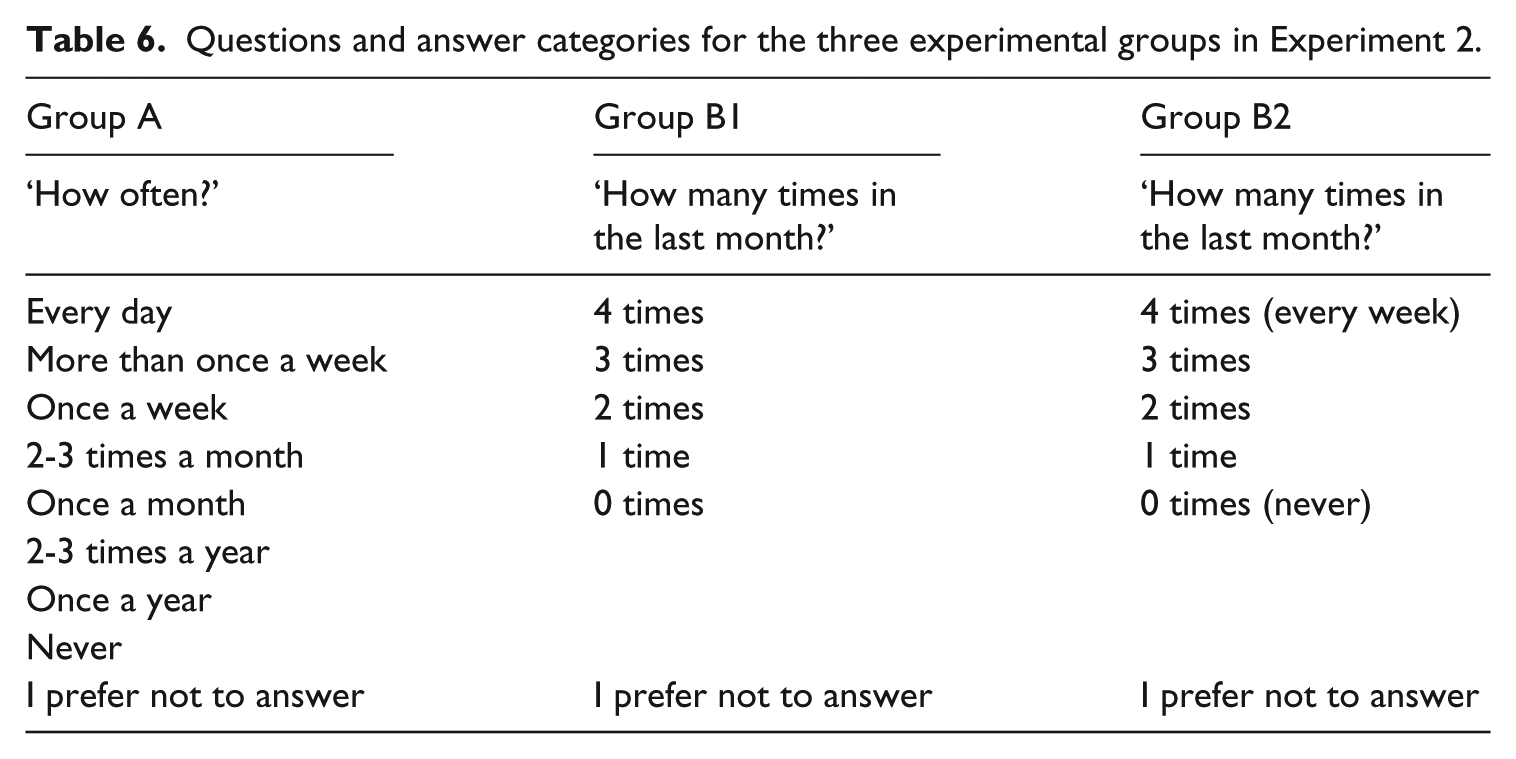
The respondents were randomly sorted into three groups. The first group (control group) get the HO question, worded as in experiment 1, group A. The remaining two groups (treatment) receive the alternative formulation. The treatment groups were differentiated because, for the extreme answer categories (4 times or 0 times), one group also got the verbal description (‘every week’ and ‘never’) while the other group only got the number of times. The alternative formulation reads as follow: In the last month, how many times did you attend Sunday Mass (or pre-festivity Mass) or religious services?
The wording of the question included the specification of the pre-festivity Mass, usually the Saturday afternoon Mass, to allow for comparison with the standard formulation that indicates ‘once a week’ for the weekly attendance. The analysis is limited to only Catholic respondents.
The three experimental groups are shown in Table 6. 10
Questions and answer categories for the three experimental groups in Experiment 2.
Although not proven explicitly, the HO question has been often indicated as more vulnerable to overreporting compared to its HMT counterparts. A possible source of discrepancies between formulations could rest on the different cognitive mechanisms that the two versions activate. It has been hypothesized that HO questions more often stimulate answers in terms of rates of occurrence, while HMT questions are more likely to activate processing by enumeration of events. The evidence to support this hypothesis is not strong when the questions are open ended (Blair and Burton, 1987). However, the effect is prompted by the directivity of close-ended questions, with answer categories that reflect the implied cognitive processes presumably activated by each formulation. 11 On top of that, longer time frames that contemplate larger numbers of events to report make more likely the use of some form of occurrence rate to answer frequency questions (Blair and Burton, 1987). This could indeed be the case for our HO question. If so, the answers given by respondents going often to church would not strictly represent a statement about the unconditional attendance at Mass every Sunday. It would rather reflect the estimate a respondent makes on a somewhat undefined time frame, allowing for exceptions to the individual general rule (Burton and Blair, 1991). In the case of Catholics, this individual general rule also has a doctrinal counterpart, that is weekly attendance. Attendance at Sunday Mass (or, alternatively, at the pre-festivity Mass) is a precept of the Catholic doctrine and clearly represents a religious norm. When answering to the HO question, thus, beside the actual frequency of the behaviour, one can also indicate his/her ideal adherence to the precept. The joint effect of occurrence rate mechanism and the special meaning of the weekly attendance option could lead to a higher proportion of respondents with this answer on the HO formulation. These biases do not apply to the HMT formulation. Along with close-ended answer and on short time frames, this formulation is likely to activate some form of enumeration of events processing that, especially for a high frequency of attendance, seems to produce a more accurate and realistic report of the behaviour at stake, here church attendance (Blair and Burton, 1987).
Results
First, we notice that indicating the verbal expression of frequency in the HMT question does not make any difference (comparison between groups B1 and B2: Pearson chi-square (5) = 8.23 Pr = 0.14). Therefore, in the following discussion, we will join the two groups B1 and B2. 12 The distributions of the answers to the two versions of the question are thus presented in Table 7.
Distribution of the answers in the two versions of the question on church attendance in Experiment 2 (column %).
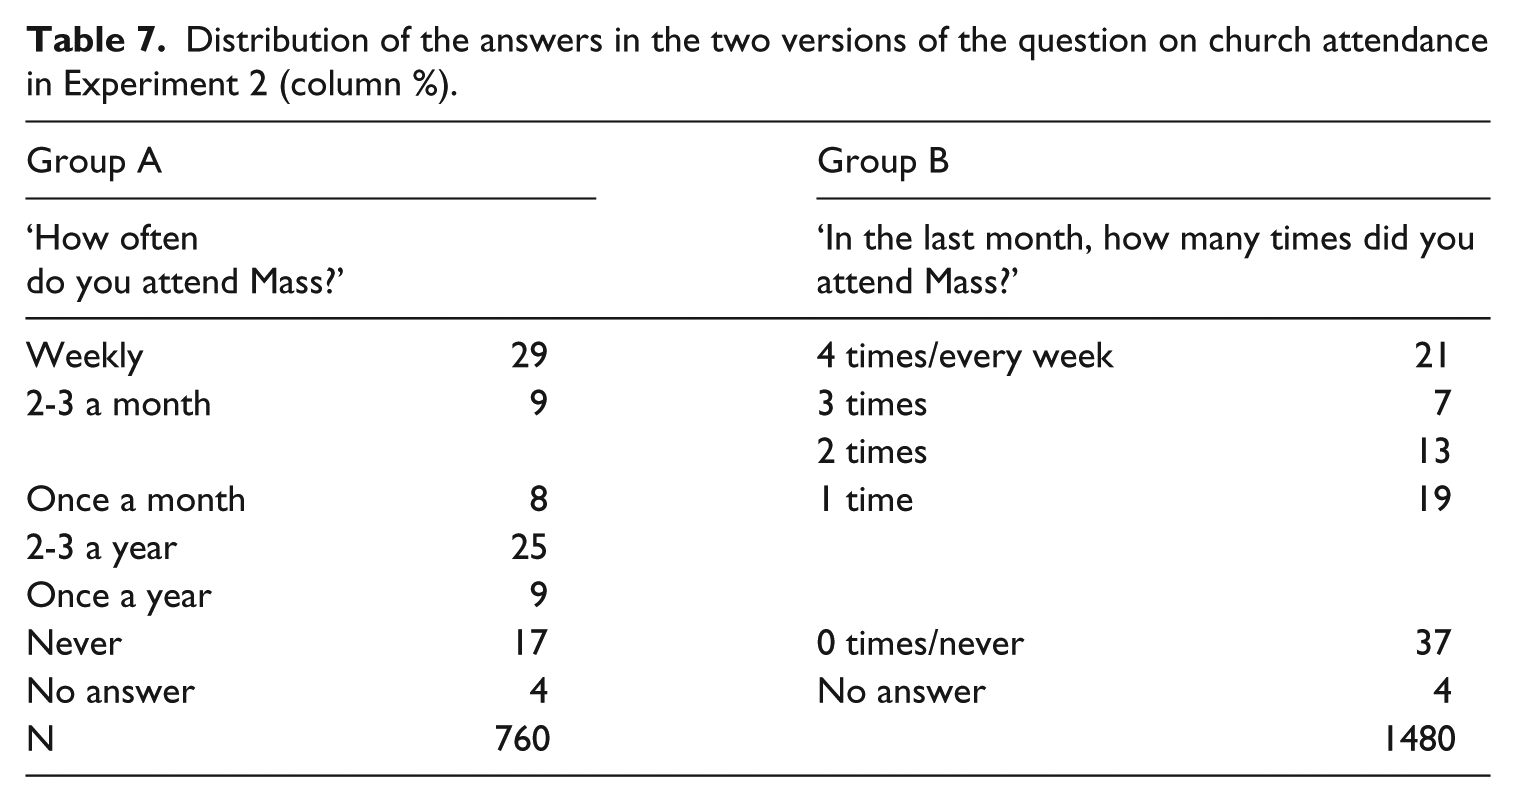
In line with our expectation, the proportion of respondents declaring their church attendance as ‘weekly’ in the HO question is much higher than the proportion stating to have attended Mass 4 times in the last month (29% vs. 21%) and the difference is statistically significant. On the other hand, if we look more broadly at ‘regular and frequent’ attendance (people going to church twice a month or more) (Brenner, 2011a: 23), the outcomes for the two formulations are close, with even a slightly larger proportion for the HMT versions (38% vs. 40%). The difference is not statistically significant. This has consequences for the estimates of regular churchgoers: the two questions work differently when focusing on weekly attendance but, when defining ‘regular churchgoers’ more broadly, they produce statistically identical results. The estimates of the proportion of churchgoers in our experimental groups, following these two different definitions, are presented in Table 8.
Point estimates and confidence intervals (c.i.) for regular churchgoers in wave 5 by formulation of the church attendance question.
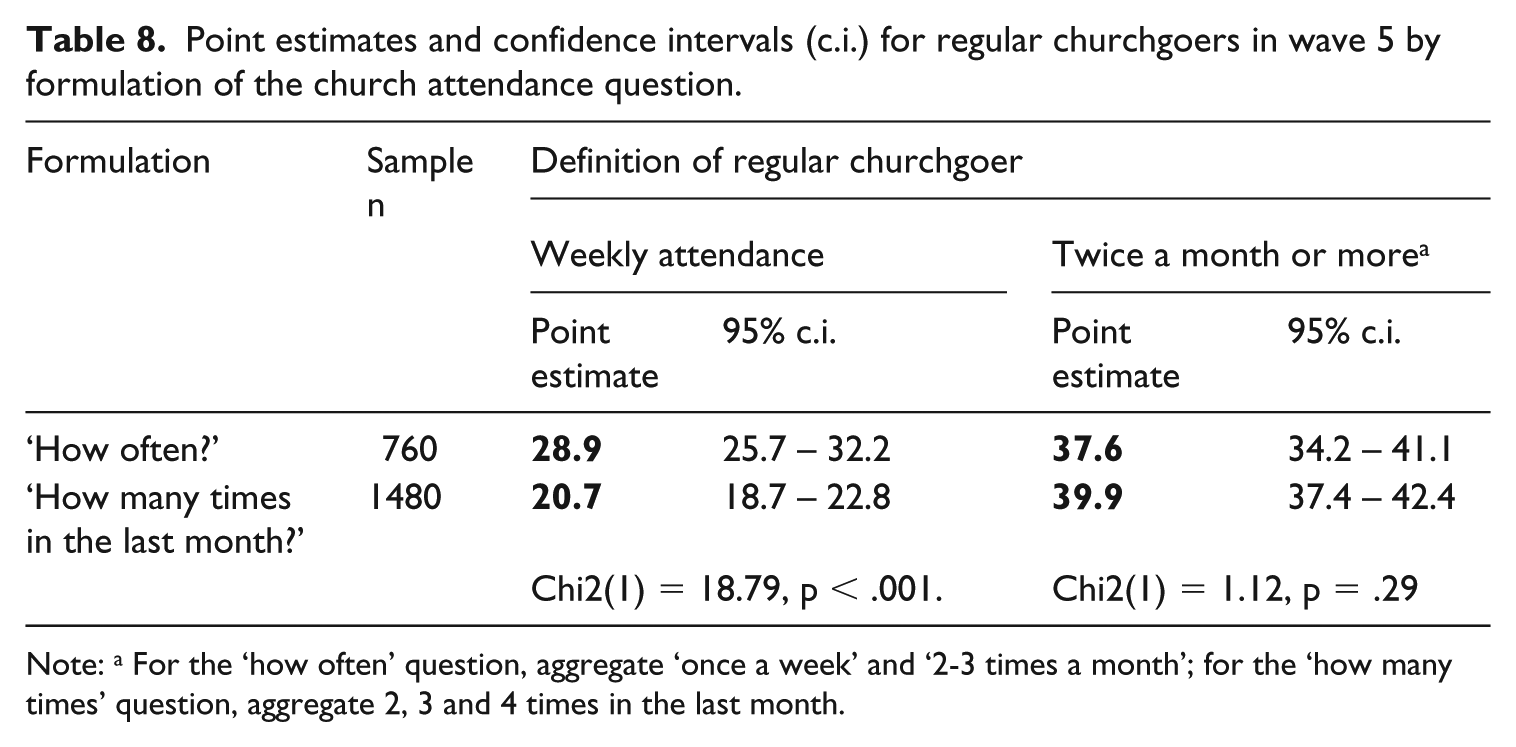
Note: a For the ‘how often’ question, aggregate ‘once a week’ and ‘2-3 times a month’; for the ‘how many times’ question, aggregate 2, 3 and 4 times in the last month.
The comparison of the rest of the distributions is less straightforward, as the correspondences between the remaining answer categories for the two formulations is often ambiguous. At first, it seems that the HMT version produces a much higher proportion of respondents who declare that they never attend Mass (37% vs. 17%). Yet someone not having attended any Mass in the last month (0 times) could be someone who never goes to church or, equally, someone attending only sporadically (2-3 times a year or once a year in a HO question). This is a general problem with questions on a certain behaviour put in terms of ‘How many times did you do x in a specific period’. If a respondent reports 0 times, no further information on that behaviour is available beyond the specific time frame of the question. In the case of church attendance, the most extreme consequences of this type occur when the question is formulated to refer to the last seven days, as in the Gallup questionnaires. The question is surely straight and clear, and collect unambiguous information (yes is yes, no is no). However, it leaves us with nothing to say about those who did not go to church during the last week. Those ‘zeros’ could be regular churchgoers who were sick or, conversely, diehard atheists. The problem is less severe in the formulation applied in our experiment, as the period was extended to a month. Nonetheless, about one in three respondents belonging to group B said not to have been to Mass in the last month. This remains the only hint we have about the religious practice of this group.
For the HO question, the percentage of ‘never’ is otherwise less than 20%, while a substantial portion of respondents indicate frequencies of church attendance ranging from 1 to 3 times a year (around 35%).
The same difficulty in establishing a correspondence holds for the respondents of group B answering ‘1 time in the last month’ (19%). Those people may regularly be going to church once a month (a group corresponding to 8% in the HO formulation) and, coherently, have indeed been to Mass once in the last month. Or, they may go to church less regularly, but nonetheless attended one Mass in the month before the survey (35% of the respondents in the HO question).
The difficulties in interpreting the answers at the bottom of the scale in the HMT question are not a problem if the aim of the study is to estimate the proportion of regular churchgoers. However, they become an issue if a researcher wants to use the question as an indicator of individual religiosity. This is possibly one of the reasons that brought the HO question to prevail in most of the questionnaires in comparative longitudinal studies. In the next section, exploiting the panel nature of our data, we analyse the joint distribution of the answers given by the same respondents to the two questions and we explore the mechanisms that potentially underlie discrepancies in reporting church attendance depending on the formulation of the question.
Repeated measure evaluation
As explained above, the two experiments were administered on different occasions and some respondents answered to both versions of the church attendance question at different points in time. The joint analysis of these answers makes it possible to compare how the same person responds to different formulations of the church attendance question. This helps us to better understand the relations that exist between the two formulations and to interpret more precisely the respondents’ answers. The HO question has often been indicated as more vulnerable to SDB and, in turn, to overreporting. If this is the case, this formulation should lead to a systematic overreporting of church attendance.
Table 9 presents the joint distribution of the answers to the two questions, where the framed cells indicate the coherent combinations of answers to the two questions. 13 It is clear that the answers of the respondents are not always coherent. 14
‘How many times’ answers, wave 5, by ‘how often’ answers, wave 1 (column %).
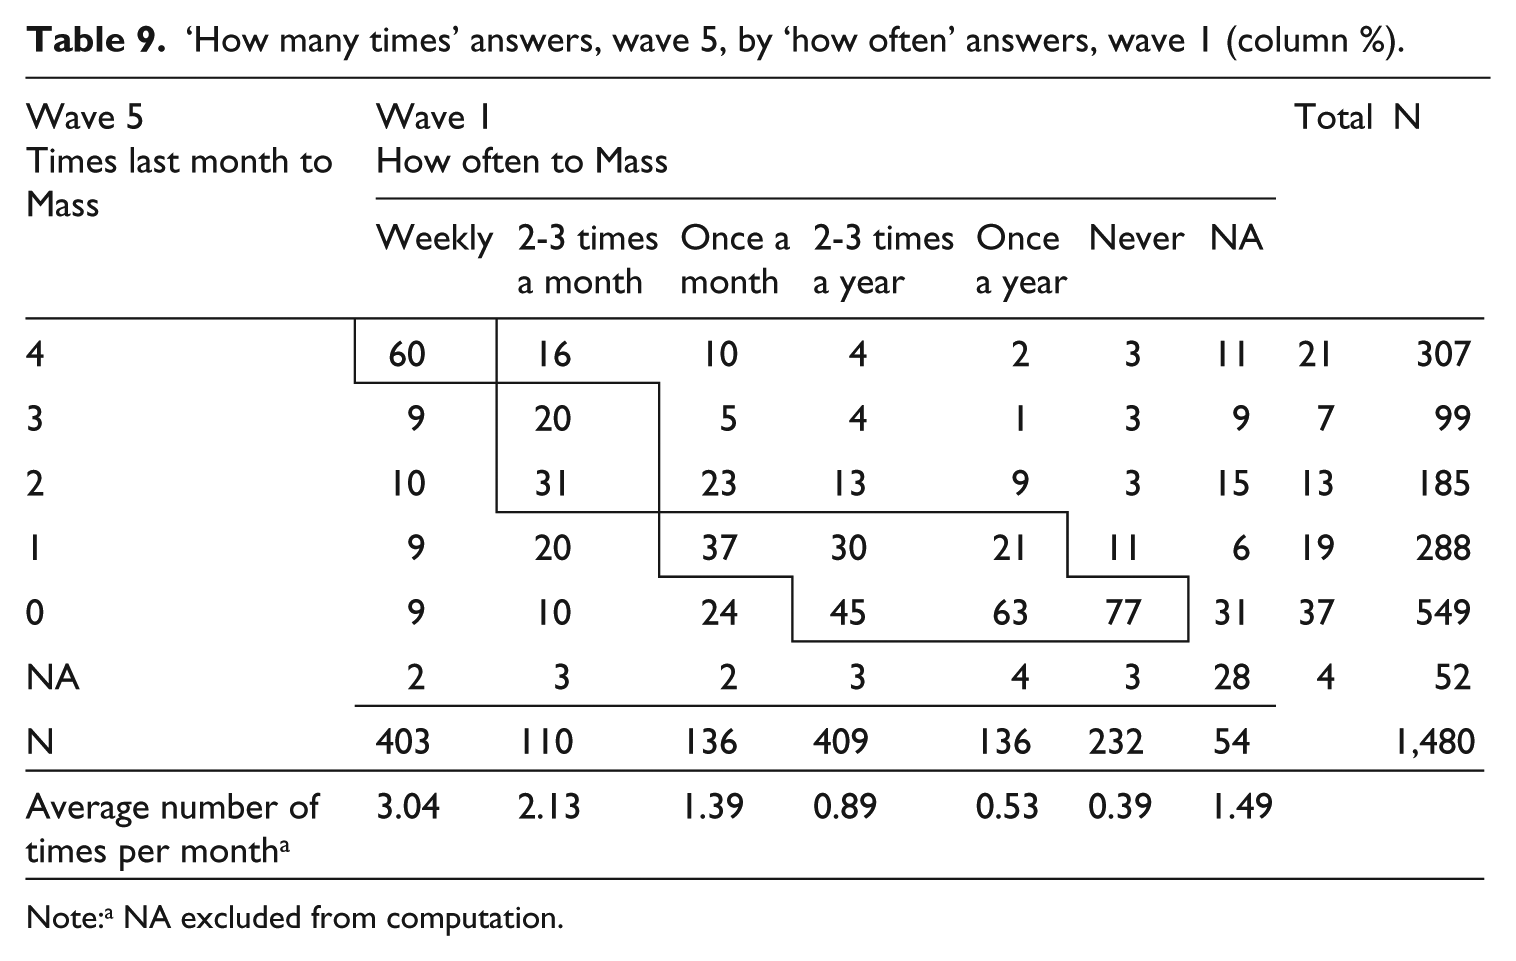
Note:a NA excluded from computation.
Table 10 synthesizes the results of the previous table, classifying answers to the HMT question as coherent or incoherent (more or less often) depending on the answers to the HO question.
Percentages of coherent and incoherent answers comparing the ‘how many times’ question, wave 5, with the ‘how often’ question, wave 1.
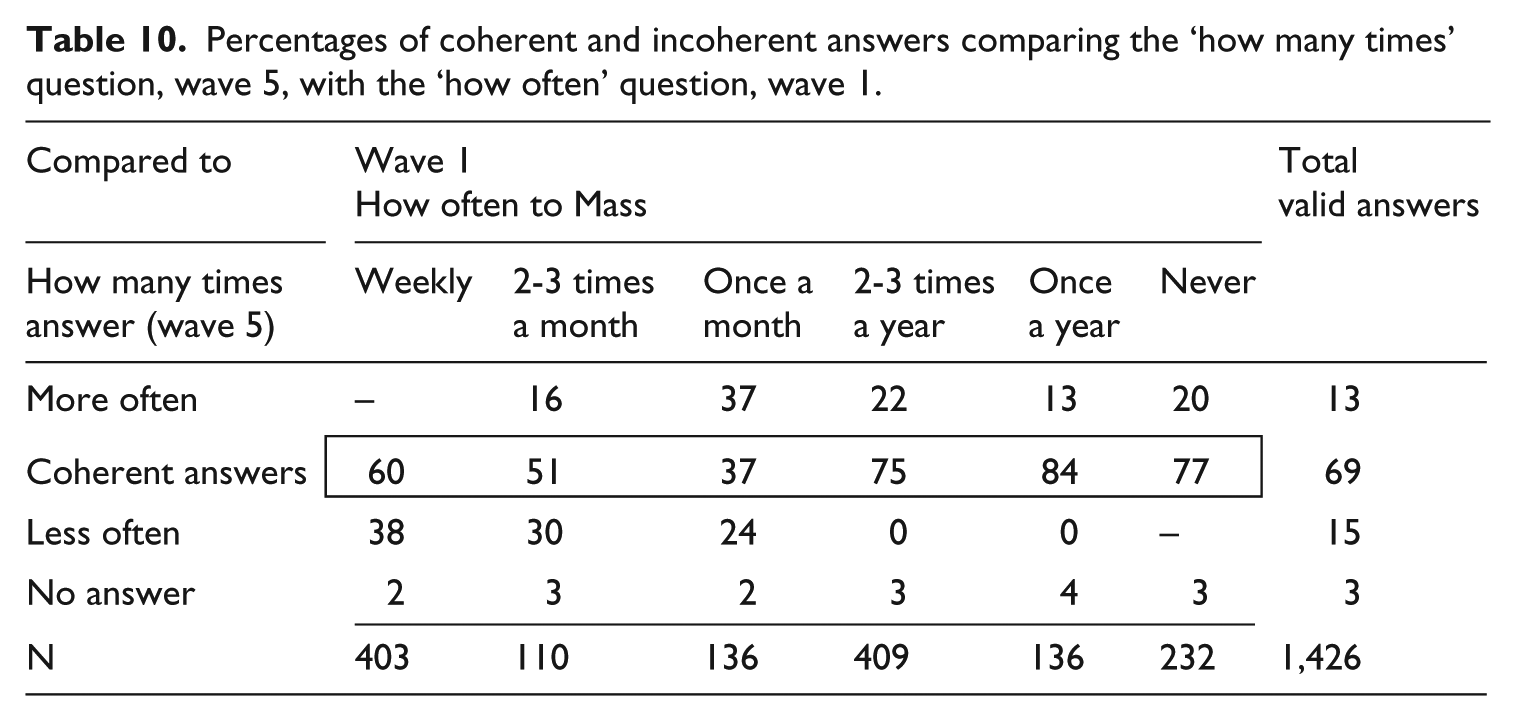
The first point to stress is that 69% of the respondents express coherent answers in the two questions, despite the different formulation and the distance in data collection of more than 2 years. Secondly, the HO question shows higher overreporting in the upper bound of the scale, where it produces answers indicating higher attendance than the HMT question (‘Less often’ row in Table 10). Thirdly, it shows clearly that the overestimation of regular churchgoers of the HO question is compensated by a substantial number of irregular churchgoers or unchurched respondents upscaling their attendance in the HMT question (‘More often’ row in Table 10). This is most evident for categories ‘once a month’ and ‘2-3 times a year’. But also a fifth of the respondents answering ‘never’ in the HO question mentioned having been to Mass at least once in the last month in the HMT question (20.3%, or 47 respondents).
Given the third point, it is clear that SDB alone does not seem a sufficient answer to explain the discrepancies in the distributions of the two questions. Alternative explanations should be proposed, also considering that SDB is minimized in online surveys (Frippiat et al., 2010). On one side, a possible cognitive mechanism laying behind this finding is telescoping (Bradburn et al., 1987). This means that, given a specific time frame (here a month), respondents, especially those going to church rarely, tend to perceive past events as being closer in time and within the time frame. On the other side, the upper bound and the lower bound of the scale stand out from the rest in terms of reliability in Table 10. This suggests that the extreme categories (‘weekly’ on one end, and from ‘2-3 times a year’ down on the other end) are more salient and offer more connotative answers to the respondents. This finding leans more on an interpretation based on the role of identity in answering church attendance questions. Rather than subject to a social norm, it seems that the respondents use the extremes of the range of answers to indicate their self-representation as regular churchgoers or unchurched persons.
Discussion and conclusions
This contribution aimed at filling some gaps in the huge task of understanding and improving (in one word, calibrating) the instruments used to measure church attendance in survey research. Being aware of the importance of continuity when collecting longitudinal data, the goal was not to propose a gold standard question to be adopted in each survey but rather to improve our understanding of the cognitive mechanisms underpinning the answers to these questions and to help researchers when harmonizing data coming from different sources. We carried out our task by running a series of survey experiments. Our main focus has been on the formulation of the questions, first considering the wording of the answer options of the standard version (‘How often do you attend Mass?’), and then comparing it with the alternative HMT version (‘In the last month, how many times did you attend Sunday Mass?’).
The outcome of the first experiment is unambiguous and clearly shows that in online self-administered questionnaires the number of answer categories, the higher frequency offered to the respondent (daily vs. weekly) and the way to express weekly attendance (once a week vs. every Sunday) do not make any difference to the distribution of the answers. In particular, those differences in the formulation do not significantly affect the percentage of weekly churchgoers, which is the estimate usually used to compare alternative methods for the aggregate measurement of church attendance.
This outcome is important because it reassures that harmonizing church attendance data that present misalignment between answer categories is a legitimate operation. These data can either be pooled together or compared without fear of any bias being due to these slight differences in the formulation of answer categories.
The second experiment concentrated on a comparison between two formulations of the self-reported church attendance questions, the standard and most common HO version and the HMT version, asking for an enumeration of the occasions on which the respondents attended Sunday Mass in the last month (maximum 4 times). In line with expectations, it turned out that the standard question collects higher percentages of respondents declaring weekly attendance compared to the enumeration question. However, when broadening the definition of regular churchgoers to two times a month or more (Brenner, 2011a), the outcomes of the two questions become statistically indistinguishable. Moreover, the HMT formulation presents a serious, general constraint when the indicator is meant to be used as a measure of individual religiosity, because it does not offer any distinction for all those respondents that happen not to have been to Mass in the last month.
When considering the joint distribution of the two indicators, something made possible by the panel design of our study, another original finding emerges. None of the two formulations tested are immune from problems. While the HO version inflates weekly attendance, the HMT formulation suffers from complementary and equally serious biases toward the irregular churchgoers. This evidence is at odds with the usual explanation of overreporting of the HO questions, based on SDB. If overreporting were indeed the case, the question should produce higher church attendance frequencies for all kinds of respondents. This is not the case, as the biases vary depending on the kind of respondent. What seems to emerge is that the answers to HO questions, rather than reflecting an actual behaviour or responding to the pressure of a social norm, rest on the respondent’s religious self-representation, at both ends of the attendance scale, either as a regular churchgoer or an unchurched person. This reading, which downscales the role of SDB, is in line with an interpretation based on the role of identity in answering self-reported church attendance questions that was first suggested by Smith (1998), and recently systematized by Brenner (Brenner, 2011a, 2011b, 2012a, 2012b). 15
Concerning survey practice, our findings do not give ground to arguments to abandon the standard HO church attendance question in favour of alternatives. Besides being the version predominately used in surveys, we have shown that it is robust to changes in the formulation, making it safe to harmonize data coming from different sources without relying on arbitrary correspondences based only on educated guesswork. Moreover, the HO question has also proven to supply a more valid indicator of religious practice.
If one were not bound by previous decisions and free to choose, we would suggest the HO question with answer categories starting from ‘once a week or more often’ downward. This would guarantee comparability with most surveys, validity of the indicator, and parsimony in the answer categories (that also correspond to less of a cognitive burden for the respondents).
One point to be further investigated is the role of a denominational filter before the church attendance. The Italian situation is in this respect peculiar, with a vast majority of the population declaring to be Catholic and a share of survey respondents of other religions still marginal. In multi-faith societies, neglecting respondents of other religions would not be a viable solution and the use of a denominational filter would become a must, not only to detect different denomination, but possibly to customize the follow-up church attendance question. In fact, different denominations attribute different names and meanings to religious functions, besides different time frames for celebration. This is not only a methodological issue, requiring the development of more precise measurement instruments, but also a substantive question that should be approached if we want to reach a broader and more general understanding of religious practice.
Limitations
A number of limitations should be kept in mind when considering the outcomes of our study.
Our sample bears two substantial limitations. Firstly, it comes from only one country, Italy, with a specific religious profile. Secondly, it has been drawn from an opt-in online commercial community and, despite the quota procedure applied in the selection, it cannot be considered to be representative of the Italian population.
The lack of representativeness calls for caution in considering the estimates derived from our data. Nonetheless, the focus of our study was on the effect of different formulations of the church attendance question and the experimental design supports the validity of our results. Moreover, our estimates do not seem at odds with the estimates coming from other surveys based on representative samples and carried out with different models (Garelli, 2011:59; Vezzoni and Biolcati-Rinaldi, 2015).
Further research should also consider how self-reported church attendance questions work within a certain population in specific groups (e.g. defined by age or gender). In fact, exploring item differential function could even offer a deeper understanding of the mechanisms underlying the answers to these questions.
Finally, among the rich bouquet of indicators of individual religiosity, our study focused only on the church attendance indicator. 16 This is of course a constraint, but it is coherent with our approach that insists on the necessity to develop sound measurement instruments in social (survey) research. Ideally, the work presented here to calibrate questions to measure participation in religious functions should be carried out for any relevant question in survey research, or at least the cognitive elements underlying the answers to these questions should be taken into account when defining our ‘concept-meter’ (measurement instrument to gauge a specific concept). Only in this way will we be able to improve our measures and, on this steady ground, promote the sound development of social research. We should not forget what Philip M. Hauser stated almost half a century ago and which remains valid today: ‘I should like to venture the judgment that it is inadequate measurement, more than inadequate concept or hypothesis, that has plagued social researchers and prevented fuller explanations of the variances with which they are confounded’ (Hauser 1969: 127–129, quoted in Zeller and Carmines 1980:1).
Footnotes
Acknowledgements
Authors would like to acknowledge Marc Swyngedouw for his precious comments on a previous version of this article and the two anonymous reviewers for their useful suggestions.
Funding
The author(s) disclosed receipt of the following financial support for the research, authorship, and/or publication of this article: The data used for the analyses were collected by the Italian National Election Studies (Itanes) thanks to a grant from the Italian Ministry of Education for the research project ‘How Political Representation Changes in Italy. Voting Decisions over the 2013 –2015 Electoral Cycle’ (project PRIN 2011, protocol 2010943X4L_003, 2013 – 16) and a grant from the Cariplo Foundation for the research project ‘The Effects of the Economic Crisis on the Attitudes towards Europe of the Italian Voters (with a Special Focus on Northern Italy) in the 2014 European Elections’, principal investigator: Paolo Segatti (project code: CP3 – FINANZIAMENTI CARIPLO 2013).
Replication and data availability
Notes
Author biographies
Address: Università degli Studi di Milano, Via Conservatorio, 7 - 20122 Milan, Italy.
Email:
Address: Università degli Studi di Milano, Via Conservatorio, 7 - 20122 Milan, Italy.
Email: