
Abstract
Introduction
Filipino Americans (FAs) are at high risk for developing type 2 diabetes despite other Asian phenotypes. Evidence suggests that pro-inflammatory interleukin-18 (IL-18) and anti-inflammatory adiponectin biomarkers associated with visceral adipose tissue (VAT) may explain this risk.
Objectives
This study aimed to quantify the biomarkers in relation to standard ranges of VAT or typical circulating concentration ranges reported in the literature of IL-18 and adiponectin, examine relationships of these markers, and determine if they were different among those participants without diabetes, prediabetes, and diabetes.
Methods
A cross-sectional study was used to enroll FAs without diabetes, prediabetes, or diabetes. VAT was measured using the InBody 570© Body Composition Analyzer. Blood samples were obtained to assess plasma concentrations of IL-18 and adiponectin using enzyme-linked immunosorbent assay. All analyses were conducted using a 5% type I error rate. Mean ±SD and percentages were used to describe the sample and data where appropriate. Pearson's correlations (R) were calculated to determine the relationships between VAT and IL-18 in each group. Analysis of variance was used to determine differences in VAT, IL-18, and adiponectin among groups. Further, nonparametric procedures examined the differences in adiponectin among those within groups.
Results
Seventy-five participants were enrolled. Biomarkers above the typical concentration range were observed for VAT, IL-18, and adiponectin. Adiponectin significantly differed among groups with lower values in the diabetes group vs. the nondiabetes group.
Conclusions
The findings indicate that while inflammation-related biomarkers, such as adiponectin, correlate with VAT and may serve as indicators of increased risk of type 2 diabetes in FAs, correlation alone does not establish causality.
Introduction
Type 2 diabetes accounts for about 95% of diagnosed diabetes in adults and is a significant cause of heart disease and stroke (CDC, 2020). The prevalence of type 2 diabetes has grown significantly in native and migrant Asian populations in the USA (Araneta, 2019; Cuasay et al., 2001; Ramachandran et al., 2010). Filipino Americans (FAs) represent the second-largest and fastest-growing Asian immigrant population in the USA (Araneta, 2019; Cuasay et al., 2001; Fuller-Thomson et al., 2017; Palaniappan et al., 2010). Yet, they remain underrepresented in mechanistic studies related to type 2 diabetes.
Review of Literature
Studies that have been done indicate that FAs have a 2–3 times greater prevalence of type 2 diabetes than other Asian populations (e.g., Chinese, Japanese, Thai) and Whites (Cuasay et al., 2001; Ramachandran et al., 2010). While FAs have a higher risk of developing type 2 diabetes than other Asian or white populations, in general, they do not have a similar obese phenotype (Araneta, 2019; Cuasay et al., 2001). It may be that unique mechanisms contribute to developing type 2 diabetes in FAs. The type and location of fat cells or adipocytes are relevant to developing type 2 diabetes (Boyko, 2020; Fain et al., 2004; Ibrahim, 2010; Spoto et al., 2014). Compared to subcutaneous adipose tissue (SAT), visceral adipose tissue (VAT) is thought to impart a greater risk of developing type 2 diabetes. VAT is present in the abdominal cavity, mainly in the mesentery and omentum (Boyko, 2020; Ibrahim, 2010). VAT is more cellular and vascular and contains many inflammatory and immune cells than SAT. In addition, VAT is more metabolically active and has a higher insulin-stimulated glucose uptake rate than subcutaneous obesity (Boyko, 2020; Ibrahim, 2010).
A possible explanation for the high prevalence of type 2 diabetes in nonobese FAs is that there may be differences in VAT accumulation and function in FAs compared to other populations. Several studies have explored this possibility. Araneta et al. (2002) compared differences in VAT among Filipino American (FA), African American (AA), and White women with type 2 diabetes and found that VAT was highest among Filipinas. Interestingly, they also found that VAT did not accurately predict the risk of developing type 2 diabetes, suggesting that VAT function, specifically the production of adipokines and cytokines, may be an additional factor to consider in FAs (Araneta et al., 2002). Reports examining VAT in Asian men are scant. In one study of VAT enrolling several ethnic populations, Lear and colleagues reported that compared to European men, South Asian men had significantly greater VAT when adjusted for body mass index (BMI; Lear et al., 2007). Specific studies examining VAT accumulation and function in FA men with or without diabetes have not been reported.
Adiponectin is an anti-inflammatory adipokine produced by VAT. Adiponectin is involved in regulating glucose concentrations and fatty acid breakdown. Adiponectin is inversely associated with VAT accumulation; thus, this relationship might be explained by inhibitory actions of tumor necrosis factor-alpha and inflammatory cytokines, such as interleukin-18 (IL-18), which are also produced by VAT (Matsuzawa, 2010). It is well established in all populations that low adiponectin concentrations increase the risk for type 2 diabetes (Mohammed et al., 2021; Paz-Pacheco et al., 2009). The idea that there may be ethnic differences in adiponectin concentrations has not been widely examined. One study found that normoglycemic FA women have decreased adiponectin concentrations compared to AA and White women (Araneta & Barrett-Connor, 2007). Paz-Pacheco et al. (2009) examined serum adiponectin concentrations in FA women and men without diabetes, with prediabetes, and with diabetes. They found no difference in adiponectin values between those without diabetes and prediabetes; however, those with diabetes had significantly lower adiponectin values than those without diabetes.
It is well established that adipose tissue is a significant source of inflammatory cytokines contributing to the chronic inflammatory state of type 2 diabetes (Ramachandran et al., 2010; Smriti et al., 2021; Spoto et al., 2014). IL-18, a pro-inflammatory cytokine from the Interleukin 1 family, primarily originates from nonfat cells that reside within adipose tissue and displays chemoattractant properties inducing mononuclear cell recruitment that causes inflammation (Bruun et al., 2007; Smriti et al., 2021). Increases in IL-18 have been shown to interfere with insulin signaling pathways, thus promoting hyperglycemia and type 2 diabetes (Syed Ikmal et al., 2013). Few studies have addressed IL-18 and diabetes in FAs; several lines of evidence prompted us to ask if IL-18 deserved to be considered in this study. There is convincing evidence that IL-18 suppresses adiponectin expression in adipocytes in cell culture, demonstrating a significant reciprocal relationship between these adipocyte products (Chandrasekar et al., 2008; Kamel et al., 2020). In a related study of metabolic syndrome in Chinese men and women, elevated plasma IL-18 was associated with metabolic syndrome, independent of other traditional risk factors (Sun et al., 2011). While these data point to a potential role for IL-18 as a biomarker in FAs within the context of type 2 diabetes, further research is needed.
The possibility that nonobese FA women and men with type 2 diabetes may exhibit unique VAT accumulation and function, combined with the growing evidence that cytokines and adipocytokines, can be used to assess the progression of prediabetes to type 2 diabetes (Chait & Den Hartigh, 2020; Liu et al., 2016), provided the impetus for the current study. Specifically, this study aimed to examine VAT, IL-18, and adiponectin in FA women and men with type 2 diabetes and prediabetes and without diabetes. We hypothesized that increases in VAT would correlate with an increase in IL-18 and a decrease in adiponectin within the prediabetes and diabetes groups compared to those with no diabetes.
This study aimed to quantify the biomarkers in relation to standard VAT ranges or typical circulating concentration ranges reported in the literature of IL-18 and adiponectin, examine relationships of these markers, and determine if they were different among those participants without diabetes, prediabetes, and diabetes.
Methods
Study Design
The study was a cross-sectional, nonexperimental, descriptive comparative design conducted over 3 months. Participants were recruited from various community settings, including clinics, social centers, and churches in Solano County, California. This timeframe allowed for data collection on VAT, IL-18, and adiponectin levels, providing a snapshot of the participants' metabolic health at the time of the study. The study occurred between October 2017 and December 2017.
Sample Size
Power calculations for one-way independent analysis of variances (ANOVAs) were performed using power analysis and sample size using G*Power Version 3.1.7 (computer software). The power analysis for one-way ANOVA with three groups was conducted in G*Power to determine a sufficient sample size using an alpha of 0.05, a power of 0.80, and an effect size of 0.5 based on the practical significance. The desired sample size for each group was 25 participants for each group for a power of 0.9743.
The effect size of 0.50 was deliberately selected for practical significance in this study. This choice was made based on the consideration that an effect size of 0.50 represents a meaningful and practically significant difference in the context of our research. Prior studies in the field have suggested that effect sizes of this magnitude have real-world implications and are of practical importance. Therefore, an effect size of 0.50 was selected to ensure that our study would be sensitive to detecting meaningful changes or relationships that could have practical implications for the research domain.
Sample
The participants consisted of a convenience sample of FA adults ages 18–100 years and older. Using a snowball effect, FA participants were recruited from community clinics, social centers, churches, and other locations within Solano County. No consideration was given to the time the participant resided in the USA.
Inclusion/Exclusion Criteria
The inclusion criteria included self-identified FAs 18 years of age or older who were English-speaking. The exclusion criteria were FAs with type 1 diabetes and those who were pregnant had active infections, had a recent infection within the last 3 months, or were currently taking corticosteroids.
Data Collection
After obtaining written informed consent, a nonvalidated demographic and medical questionnaire created by the principal investigator (PI) was administered to participants. All participants verbally verified their fasting status and then had venous blood drawn using a standard fingerstick to assess hemoglobin A1c (HbA1c) and venipuncture methods to obtain blood serum to assess IL-18 and adiponectin. This was followed by obtaining body composition measures to evaluate for VAT. Once the participant began, all components were completed on the same day within a 30-min timeframe.
Blood Samples
The primary investigator, an advanced practice registered nurse, drew all blood samples. HbA1c was analyzed using a fasting sample of a drop of whole blood collected by fingerstick and analyzed using a point-of-care DCA Vantage Analyzer; results were provided in less than 10 min. The analyzer performs quantitative tests of hemoglobin A1c (whole blood, HbA1c) in a range from 2.5% to 14% (4 mmol/mol to 130 mmol/mol). The HbA1c results were used to stratify participants into the three diabetes groups based on the criteria set forth by the American Diabetes Association Standards of Care in Diabetes (2018); however, if participants self-identified as having type 2 diabetes in the medical questionnaire, they were placed in the diabetes group, and the HbA1c was provided solely to inform the patient of their current HbA1c levels. Nondiabetes was classified as an HbA1c value less than or equal to 5.6%; prediabetes was classified as an HbA1c value between 5.7% and 6.4%; diabetes was classified as an HbA1c value greater than 6.5% for participants who did not know their diabetes status.
Adiponectin was analyzed using a fasting sample of 1 mL of whole blood collected into an ethylenediaminetetraacetic acid (EDTA) red-top tube. The tube was centrifuged for 10 min at 1,000 × g within 30 min of collection, and plasma was stored at −20°C until batch analysis. Following manufacturer instructions, plasma adiponectin concentrations were measured using enzyme-linked immunosorbent assay (ELISA; R&D Systems, Minneapolis, Minnesota). Intra- and interassay coefficients of variation were 5.9% and 16.0%, respectively. Adiponectin threshold concentrations were established from criteria in studies assessing adiponectin in obesity (Arita et al., 1999; Hoffstedt et al., 2004).
Interluekin-18 was analyzed using a fasting sample of 3 mL of whole blood collected into an EDTA red top/gold tube. The tube was centrifuged for 10 min at 1,000 × g within 30 min of collection, and plasma was stored at −20°C batch analysis via ELISA (R&D Systems, Minneapolis, Minnesota) according to manufacturer instructions. Intra- and interassay coefficients of variation were 2.4% and 3.7%, respectively. IL-18 threshold concentrations were established using studies assessing the application of human IL-18 by ELISA (Narita et al., 2000; Taniguchi et al., 1997).
Body Composition
Weight was obtained on each participant with shoes off and measured using the InBody® 570 Body Composition Analyzer to the nearest 0.1 kilograms (kg). Height was measured to the nearest centimeter using a stadiometer/height rod with the participant's shoes off, and the results were documented to the nearest centimeter (cm). BMI was calculated according to the National Heart, Lung, and Blood Institute methods, with weight in kilograms divided by height in meters squared (m2) (National Heart, Lung, Blood Institute, 2018). BMI was categorized according to the NHLBI (2018) for Asian-Pacific cutoff points (<18.5 kg/m2), normal weight (18.5–22.9 kg/m2), overweight (23–24.9 kg/m2), and obese (≥25 kg/m2).
Waist circumference was obtained using a Seca 201 Girth Measuring Tape, and results were reported to the nearest centimeter (cm). The World Health Organization (WHO) protocol for waist measurement was used for this study (World Health Organization, 2008). Participants stood upright, arms relaxed at the side, feet evenly spread apart, and body weight evenly distributed. Waist circumference was measured at the end of several consecutive natural breaths, at a concentration parallel to the floor, and at the midpoint between the top of the iliac crest and the lower margin of the last palpable rib in the mid-axillary line.
VAT was analyzed using the InBody® 570 Body Composition Analyzer, an indirect impedance method, per the manufacturer's protocol. The InBody® 570 Body Composition Analyzer calculates body fat mass (BFM), visceral fat area, dry lean mass, and intracellular and extracellular water. InBody® USA (2018) defines BFM as the total mass of fat divided by total body mass multiplied by 100. The BFM includes essential body fat storage.
Ethical Considerations
The University of Arizona Human Subject Protection Program approved this study. Written consent was obtained from all participants before obtaining any data. FAs were recruited from community clinics, social centers, and a university setting in an urban community in Northern California. While some participants were recruited via group presentations and flyers, most were recruited by word of mouth (snowball effect).
Data Analysis
Statistical analyses were conducted using R 4.1.0 (R Core Team, 2021) and the tidyverse package (v1.3.0; Wickham et al., 2019). All analyses were conducted using a 5% type I error rate. Mean ± SD and percentages were used to describe the sample and data where appropriate. Pearson's correlations (R) were calculated to determine the relationships between VAT and IL-18 in each group. ANOVA was used to determine differences in VAT, IL-18, and adiponectin among groups.
Three separate two-sample procedures using a one-sided hypothesis were needed to test for statistically significant sex differences in adiponectin among those in the nondiabetes, prediabetes, and diabetes groups by sex. Nonparametric procedures were implemented to test these differences due to a failure to meet the normality assumptions, as determined by the Shapiro–Wilk test. A two-sample Wilcoxon rank-sum test was used to assess if there was significance in concentrations of adiponectin within diabetes groups comparing females to males. A Kruskal–Wallis test was then conducted to examine the differences in adiponectin among those within the nondiabetes, prediabetes, and diabetes groups. A post hoc analysis using pairwise Wilcoxon tests was conducted to determine which groups differed significantly (Z score, converted to p-values) (1995).
Results
Demographics
Seventy-five adult FAs participated in the study and were evenly distributed (N = 25) among the three groups. Overall, 51/75 (68%) of the participants were female. The mean age of all participants was 41.6 ± 13.5 years. Twenty-five participants (80%) in the diabetes group self-identified as having type 2 diabetes in the medical questionnaire, while only five participants (20%) stratified into the diabetes group were not aware of their diabetes status. The mean HgbA1c was 7.33% for the 25 participants who self-identified as having type 2 diabetes within the diabetes group, while the mean for those unaware of their prior status in the group was 6.5%. Those who were unaware of their diagnosis of diabetes were referred to their primary care provider. There were no significant differences among groups concerning self-reported exercise, minutes of exercise/week, and eating outside the home. The most common comorbidities reported in all three groups were hypertension, hyperlipidemia, and depression. The most common diseases reported in the participant's family history (i.e., parents, siblings, grandparents, and children) included hypertension, type 2 diabetes, and hyperlipidemia (Table 1).
Participant Demographics and Clinical Characteristics.

Note. Data are expressed as mean and standard deviation or percentage and frequency. DM = diabetes mellitus, VAT = visceral adipose tissue.
Anthropometrics and VAT
The groups had no significant differences in VAT, BMI, BFM, and lean body mass (Table 1). Interestingly, in the nondiabetes group, VAT fell within the standard range in 80% of the men but only in 20% of the women (Table 2). In the prediabetes group, approximately half of the men and women were within the standard VAT range. In the diabetes group, 73% of the men but only 43% of women were within the standard VAT range (Table 2). Considering all groups, 76% of the nondiabetes group, 48% of the prediabetes group, and 56% of the diabetic group were within the standard VAT range. The distribution of VAT was also examined by quartiles across the range of standard values to characterize further this variable for each group (30–200 cm2) (Figure 1). Among all groups, the distribution of VAT fell in the two lower quartiles (30–69 cm2 and 70–109 cm2), and within each quartile, there was uniform distribution among groups. There were no significant differences in VAT among groups (Table 3).

Distribution of visceral adipose tissue (VAT) among quartiles.
VAT and IL-18 Compared to SR or TC.

Note. Data are expressed as percentage. SR = standard range; TC = typical concentration; ND = nondiabetes; PD = prediabetes; D = diabetes; TGS = total group sample.
Comparison of VAT, IL-18, and Adiponectin Among Groups.

Note. Data are expressed as mean and standard deviation. VAT = visceral adipose tissue; IL-18 = interleukin-18.
*Significantly different compared to the nondiabetes group, p = .027.
Interleukin-18
In the nondiabetes group, only 20% of men but 65% of women had IL-18 values within the normal threshold for typical concentrations (Table 2). In the prediabetes group, 12% of men and 29% of women had IL-18 values within the typical concentration. Meanwhile, in the diabetes group, 18% of men and 36% of women had IL-18 values within the typical concentration. When combining all groups, the percentage of participants with an IL-18 value above the typical concentration was greatest in the prediabetes (68%) and diabetes groups (64%) versus the nondiabetes group (40%). This finding was primarily attributed to the greater values in men, as noted above. The distribution of IL-18 appears to be uniformly distributed across and within quartiles (Figure 2). There were no significant differences in serum IL-18 among groups (Table 3).
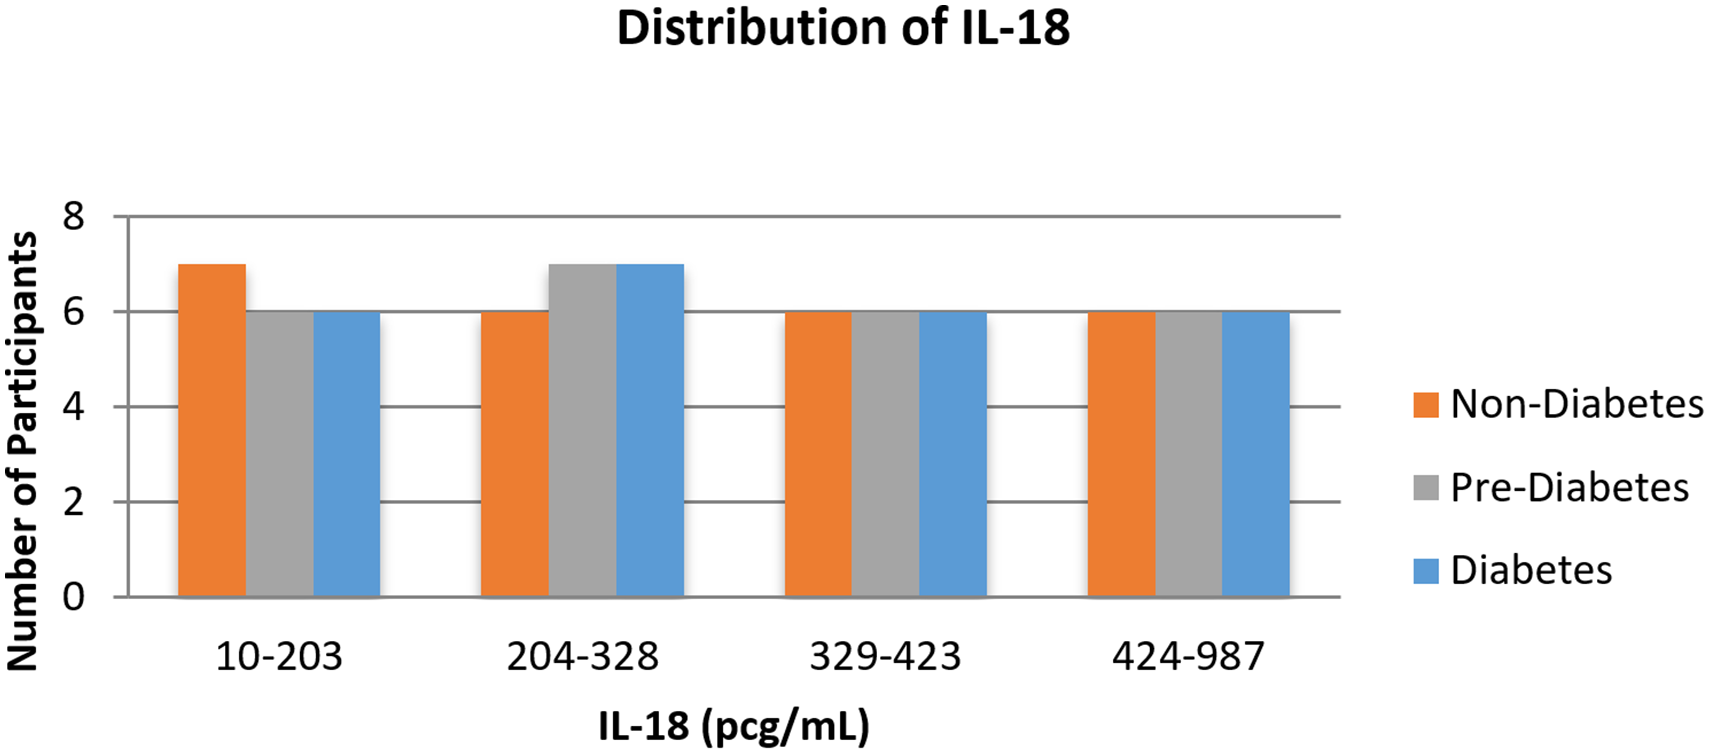
Distribution of interleukin-18 (IL-18) among quartiles.
Adiponectin
Adiponectin values were somewhat lower in both men and women in the diabetes group. Fewer participants across all groups were represented in the third quartile, but values seemed to be evenly distributed within other quartiles across all groups (Figure 3). Adiponectin was significantly lower in the diabetes group than in the nondiabetes group (p = 0.027) (Table 3). Across all participants, females had significantly higher median concentrations of adiponectin (M = 4598.95) compared to males (M = 3703.11, Z = 2.24, p = 0.025). When comparing sex differences within each group, only females with no diabetes had significantly higher median concentrations of adiponectin (M = 5630.34) compared to males with no diabetes (M = 3907.21, Z = 2.16, p = 0.03) (Figures 4A and 4B).
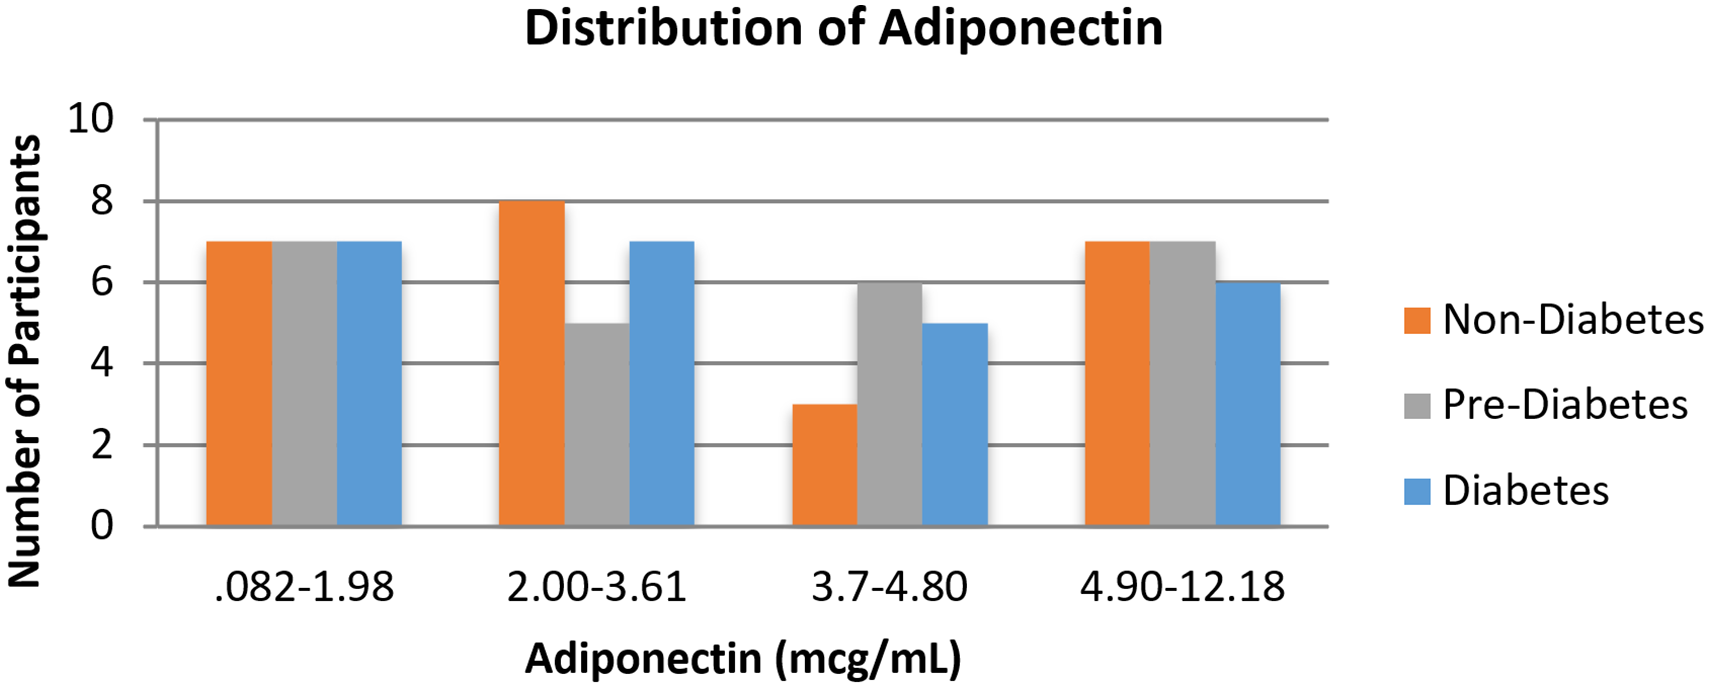
Distribution of adiponectin among quartiles.

(a) Adiponectin concentrations by sex. (b) Adiponectin concentrations by diabetes classification and sex.
Relationships among Biomarkers
Pearson product–moment correlations were calculated for each group (nondiabetes, prediabetes, diabetes) to determine if there was a relationship among VAT, adiponectin, and IL-18 (Table 4). There were weak correlations among these biomarkers in several instances, but none were statistically significant. The nondiabetes group had a negative correlation between VAT and adiponectin (r = −0.3) (Table 4). In the prediabetes group, there was a positive correlation between IL-18 and adiponectin (r = 0.26) and a positive correlation between VAT and IL-18 (r = 0.31) (Table 4). In the diabetes group, there was a negative correlation between VAT and adiponectin (r = −0.13) (Table 4).
Pearson Correlation Matrices According to Group.
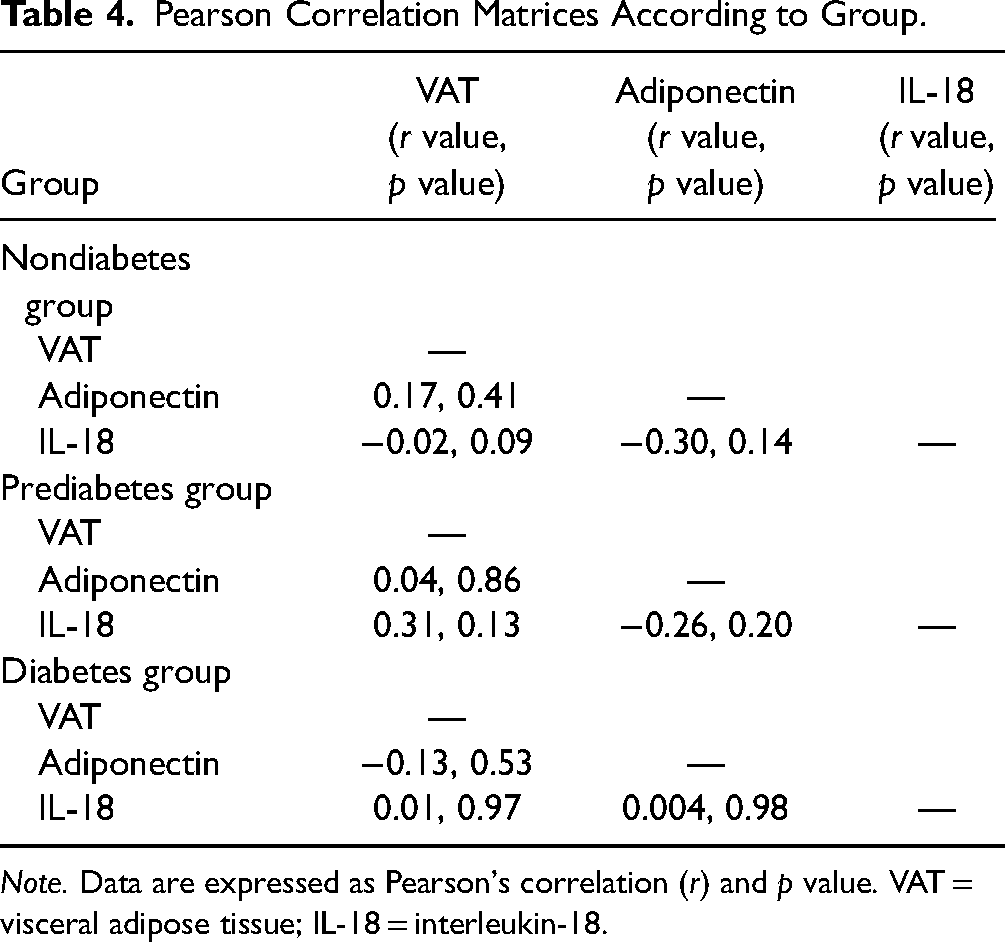
Note. Data are expressed as Pearson's correlation (r) and p value. VAT = visceral adipose tissue; IL-18 = interleukin-18.
Discussion
Prior studies conducted in California and Texas in the USA indicate that FAs have approximately 2–3 times the prevalence of type 2 diabetes than White Americans (Araneta et al., 2002; Cuasay et al., 2001). While obesity may not be a risk factor for developing type 2 diabetes in FAs, adipocyte accumulation and function may differ in FAs compared to other ethnicities and White Americans (Araneta & Barrett-Connor, 2007; Boyko, 2020; Paz-Pacheco et al., 2009). However, studies testing this theory are scant. Identifying biomarkers that could predict the risk of developing type 2 diabetes or the progression of prediabetes to diabetes would support preventive health care for FAs.
This study studied the VAT, IL-18, and adiponectin triad in men and women FAs without diabetes, with prediabetes, and with type 2 diabetes. The study took place in California, USA, where many FAs reside. Target enrollment was easily met because of study location and word-of-mouth recruitment by participants. Overall, the participants were active, had a healthy diet, and reported comorbidities and family history of cardiovascular disease and type 2 diabetes that were like the FA population described in a more extensive epidemiologic study (Cuasay et al., 2001).
While VAT has been reported to be highly correlated with type 2 diabetes in Chinese, Japanese, Japanese-American populations, and Asian Americans (Park et al., 2001), less is known about VAT across the progression of type 2 diabetes in an FA population. VAT mean values were greater in the prediabetes and diabetes groups compared to the nondiabetes group; however, VAT values were not significantly different among groups. Concerning VAT distribution across quartiles, more participants with diabetes had VAT values in the third and fourth highest quartiles compared to the other groups. Examining the VAT values above the standard ranges aligns with the hypothesis that VAT would increase in the prediabetes and diabetes groups compared to the nondiabetes group. When combining all groups, the percentages of VAT values that were above the standard values in the prediabetes group (52%) and diabetes group (44%) were approximately double that observed in those without diabetes (24%). These data may indicate a modest increase in VAT accumulation in women and men with prediabetes and diabetes versus those with no diabetes. However, further study of this observation is required.
When considering FA women alone, a study by Araneta and Barrett-Connor (2005) found that Filipino women had higher concentrations of VAT than AA and White women despite participants having similar BMI and waist circumferences. They also found that the risk of type 2 diabetes did not differ after adjusting for VAT between AA and White women. Still, for Filipino women, the prevalence of type 2 diabetes was significantly higher across all concentrations of VAT (Araneta & Barrett-Connor, 2005). Results are consistent with these findings: BMI varied little among groups, and the percentage of VAT values above the standard range in FA women with prediabetes and diabetes was two times higher than those without diabetes. We also observed that VAT values above the standard range were similar in both men and women in the nondiabetes and prediabetes groups. Still, the percentage of values above the standard range was greater in women with diabetes versus men with diabetes. VAT has not been studied robustly in FA men in groups like this study. However, findings are consistent with those from a study by Premanath et al. (2014) using ultrasound to measure VAT among South Asian Indian adults with diabetes, with significantly higher concentrations of VAT found than those without diabetes.
The study findings related to VAT were influenced by the study sample, particularly the relatively young age of the groups, especially in the diabetes group. The average age for participants in this study (48 years) was younger than that of those enrolled by Araneta and Barrett-Connor (2005), whose average participant age was 65. Further, diabetes medication adherence was not measured. It may be that those in the diabetes group were well-controlled with medication, and this may have affected the ability to detect a correlation within a group or significant differences across groups. Another factor is that 73% (n = 55) of participants in the study exercised weekly, and less than half of participants ate out more than two times per week, thus potentially decreasing overall concentrations of VAT within the sample (Chang et al., 2021; Dobrosielski et al., 2013; Vissers et al., 2016).
It was hypothesized that increases in IL-18 would accompany increases in VAT, but the findings did not support this. When comparing IL-18 using multivariate analysis, there were no statistically significant differences among groups. However, like the trend for VAT, we observed that the percentages of IL-18 values above the standard ranges were higher in the prediabetes (64%) and diabetes (68%) groups than in the nondiabetes group (40%). Of further interest was that in the nondiabetes group, there seemed to be more significant differences between men and women; 80% of men had values above the standard range, compared to only 35% of women. This trend continued in the prediabetes group, but values were similar between men and women in the diabetes group. Results are consistent with a study by Thorand et al. (2005), who reported that multinational individuals with type 2 diabetes had elevated concentrations of IL-18 and that increased concentrations are already present before the onset of diabetes, but more so in women.
It may be that VAT did not increase to the extent that allowed for differences in IL-18 to be detected. Also of note is that the typical plasma concentration range of serum IL-18 values in this and other studies is large, making it difficult to detect differences within a small group. It is also possible that there were age, diet, and exercise-related effects on IL-18 concentrations (Trøseid et al., 2009, 2010; Trøseid, Lappegård et al., 2009). A laboratory study reported plasma concentrations of IL-18 in male mice as higher during adolescence and young adulthood compared to elderly males and that concentrations of circulating testosterone mainly drive this effect (Abu Elhija et al., 2008). It has also been reported that IL-18 concentrations in men are higher than in women (Opstad et al., 2011). Similarly, in this study, a greater percentage of men had values above standard values in the nondiabetes and prediabetes groups; IL-18 percentages above standard values were similar in diabetic men and women.
Adiponectin is a protective, anti-inflammatory, and insulin-sensitizing adipokine and is thought to slow the progression of type 2 diabetes (Iqbal, 2007; Nguyen, 2020; Yamamoto et al., 2014). Concentrations of adiponectin are inversely associated with concentrations of VAT and inflammatory cytokines such as IL-18. It is thought that IL-18 inhibits the expression of adiponectin, thus attenuating its protective effects and promoting the progression of type 2 diabetes (Nguyen, 2020; Shehzad et al., 2012). The main finding of this study is that the mean adiponectin concentration was significantly less in FAs with diabetes compared to that in FAs without diabetes. To the researcher's knowledge, this is the first time that adiponectin has been compared in both men and women FAs with no diabetes, prediabetes, and diabetes. The findings, in part, are similar to those of Paz-Pacheco et al. (2009), who reported that Filipino men and women with diabetes have significantly lower adiponectin concentrations than those without diabetes.
Like other studies, researchers observed a gender difference in concentrations of adiponectin. Like Aleidi et al. (2015) and Ciarambino et al. (2022), it was found that in the overall sample, FA women had significantly higher concentrations of adiponectin than FA men; this finding was primarily due to the significant differences in the nondiabetes group. The study findings in the diabetes group were similar, although not statistically significant. Finally, while this study and others suggest that there may be relationships among VAT, IL-18, and adiponectin in FAs with prediabetes and diabetes, the evidence remains weak and points to the need for further study.
Limitations of the Study
This study has several limitations, as noted in the above discussion. Because there have been reports of gender differences among the variables examined in this study, the imbalance of women and men may have confounded the results. This was not an ethnographic study requiring large sample sizes; instead, this was a mechanistic study with small sample sizes in the comparison groups. Finally, younger age, activity concentrations, and diet may have confounded the findings.
Significance and Implications for Clinical Practice
A mechanistic study examining VAT, IL-18, and adiponectin in FAs without diabetes and with prediabetes and type 2 diabetes has not been previously reported. The researchers demonstrated that a larger study of this kind could be conducted in a community of FAs. Currently, the evidence from this and other studies does not yet support this triad of biomarkers for everyday use by diabetes practitioners; however, among many studies to date, adiponectin is a promising candidate. The information from this study adds to the scientific body of knowledge supporting the potential use of non-traditional biomarkers, such as those for obesity, in diabetes risk assessment and management in ethnic populations in general. The possible use of biomarkers specific to FAs and other ethnic people can optimize care for chronic, debilitating conditions such as type 2 diabetes.
Conclusion
This study aimed to investigate the relationship between VAT, IL-18, and adiponectin in FA men and women across three groups: those without diabetes, those with prediabetes, and those with type 2 diabetes. The findings suggest that while VAT and IL-18 levels did not significantly differ among the groups, adiponectin levels were notably lower in participants with diabetes than those without. This highlights the potential of adiponectin as a biomarker for assessing the risk of type 2 diabetes in FA populations.
The lack of significant differences in VAT and IL-18 among the groups may be attributed to several factors, including the relatively young age of participants, their active lifestyle, and dietary habits, which could have influenced the overall concentrations of VAT and IL-18. Despite these limitations, the study provides valuable insights into the unique metabolic characteristics of FAs. It underscores the need for further research to explore the complex interplay between adipose tissue, inflammatory markers, and diabetes risk.
This study's significance lies in its contribution to the growing body of knowledge on the pathophysiology of type 2 diabetes in FAs, an underrepresented group in diabetes research. Future studies with larger sample sizes and more diverse age groups are necessary to validate these findings and better understand the mechanistic pathways involved. Additionally, longitudinal studies could provide more comprehensive insights into how these biomarkers change over time and their potential role in predicting diabetes onset and progression.
Supplemental Material
sj-docx-1-son-10.1177_23779608241272513 - Supplemental material for Adiponectin, Interleukin-18 (IL-18), and Visceral Adipose Tissue in Filipino Americans: Biomarkers and Risk of Type 2 Diabetes
Supplemental material, sj-docx-1-son-10.1177_23779608241272513 for Adiponectin, Interleukin-18 (IL-18), and Visceral Adipose Tissue in Filipino Americans: Biomarkers and Risk of Type 2 Diabetes by Julian L. Gallegos, Ruth E. Taylor-Piliae, Thaddeus W. W. Pace, Matthew J. Gallek and Leslie Ritter in SAGE Open Nursing
Supplemental Material
sj-docx-2-son-10.1177_23779608241272513 - Supplemental material for Adiponectin, Interleukin-18 (IL-18), and Visceral Adipose Tissue in Filipino Americans: Biomarkers and Risk of Type 2 Diabetes
Supplemental material, sj-docx-2-son-10.1177_23779608241272513 for Adiponectin, Interleukin-18 (IL-18), and Visceral Adipose Tissue in Filipino Americans: Biomarkers and Risk of Type 2 Diabetes by Julian L. Gallegos, Ruth E. Taylor-Piliae, Thaddeus W. W. Pace, Matthew J. Gallek and Leslie Ritter in SAGE Open Nursing
Footnotes
Acknowledgments
We would like to thank Ms. Hwu Dau Rw Chen for assisting with the processing of the laboratory samples and Dr. Juan Cabrera for assisting with the statistical analysis of data.
Author Contributions
Ruth E. Taylor-Piliae: methodology and writing—original draft. Thaddeus W. W. Pace: formal analysis and writing—original draft. Matthew J. Gallek: methodology and writing—original draft. Leslie Ritter: conceptualization and writing—original draft.
Availability of Data and Materials
Data is available with request to PI: Julian L. Gallegos.
Declaration of Conflicting Interests
The authors declared no potential conflicts of interest with respect to the research, authorship, and/or publication of this article.
Ethical Approval
Institutional review board approval was obtained through the University of Arizona Human Subject Protection Program Protocol no. 1705469588A001.
Funding
The authors disclosed receipt of the following financial support for the research, authorship, and/or publication of this article: This work was supported by the Association of California Nurse Leaders member scholarship fund.
Use of Artificial Intelligence (AI) Software
No AI was used for any part of this study or manuscript.
Supplemental Material
Supplemental material for this paper is available online.
References
Supplementary Material
Please find the following supplemental material available below.
For Open Access articles published under a Creative Commons License, all supplemental material carries the same license as the article it is associated with.
For non-Open Access articles published, all supplemental material carries a non-exclusive license, and permission requests for re-use of supplemental material or any part of supplemental material shall be sent directly to the copyright owner as specified in the copyright notice associated with the article.