
Abstract
Surgical complications increase morbidity, mortality, and costs, underscoring the need for effective postoperative follow-up. Digital tools can reduce complications, but their usability remains unexplored in Ecuador. This study evaluated the usability of a postoperative monitoring app among 62 patients from a public hospital using the System Usability Scale (SUS). The mean SUS score was 65.69 (SD = 18.68), indicating moderate usability. Participants rated ease of use (M = 3.31) and confidence (M = 3.40) favorably but reported challenges with complexity (M = 1.85) and need for support (M = 1.56). Younger and more educated users scored higher, though differences were not statistically significant; no gender-based variations emerged. Positive perceptions were associated with ease of use and system integration, while perceived complexity and need for support negatively impacted the user experience. These findings suggest that optimizing the interface and strengthening user education may equip younger adults with digital tools that facilitate long-term engagement and adoption across future generations.
Keywords
Introduction
Postoperative complications are common during both immediate and late recovery, with incidence varying by surgery type, comorbidities, operative duration, and technique.1,2 Timely detection remains a major healthcare challenge due to associated morbidity, mortality, and economic burden. 3 Surgical site infections (SSIs) affect about 10% of procedures and cause nearly 20% of unplanned readmissions. 4 Many patients fail to recognize early signs, delaying care. 5
In Ecuador, the risk of impoverishing expenditures due to surgical care reached 15% in 2020, surpassing rates in other Latin American countries. 6 Similarly, the proportion of individuals facing catastrophic costs for surgical procedures peaked at 23%, significantly higher than neighboring nations like Peru, Chile, and Colombia. 7
There is currently no evidence of virtual postoperative follow-up tools being used in Ecuador. Patients are discharged with standard instructions based on institutional protocols, but lack access to digital systems for continued communication with healthcare providers. This highlights an unmet need for remote monitoring solutions to support recovery.
Globally, readmissions after surgery are often attributed to inadequate postoperative management by both caregivers and patients. 8 This issue is especially critical in low- and middle-income countries, where access to high-quality surgical care remains limited. 9
Patient and caregiver participation in postoperative follow-up is decisive for improving healthcare outcomes. 10 Collaborative monitoring among patients, providers, and telehealth personnel represents a new paradigm for surgical wound care. 4 This collaboration strengthens communication between healthcare teams and patients/caregivers, enabling early detection of complications for safer and more effective care. 11
Mobile health (mHealth) applications are increasingly used in healthcare and postoperative management.12–14 Some clinical practices employ smartphones, tablets, and other devices. 8 These tools enhance patient engagement,15–17 facilitate appointment scheduling and patient-reported outcome collection,11,18 and reduce postoperative complications and readmissions after discharge. 19 Additionally, they alleviate hospital burdens,20,21 promote health self-management 22 and improve healthcare delivery.23,24
Usability measures the capacity of digital systems to enable users to achieve specific goals effectively, efficiently, and satisfactorily within a given context. 25 Connectivity issues and user-specific conditions may impair the usability of these electronic tools, 10 as can application design features and user experience. 26 Therefore, it is critical to develop intuitive and accessible interfaces that address these limitations, ensuring alignment with users’ needs, expectations, and real-world contexts.
Multiple validated instruments exist to evaluate the usability of digital tools. For this study, we selected the System Usability Scale (SUS) for electronic device assessment due to its demonstrated reliability across diverse digital interfaces and tools.27–29 The SUS is a standardized, reliable, and concise instrument that quantifies ease of use and user satisfaction with the implemented system.
Given that usability is a critical determinant of digital tools’ adoption and effectiveness in clinical settings, we formulated the following research question: How do postoperative patients in a public Ecuadorian hospital perceive the usability of a digital follow-up tool, and what demographic factors influence their experience?
Methods
Study Design and Population
A descriptive, field-based quantitative study with a cross-sectional approach was conducted. The sample comprised 62 consecutively recruited postoperative patients from a public Ecuadorian hospital (July-December 2024). Inclusion criteria required adults (>18 years) with medical discharge who provided informed consent, while exclusion criteria eliminated patients with clinical comorbidities (eg, uncontrolled chronic conditions) or participation refusal, adhering to established bioethical standards. 30
Eligible procedures were restricted to general surgeries that involved an incision with primary closure. The most common procedures included laparoscopic or open cholecystectomy, hernia repair (inguinal, umbilical, or epigastric), appendectomy, resection of large lipomas or sebaceous cysts, eventration repair, partial or total thyroidectomy, and varicose vein surgery.
Digital Tool Description (HealthTrack)
HealTrack is a custom progressive web app developed to support home-based postoperative care. It includes three main functions: (1) daily symptom tracking, (2) optional photo uploads of the surgical site for infection monitoring, and (3) secure messaging with the nursing team.
Photo uploads were used only with patient consent and when feasible, enabling early detection of complications. When images weren’t uploaded, patients could still report symptoms or ask questions via chat. This flexible dual-channel approach ensured privacy and maintained clinical oversight.
The mobile-friendly interface was designed based on real clinical workflows and refined through pilot testing. A clinician dashboard supports case review, symptom triage, and timely follow-up.
Postoperative Monitoring Protocol
Although the hospital lacks a formal daily postoperative follow-up system, clinical teams prioritize early complication detection, especially regarding surgical sites. Current discharge instructions are printed and static, with no communication channel available once patients return home.
To address this gap, the HealTrack app was designed as a digital prototype that replicates essential follow-up processes, such as daily symptom reporting, triage alerts, optional surgical site image uploads, and prompt clinical responses through a centralized dashboard. These features aim to ensure continuity of care and timely intervention.
Additionally, HealTrack transforms traditional printed guidance into dynamic content by integrating it into automated chatbot messages and symptom-based visuals. This makes patient education more interactive and tailored, empowering users to take an active role in their recovery at home.
Training and Technical Support
Patients received in-person training on how to use HealTrack prior to discharge. This included a 10-minute demonstration by the research nurse using the patient's own device. Key features were explained: how to access the app, respond to the daily survey, upload images, and send/receive messages. Printed infographics were also provided. No formal help desk was in place, but patients could use the chat function within the app to report technical issues or request assistance, which was monitored daily by the study team.
Data Collection Technique and Instrument
The Spanish version of the SUS, validated by Sevilla-González et al 21 (α = 0.85), was used to assess the tool. The 10-item scale, which alternates between positive and negative statements, was completed in 10 to 15 min via Google Forms sent through patients’ WhatsApp contacts. Responses were rated on a 5-point Likert scale. Anonymized SUS data are publicly available on the Figshare repository (doi:10.6084/m9.figshare.29043014). Individual demographic and clinical data are protected and can only be accessed upon request with ethics board approval.
Procedures
The procedure involved approaching patients prior to their postoperative discharge to explain the purpose of the study and obtain informed consent. Patients who voluntarily agreed to participate used the HealTrack application during their home-based postoperative recovery. The app prompted daily questions regarding signs and symptoms of surgical site complications and sent alerts to the follow-up nurse. If two or more symptoms were reported, the app requested the patient to upload a photograph of the wound. Based on the detected signs and the photograph, the follow-up nurse provided personalized recommendations via the in-app chat. Additionally, patients were able to initiate a conversation if needed. Upon completion of their recovery, each patient was asked to complete the electronic device usability scale.
Data Analysis
Statistical processing was conducted using descriptive statistics with the IBM Statistical Package for the Social Sciences (SPSS) for Windows, version 25. To calculate usability scores, 1 was subtracted from each odd-numbered item, while each even-numbered item was subtracted from 5. The adjusted values were then summed to obtain a total score ranging from 0 to 40, which was subsequently converted to a 0 to 100 scale by multiplying by 2.5. The results were interpreted using the following scale: Not Achieved—scores below 50; Marginal—scores between 50 and 68; and Achieved—scores above 68.
This qualitative classification provides a clearer and more practical understanding of the results and allows for more flexible interpretation of the data, aligned with the objectives of the analysis within the context of the study setting.
No stratified analysis was performed to evaluate potential differences in usability perceptions based on surgical complexity or underlying clinical conditions. The analysis focused exclusively on aggregated usability scores across the general study population.
Results
Sample Characteristics
The sample was nearly evenly distributed between men (53.23%) and women (46.77%), with age groups primarily composed of youth (38.71%) and adults (48.39%). Older adults represented 12.90% of the participants. Regarding educational level, secondary education was the most prevalent (41.94%), followed by primary education (22.58%) and technical training (19.35%). Only 16.13% of participants had a university-level education. The sociodemographic results suggest a predominantly young and young adult population with limited educational attainment.
Internal Consistency and Usability Levels
An internal consistency analysis was conducted using Cronbach's alpha. The results yielded a coefficient of 0.81, indicating high internal consistency of the scale.
Table 1 presents the distribution of usability levels in the sample, categorized as “Not Achieved,” “Marginal,” and “Achieved,” based on the previously established classification. Of the 62 participants, 48.39% perceived the system's usability as “Achieved,” indicating that it meets acceptability criteria. However, 32.26% fell into the “Marginal” category, suggesting that while the system is functional, there are areas that could improve the user experience. On the other hand, 19.35% rated the usability as “Not Achieved,” reflecting significant difficulties in interacting with the system. These results show that although the overall perception is favorable, a considerable proportion of users encounter barriers that may impact the system's efficiency and acceptance.
Usability Levels.

Item-Level Usability Analysis
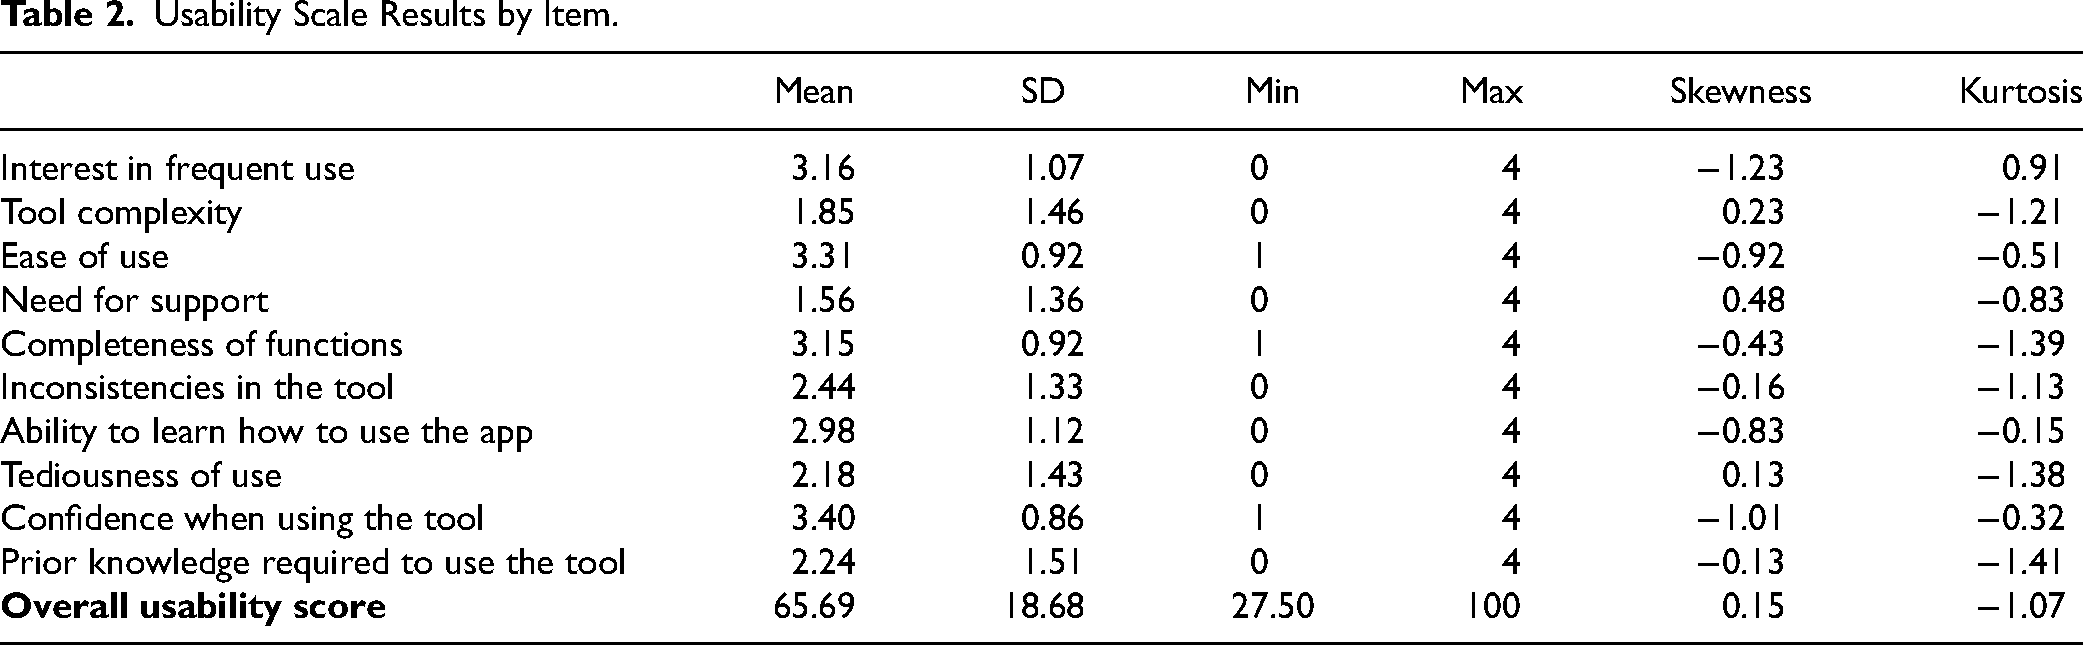
The overall usability score was 65.69 ± 18.68 (range: 27.50-100), with notable variability across dimensions (Table 2). Highest-rated items included confidence (3.40 ± 0.86) and ease of use (3.31 ± 0.92), while the lowest scores were for need for support (1.56 ± 1.36) and perceived complexity (1.85 ± 1.46). Intermediate scores were observed for ease of learning (2.98 ± 1.12) and system inconsistencies (2.44 ± 1.33), reflecting diverse user experiences.
Usability Scale Results by Item.
Normality was assessed using the Kolmogorov–Smirnov test (P = .001) and the Shapiro–Wilk test (P = .018), both suggesting that usability scores did not follow a normal distribution, justifying the use of nonparametric analyses.
While none of the demographic differences reached statistical significance, notable patterns emerged: males reported slightly higher usability scores than females (67.20 ± 20.04 vs 63.97 ± 17.19, P = .586), with youth scoring highest (70.83 ± 14.00), followed by adults (65.33 ± 20.07) and older adults (51.56 ± 20.18; P = .063). Similarly, primary education participants showed lower scores (54.46 ± 18.62) versus other education levels (∼67-69, P = .111). These trends suggest age and education may influence perceived usability, despite substantial within-group variability (Table 3).
Usability Scores by Gender, Age, and Educational Level.

Discussion
Sociodemographic Context
Although most participants were young or middle-aged, the usability score was lower than in comparable studies. This suggests that factors beyond age—such as educational level—may have influenced the user experience. Prior research has shown that younger users tend to rate digital tools more favorably, 26 but limited formal education can negatively affect familiarity with technology and ease of navigation.
In this context, McLean et al 12 emphasize that while digital literacy barriers do not necessarily prevent participation, users with lower skills may require additional training and support. This aligns with our findings, particularly the low score on the “need for support” item, reinforcing the importance of integrating usability strategies with appropriate technical assistance.
Reliability and Overall Usability Results
From a psychometric standpoint, the internal consistency analysis using Cronbach's alpha yielded a value of 0.81, indicating high reliability of the scale used to assess usability. This result is comparable to previous studies, such as that by Sevilla-González et al, 21 reinforcing the validity of the instrument applied.
The overall usability score was 65.69 ± 18.68, indicating a moderate user experience with high variability in responses. These values are lower than those reported in studies by Yang et al 24 (usability: 82.1) and Rian et al 15 (usability: 89.6), as well as in systematic reviews by McLean et al 12 (usability: 90) and Patel and Thind 13 (usability: 87). This discrepancy may be partially explained by the sociodemographic characteristics of the sample. In fact, Patel and Thind 13 noted the potential for population bias in digital tool evaluations, highlighting that studies with greater participation of younger patients tend to report higher usability levels.
In terms of usability level classification, 48.39% of participants perceived the system's usability as “Achieved,” meeting acceptable criteria. However, 32.26% rated it as “Marginal,” and 19.35% as “Not Achieved,” reflecting interaction challenges with the tool.
These results underscore the need to optimize the interface and adapt it to the specific needs of users. In particular, the item-level analysis revealed low scores in areas such as the need for support (1.56), perceived complexity (1.85), and prior knowledge required to use the tool (2.24), suggesting usability challenges. To address these issues, future interface improvements should focus on reducing visual and navigational complexity, using simplified language, and incorporating onboarding aids such as step-by-step tutorials or contextual guidance for first-time users. Based on this feedback, interface improvements could also include larger buttons, clearer progress indicators, confirmation messages after survey completion, and simplified terminology to enhance clarity. These design refinements aim to reduce cognitive load and support better comprehension, especially among older users or those with limited digital literacy.
Item-Level Analysis and Opportunities for Tool Improvement
The detailed analysis of the scale revealed positive evaluations regarding ease of use (3.31 ± 0.92) and confidence when using the tool (3.40 ± 0.86), indicating a generally favorable perception in these areas. Likewise, completeness of functions (3.15 ± 0.92) and speed of learning (2.98 ± 1.12) also stood out, although some variability in the learning curve was observed.
Several areas for improvement were identified. Low scores in perceived complexity (1.85 ± 1.46) and need for support (1.56 ± 1.36) reveal varying user experiences; while some found the tool intuitive, others required assistance. Notably, the low “need for support” score may reflect the responsiveness of the follow-up nursing team rather than the tool's usability itself, underscoring the importance of complementing digital tools with human support.
Additional usability challenges included interface inconsistencies (2.44 ± 1.33), tedious interaction (2.18 ± 1.43), and the perception that prior knowledge was needed (2.24 ± 1.51). These issues suggest opportunities to enhance design coherence and user flow. For example, aligning button functions across screens, reducing redundant navigation, and ensuring visual consistency could improve perceived consistency. Smoother transitions between survey sections and fewer required clicks may streamline interaction. The perceived need for prior knowledge indicates a lack of onboarding clarity or user guidance.
These findings are aligned with McLean et al, 12 who reported high levels of patient satisfaction (72%-100%) and usefulness (78%-100%) in digital postoperative monitoring, although ease of use varied (57.9%-100%). Their review emphasized that while digital literacy did not prevent participation, training and support were often necessary, which mirroring this study's findings. Additionally, McLean et al 12 noted that accessibility and adherence were not always assessed, reinforcing the relevance of addressing complexity and knowledge barriers when designing inclusive digital tools for postoperative care.
Differences in Experience Based on Sociodemographic Variables
Results revealed differences in usability scores based on age and educational level, although these did not reach statistical significance. Younger users and those with higher educational attainment achieved higher usability scores, whereas older adults and individuals with lower levels of education encountered more difficulties in using the tool. This finding aligns with previous literature, which identifies digital literacy as a key factor in the adoption of health technologies.14,16 Furthermore, Oudbier et al 22 warn that disparities in technology use can lead to gaps in digital adoption, where certain groups readily integrate these tools, while others may choose not to use them at all.
However, there is ongoing debate regarding the relationship between age and usability. Ponder et al 18 documented that patients with a mean age of 59 years successfully used a postoperative monitoring application, suggesting that age alone is not the determining factor. Rather, familiarity with technology and access to support resources play a key role. Along the same lines, Patel and Thind 13 suggest that the perceived usability among older individuals may improve over time as this demographic becomes more accustomed to digital device usage.
The results suggest that both age and educational level may influence users’ perceptions of usability in digital postoperative monitoring tools. While younger individuals and those with higher education reported better experiences, these differences were not statistically significant. Nevertheless, inclusive design and targeted technical support can help bridge these gaps and ensure accessibility for all users.
Regarding gender, men showed slightly higher usability scores than women, but the difference was also not significant. This variability may reflect individual differences rather than gender-specific patterns. Although some studies indicate that men express greater confidence in technology use and women tend to be more critical, digital literacy and prior experience appear to be more decisive factors than gender alone.
To reduce usability barriers, design strategies should incorporate clear language, intuitive navigation, high-contrast visuals, and larger interactive elements. Support features such as visual guides and integrated help functions are also recommended to enhance accessibility, particularly for older adults or users with limited digital skills, ensuring a more equitable digital health experience.
Limitations
This study presents several limitations. Its cross-sectional design and nonrepresentative sample restrict the generalizability of the findings and prevent analysis of temporal changes. Usability assessments were based solely on self-reported perceptions, without integrating objective digital literacy measures that could clarify their influence on user experience.
Furthermore, usability results were not stratified by surgical complexity or patient comorbidities, which limits the ability to determine whether individuals with more severe or complex clinical conditions experienced greater difficulties using the tool. This restricts the depth of insight into the needs of more vulnerable or high-risk populations.
Additionally, the absence of qualitative methods hindered deeper exploration of user expectations, contextual barriers, and opportunities for system improvement. Future research should adopt mixed methods designs that incorporate clinical variables and direct feedback from users and healthcare professionals to improve tool development and implementation strategies.
Conclusion
This study found a moderate level of usability for the digital tool, with younger and more educated participants reporting a more favorable experience. Although these differences were not statistically significant, they suggest potential disparities linked to age and educational background. No significant gender differences were observed.
Key challenges included perceived complexity, need for support, and the requirement of prior knowledge, underscoring the importance of inclusive design and user training. The findings highlight the need to simplify interfaces and enhance user guidance to improve engagement, acceptance, and the effective use of digital tools in postoperative care.
Footnotes
Acknowledgments
We thank the Teaching and Research Directorate (Dirección de Docencia e Investigación) of Hospital General Docente Calderón for authorizing the implementation of this study.
Data Availability Statement
The anonymized usability data (System Usability Scale scores) are publicly available in the Figshare repository (doi:10.6084/m9.figshare.29043014). To comply with ethical regulations, individual demographic (age, gender, and education) and clinical data are not shared but may be requested from the corresponding author with approval from the institutional ethics board (CEISH-PUCE).
Declaration of Conflicting Interest
The authors declared no potential conflicts of interest with respect to the research, authorship, and/or publication of this article.
Funding
The authors disclosed receipt of the following financial support for the research, authorship, and/or publication of this article: This study was funded by the Pontificia Universidad Católica del Ecuador (PUCE).
Ethical Approval and Informed Consent Statements
This study was approved by the Human Research Ethics Committee (CEISH) of the Pontificia Universidad Católica del Ecuador (approval code: PV-06-2023). All participants were informed about the study and provided written informed consent prior to participation.