
Abstract
Much research has examined the drivers of firms’ R&D investments. However, many questions remain with respect to the role of R&D as a learning target and as a means of achieving legitimacy, particularly in the context of imitative R&D strategy. We develop a theory that integrates different explanations of why firms engage in imitation, highlighting efficiency-enhancing learning and legitimacy and focusing on firms’ R&D investment decisions. We argue that deviations in firm performance from social aspiration levels determine the salience of learning and legitimacy goals. Specifically, as performance moves from lying below to being above social aspiration levels, organizations gradually shift from a primary focus on learning vicariously from others’ R&D investments toward a focus on mimicking them to maintain legitimacy. An analysis of a sample of 2,081 Spanish manufacturing firms, as well as an online experiment with 863 participants from the manufacturing industry largely support our hypotheses.
Introduction
The nature and determinants of R&D strategy have long captured the interest of innovation and strategy scholars (e.g., Artz et al., 2010; Biemans et al., 2007; Colombo et al., 2021; Snihur & Wiklund, 2019). The literature recognizes that R&D strategies are formulated and executed taking other firms into account (e.g., C.-Y. Lee, 2009; Wang & Yang, 2022). However, the influence of strategic goals on imitative R&D strategies, including how much to invest in R&D, remains ill-understood. In this article, we examine what drives imitative R&D investments, placing inter-organizational imitation at the center of our theoretical framework and focusing on its intersections with learning and legitimacy goals.
Inter-organizational imitation is a well-recognized response to uncertainty (Cyert & March, 1963; Greve, 1995; Haunschild & Miner, 1997; Jenkins, 2014; Ordanini et al., 2008). When it is difficult for firms to predict the consequences of a particular behavior, they form reference groups of salient other organizations whose traits may serve as proxies for desired outcomes (Baum et al., 2000; Haveman, 1993; Rhee et al., 2006). Large and profitable firms, for instance, are often perceived as models of success, reducing the uncertainty associated with the decision to imitate their practices and behaviors (Greve, 2005; Haunschild & Miner, 1997; Haveman, 1993). 1 The specific motivations underpinning imitative firm behaviors are discussed by two streams of research (Gaba & Terlaak, 2013; Henisz & Delios, 2001; Lieberman & Asaba, 2006; Rhee et al., 2006). One is rooted in organizational learning theory and views imitation as a low-cost way to learn and optimize practices (e.g., Baum et al., 2000; Greve, 2005; Park, 2007). The other is based on neo-institutional theory and argues that firms imitate the behavior of successful firms to enhance their legitimacy (DiMaggio & Powell, 1983; Haveman, 1993). Despite their distinct foci, learning and legitimacy goals are rarely integrated in theorizing and/or confronted in empirical tests. Goal multiplicity is increasingly acknowledged in both organizational learning theory in the form of firm performance distance from the reference group across different goal variables (e.g., Gaba & Greve, 2019; Mazzelli et al., 2019) and in institutional theory in the form of a concern with conflicting logics (Greenwood et al., 2011). And yet, existing work on inter-firm imitation has tended to consider either learning or legitimacy as the drivers of the imitative behavior (Ordanini et al., 2008).
We address this gap by exploring the dual motivations of learning and legitimacy in imitation. Consider, for example, the adoption of Diversity-Equity-Inclusion or sustainability practices. Firms imitate others to learn best practices and improve implementation while simultaneously enhancing their legitimacy with stakeholders (Haunschild & Miner, 1997; M. T. Kennedy & Fiss, 2009; T. Kim & Rhee, 2017). Similarly, firms may imitate the product-development routines, organizational structures, information systems, and so on of other firms both to learn and to elevate stakeholders’ judgments of them. Both goals and motivations may be at play at the same time when firms engage in imitation (George et al., 2006; M. T. Kennedy & Fiss, 2009). However, they may vary in salience depending on situational contingencies. For example, organizations may initially imitate the sustainability practices of other companies to gain legitimacy among stakeholders and later prioritize learning as they refine their practices. Alternatively, mounting stakeholder pressure or significant R&D discrepancies relative to peers may shift goal salience over time. The purpose of this article is to advance an integrated understanding of why firms imitate each other, particularly in the realm of R&D investment.
Building on the behavioral theory of the firm (Cyert & March, 1963; Eggers & Suh, 2019; Greve, 2003), we argue that firms adjust their R&D investments based on discrepancies between their current R&D intensity and a target level established by a socially salient reference group (i.e., the “R&D discrepancy”) (Park, 2007; Westphal et al., 2001). We propose that R&D investment decisions reflect the pursuit of learning and legitimacy goals as follows. When learning goals dominate, R&D discrepancies increase the pressure to imitate socially salient firms’ R&D investments to optimize R&D and improve firm efficiency. Conversely, when legitimacy goals dominate, increases in R&D discrepancy decrease the pressure to imitate socially salient firms’ R&D investments as demonstrating conformity with norms becomes less critical. Hence, because the observed organizational behavior is determined by the joint pursuit of learning and legitimacy goals, we argue that the shape of the relationship between R&D discrepancy and R&D intensity reflects whether learning or legitimacy goals are deemed more salient by a focal firm.
We further posit that goal salience is influenced by firm performance relative to social aspiration levels. Firm profitability, as a widely recognized indicator of a firm’s functioning and external acceptance (Greve & Teh, 2018), shapes decision-makers’ allocations of attention and the resulting organizational behavior (Chen & Miller, 2007; Miller & Chen, 2004). The basic intuition is that learning goals tend to be more salient when organizations are close enough to socially aspired performance levels, while legitimacy goals gain salience as profitability moves above these levels.
We test these arguments in two complementary studies within the manufacturing industry—an industry in which R&D has significant competitive importance for firms. Study 1 sheds light on performance relative to social aspiration levels as a key contingency factor affecting the salience of learning and legitimacy goals. However, it is carried out without direct observation of specific managerial goals and decision-making processes. To address this limitation, Study 2 employs an experimental design to explicitly examine the role of R&D discrepancies and performance relative to social aspirations in shaping managerial motivations and decision-making processes concerning firm R&D investments. Together, these studies provide a robust, integrated perspective on the drivers of imitation in R&D investment decisions.
Overall, our work brings greater conceptual clarity around the notions of choice and deliberation in inter-organizational imitation by integrating organizational learning and neo-institutional explanations of imitation and empirically teasing apart the antecedents—learning and legitimacy goal salience—to imitation.
Theory and hypotheses
Inter-organizational imitation has long been recognized as a strategic response to uncertainty and competition in management research. This section reviews the literature on imitation, emphasizing its interplay with learning and legitimacy, and situates these concepts within the context of R&D investment. By integrating these perspectives, we aim to clarify the theoretical foundations of our study and develop our hypotheses.
The motivational drivers of inter-organizational imitation: learning and legitimacy goals
Imitation involves the choice and act of adopting the behaviors, practices, or strategies of other organizations, particularly those perceived as successful or legitimate (DiMaggio & Powell, 1983; Haunschild & Miner, 1997). As such, it involves observing and replicating actions from reference groups that serve as models. As concerns the motivational drivers of inter-organizational imitation, organizational learning theory and neo-institutional theory offer different arguments, pointing to ostensibly different mechanisms (Greve, 2013; Lieberman & Asaba, 2006).
Organizational learning theory posits that firms imitate to acquire knowledge and improve efficiency, particularly under uncertainty or resource constraints (Greve, 2005; Park, 2007). By observing the decisions and behaviors of organizations with salient traits, notably size and profitability, firms reduce the costs and risks associated with trial-and-error experimentation (Duysters et al., 2020; Levitt & March, 1988; Rhee et al., 2006). This is because the decisions that large and profitable firms adopt are interpreted as conducive to success and hence less uncertain (Baum et al., 2000; Greve, 2005; Haunschild & Miner, 1997). There is indeed robust evidence that the behavior of large and profitable firms affects decision-makers’ strategic actions and choices on new market entry (Greve, 1998; Greve & Taylor, 2000; Haveman, 1993), alliance and acquisition strategies (Baum et al., 2000; Garcia-Point & Nohria, 2002; Haunschild & Miner, 1997), new product introductions (Srinivasan et al., 2007), and facility location (Baum & Haveman, 1997; Henisz & Delios, 2001). In the context of R&D, imitation facilitates the optimization of resource allocation and innovation processes by adopting investment strategies and practices already validated by peers or competitors. For instance, firms may align their R&D spending with that of prominent competitors to ensure competitiveness while minimizing exploratory risks.
In contrast, neo-institutional theory emphasizes imitation of other socially salient firms in the industry as a mechanism for protecting and/or ameliorating external actors’ legitimacy judgments of the firm (Burns & Wholey, 1993; Deephouse, 1996; DiMaggio & Powell, 1983; Williamson & Cable, 2003). Firms replicate the behaviors of socially accepted or influential peers to align with institutional norms and stakeholder expectations (DiMaggio & Powell, 1983; Haveman, 1993). Whether such imitation improves profitability is less salient (George et al., 2006). For instance, firms may imitate the R&D practices of industry leaders, such as adopting similar innovation frameworks or research methodologies, as well as aligning their R&D investments with those of prominent competitors, to signal their commitment to cutting-edge advancements and enhance their legitimacy as a competitive and forward-thinking organization among stakeholders.
Although they are typically treated separately in the literature, learning and legitimacy goals are not necessarily independent or mutually exclusive (George et al., 2006; M. T. Kennedy & Fiss, 2009; T. Kim & Rhee, 2017). Research has highlighted that goal multiplicity is a common feature of organizational behavior (Audia & Greve, 2021; Fiegenbaum et al., 1996). Firms can pursue multiple goals simultaneously, with the salience of each goal varying based on contextual contingencies (Gaba & Greve, 2019). For example, Gaba and Greve (2019) show that firms navigate multiple (even conflicting) goals, such as safety and profitability, by dynamically prioritizing them based on performance feedback and external pressures. M. T. Kennedy and Fiss (2009) highlight the dynamic interplay between social and economic performance motivations in practice adoption, finding that these motivations coexist, and their respective salience is affected by how adoption decisions are framed—as either opportunities or threats. Similarly, research on institutional logics indicates that organizations often manage tensions between competing demands by adjusting their goals based on situational factors (Greenwood et al., 2011). In the context of R&D, the dynamic interplay between learning and legitimacy may imply that firms adapt their imitation strategies to align with internal objectives and external expectations, depending on the circumstances of the situation. For instance, firms that underperform relative to their peers may prioritize learning to address performance gaps, leveraging imitation to acquire knowledge and improve efficiency. Conversely, firms that (slightly) exceed social aspirations may use imitation to maintain their legitimacy and align with evolving stakeholder expectations.
R&D intensity as a nexus for learning and legitimacy goals
R&D intensity is a key indicator that both internal and external constituents use to assess firms’ current technological capabilities as well as their ability to develop such capabilities in the longer run (Hauser, 1998; Hughes, 1988; Knott & Posen, 2009). 2 Accordingly, firms likely define aspiration levels for both learning and legitimacy goals and commit resources to R&D based on their observations of the R&D intensity of salient firms. For example, aligning with industry benchmarks in R&D intensity can optimize innovation processes (a learning goal) while simultaneously signaling to stakeholders a firm’s alignment with industry standards and expectations (a legitimacy goal).
R&D intensity and learning goals
The pursuit of learning goals makes firms use the R&D intensity level of salient firms to evaluate their technological capabilities (Baum & Dahlin, 2007; Srinivasan et al., 2007; Westphal et al., 2001). Failure to achieve the desired level of R&D intensity increases the pressure to discover ways to improve the firm’s functioning (Baum et al., 2005). Firms learn vicariously by imitating the R&D spending of salient firms and increasing R&D spending to a level considered sufficient to engage in innovation and remain competitive in the industry (Baum et al., 2000; Greve, 2003).
For example, consider the situation in which a focal firm spends 2% of sales on R&D but its socially salient competitors spend an average of 5%. According to the aforementioned arguments, the focal firm has a strong motivation to increase its R&D spending, and the gap can be closed by means of imitation, which acts as a form of low-cost search in which the firm moves closer to the reference group (Ethiraj et al., 2008). In contrast, if the focal firm spends 1% of sales on R&D and its socially salient competitors spend an average of, say, 10%, we expect the motivation to alter R&D intensity to match competitors to be lower. The reason is that the focal firm perceives an increase in 9 percentage points as too risky given the long gestation periods and the high uncertainty of the investment. Put differently, it may fear that escalating its R&D budget drastically might not generate proportional returns. Furthermore, within firms, different units often compete for budget allocation: a firm that has historically focused on marketing may face internal resistance to reallocating significant funds toward R&D (Arrfelt et al., 2013). Finally, research suggests that when gaps are perceived as insurmountable, firms may exhibit rigidity, characterized by a narrowing of focus and a reluctance to substantially invest in R&D (Shimizu, 2007; Staw et al., 1981). Taken together, these arguments imply that any increase in the (negative) distance between a focal firm’s R&D intensity and the target level will generate a smaller increase in the focal firm’s R&D intensity.
On the other hand, firms exceeding the social aspiration level may adjust their R&D intensity to avoid inefficiencies. Slightly surpassing the aspiration level may lead firms to maintain the current emphasis on R&D (Amburgey & Miner, 1992). However, as R&D requires substantial financial investments and has highly uncertain outcomes, large positive deviations from the aspiration level are likely to lead to R&D intensity reductions (cf. J. J. A. Y. Kim et al., 2015), balancing the need to sustain innovation competencies with efficient budget-allocation considerations. In sum, learning goals result in an increasingly negative relationship between the distance of the R&D intensity level from the selected target and the decision to invest in R&D, suggesting that the shape of the R&D discrepancy-R&D intensity relationship will be concave.
R&D intensity and legitimacy goals
Firms may also use the R&D intensity of socially salient firms to assess their legitimacy (George et al., 2006). Research suggests that legitimacy concerns are highest in salience when deviations from socially desirable targets are minor, as larger deviations may lead to exclusion from the relevant group (Phillips & Zuckerman, 2001). In the context of R&D, firms with R&D intensity far below aspirations may disregard targets altogether, while those near the aspiration level are more likely to align with industry norms to enhance the legitimacy judgments of key stakeholders (George et al., 2006; Phillips & Zuckerman, 2001). On the other hand, firms that surpass other salient firms in their R&D intensity may experience a sense of mastery over the situation and capitalize on their position to reinforce their legitimacy as industry R&D leaders (George et al., 2006; T. Kim & Rhee, 2017; Rhee, 2009). Taken together, these arguments suggest that legitimacy goals lead R&D intensity to increase at an increasing rate as the R&D discrepancy increases, implying a convex R&D discrepancy-R&D intensity curve.
Therefore, in the proximity of the R&D reference threshold, when the focal firm is closer to but still below the threshold, learning and legitimacy goals are aligned, making the firm imitate peers and increase its R&D intensity toward the reference level. By doing so, firms may simultaneously become more competitive (as they strengthen their R&D capabilities) and enhance legitimacy judgments among stakeholders. However, as the focal firm moves significantly above the aspiration level, learning and legitimacy goals diverge. Legitimacy considerations might encourage further distinctiveness and higher R&D spending, whereas learning-related considerations may drive the firm to reduce R&D intensity to avoid inefficiencies and the risks of overinvestment.
The slope and curvature of the R&D discrepancy-R&D intensity relationship in Study 1 represent the relative salience of learning and legitimacy goals and how firms balance internal needs for innovation with external pressures to conform to industry norms. A concave relationship reflects a greater salience of learning goals, while a convex one indicates a greater emphasis on legitimacy goals. 3 Furthermore, in Study 2, we explicitly measure and test the two underlying motivations, exploring whether and how their salience is influenced by the R&D discrepancy level, particularly in “gray areas” where the two goals may align and drive behavior in the same direction.
Performance discrepancies and the salience of learning and legitimacy goals
A key idea in the behavioral theory of the firm is that firms that operate below aspiration levels for overall performance (e.g., in terms of profitability) seek to enhance their standing relative to industry peers (Cyert & March, 1963) by understanding how other firms achieved their observed performance (J. J. A. Y. Kim et al., 2015). In the context of R&D activities, this implies that when performance is below the reference threshold, learning goals increase in salience. Firms will frame salient peers as providers of valuable cues for developing the competencies needed to improve performance and use their R&D levels as a benchmark against which to assess their own technical knowledge (Baum et al., 2005). For example, Yamaha Motor, in response to a 7% drop in revenues between 2015 and 2016, revised its commitment to R&D to align with competitors. The company had been reinvesting in R&D approximately 6.3% of its revenues in 2016, compared to an average of 3.4% among other large Japanese automobile manufacturers. In 2017, the company decreased its R&D intensity level by 6% (from 6.3% to 5.9%), focusing more on improving the efficiency of its R&D and innovation activities. 4 This suggests that the relationship between R&D discrepancy and R&D intensity becomes more concave (or less convex) when firm performance is below social aspirations.
In contrast, when firm performance exceeds social aspiration levels, learning goals lose salience as firms become less focused on acquiring knowledge or improving technical efficiency. Rather, legitimacy goals gain salience (George et al., 2006; T. Kim & Rhee, 2017; Rhee, 2009). Firms with profitability above social aspirations may choose to bolster legitimacy by aligning with socially salient firms’ R&D intensity levels or further distinguish themselves from peers to maintain high status and become reference points for R&D investments (e.g., George et al., 2006; M. T. Kennedy & Fiss, 2009; Rindova et al., 2006). For example, albeit consistently outperforming the industry average and outspending Apple on R&D between 2014 and 2017, Huawei Technologies and Co. further increased its R&D intensity levels in 2018. Specifically, the company ranked among the world’s top 2018 R&D spenders, with the second-highest R&D intensity (i.e., 14%), surpassing Samsung’s R&D intensity level of 8% and trailing only Alphabet’s 16% (Bloomberg, 2019). These predictions are illustrated in Figure 1 and summarized in the following hypothesis:
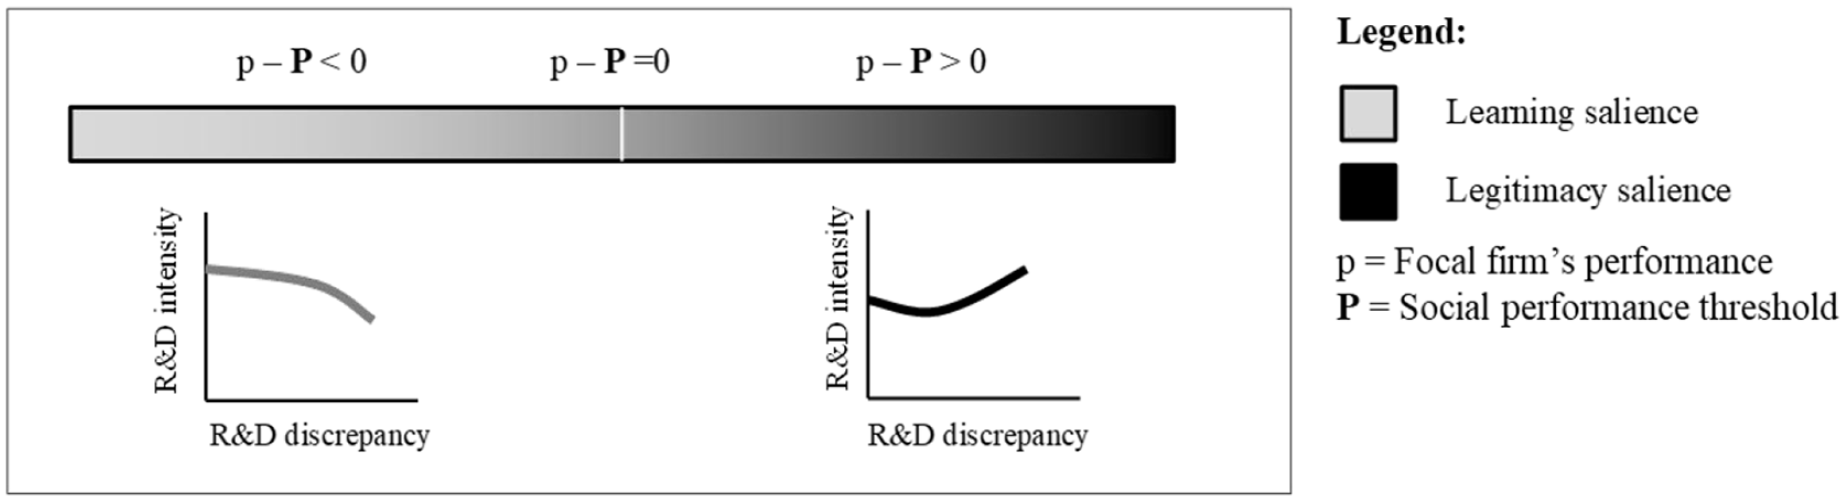
Graphical illustration of Hypothesis 1.
In addition to an increase in the salience of learning (legitimacy) below (above) social aspiration levels, we hypothesize goal salience to be affected by the specific performance benchmark. Industry benchmarks such as average profitability and top performer thresholds play a critical role in shaping these dynamics (e.g., Baum & Dahlin, 2007; Greve, 2008; J. J. A. Y. Kim et al., 2015; Labianca et al., 2009; Moliterno et al., 2014). Accordingly, we focus on how a firm’s profitability relative to these thresholds affects the salience of learning and legitimacy goals, and consequently, imitation in R&D investment decisions.
The average performance threshold of the industry
When the focal firm is below the industry’s average performance threshold, learning goals become increasingly salient as the negative distance between the firm’s profitability and the industry average grows. Firms dropping below this threshold face increasing pressure to address performance shortfalls while also managing financial constraints, making it necessary to economize on search costs (Chen & Miller, 2007; Greve, 2003). As a result, firms will rely more heavily on the gap between their R&D intensity and that of socially salient firms in the industry to obtain learning-enhancing cues (Bolton, 1993). At the same time, they will also decrease their R&D intensity more sharply when above the R&D reference level. Thus, as a firm’s performance distance below the industry’s average performance threshold increases, the concavity of the R&D discrepancy-R&D intensity curve will increase (Figure 2).
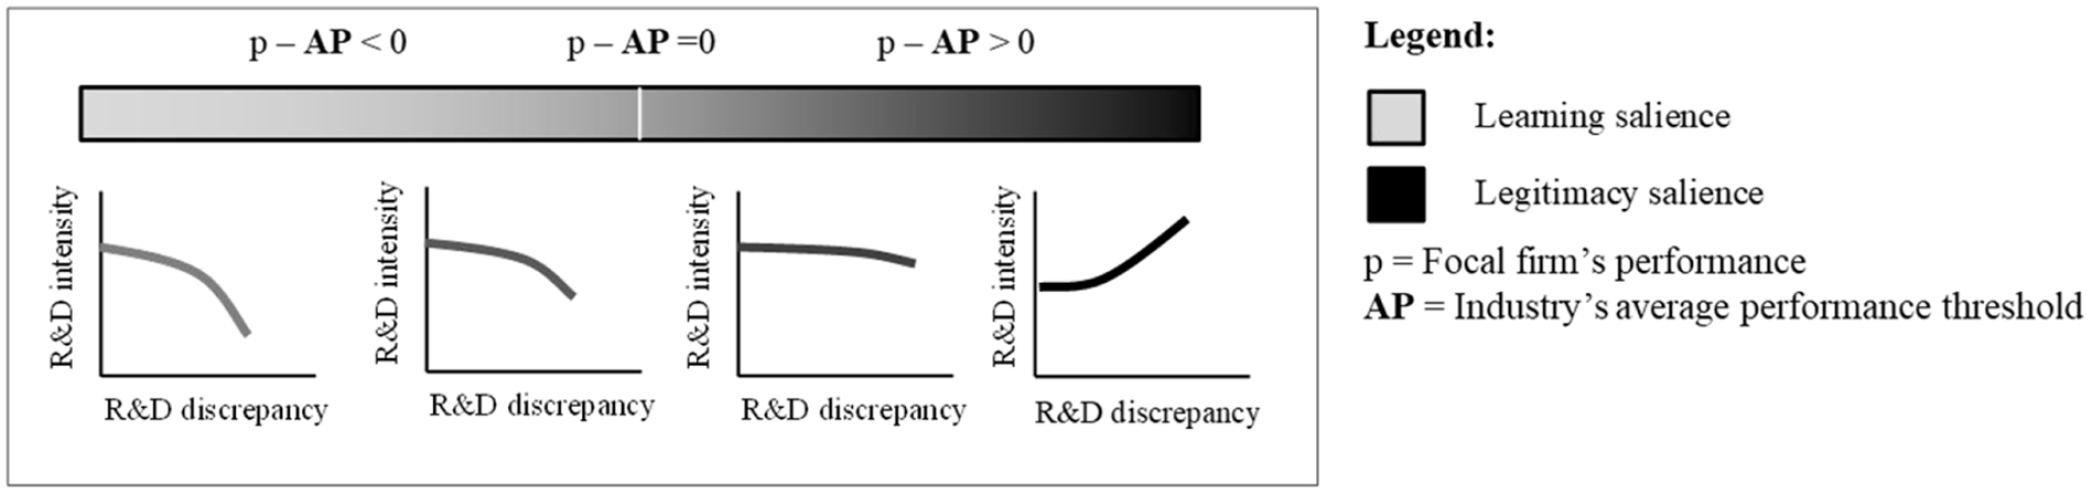
Graphical illustration of Hypotheses 2a and 2b.
In contrast, when firm profitability exceeds the industry’s average performance threshold, firms are likely to focus on achieving or maintaining high-status classification due to increased visibility among stakeholders (Phillips & Zuckerman, 2001). 5 These firms will prioritize legitimacy goals by trying to enhance external judgments of their qualifications (Phillips & Zuckerman, 2001; Rhee, 2009). This means that legitimacy salience increases as the distance of the firm’s profitability from the industry’s average performance threshold rises, increasing the convexity of the R&D discrepancy-R&D intensity curve (see Figure 2). Taken together, these arguments suggest:
The industry’s top performance threshold
For firms performing above the industry average, top industry performance holds significant comparative and normative value (Festinger, 1954; Moliterno et al., 2014). However, a top performance threshold must be perceived as feasible for a firm to focus on learning how to reach it (Labianca et al., 2009). As the gap between a firm’s current performance and the top performance threshold narrows, learning salience increases, as firms consider the target more achievable and are motivated to learn how to achieve it by using R&D discrepancy as a relevant cue. In contrast, as the gap widens, firms will view the target as increasingly unattainable, shifting attention away from learning how to reach it (Sitkin et al., 2011). Therefore, we expect that firms’ performance proximity to the top performance threshold increases the concavity of the R&D discrepancy-R&D intensity curve as illustrated in Figure 3.
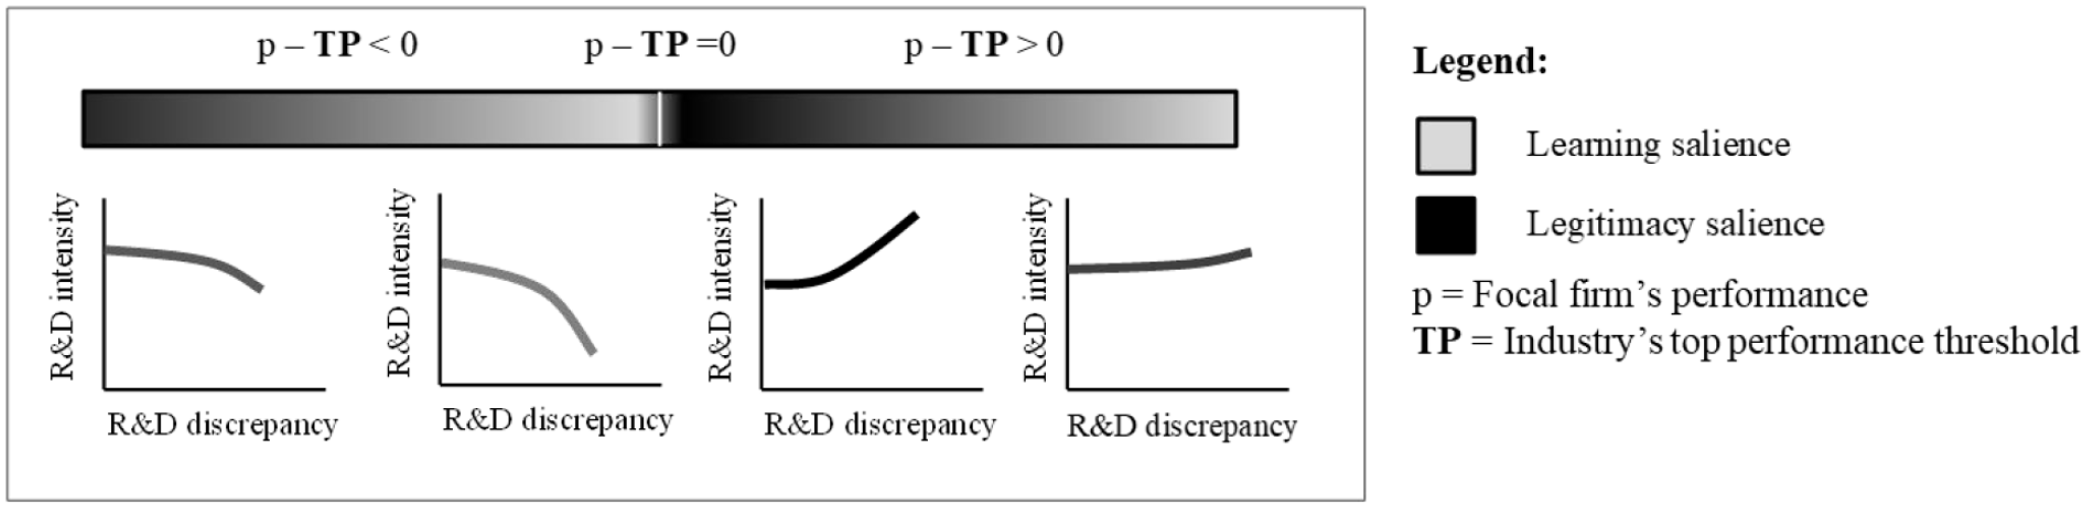
Graphical illustration of Hypotheses 3a and 3b.
External audiences also use the industry’s top performance level to define high-status group membership (Labianca et al., 2009; Moliterno et al., 2014). Hence, firms performing above this threshold gain social acceptance and the privileges of high-status membership (i.e., visibility, prestige, and deference) (Bitektine, 2011). Legitimacy goals will become particularly salient when firms perceive that their membership in such a high-status group is at stake, which is most likely in the proximity of the lower boundary of the top performance domain (Moliterno et al., 2014). The fear of losing high-status membership motivates firms to take actions that preserve their legitimate membership in the high-status group by signaling appropriateness and desirability to external stakeholders (Phillips & Zuckerman, 2001; Rhee, 2009). In contrast, as firm performance moves further above the top performance threshold, concerns about maintaining high-status membership diminish, reducing the salience of legitimacy goals. Thus, as firms approach the top performance threshold from above, we expect the convexity of the R&D discrepancy-R&D intensity curve to increase (Figure 3):
Methods, Study 1
Sample and data sources
To test our hypotheses, we used a representative sample of manufacturing firms from the Spanish database Encuesta Sobre Estrategias Empresariales (ESEE or Survey on Business Strategies) covering the period 1998–2012. All firms with more than 200 employees were surveyed, whereas firms with between 10 and 200 employees were selected based on a stratified sampling. The high response rate (approximately 90%) across years supports the sample’s representativeness (Greenwood et al., 2010). Our final sample included 2,081 firms and 12,845 firm-year observations after addressing missing R&D expenditure values 6 and lagging independent variables.
Dependent and independent variables
R&D intensity
Our dependent variable captures a firm’s strategic focus on R&D and its potential to develop and maintain innovative knowledge assets, providing stakeholders with visibility into an expense category designed to produce future growth and social value (Bromiley et al., 2017; Heeley et al., 2007). It is measured as a firm’s R&D expenditure divided by sales in year t (Chen & Miller, 2007; Greve, 2003). 7 The measure accounts for size effects (i.e., scaling) and increases stationarity (Desyllas & Hughes, 2010).
R&D discrepancy
We constructed social aspiration levels for R&D based on the average R&D intensity of the largest and most profitable firms (top quartile by assets and return on assets [ROA]), excluding the focal firm in year t-2 in the focal firm’s manufacturing sector. 8 R&D discrepancy was calculated as the difference between the focal firm’s R&D intensity in year t-1 and the reference group’s average R&D intensity. To test for curvilinear effects, both linear and quadratic terms for R&D discrepancy were included in our models. We also tested alternative definitions of social salience using reference groups based on firms in the top 5%, 10%, and 15% of the industry’s assets and ROA distributions, as well as technological leadership. Specifically, we constructed the R&D social aspiration level (above-average R&D intensity, and above-median product launches and patents). Results were consistent across these specifications (see Appendix D in the Supplemental Material).
Distance below/above the industry’s average performance threshold
We calculated the discrepancy between firm profitability (ROA) in year t-1 and the average profitability of manufacturing firms in year t-2. Separate variables captured performance below (positive right-censored) and above (positive left-censored) the industry average (Chen, 2008). 9
Proximity below/above the industry’s top performance threshold
We measured proximity to the industry’s top performance threshold as the inverse function of the absolute value of the social performance discrepancy between firm ROA in year t-1 and the top quartile of industry ROA in year t-2, which we then multiplied by 1/10. We again constructed two continuous but censored variables to control for the behavior of firms performing below and above the manufacturing sector’s top performance level. Robustness checks using alternative thresholds (top 5%, 10%, and 15% of the industry’s ROA distribution) yielded consistent results.
Control variables
We included several variables to control for alternative explanations of changes in R&D intensity. Unless otherwise specified, the control variables were lagged 1 year to mitigate reverse causality concerns and avoid simultaneity. As firm-level controls, we included the focal firm’s lagged R&D intensity to control for the routinized allocation of resources to R&D (Amburgey & Miner, 1992; Greve, 2003). We also controlled for slack based on the standardized mean of absorbed (working capital to sales ratio), unabsorbed (current assets to current liabilities ratio), and potential slack (equity to debt ratio; Chen, 2008), as well as distance from bankruptcy proxied by Altman’s Z-score,
10
with a lower score indicating a higher likelihood of bankruptcy (Chen & Miller, 2007). As the geographical distribution of operations is likely to influence R&D intensity (Funk, 2014; Lahiri, 2010), we included a measure of geographical dispersion of a firm’s facilities in Spain, calculated as
At the industry level, we included industry annual sales growth between years t-1 and t to control for the industry’s demand prospects (Chen, 2008). Moreover, as changes in R&D intensity can be caused by environmental shocks, we controlled for the industry’s average R&D intensity in year t (Chen & Miller, 2007; Park, 2007). Finally, we included year dummies to control for factors specific to a particular year that might affect R&D investment decisions.
Estimation
To ensure robustness in our analyses, we addressed heteroscedasticity and autocorrelation detected through the modified Wald test for groupwise heteroscedasticity and the Wooldridge test for autocorrelation. Fixed-effects regression models with Driscoll-Kraay standard errors with temporal lags were used to correct for these issues, also accounting for cross-sectional dependence (cf. Driscoll & Kraay, 1998; Hoechle, 2007).
To detect the curvilinearity of the relationship between R&D intensity and R&D discrepancy, we followed the three-step procedure reported by Lind and Mehlum (2010) (Haans et al., 2016). This involved: (1) testing the joint significance of the direct and squared terms of R&D discrepancy; (2) assessing curvilinearity using the Sasabuchi (1980) test, which tests the composite null hypothesis that the relationship increases at low values of R&D discrepancy, decreases at high values, or both; and (3) constructing confidence intervals for the turning point, using Fieller’s method to determine if these fell within the data range.
To test H1, which proposes a more convex (less concave) R&D intensity-R&D discrepancy curve below than above a given social performance threshold, we incorporated performance gap indicator variables, to capture whether a firm’s past performance was above(below) the industry’s average performance threshold and the industry’s top performance thresholds. These interaction terms allowed us to test whether learning salience dominates below a given threshold (indicated by a negative sign for the interaction involving the quadratic term) and legitimacy salience above a threshold (indicated by a positive sign for the interaction involving the quadratic term). 11
H2a and H2b propose an increase in the concavity of the relationship between R&D discrepancy and R&D intensity as the firm’s profitability further declines below the industry’s average performance threshold and an increase in its convexity as the firm’s profitability increases further above the industry’s average performance threshold, respectively. These hypotheses were tested by interacting the linear and quadratic terms of the R&D discrepancy variable with the distance below/above the industry’s average performance thresholds. If learning(legitimacy) salience increases with the distance of firm profitability below (above) the industry average threshold, then the coefficient for the interaction between the quadratic term of R&D discrepancy and the distance below (above) the average performance threshold should have a negative (positive) and significant sign.
To test H3a and H3b, we formed interaction variables between the linear and quadratic terms of R&D discrepancy and each of the proximity below/above the industry’s top performance threshold variables. If learning(legitimacy) salience increases as firm profitability moves closer to the industry’s top performance threshold from below(above), then the coefficient for the interaction between quadratic R&D discrepancy and proximity below(above) the industry’s top performance threshold should be negative(positive) and significant.
To address self-selection biases among firms reporting R&D expenditure, we applied a two-stage Heckman selection model. In the first stage, for each period t, we estimated a selection-stage probit model predicting the likelihood of reporting R&D expenditures including all the control variables and two additional instruments (cf. Wooldridge, 2002). Our first instrument was the proportion of other firms in the same industry reporting their R&D expenditures, which is expected to be positively correlated to the probability that a firm discloses R&D. The exogeneity argument is that the mere presence of industry peers reporting R&D has no direct effect on a particular firm’s R&D intensity level, after controlling for firm and industry characteristics. The second instrument was a binary variable indicating whether the focal firm had a website in year t. The idea is that firms with online presence put greater value on information disclosure but are also subject to heightened external scrutiny, thereby possibly affecting the disclosure of R&D expenditures. From this model, we derived an inverse Mills ratio, which we then included as a covariate in the models predicting R&D intensity. Evidence of sample selection was observed, as the inverse Mills ratio was significant in all models predicting R&D intensity.
Results, Study 1
Table 1 provides descriptive statistics and correlations for all variables. Although some variable correlations are relatively high, the variance inflation factor scores (VIFs) are less than 1.98 on average, which indicates that multicollinearity is not a concern.
Study 1—Descriptive statistics and correlation matrix.
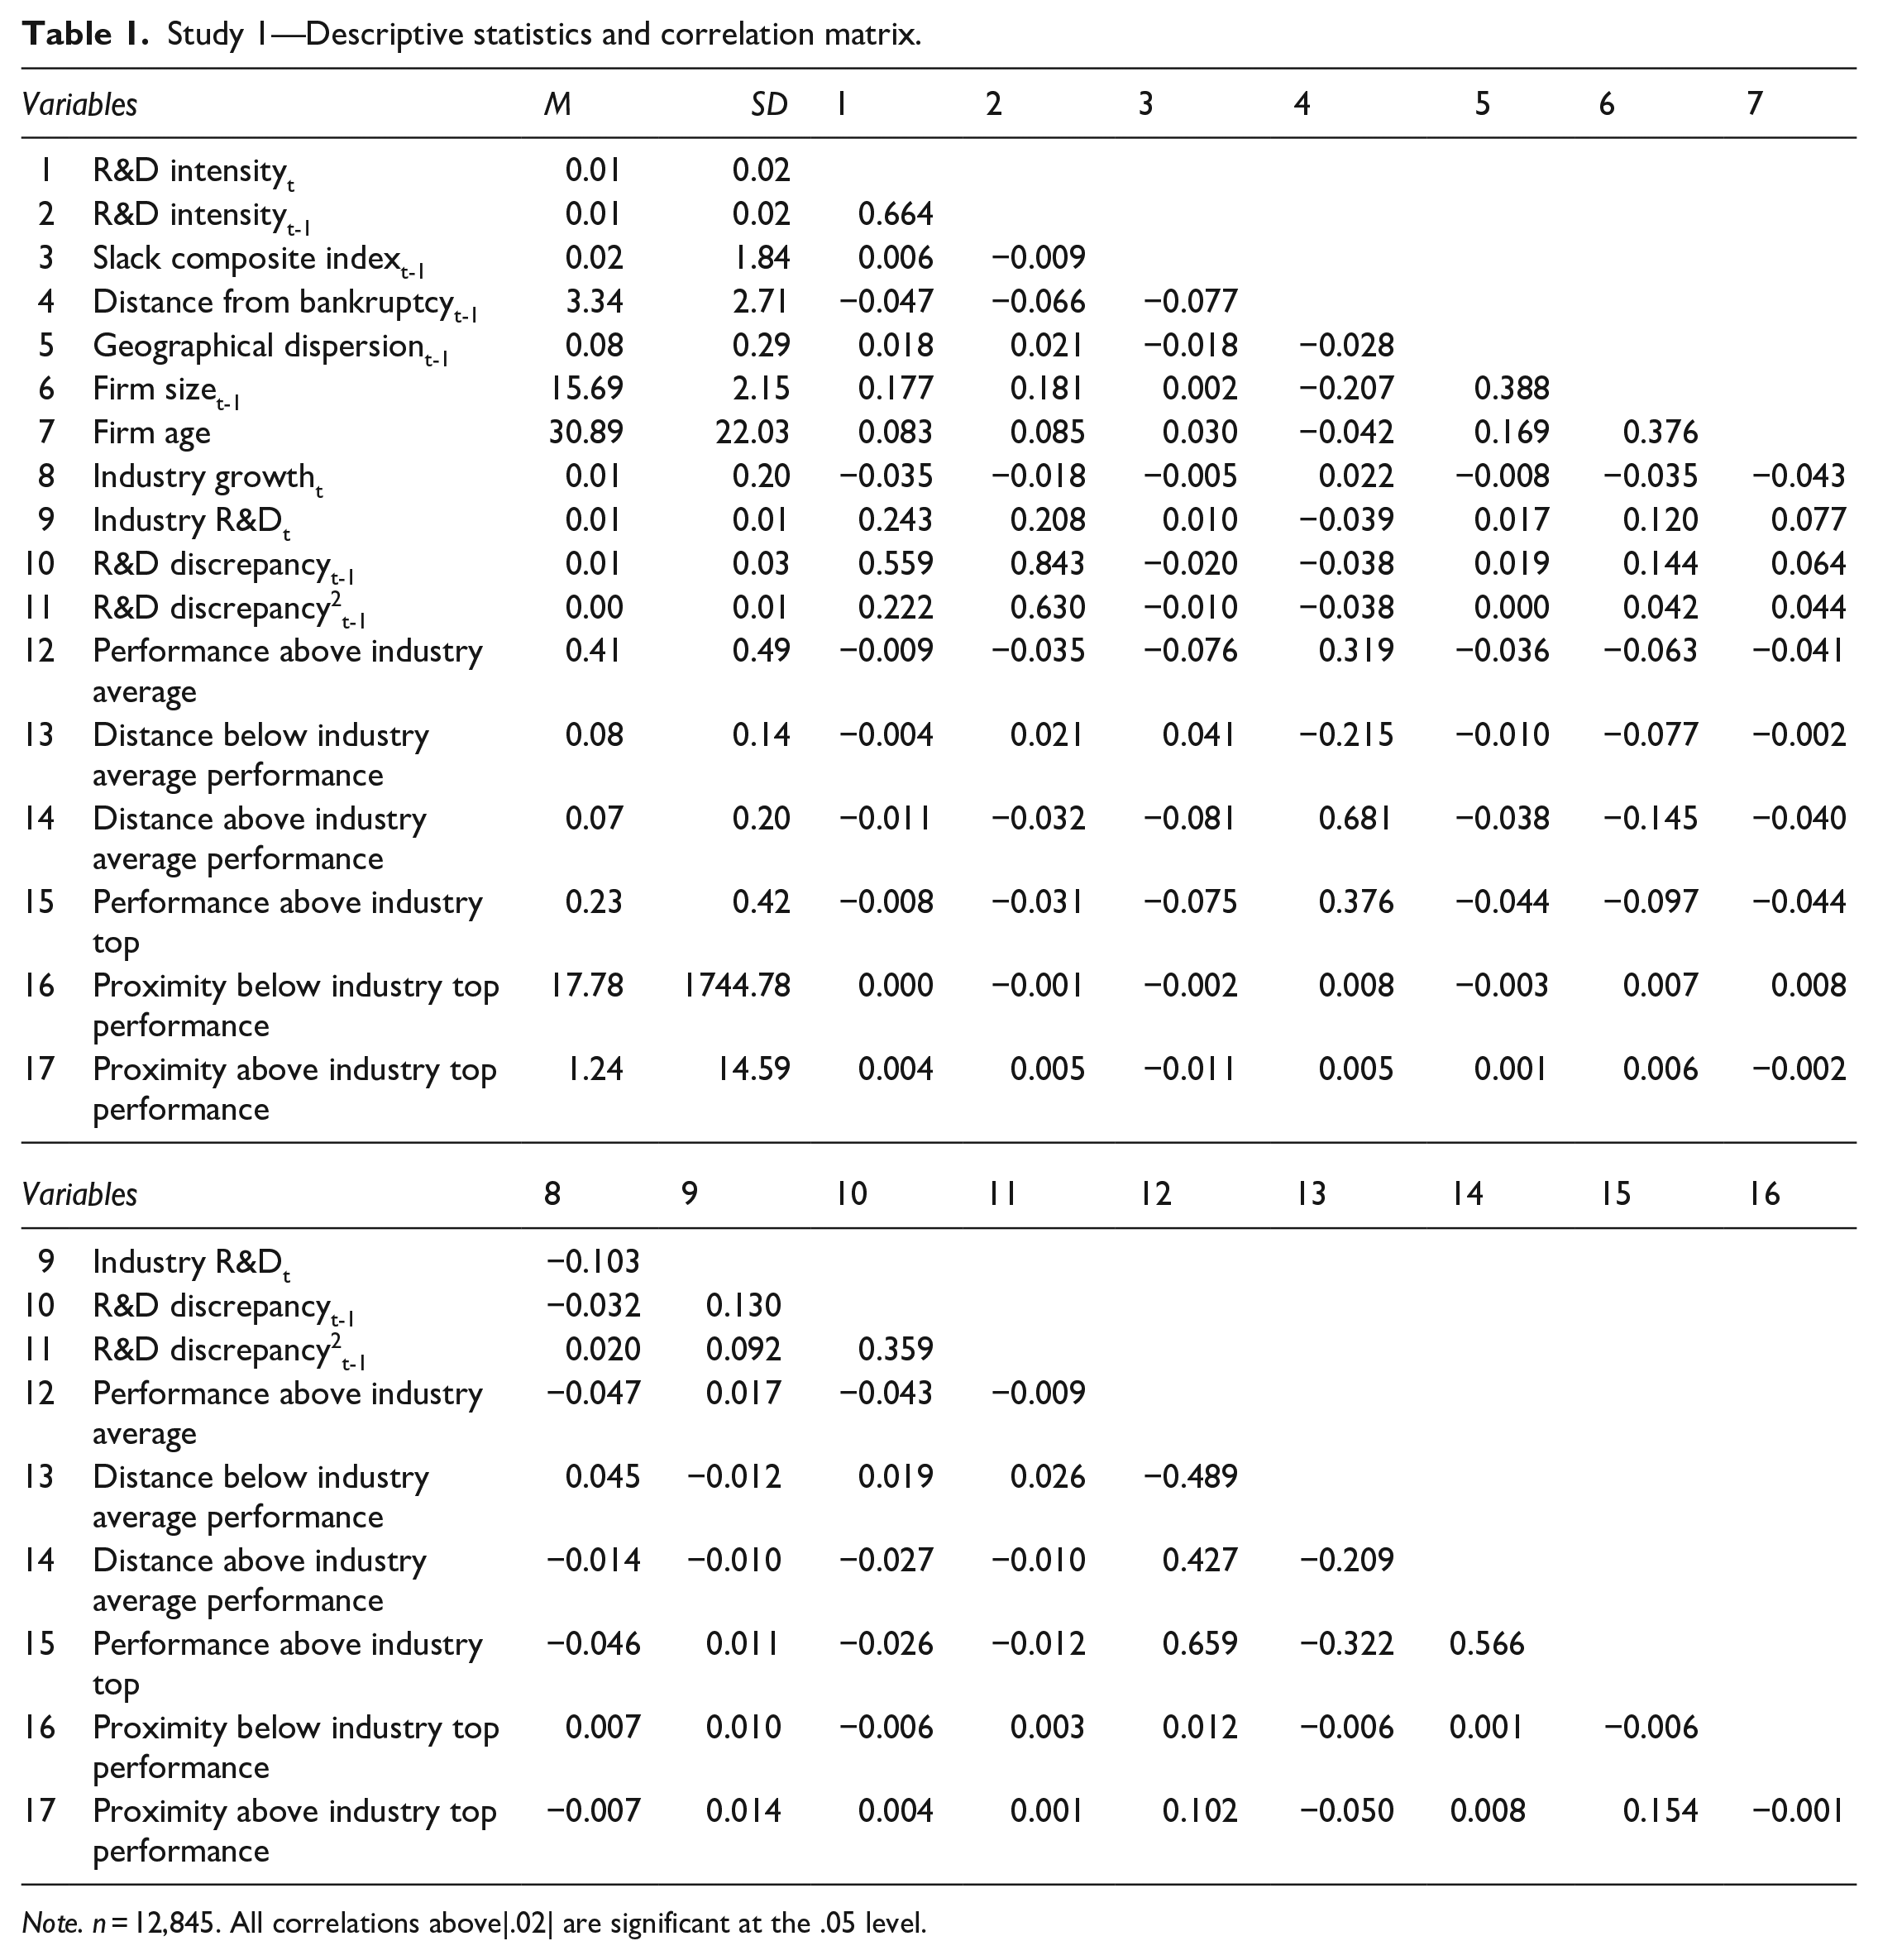
Note. n = 12,845. All correlations above|.02| are significant at the .05 level.
Table 2 presents our regression analysis results. 12 For readability, coefficients for control variables are omitted. The full results are reported in Appendix C in the Supplemental Material. In Model 1, the coefficient for R&D discrepancy is negative and significant (β = −0.154, p < .001), and the squared term is also negative and significant (β = −0.651, p < .001). For the full range of R&D discrepancies in the sample (−0.26, 0.93), the overall relationship is an inverted U, with the inflection point (−0.12) falling within the observed range based on the confidence interval calculated using Fieller’s standard error method. We also tested for the significance of slopes, finding positive and significant (0.19, p < .001) and negative and significant (−1.36, p < .001) values at the lower and upper bounds, respectively. This pattern indicates that the lower the distance from the R&D social aspiration level (either below or above), the greater the increase in R&D intensity. Figure 4 illustrates this relationship. To further explore these findings, we calculated and plotted the marginal effects of R&D discrepancy separately for the negative (below aspiration) and positive (above aspiration) ranges. These curves are included in Figure 5, highlighting the distinct patterns of R&D intensity adjustments for firms below and above the R&D aspiration threshold. Both curves appear concave, suggesting the primacy of learning goals. Yet, the curve is steeper for the positive range of R&D discrepancy, with the maximum close to zero. In the range of negative values, the maximum appears in proximity to −0.1.
Study 1—Fixed-effects regression models of R&D intensity with Driscoll-Kraay standard errors.
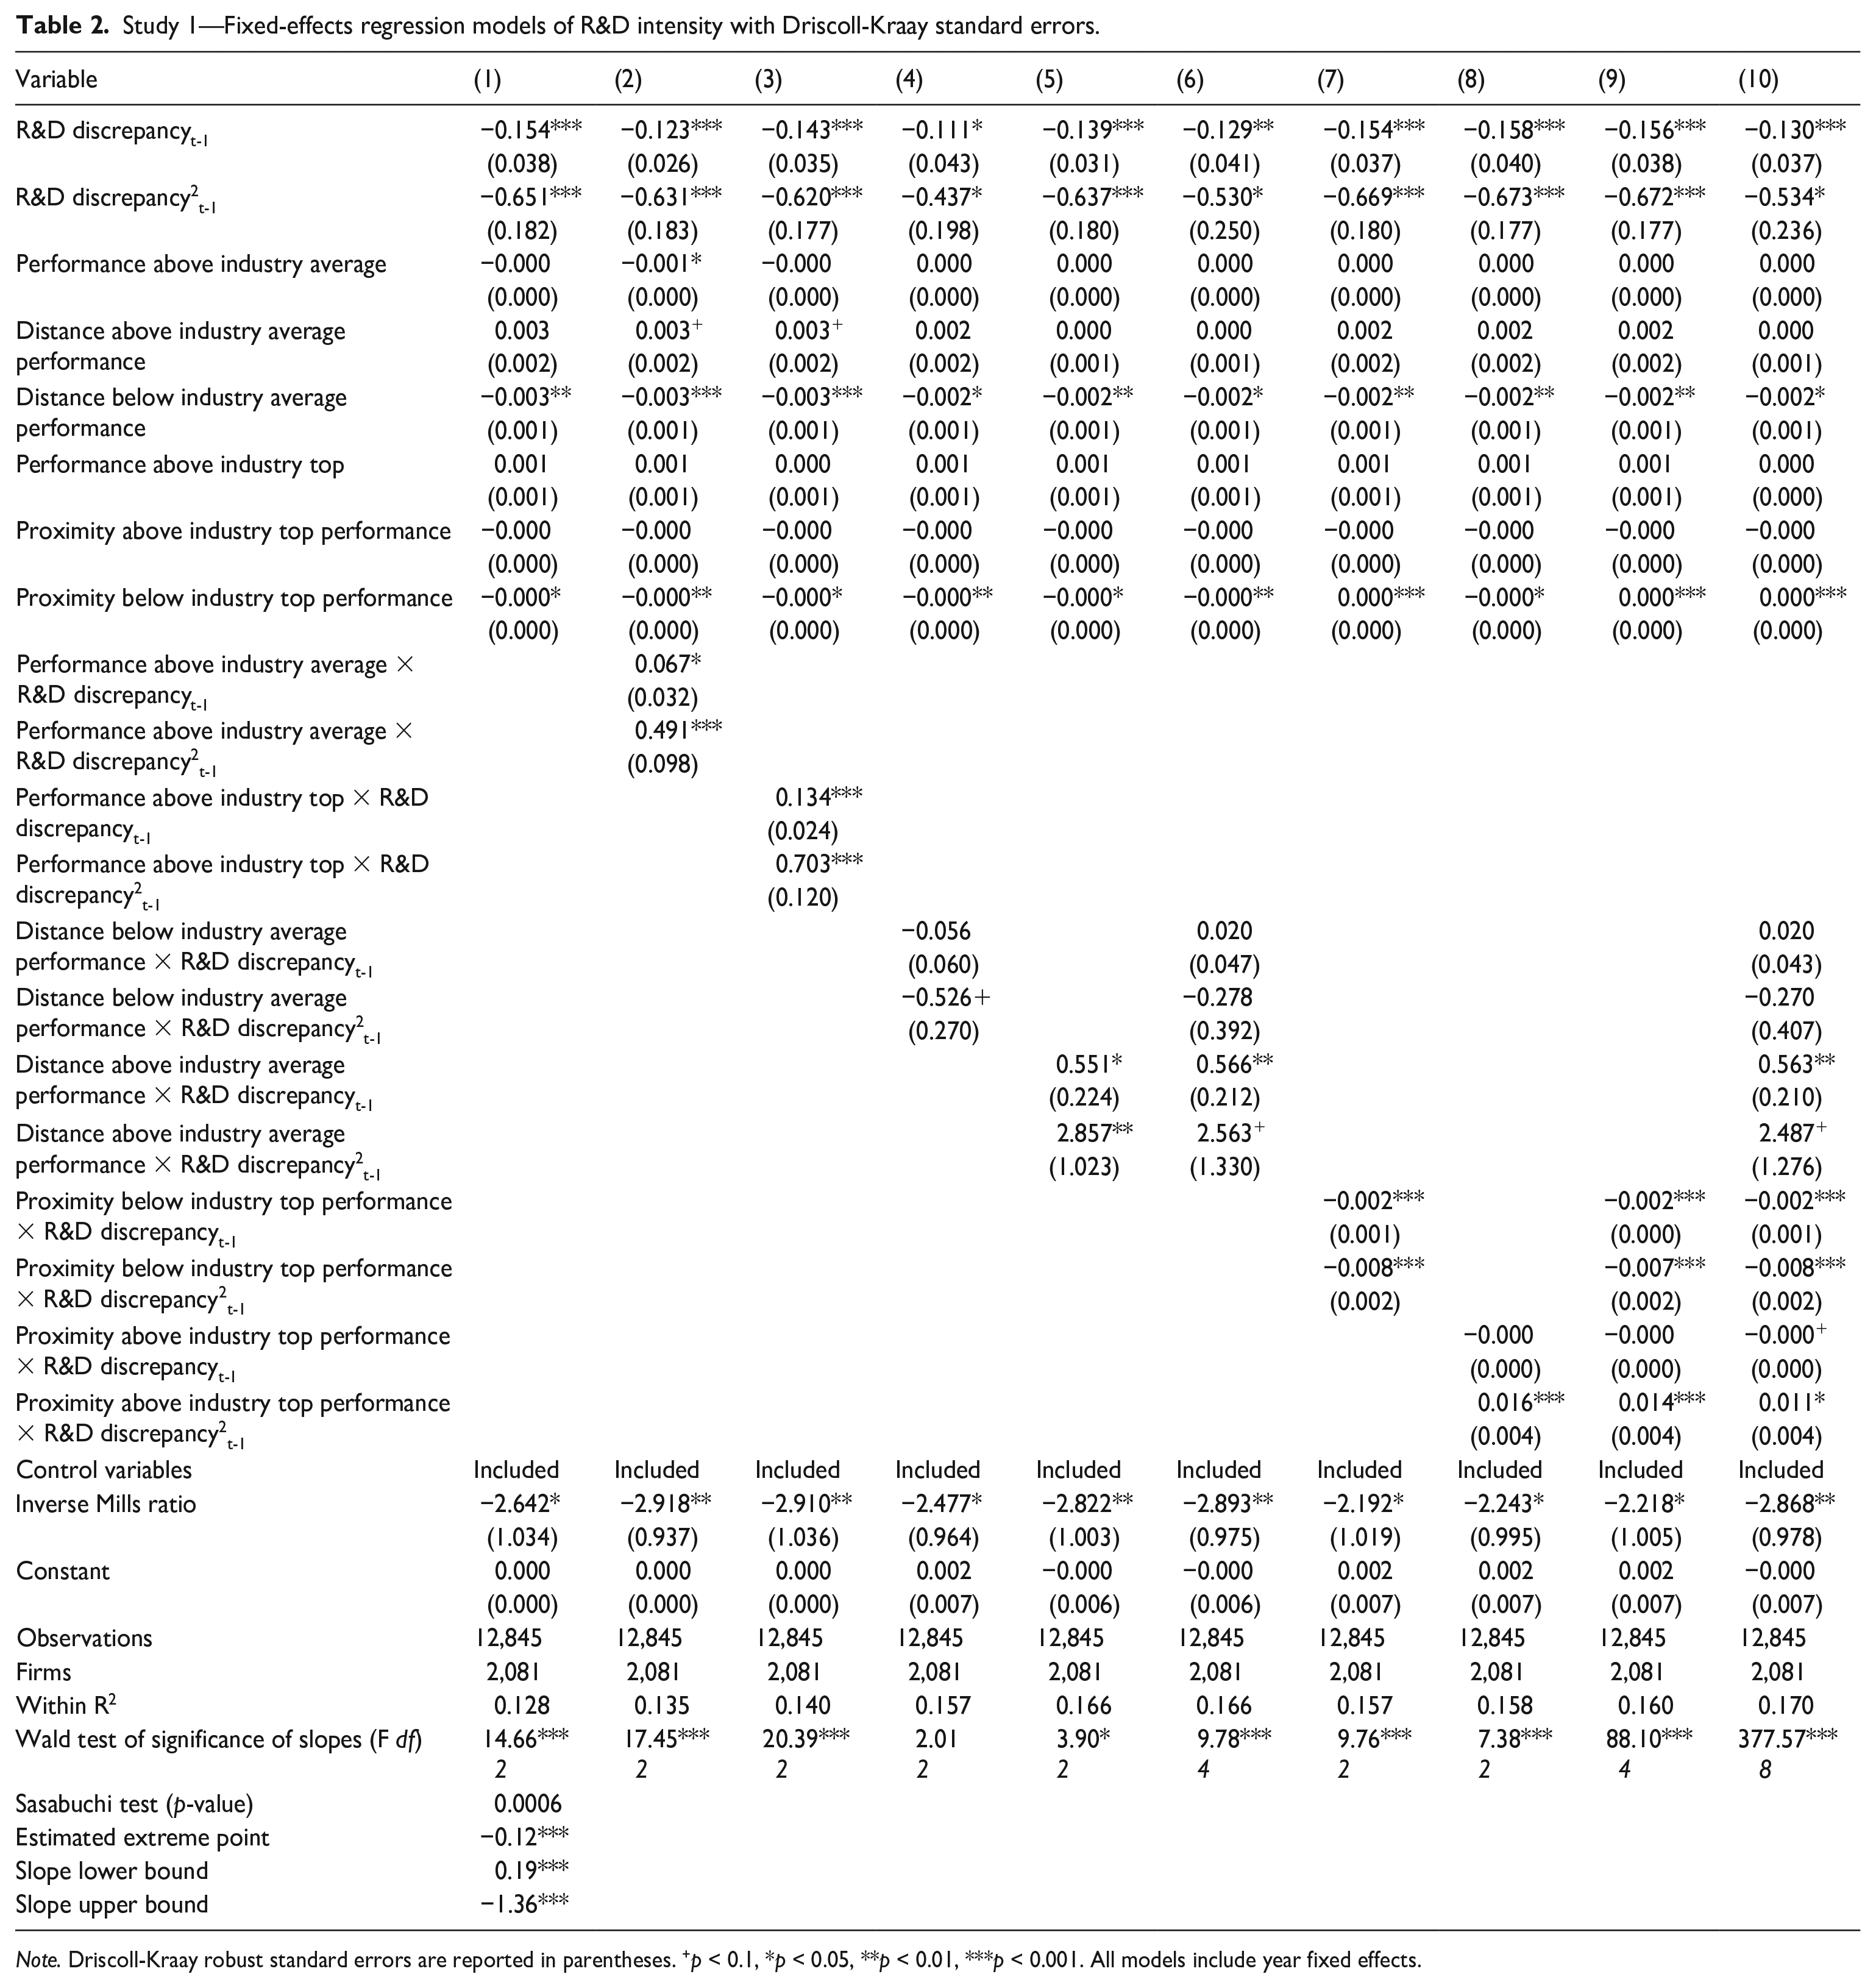
Note. Driscoll-Kraay robust standard errors are reported in parentheses. +p < 0.1, *p < 0.05, **p < 0.01, ***p < 0.001. All models include year fixed effects.
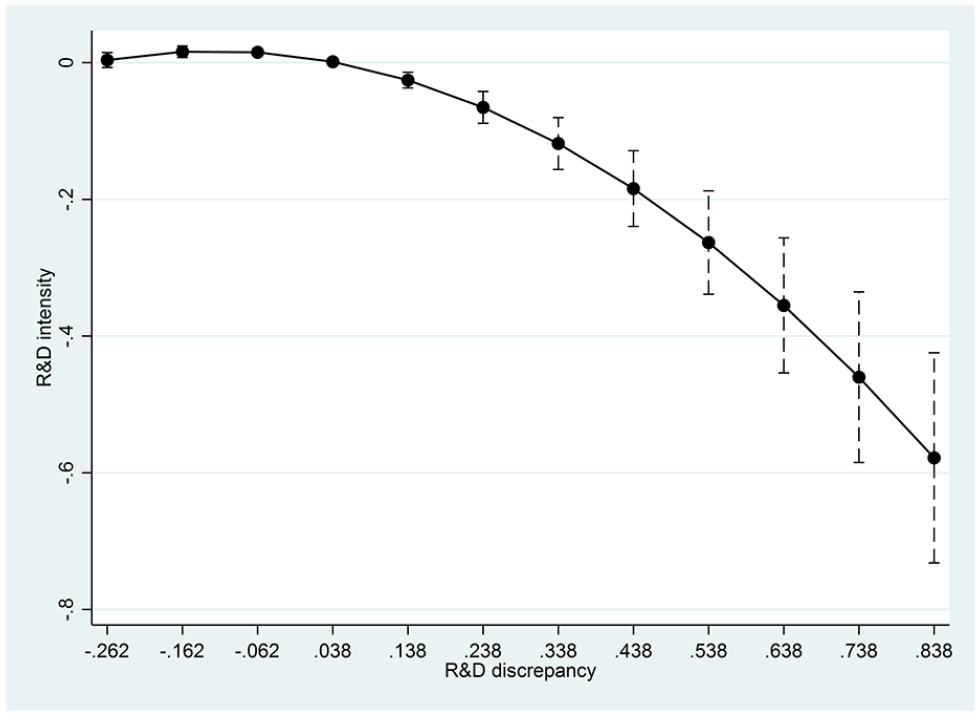
Predicted marginal effects with 95% CI of R&D discrepancy on R&D intensity.
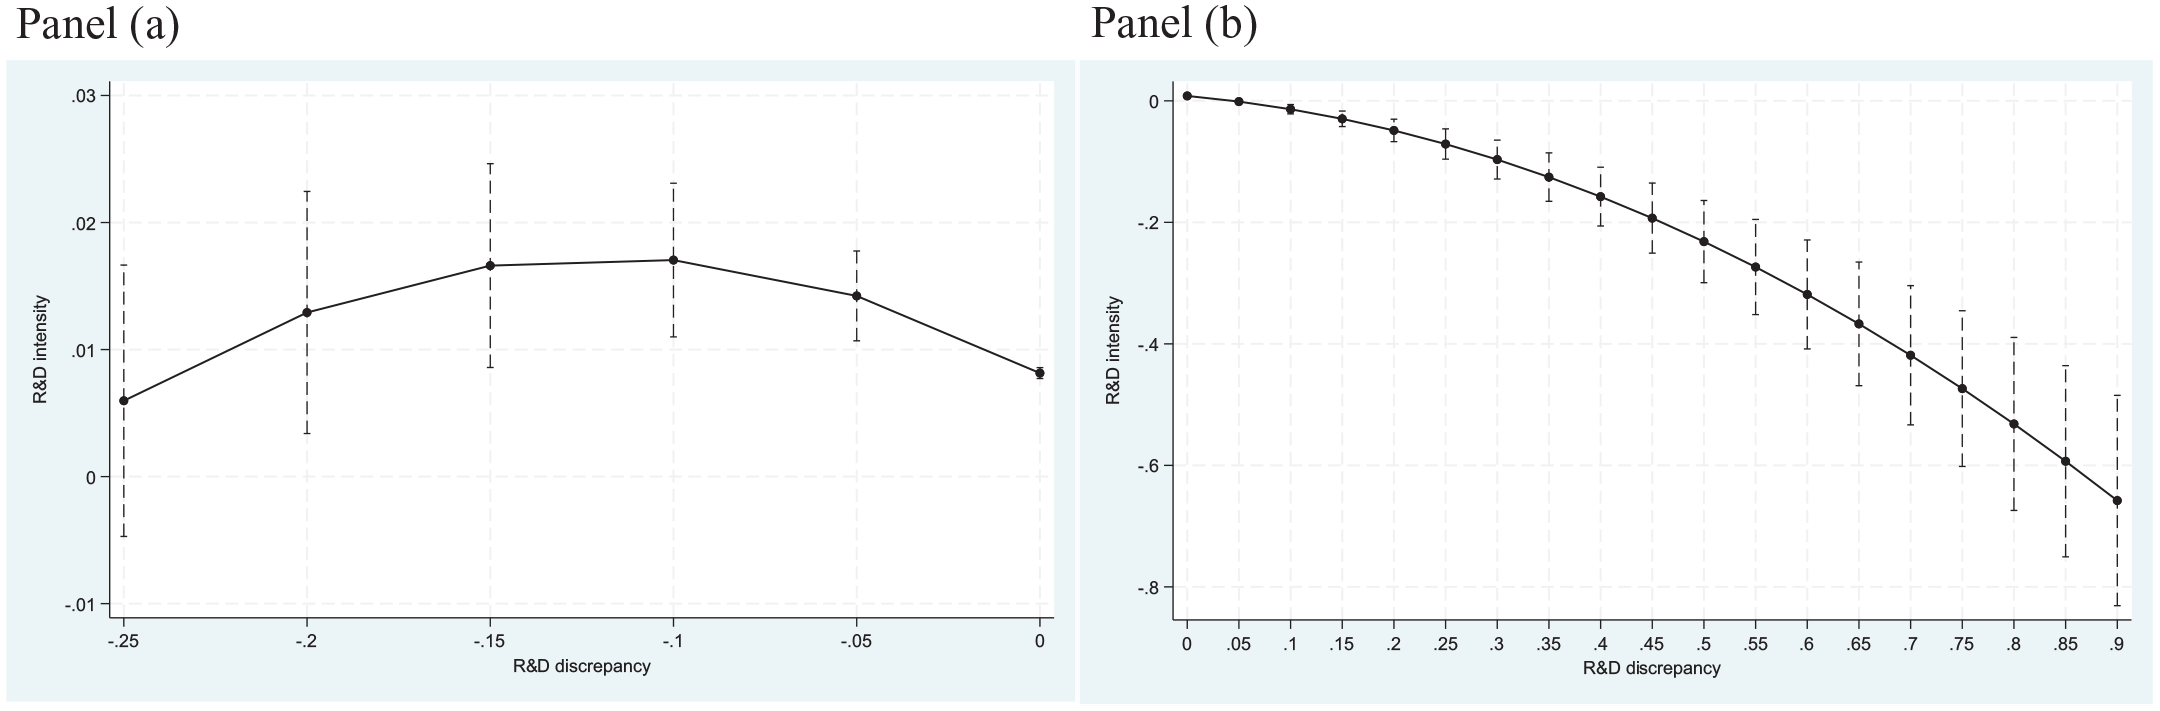
Predicted marginal effects with 95% CI of (a) negative and (b) positive R&D discrepancy on R&D intensity.
Models 2 and 3 present coefficient estimates for H1, which predicts a moderating effect of firm profitability above the reference performance threshold on the R&D intensity-R&D discrepancy relationship. We find significant interactions with both the linear and squared terms of R&D intensity for profitability above the average and top performance thresholds. This indicates that the inverted U-shaped relationship between R&D discrepancy on R&D intensity flattens as firm profitability moves the reference thresholds (as predicted by H1). Figure 6 illustrates these effects: Panel (a) shows that profitability above the industry’s average threshold reduces the concavity of the R&D intensity-R&D discrepancy curve; Panel (b) indicates that surpassing the industry’s top performance threshold shifts the relationship to a convex form.
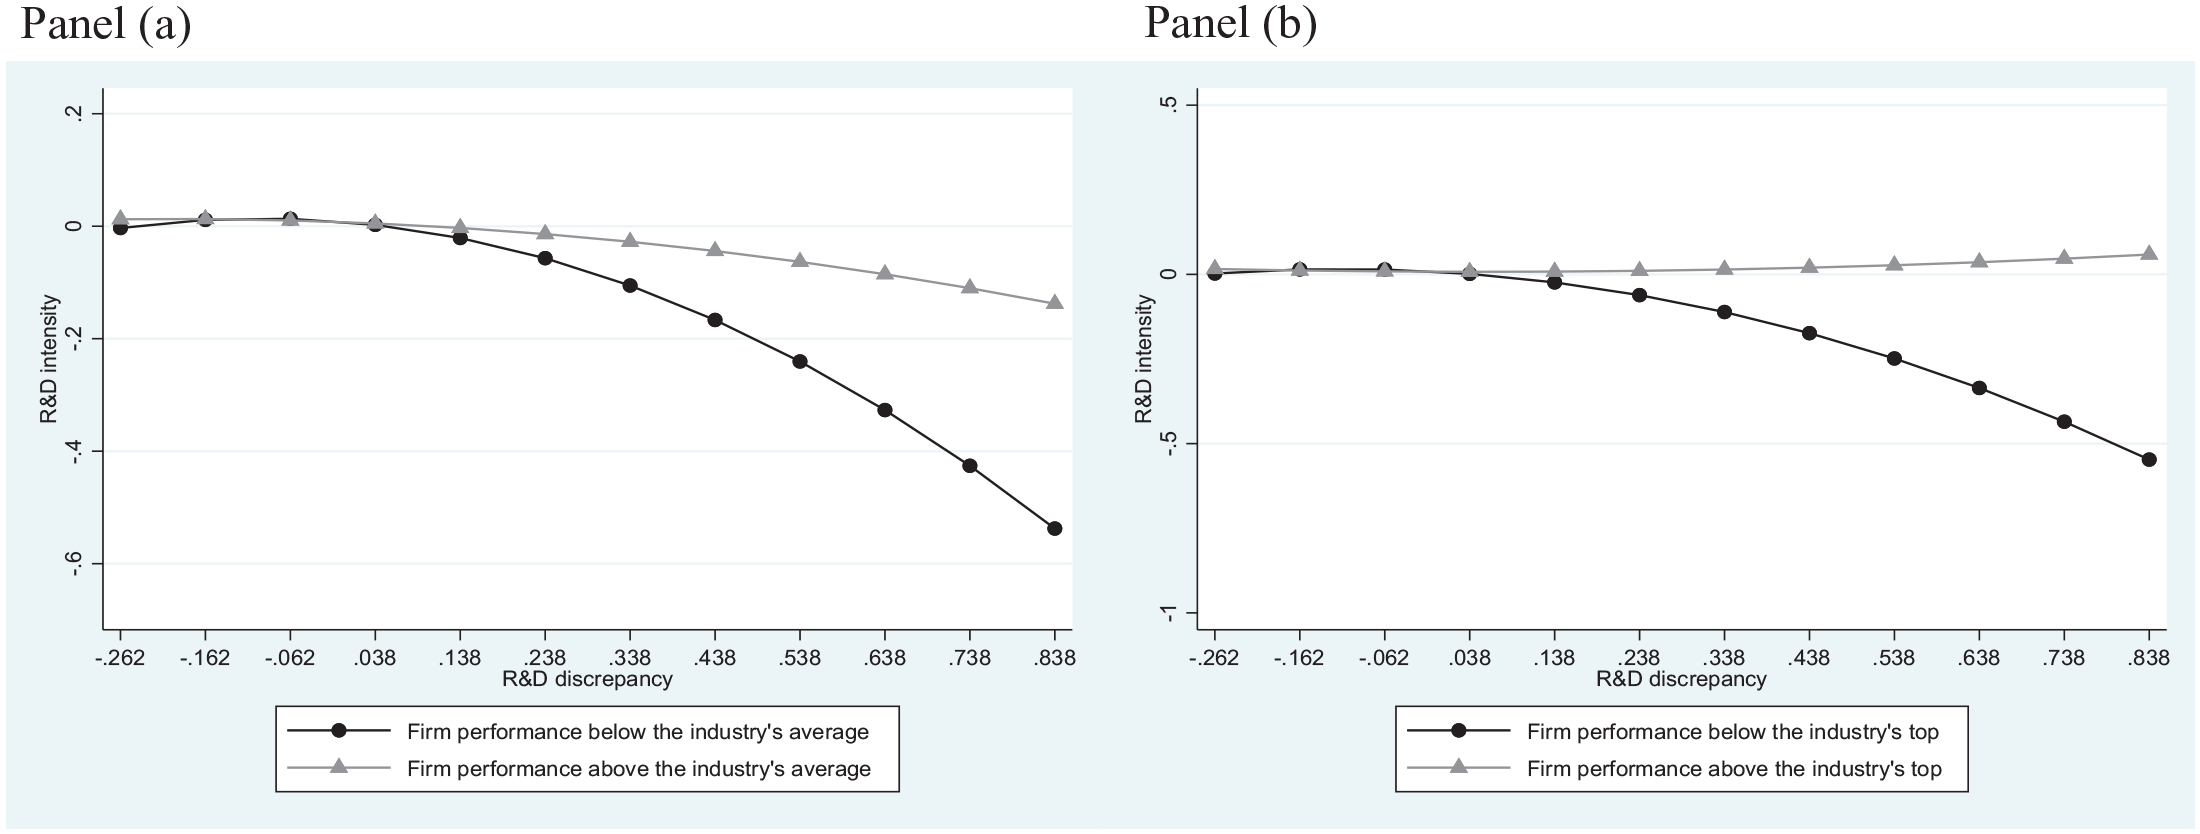
Predicted marginal effects of R&D discrepancy on R&D intensity for firm profitability below and above the industry’s (a) average performance and (b) top performance thresholds.
H2a(b) predicts that with increasing distance of firm profitability below (above) the industry’s average performance threshold, learning (legitimacy) salience increases, and the R&D intensity-R&D discrepancy curve becomes increasingly concave (convex). H2a was not supported. In contrast, Model 5 shows a positive and significant coefficient for the interaction between the distance of firm profitability above the industry’s average performance threshold and the linear term of R&D discrepancy (β = 0.551, p < .05), and a positive and significant coefficient for the interaction between and the squared term of R&D discrepancy (β = 2.857, p < .01). As shown in Panel (a) of Figure 7, the convexity of the three R&D intensity-R&D discrepancy curves increases with the distance of firm profitability above the industry’s average performance threshold, supporting H2b.
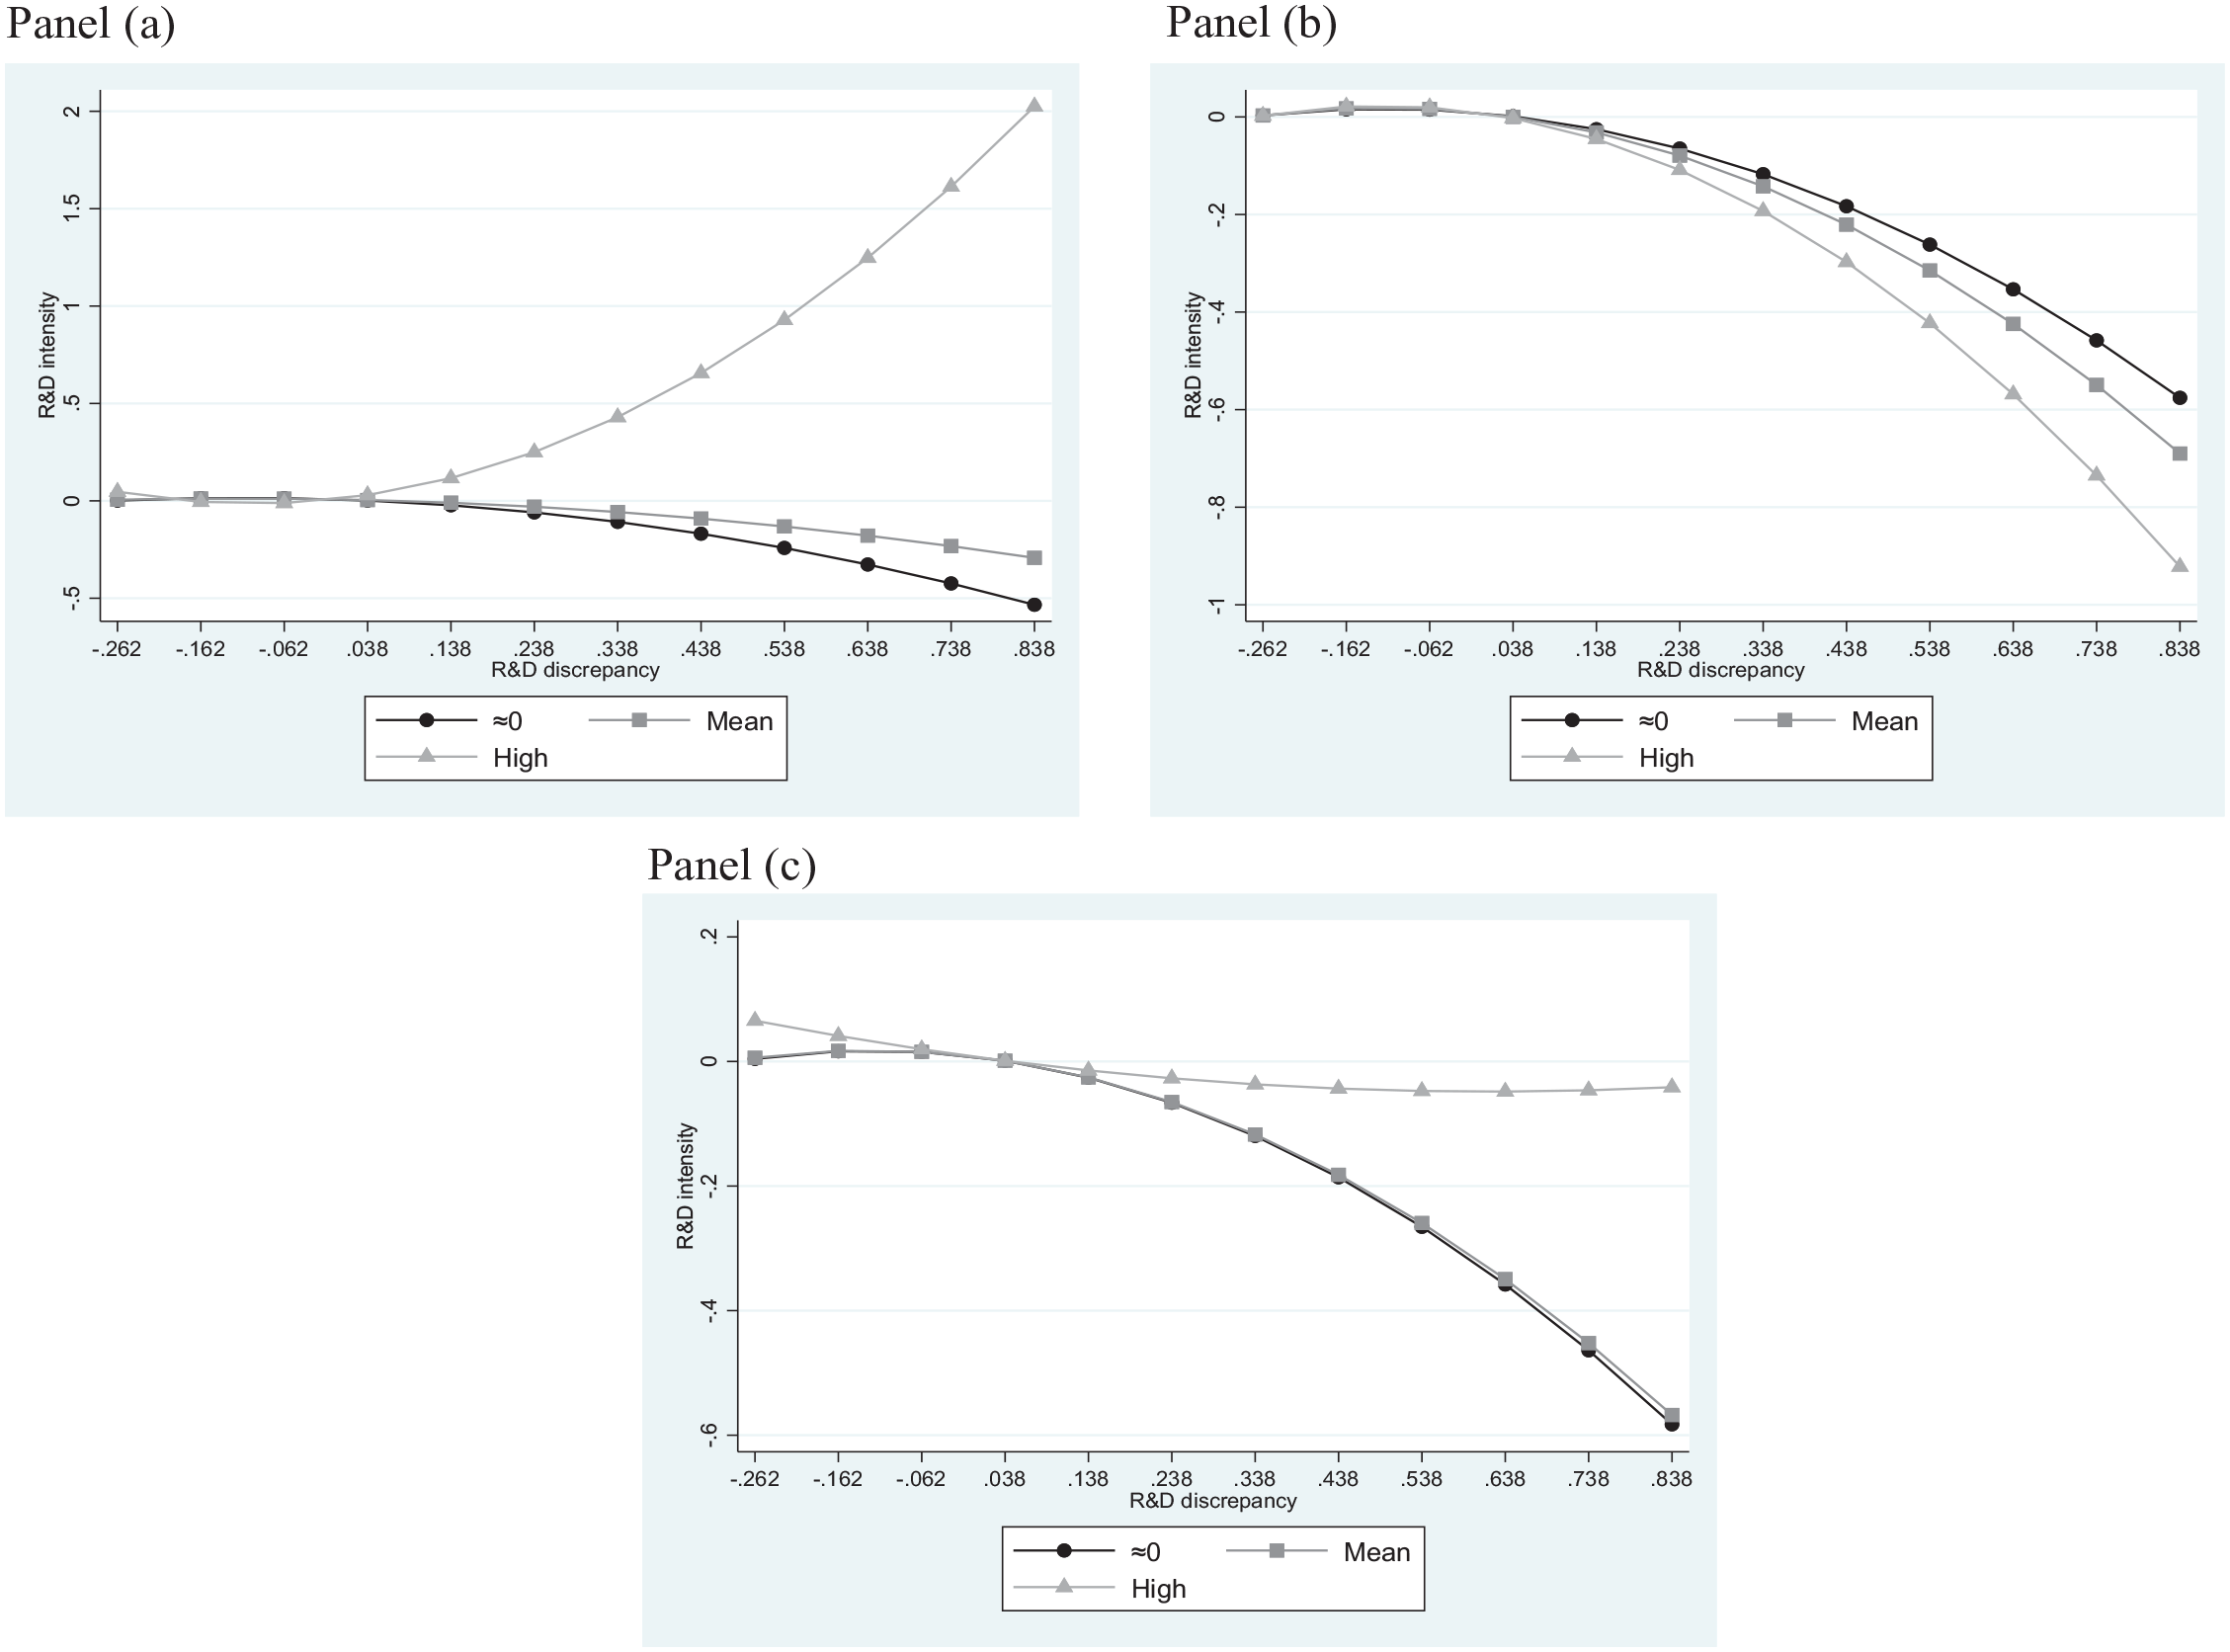
Predicted marginal effects of R&D discrepancy on R&D intensity for varying levels of distance/proximity of firm profitability above the industry’s (a) average performance and (b, c) below/above the industry’s top performance thresholds.
H3a and H3b predict the moderating effects of proximity to the industry’s top performance threshold on the R&D discrepancy-R&D intensity relationship. Model 7 shows that proximity below the threshold strengthens the concavity of the curve, with significant negative interactions for both the linear (β = −0.002, p < .001) and curvilinear (β = −0.008, p < .001) terms of R&D discrepancy (Figure 7, Panel (b)). This supports H3a, indicating that R&D intensity decreases more sharply at low and high values of R&D discrepancy as firm profitability approaches the industry’s top performance threshold from below. For H3b, Model 8 shows that proximity above the threshold increases the curve’s convexity, as evidenced by a significant positive interaction for the squared term (β = 0.016, p < .001). Figure 7, Panel (c), illustrates this effect. These results are robust in the fully saturated model (Model 10).
Additional analyses
We conducted several tests to verify the robustness of our results to alternative specifications. These analyses are detailed in Online Appendix D and briefly summarized here. First, following the work by Haans et al. (2016), we re-estimated our regression models using sub-samples split by manufacturing sectors’ R&D intensity and firm size. For sectors with low (below median) and high (above median) R&D intensity, the results showed evidence of a concave relationship between R&D discrepancy and R&D intensity in both cases. However, the curve was flatter in R&D-intensive sectors, suggesting greater salience of R&D discrepancy as a proxy for legitimacy in these contexts. While most hypotheses were supported in R&D-intensive sectors, H2b was not. In contrast, firms in less-R&D-intensive sectors displayed steeper inverted U-shaped relationships when performance was above, rather than below, the industry’s average performance threshold, limiting the generalizability of our findings.
In addition, we analyzed sub-samples of small (fewer than 200 employees) and large firms (more than 200 employees). The findings for the two sub-samples were largely consistent with those presented in the main analyses, confirming a concave relationship between R&D discrepancy and R&D intensity (Online Appendix D). Findings for both sub-samples largely supported a concave relationship between R&D discrepancy and R&D intensity. However, among small firms, H3a and H3b were not supported, indicating that these firms may be less likely to adopt the industry’s top performance as an aspiration level. Among large firms, H1, H2b, and H3b were supported, but H2a and H3a were not, suggesting that large firms’ imitation may be more legitimacy-driven. Finally, we tested the relationship between R&D discrepancy and innovation output, using a firm’s patent stock between years t+1 and t+3—as a proxy for inventive capability and learning-driven innovation (He & Wang, 2009; Heeley et al., 2007). Consistent with our predictions, the relationship was curvilinear and concave, with accentuated concavity when a firm’s profitability was below a social aspiration level (see Online Appendix F).
Endogeneity challenges
Two sources of endogeneity may bias our estimates. First, R&D discrepancy can be influenced by future R&D commitments: a firm may decrease its R&D budget in year t-1 if it expects to incur significant R&D expenses in year t, leading to reverse causality. In addition, the measurement of R&D discrepancy as a function of past R&D intensity raises issues concerning dynamic endogeneity. To address endogeneity concerns, we combined instrumental variables and system–generalized method of moments (SYS-GMM) (Blundell & Bond, 1998) approaches. Following a two-step SYS-GMM, we treated R&D discrepancy, performance-aspiration discrepancies, and their interaction terms as endogenous, using lagged levels (from year t-2 backward) as instruments in a “stacked” system of equations. Control variables and six exogenous instruments (i.e., changes in industry-wide availability of subsidized credits for innovation activities, R&D tax incentives, and government funds between years t-2 and t-1; and estimated percentage changes in the prices of energy and oil, raw materials, and services between t-2 and t-1) were included in both levels and differences. After correcting for endogeneity, our results provided similar support for H1, H2b, and H3a; however, H3b was not supported (see Online Appendix E for details).
To partly compensate for these limitations and provide complementary insights, we conducted Study 2—an online experiment using a fully crossed 4 × 2 design that manipulates R&D discrepancy and performance relative to social aspirations. This experimental approach offers two critical contributions. First, by manipulating R&D discrepancy, Study 2 enables us to investigate its causal effect on R&D intensity, addressing a limitation of Study 1. Second, by explicitly measuring learning and legitimacy motivations, Study 2 provides valuable insights into the microfoundations of imitation in the context of R&D investment decisions. Therefore, while Study 1 leverages archival data to establish broader patterns and relationships at the organizational level, Study 2 sheds insight into the cognitive and motivational underpinnings of these behaviors, offering a more nuanced understanding of the motivational underpinnings of imitation.
Methods, Study 2
Sample
We recruited 863 paid-employed working adults through the online platform Prolific Academic. Participants were drawn from 33 countries, with most residing in the UK (48.3%, 417) and the USA (22.5%, 194). To focus on industries where R&D spending reflects both learning and legitimacy considerations, we restricted the sample to individuals employed in manufacturing firms with supervisory responsibilities. Participants were paid on average £1.40 for a 7-minute study. To ensure data quality, we included a comprehension check, which participants had to pass to submit their responses (Fleischer et al., 2015). Participants were on average 36.6 (SD = 10.5) years old, and 39.0% of them were female (337). A majority (82.5%) were employed as managers at various levels, with 47.2% as junior managers and 27.6% as middle managers. The remaining participants held roles such as directors, owners, or partners. Participants worked primarily in Production and Operations (22.1%) and Information Technology (19.8%) departments, with 48.7% employed by large enterprises, 18.9% by medium-sized enterprises, and 32.4% by small enterprises.
Procedure
Participants were tasked with helping a manufacturing company in the Computing and Electronics industry make effective R&D investment decisions (refer to Online Appendix G). Participants received information about the focal firm’s R&D intensity in 2019 and the average R&D intensity of industry leaders in 2018 (13.9%). 13 They were then asked to propose a 2020 R&D intensity level (0–100% of sales) and indicate the motivations driving their choices. After completing the first task, participants were provided with additional information about the focal firm’s profitability relative to the industry average, prompting them to revise their R&D investment decisions and motivations. The final section contained some demographic questions.
Manipulation 1: R&D discrepancy
Using a between-subjects design, participants were randomly assigned to one of four conditions regarding the focal firm’s R&D intensity level in 2019 (R&Dt-1i; 2% [n1 = 223], 10% [n2 = 212], 18% [n3 = 230], and 26% [n4 = 200]) relative to the average of the best industry performers (13.9%). The participants were then requested to indicate the proposed R&D intensity level for 2020 (R&D I ti ) from 0% to 100% and to rate their motivations using a six-item questionnaire, which we used to measure learning and legitimacy salience (Learningi I , Legitimacyi I ).
Manipulation 2: firm performance relative to social aspirations
After the completion of task 1, participants within each R&D discrepancy condition were randomly allocated to two conditions benchmarking the focal firm’s 2019 ROA against the industry average: (a) focal firm’s profitability below the industry average (1.8% vs. 3.5%) (n1a = 107; n2a = 110; n3a = 119; n4a = 105); (b) focal firm’s profitability above the industry’s average (3.5% vs. 1.8%) (n1b = 115; n2b = 102; n3b = 110; n4b = 95). Participants were asked to revise their R&D intensity decisions (R&Dtij II ) and motivations (Learning II , Legitimacy II ) accordingly.
Measures
R&D intensity change
We measured the change in R&D intensity between task 1 and the manipulation (i.e., R&Dt I − R&Dt-1) and after the performance manipulation (i.e., R&Dti II − R&Dti 1 ). This allowed us to analyze changes in R&D intensity in response to R&D discrepancy and performance feedback.
Learning and legitimacy salience
Before and after the manipulation for firm performance, participants rated six motivation items on a seven-point scale, ranging from 1 (Extremely Disagree) to 7 (Extremely Agree). We used the following three statements to measure learning salience: “. . . develop new technological capabilities”; “. . . acquire new knowledge”; and “. . . innovate more efficiently.” Whereas legitimacy salience was measured using the following three statements: “. . . enhance or maintain firm status”; “. . . look good”; and “. . . being associated with best performers.” Exploratory factor analysis (EFA) using principal component as the extraction method and Varimax with Kaiser Normalization as the rotation method confirmed two distinct factors, explaining 76% (learning salience) and 53% (legitimacy salience) of variance before the performance manipulation, and 74% (learning salience) and 49% (legitimacy salience) of variance after the manipulation, respectively. The factor loadings ranged from 0.55 to 0.71 for the three learning items (Cronbach’s α = 0.74), and 0.49–0.60 for the three legitimacy items (Cronbach’s α = 0.64), and the cross-loadings were much smaller than the focal loadings. Similar results were obtained for the learning (factor loadings between 0.67 and 0.76; Cronbach’s α = 0.83) and legitimacy (factor loadings between 0.59 and 0.62; Cronbach’s α = 0.71) items measured after the performance manipulation.
Results, Study 2
Preliminary Analyses, Study 2
Univariate analysis of variance (ANOVA) confirmed the effectiveness of the R&D discrepancy manipulation (F = 181.21, p < .001), indicating a linear relationship between R&D discrepancy and R&D intensity change as illustrated in Figure 8.
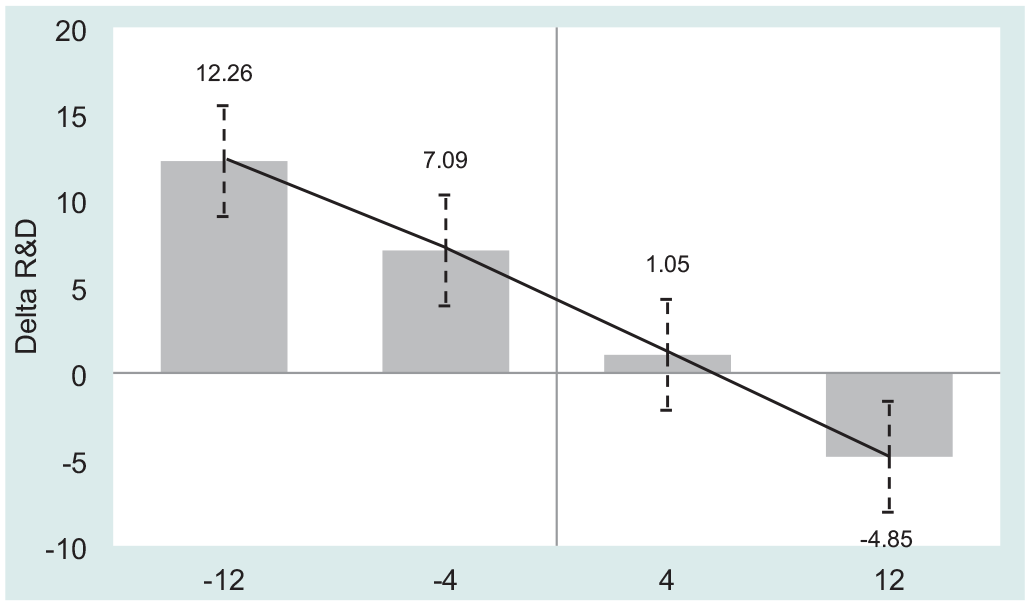
Average effects of R&D discrepancy (Manipulation 1) on R&D intensity change.
Participants in Condition 1 (i.e., R&D intensity far below the target) reported an R&D intensity (M = 12.26, SD = 8.36) 5.16 percentage points higher (p < .001) than participants assigned to Condition 2 (i.e., R&D intensity slightly below the target; M = 7.09, SD = 7.14), 11.21 percentage points (p < .001) higher than those assigned to Condition 3 (i.e., R&D intensity slightly above the target; M = 1.05, SD = 6.56), and 17.11 percentage points (p < .001) higher than the group with the focal firm’s initial R&D intensity far above the target (M = −4.85, SD = 9.78). These results confirm the presence of imitation in the context of R&D investment decisions, with all four groups showing a tendency to adjust the focal firm’s R&D intensity level toward the level exhibited by socially salient players in the industry. However, ANOVA tests showed no significant differences in learning and legitimacy salience across the four conditions (Learningi I : F = 0.79, ns; Legitimacyi I : F = 1.25, ns), suggesting that the size of the R&D discrepancy did not influence their relative salience.
To test whether our performance manipulation was successful, we conducted multiple paired t-tests. The results showed significant effects on legitimacy salience: a decrease when performance was below aspirations (t = −2.08, p < .05) and an increase when it was above (t = 2.04, p < .05). These results provide support for a causal effect of performance relative to social aspiration on changes in the salience of legitimacy, as we predicted. Furthermore, an ANOVA revealed that such changes did not depend on the specific R&D discrepancy condition (F = 0.41, ns). Conversely, we did not find any significant effect of performance relative to social aspirations on learning salience, indicating that learning salience was less dependent on past performance outcomes (in line with the lack of support for H2a in Study 1).
Further analysis showed changes in the R&D intensity-R&D discrepancy relationship, with increased concavity (convexity) when performance was below (above) aspiration. As the results of the paired t-test in Table 3 indicate, there was a marginally significant increase in R&D intensity in cases of firm performance below social aspirations and R&D intensity slightly below the target (M = 1.56, SD = 1.15; t = 1.35, p < .10). In cases of firm performance below social aspirations and R&D intensity slightly above the target, the change in R&D intensity was negative but not statistically significant (M = −0.85, SD = 0.84; t = −1.01, ns). In cases of firm performance above social aspirations and R&D intensity far above the target, the change in R&D was negative and significant (M = −3.06, SD = 1.34; t = −2.28, p < .05). On the other hand, a significant decrease in R&D intensity was observed when performance was above aspirations and R&D intensity slightly below the target (M = −4.74, SD = 0.67; t = −7.09, p < .001). In the case of performance above social aspirations, the results also showed a marginally significant increase in R&D intensity within the group assigned to the slightly-above-target R&D discrepancy condition (M = 1.30, SD = 0.98; t = 1.32, p < .10) and a significant increase in R&D intensity within the group assigned to the far-above-target R&D discrepancy condition (M = 6.48, SD = 1.28; t = 5.05, p < .001). Figure 9 illustrates these results (comparing R&Dt I − R&Dt-1 and R&Dt II − R&Dt-1 within each R&D condition) and highlights an increase in convexity (concavity) of the R&D intensity-R&D discrepancy curve when performance is above (below) social aspirations in line with H1. 14
Study 2—The effects of R&D discrepancy on changes in R&D intensity before and after manipulations split by the performance condition.
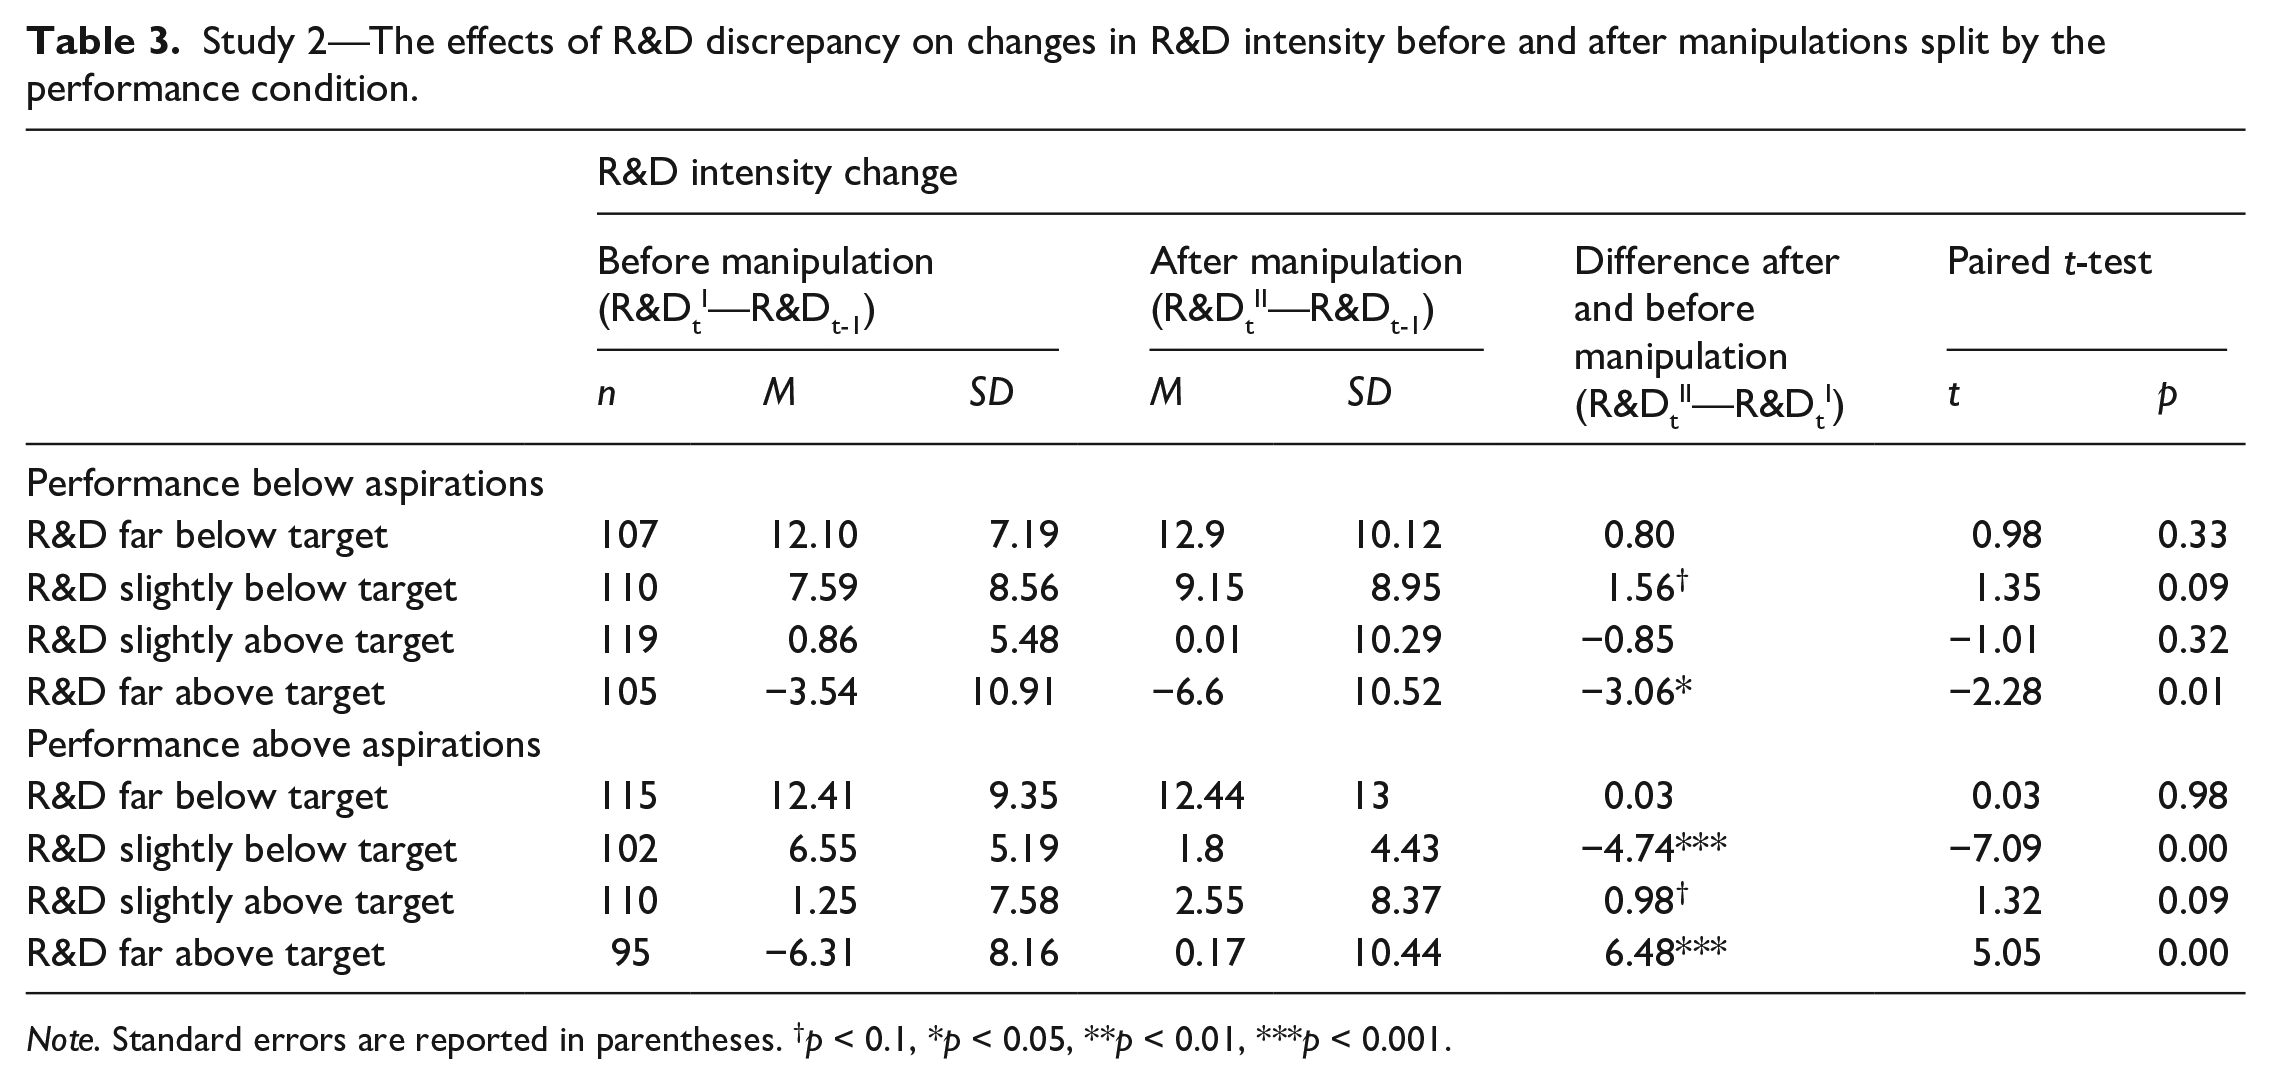
Note. Standard errors are reported in parentheses. †p < 0.1, *p < 0.05, **p < 0.01, ***p < 0.001.
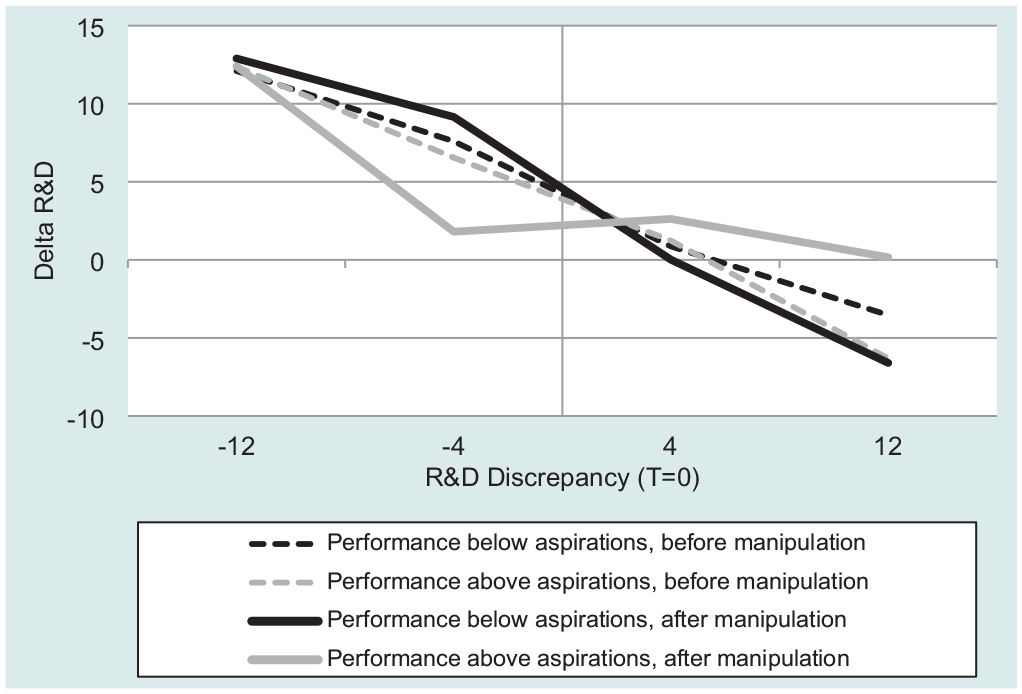
Average effects of performance below/above aspirations (Manipulation 2) on R&D intensity change within each R&D discrepancy condition (Manipulation 1).
Regression analyses, Study 2
Table 4 presents descriptive statistics and correlations, while Tables 5 and 6 show regression results.
Study 2—Means, standard deviations, and correlations.
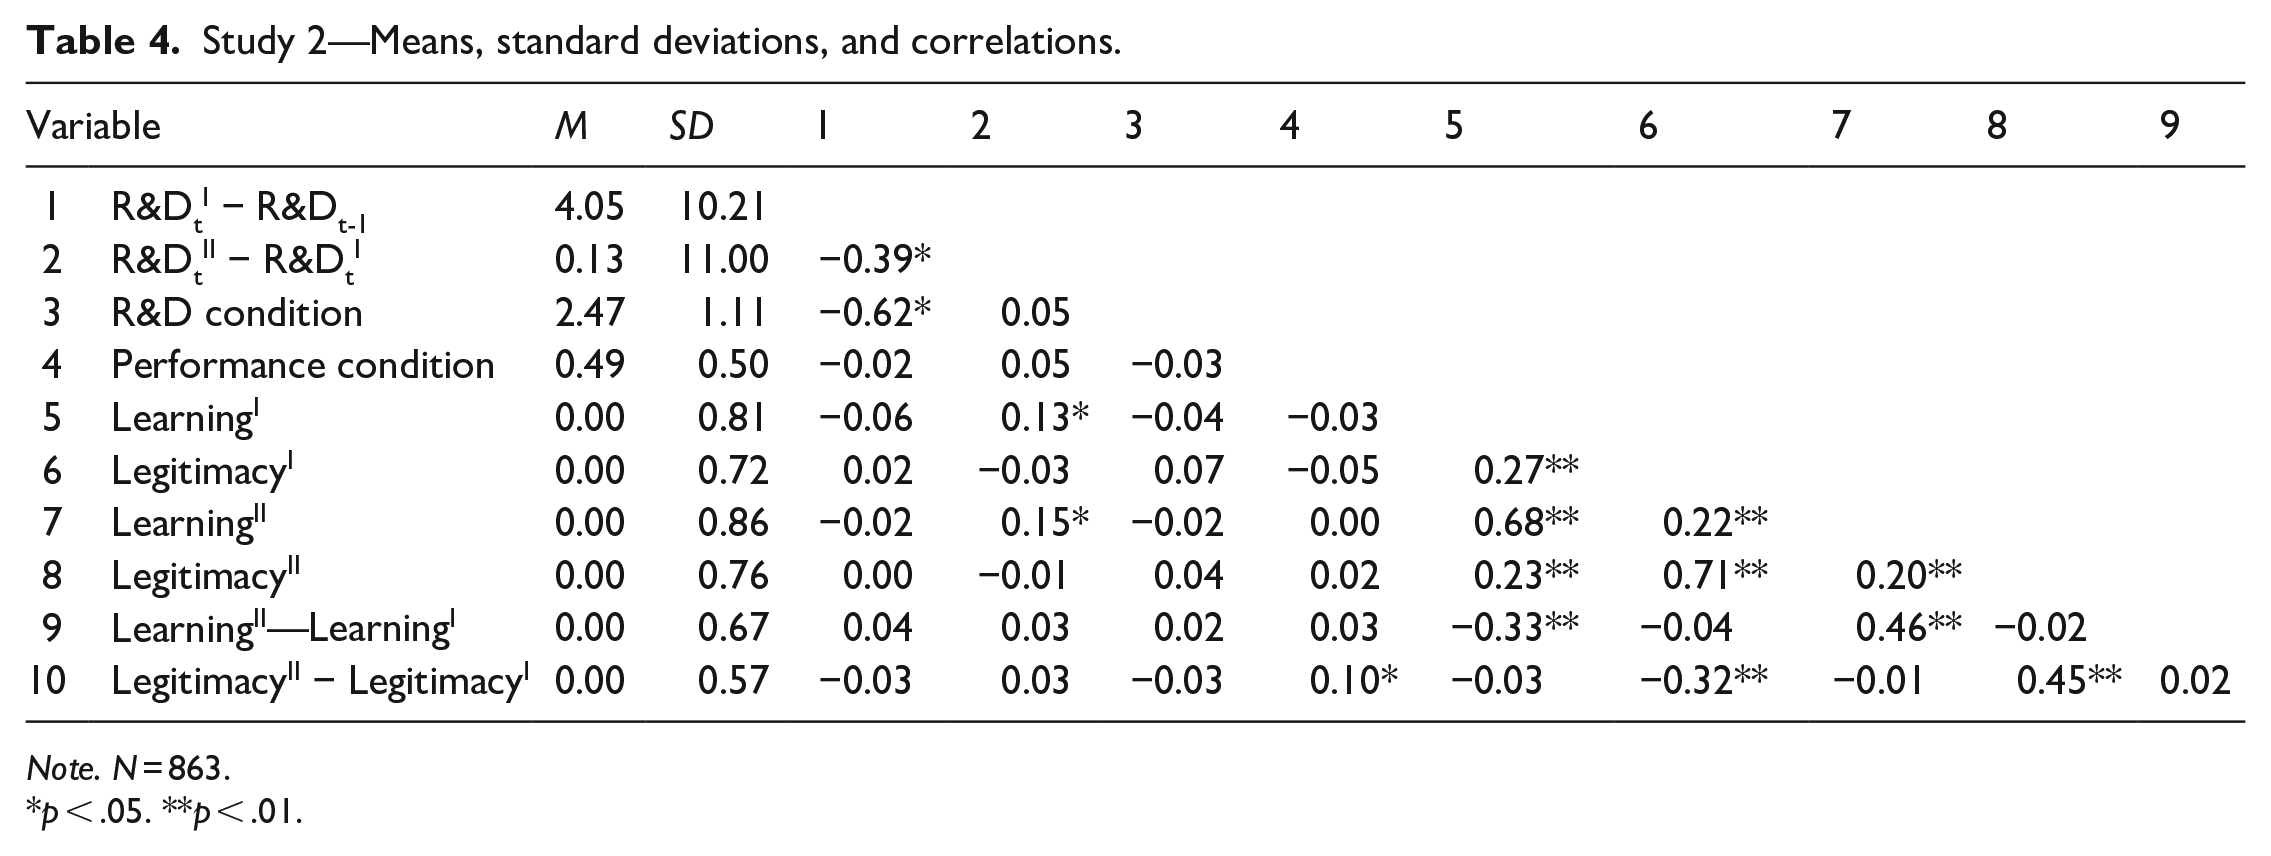
Note. N = 863.
p < .05. **p < .01.
Study 2—Results of linear regression analysis for R&D intensity after the R&D manipulation.
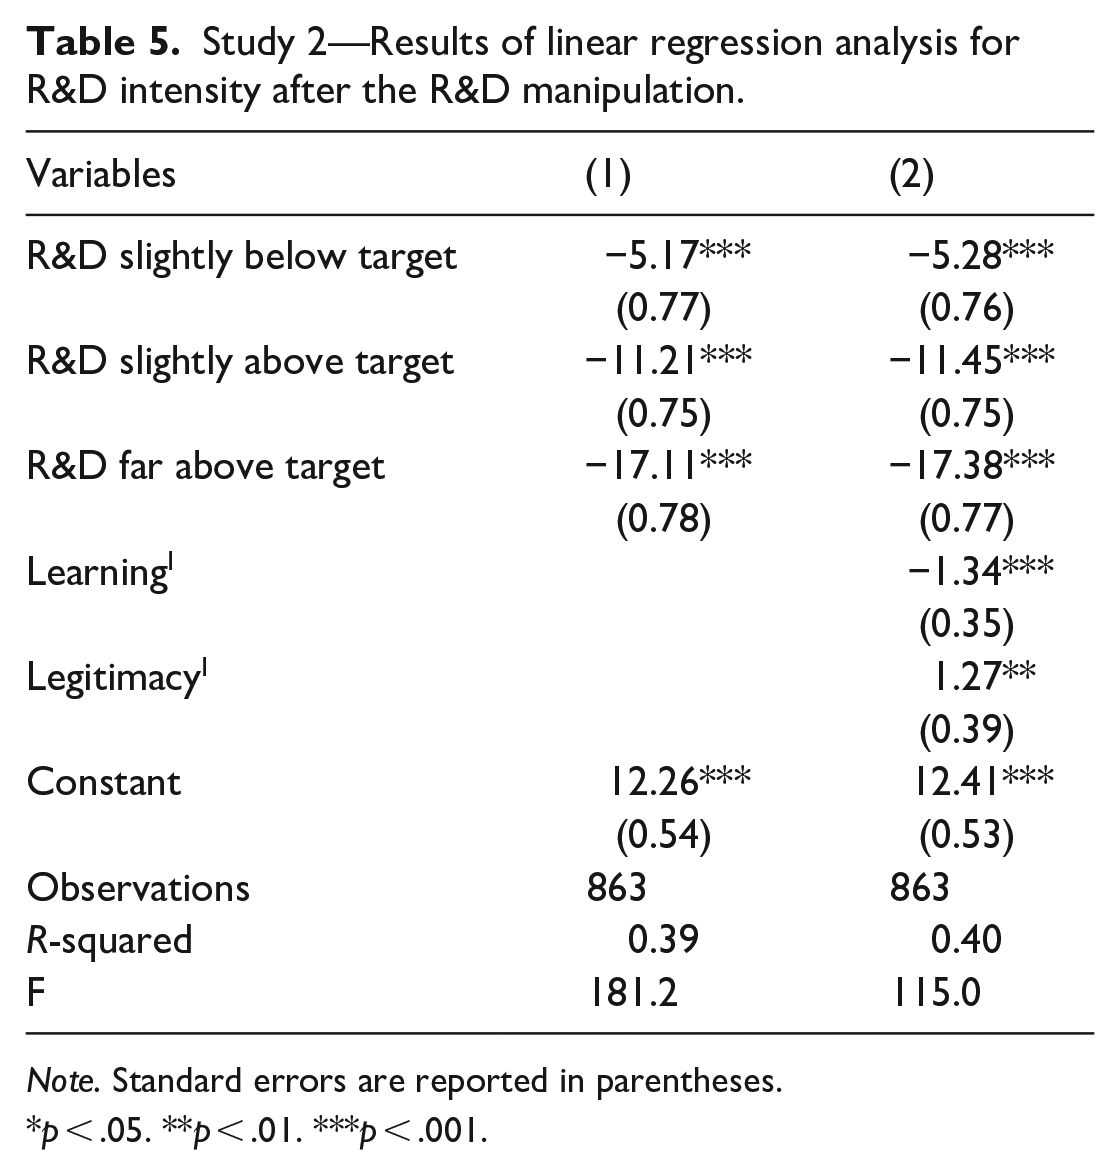
Note. Standard errors are reported in parentheses.
p < .05. **p < .01. ***p < .001.
Study 2—Results of mediation analysis to test the indirect effect of performance relative to social aspirations on R&D Intensity change through learning and legitimacy salience.
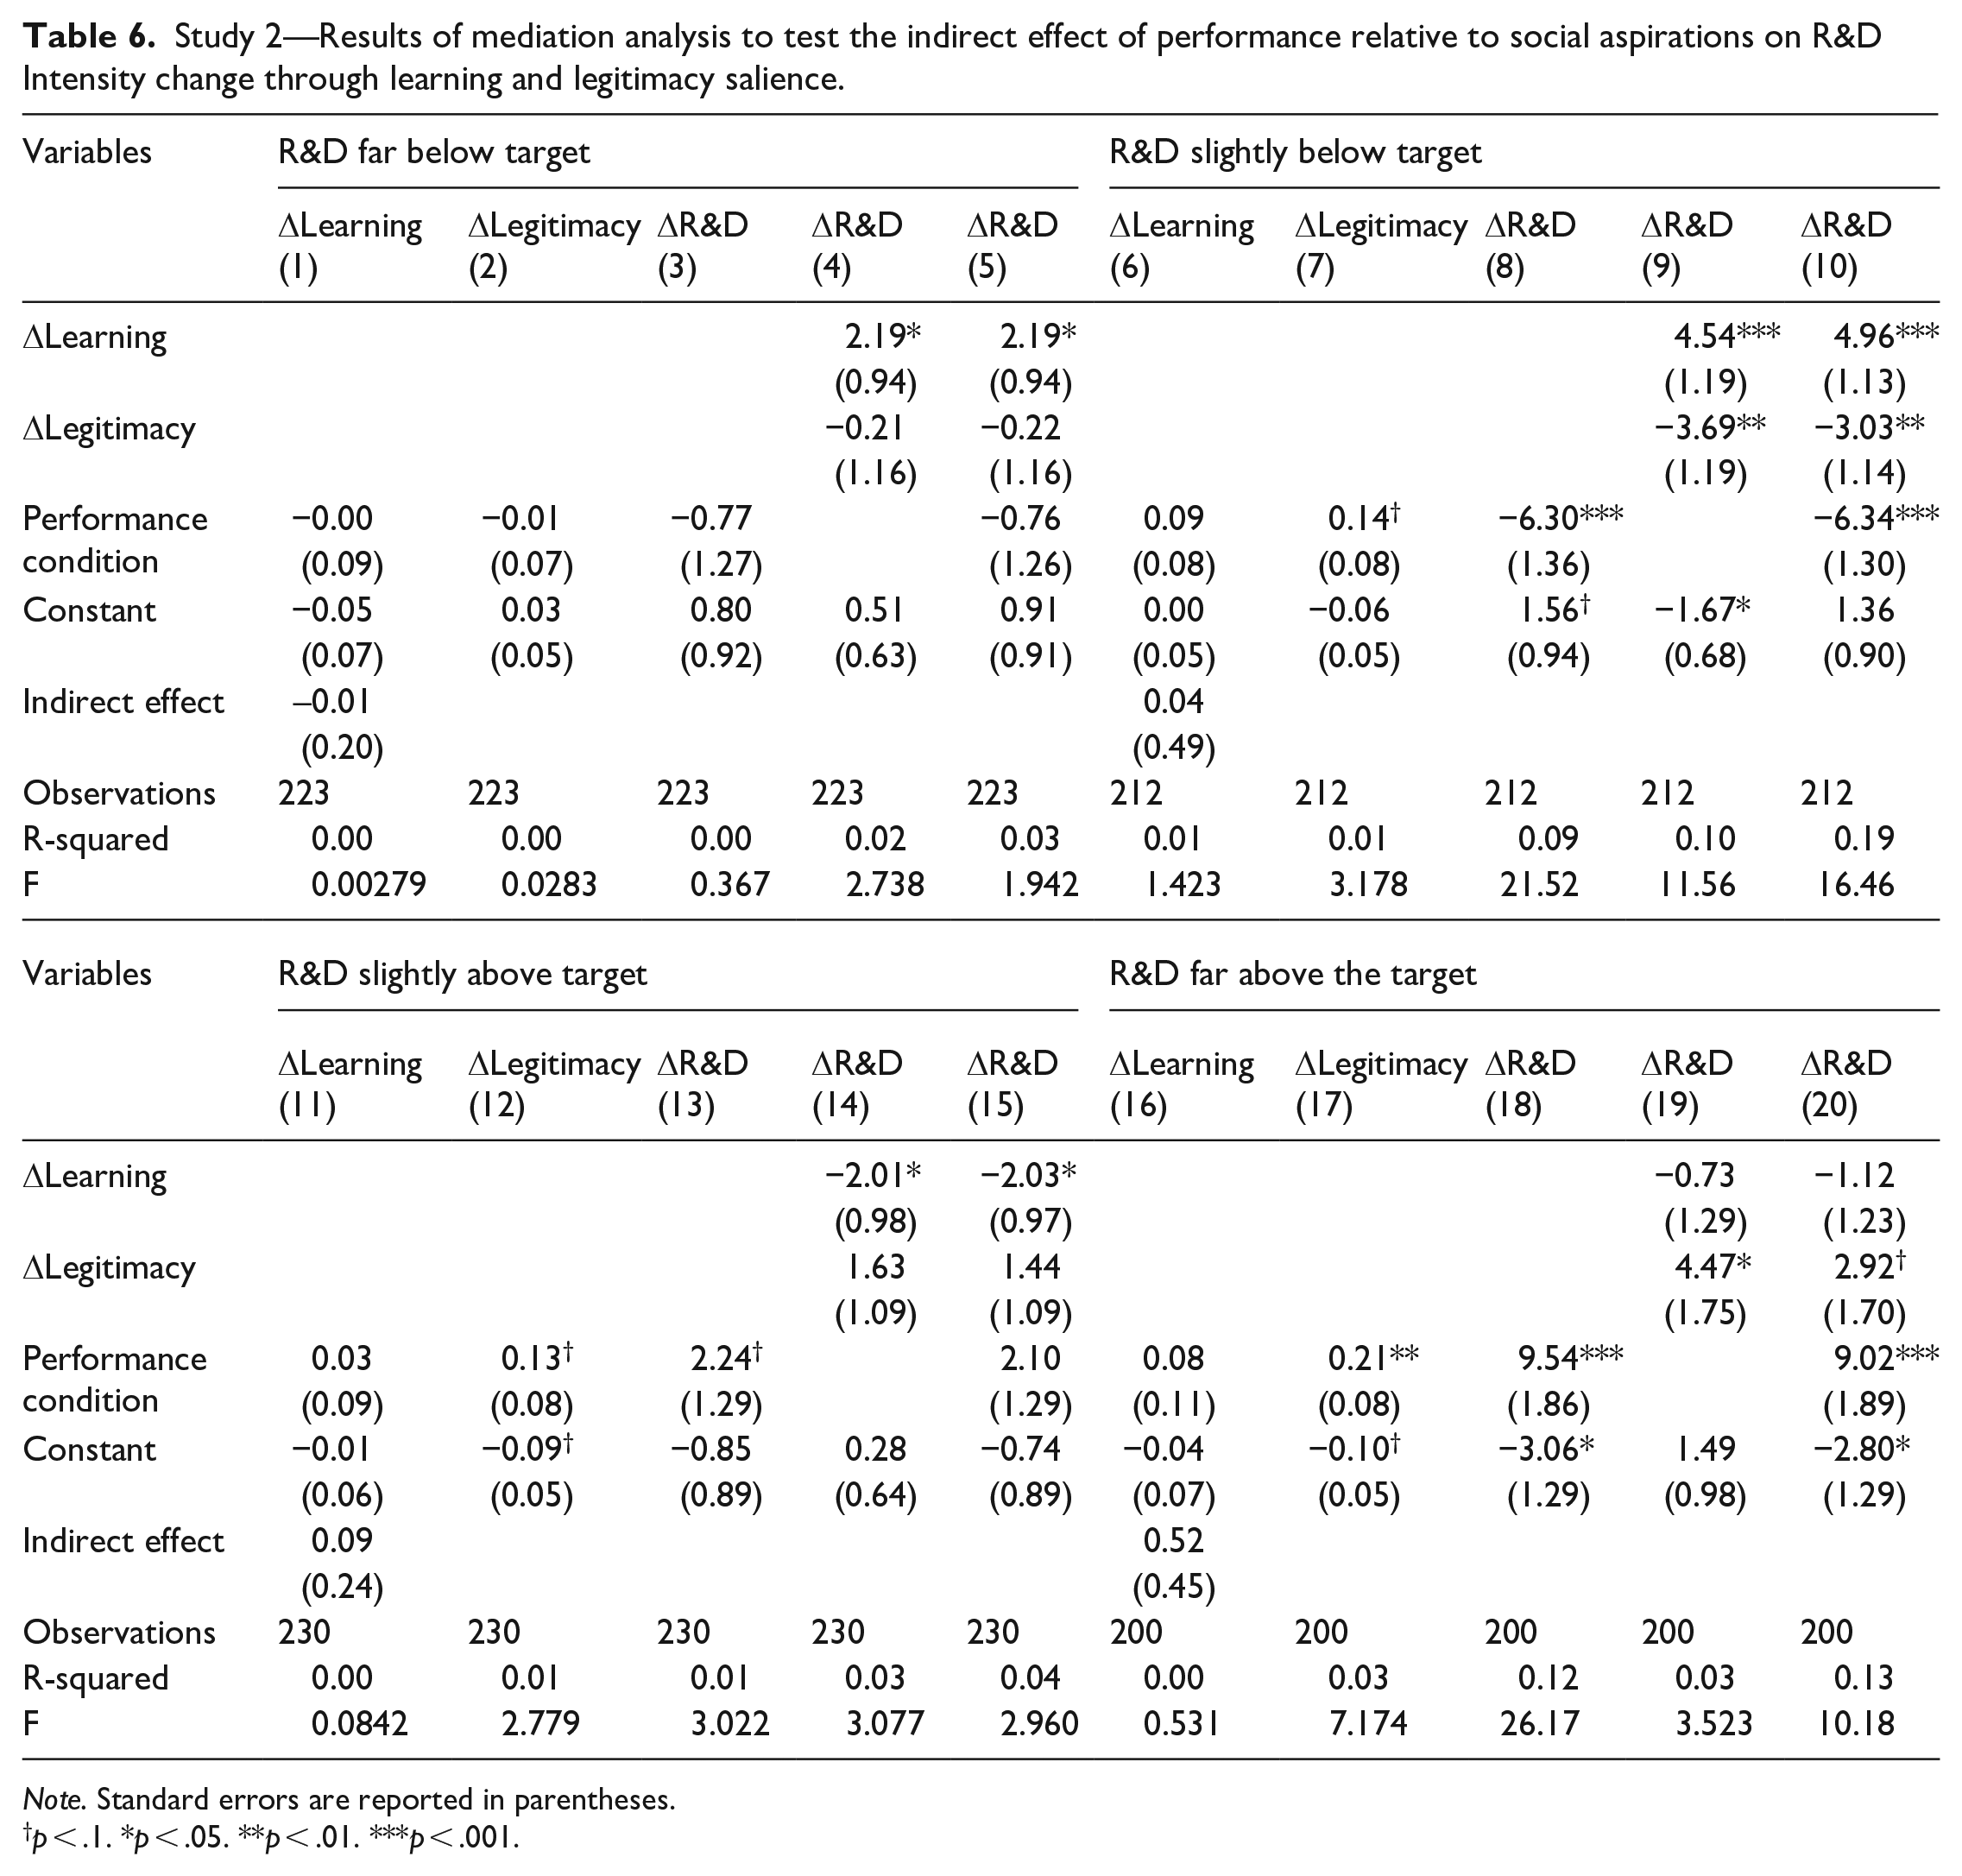
Note. Standard errors are reported in parentheses.
p < .1. *p < .05. **p < .01. ***p < .001.
Model 2 in Table 5 tests the effects of learning and legitimacy salience on R&D intensity change (R&Dt I —R&Dt-1) in response to the first manipulation. Consistent with expectations, learning salience negatively influenced R&D intensity change (β = −1.34, p < .001), while legitimacy had a positive effect (β = 1.27, p < .01). A linear hypothesis test confirmed the equality of these effects (F = 0.03, ns)—supporting the balance between learning and legitimacy goals.
H1 predicts a more concave (less convex) relationship between R&D discrepancy and R&D intensity when firm performance is below social aspirations driven by changes in goal salience. This means that the salience of learning and legitimacy goals mediates the relationship between performance relative to aspirations and R&D intensity in response to a particular R&D discrepancy. Mediation analysis (Table 6) revealed that legitimacy salience partially explained these effects. For the group with R&D slightly below the target, performance above aspirations positively influences legitimacy salience (Model 7: β = 0.14, p < .10) and leads, on average, to a 6.30-percentage-point lower R&D intensity compared to the case of performance below aspirations (Model 8: β = −6.30, p < .001). Furthermore, a standard deviation increase in legitimacy salience after the performance manipulation is associated with a 2.80-percentage-point average decrease in R&D intensity (Model 9: β = −3.69, p < .01). Within the group with R&D far above the target, performance above aspirations positively influences legitimacy salience (Model 17: β = 0.21, p < .01), and leads, on average, to a 9.54-percentage-point higher R&D intensity than the case of performance below aspirations (Model 18: β = 9.54, p < .001). Furthermore, legitimacy salience has a positive effect on R&D intensity, as indicated by the positive and significant coefficient for Legitimacyi II − Legitimacyi I in Model 19 (β = 4.47, p < .05). However, the indirect effects of performance on R&D intensity via legitimacy salience were not significant, leaving the mediation hypothesis partially unsupported.
Concluding discussion
Findings and contributions
Despite much attention in the literature on the determinants of R&D investments, many gaps remain in understanding how goals and aspirations drive these decisions. The purpose of this study was to scrutinize these. Through a longitudinal analysis of Spanish manufacturing companies’ R&D investments and an online experiment with 863 participants, we have shown that learning goals predominantly drive firms’ adjustments in R&D intensity. Firms increase R&D intensity at a decreasing rate when below the reference level and decrease it at an increasing rate when above it, reflecting a strong focus on learning from socially salient others (Ingram & Baum, 1997; J. Y. Kim & Miner, 2007). However, legitimacy goals gain salience when firm profitability exceeds social aspirations, influencing firms to imitate peers to maintain their status and enhance stakeholders’ perceptions (George et al., 2006).
Thus, instead of the relatively isolated explanations of imitative behavior that characterize the earlier literature, we offer a more accurate, integrative, and situation-dependent model of inter-firm imitation. By examining R&D discrepancy and performance relative to social aspirations, we provide a nuanced understanding of how firms’ motivations for imitation shift depending on situational contingencies. For example, we find that learning goals dominate when firms are below reference levels, driving adjustments to optimize efficiency, while legitimacy goals become more salient as firms surpass performance aspirations, emphasizing conformity with industry norms. As such, our study also contributes to research on goal salience (Chen & Miller, 2007; Greve, 2008) by shedding light on how firm profitability influences the interplay between learning and legitimacy goals.
Our findings enrich and extend the core theoretical arguments found in both the behavioral theory of the firm and the neo-institutional theory literatures. First, our study is the first to consider aspirations for R&D intensity—a critical indicator because of its ambivalence in terms of technical and social value. Second, we consider different thresholds for profitability benchmarking—specifically, the industry’s average and top performers—demonstrating that outcomes are affected by the threshold that firms select. For large firms, surpassing the industry’s top performance level increases legitimacy salience, underscoring high-status group membership (Fisher et al., 2016; Moliterno et al., 2014). When benchmarking against industry averages, legitimacy salience grows with distance above the threshold, while proximity to top performance levels further amplifies legitimacy salience. These findings contribute to performance feedback theory (e.g., Chen & Miller, 2007; Greve, 2003, 2008; Moliterno et al., 2014) by indicating that the choice of a given threshold for performance benchmarking makes a difference in the feedback mechanisms adopted. As such, it should be more directly incorporated into future studies on organizational responses to performance-aspiration discrepancies.
Limitations and future research
Our study’s contributions must be viewed considering its limitations. A first limitation relates to the generalizability of our results. Our focus on manufacturing firms limits generalizability to industries where R&D investments are less central. Second, country-specific factors, such as Spanish government policies and nation-specific risk preferences, may also affect firms’ focus on learning and legitimacy in ways that may not be generalizable to other countries. 15 In terms of future research, we call for replication studies in other national or regional environments and for cross-country research that may help deal with the effects of institutions, policies, preferences, and other country-specific factors.
A second limitation arises from our restricted focus on learning and legitimacy goals underpinning inter-firm imitation. The practical distinction between learning and legitimacy goals may be less clear-cut in real-world settings. Additional goals may also come into play, especially near the aspiration level, where firms often face ambiguity and overlapping motivations. Furthermore, while we concentrated on how performance relative to social aspirations affects learning and legitimacy salience, there might also be other relevant contextual factors, such as financial distress or slack resources (e.g., Chen & Miller, 2007; Miller & Chen, 2004). For instance, financial instability may increase firms’ preoccupation with maintaining control, thereby engaging in imitation to maintain legitimacy (Fisher et al., 2016; Greve & Teh, 2018).
Future research could also investigate criteria for defining social reference groups. These groups emerge from categorical boundaries shaped by actors’ knowledge structures and sense-making systems (Cattani et al., 2017). In our study, we checked for alternative definitions of social salience, but these boundaries may vary by industry complexity, with simple industries having single reference groups and complex ones featuring multiple strategic groups, each with different performance thresholds (J. Lee et al., 2020). A multi-level approach could capture interdependencies among individual, firm, and collective understandings.
Finally, while we focused on high-performing and large firms as sources of social and technical value, mediocre or poor performers may also serve as conduits for relevant information (e.g., Ingram & Baum, 1997; J. Y. Kim & Miner, 2007). Their behaviors could serve as cautionary tales, prompting top performers to emphasize legitimacy concerns (Terlaak & King, 2007).
Conclusion
Significant gaps remain in understanding the goals driving firm R&D investments. We examine these investments in uncertain settings with inter-firm imitation. By bringing together organizational learning and neo-institutional theories, we develop and test a model predicting that the salience of the learning and legitimacy goals underlying imitative R&D investments depends on overall firm performance. We find that when performance increases (decreases) above aspirations, imitation is increasingly (less) associated with the need to maintain legitimacy, whereas learning is less dependent on firm performance-aspiration discrepancies. Our study thus addresses and situates competing explanations of inter-firm imitation and provides a path toward a more inclusive theory of organizations interacting with their environment.
Supplemental Material
sj-docx-1-brq-10.1177_23409444251320401 – Supplemental material for How learning and legitimacy goals influence inter-firm imitation in R&D investment decisions
Supplemental material, sj-docx-1-brq-10.1177_23409444251320401 for How learning and legitimacy goals influence inter-firm imitation in R&D investment decisions by Ambra Mazzelli and Nicolai J Foss in BRQ Business Research Quarterly
Footnotes
Acknowledgements
We thank Alfredo De Massis (University of Bozen), Charles Fine (MIT Sloan), Henrich Greve (INSEAD), Josip Kotlar (Politecnico of Milan), Rob Nason (McGill University), Daphne Teh (Bocconi University), Sascha Walter (Julius-Maximilians-University Würzburg), and Thomas Zellweger (University of St. Gallen) for excellent comments on earlier versions of this article.
Declaration of conflicting interests
The author(s) declared no potential conflicts of interest with respect to the research, authorship, and/or publication of this article.
Funding
The author(s) received no financial support for the research, authorship, and/or publication of this article.
Supplemental material
Supplemental material for this article is available online.
Notes
References
Supplementary Material
Please find the following supplemental material available below.
For Open Access articles published under a Creative Commons License, all supplemental material carries the same license as the article it is associated with.
For non-Open Access articles published, all supplemental material carries a non-exclusive license, and permission requests for re-use of supplemental material or any part of supplemental material shall be sent directly to the copyright owner as specified in the copyright notice associated with the article.