
Abstract
Using an extensive sample of environmental, social, and governance (ESG) ratings, we reexamine the corporate social responsibility (CSR) factor premium in the developed equity markets between 2007 and 2019 and show that its extent is contingent upon size effects. Consistent with the novel market equilibrium, we contend that the exponential growth of socially responsible investment (SRI) has rendered the risk-adjusted returns of large CSR-leading firms in line with or even below their lagging counterparts. In line with the neglected effect, greater market segmentation, lower market efficiency, and lower investor awareness of CSR enable us to observe the former market equilibrium in the smaller corporation partition, where CSR-lagging firms exhibit lower returns than leading ones. We thus theorize a two-stage CSP–CFP relationship, where size effects are considered a relevant moderator. This contention is robust to portfolio and panel regression settings. However, our partly contradicting results with the existent literature emphasize the divergence in ESG ratings across rating agencies.
Keywords
Introduction
Starting with the works of Adam Smith, the fundamental purpose of the firm has been heavily debated. Academics now recognize that corporations have a broader set of obligations rather than the sole maximization of shareholders’ utility (Clarkson, 1995). Many of these ethical obligations are often referred to as corporate social responsibility (CSR), which encompasses the costly voluntary actions undertaken by a firm in the societal interest. This broad term led to various concepts. Among them, socially responsible investments (SRI) comprise all financial approaches explicitly acknowledging the relevance of environmental, social, and governance (ESG) factors. The peculiarity of this investing style lies in the use of extra-financial indicators, which allow investors to (1) identify firms with impeccable CSR records, (2) “red flag” unsuited issuers, and (3) manage the extra-financial risks of their portfolios (Ferrat et al., 2022b). Currently, SRI has become mainstream and accounts for one of every three professionally managed dollars (Global Sustainable Investment Alliance [GSIA], 2018). The US$30 trillion managed responsibly is fueled by investors, stakeholders, legal and regulatory shifts, and abundant media coverage. For this investment form to maintain its exponential growth and enhance its impact on society, academics and practitioners must pursue research to determine its benefits and adverse effects.
In this spirit, more than 2,000 empirical studies have attempted to comprehend the impact of CSR on firm performance and risk (Friede et al., 2015). Findings have suggested that higher CSR corporations display greater profitability (Gantchev & Giannetti, 2021; Guenster et al., 2011), superior stock risk-adjusted returns (Awaysheh et al., 2020; Derwall et al., 2005; Khan, 2019), higher market valuations (Gantchev & Giannetti, 2021; Price & Sun, 2017), and lower financing costs than their peers (El Ghoul et al., 2011; Ng & Rezaee, 2015). Researchers have further attempted to reveal the existence of a CSR factor premium within the developed equity markets. This factor premium is commonly obtained through the risk-adjusted returns of an arbitrage portfolio going long in CSR-leading stocks and shorting CSR-lagging ones. As suggested by meta-analytical studies (Friede et al., 2015), previous results have been mixed 1 ; thus, the existence of a persistent CSR factor premium is still open for debate. These conflicting findings resonate with the market-like performance of SRI funds (Renneboog et al., 2008) and thus naturally raise the question of why superior performance and lower risk of high CSR firms at the stock level do not lead to enhanced risk-adjusted returns at the portfolio level.
Our study attempts to bridge this gap by arguing that the corporate social and financial performance (CSP–CFP) relationship is not direct and is far more complex than commonly expected (Ferrat, 2021; Ferrat et al., 2022a). Using a broad sample of ESG ratings provided by MSCI ESG Research, we thoroughly examine the CSR factor premium and its underlying mechanisms in the developed equity markets. While previous studies have extensively focused on the U.S. capital markets, we perform an international analysis of the main developed regions between 2007 and 2019. Given the diversity of methods employed to construct the CSR factor premium, we examine both equally and market capitalization-weighted versions and employ conventional cut-offs to form our CSR-leading and -lagging portfolios. We uncover that the equally weighted CSR factor premium appears non-negative while the market capitalization-weighted one appears predominantly negative across regional segmentations. Consistent with the study by Dorfleitner et al. (2020), our results highlight the importance of size effects in the emergence of the CSR factor premium. We thus propose and test a two-stage relationship where size effects moderate the impact of CSP on CFP. For robustness purposes, this examination is undertaken using portfolio risk-adjusted returns and fixed-effect panel regression models at the firm level. According to our findings, the CSR factor premium is significantly positive in the small corporation partition and neutral or negative, contingent upon regions, for larger firms.
Consistent with a recent stream of literature in the management field (Cordeiro & Tewari, 2015; Darnall et al., 2010; Wickert et al., 2016), we thus theorize that size effects may play an important moderating role in the emergence of this factor premium. Indeed, the fiduciary duty and the risk-averse behavior of institutional investors, who have driven SRI assets’ growth in the last decades (GSIA, 2018), constrain their ability to invest in smaller corporations (Del Guercio, 1996; Falkenstein, 1996). This market segmentation thus allows anomalies, such as the CSR factor premium, to persist for smaller stocks (Boehmer & Kelley, 2009; Nagel, 2005). In contrast, greater attention to CSR and intense arbitrage activity should eliminate this factor premium in the stock of larger firms (Reverte, 2009; Shleifer & Vishny, 1997). Hence, we contend that larger firms have adjusted the novel market equilibrium while smaller ones have not yet shifted to these pricing conditions and still reflect the former market equilibrium (Heinkel et al., 2001; Pástor et al., 2021; Pedersen et al., 2021). Thus, the exponential growth of SRI assets appears to have altered the risk and return profiles of equities historically and for years to come (Ferrat et al., 2022c). However, our results partly diverge from those presented by Dorfleitner et al. (2020) and Cakici and Zaremba (2022). This contrast in findings appears to be explained by the divergence of CSR ratings across rating agencies (Berg et al., 2022). Hence, our conclusions may be contingent upon the CSR data set employed.
The implication of our research is twofold: (1) SRI investors should carefully consider the weighting scheme employed to create persistent value; (2) while in the smaller firm partition, investors may generate additional performance by simple exposure to the CSR factor premium, SRI practitioners should exhibit underperformance or perform similarly to the market in the large corporation partition. The remainder of this study is organized as follows. The second section reviews the existing literature and derives our research hypotheses by building on instrumental CSR theories, modern financial theory, and information asymmetry settings. The third section details our data set, the methodology employed, and performance attribution models. The fourth section presents an in-depth analysis of the CSR factor premium in the developed equity markets. The fifth section discusses the main results obtained, and the final section concludes.
Framework and hypothesis development
Previous studies related to CSR factor premium
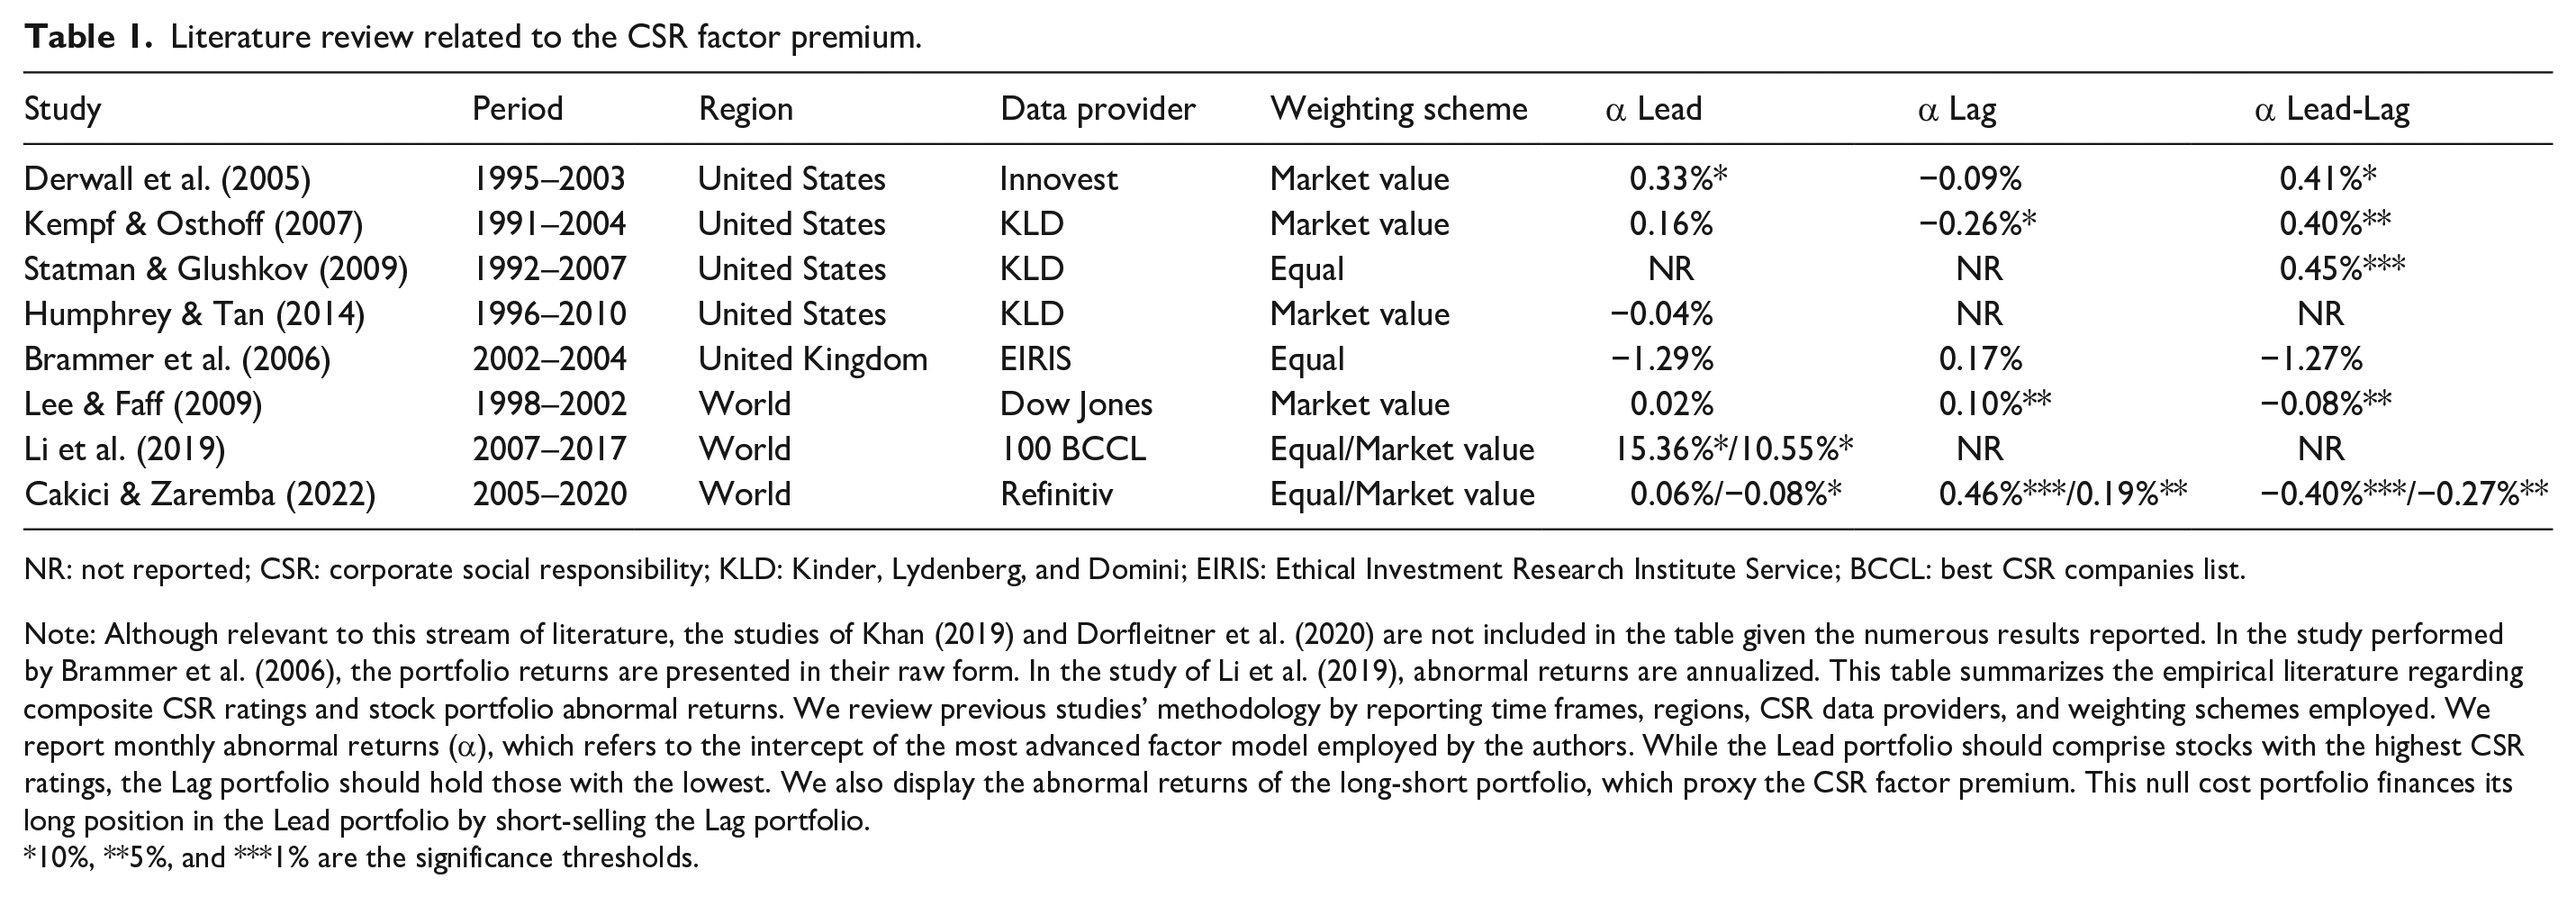
As already mentioned, the literature on the relationship between aggregate CSR ratings and future financial risk-adjusted returns is still ambiguous (Friede et al., 2015). While numerous studies have examined this association, limitations such as the omission of controls, restricted sample size, insufficient periods considered, and inconsistent methodology limit the reliability of inferences made (Orlitzky et al., 2003). The current state of the art is displayed in Table 1.
Literature review related to the CSR factor premium.
NR: not reported; CSR: corporate social responsibility; KLD: Kinder, Lydenberg, and Domini; EIRIS: Ethical Investment Research Institute Service; BCCL: best CSR companies list.
Note: Although relevant to this stream of literature, the studies of Khan (2019) and Dorfleitner et al. (2020) are not included in the table given the numerous results reported. In the study performed by Brammer et al. (2006), the portfolio returns are presented in their raw form. In the study of Li et al. (2019), abnormal returns are annualized. This table summarizes the empirical literature regarding composite CSR ratings and stock portfolio abnormal returns. We review previous studies’ methodology by reporting time frames, regions, CSR data providers, and weighting schemes employed. We report monthly abnormal returns (α), which refers to the intercept of the most advanced factor model employed by the authors. While the Lead portfolio should comprise stocks with the highest CSR ratings, the Lag portfolio should hold those with the lowest. We also display the abnormal returns of the long-short portfolio, which proxy the CSR factor premium. This null cost portfolio finances its long position in the Lead portfolio by short-selling the Lag portfolio.
10%, **5%, and ***1% are the significance thresholds.
As suggested by our literature review, few studies in this field have been performed internationally. For example, Derwall et al. (2005) examine Innovest Strategic Value Advisors’ corporate eco-efficiency scores to construct two types of mutually exclusive US portfolios. As can be seen in the last three columns in Table 1, their results suggest that more eco-efficient portfolios significantly outperform the less eco-efficient ones over the 1995–2003 period. Furthermore, their findings seem robust after controlling for style factors, industry effects, transaction costs, and even weighting methodologies. Thus, the benefits of CSR filtering appear to be substantial when used for stock selection. In another study in the United States, Kempf and Osthoff (2007) also use CSR ratings from Kinder, Lydenberg, and Domini (KLD) Research and Analytics to form portfolios. Over the 1991–2004 time frame, their findings indicate that the market capitalization-weighted portfolio displayed positive abnormal returns. Using a similar data set and analyzing the 1992–2007 period, Statman and Glushkov (2009) share this conclusion by forming equally weighted ranked portfolios. Indeed, the CSR-leading portfolios significantly outperform the lagging ones. However, the performance gap in risk-adjusted returns diminishes significantly when stocks are market-capitalization-weighted. Hence, the weighting scheme employed seems thus to be an important factor to consider when studying this phenomenon. Humphrey and Tan (2014) extend the performance of American leading CSP portfolios. Utilizing KLD’s data set, they report that the market-capitalization-weighted portfolio of high CSR firms performs similarly to the S&P500 over the 1996–2010 time frame. In Europe, empirical evidence is scarce. Using a sample of 450 UK firms during the 2002–2004 time frame, Brammer et al. (2006) construct portfolios with Ethical Investment Research Institute Services’ (EIRIS) composite rating. Their results show that the bottom quintile outperforms the top one. Limitations of this study include the omission of factor models to properly isolate the CSR factor premium. To the best of our knowledge, existing studies in the Pacific region seem mainly focused on mutual fund performance and do not analyze the CSR factor premium.
Regarding international studies, Lee and Faff (2009) utilize the Dow Jones Global Index and the associated SRI index as their sample. While the latter index is used as a proxy for high CSR companies, they remove from the former all constituents of the latter to form their lagging portfolio. While their findings suggest that the leading portfolio generates the same performance as the global index, their lagging portfolio significantly outperforms both the global index and the leading portfolio. Given that their lagging portfolio includes average CSR-performing stocks, this portfolio should be more diversified than the leading one, which could explain its outperformance. Khan (2019) examines the CSR factor premium in developed and emerging markets. Using MSCI’s ESG ratings, the author reports that the CSR factor premium is statistically significant and positive between 2009 and 2017. Furthermore, the inferences are robust to panel modeling settings. In another international study, Li et al. (2019) employ the “100 Best CSR Companies List” (100 BCCL) to construct a CSR-leading portfolio between 2007 and 2017. According to their results, six-factor abnormal returns are significantly positive. They obtain an annualized abnormal return of 15.36% using an equal weighting of portfolio constituents and 10.55% in a market capitalization approach.
In the most advanced study of the CSR factor premium, Dorfleitner et al. (2020) employ a developed market sample of CSR ratings provided by Thomson Reuters between 2002 and 2018. In their empirical examination, they tackle the heterogeneity of weighting schemes by reporting CSR factor premiums obtained through market capitalization, equal, and ranked weights. The findings they uncover suggest that the CSR factor premium is negative in almost all regional segmentations. Given the exposure to the size factor, the authors further examine the CSR factor premium in low and high market capitalization partitions. In this setting, their results suggest that the CSR factor premium is (1) negative or neutral in the low market capitalization partition and (2) not statistically significant in the high partition. Overall, they contend that smaller firms may drive the CSR factor premium negatively. In the most recent study analyzed, Cakici and Zaremba (2022) employ Refinitiv’s CSR ratings to construct distribution-based portfolios internationally. Using the top and bottom decile to identify CSR-leading and -lagging firms, they examine the returns of equally and market value-weighted portfolios between 2005 and 2020. Their results suggest that abnormal returns of CSR-lagging portfolios are significantly higher than those of their leading counterparts. Furthermore, they uncover a negative and statistically significant CSR factor premium, robust to weighting methodologies.
While the studies in this stream of literature are insightful, they present some weaknesses that we identify and attempt to address. First, researchers have employed heterogeneous weighting schemes when constructing the CSR factor premium. As highlighted by Statman and Glushkov (2009), Li et al. (2019), Dorfleitner et al. (2020), and Cakici and Zaremba (2022), the CSR factor premium is highly sensitive to this aspect. Thus, the results provided by some studies may be flawed. Consistent with this literature stream, we propose to examine equally and market capitalization-weighted CSR factor premiums to account for this inconsistency. Second, scholars have employed uneven CSR rating cut-offs to classify stocks in CSR-leading and lagging portfolios. For example, Kempf and Osthoff (2007), Dorfleitner et al. (2020) and Cakici and Zaremba (2022) examine stocks above the 90th percentile and below the 10th percentile, Statman and Glushkov (2009) and Brammer et al. (2006) utilize terciles, Khan (2019) employs quartiles, Derwall et al. (2005) partition their universe using the median value, and Lee and Faff (2009) exploit uneven partitions. Overall, these heterogeneous cut-offs render the CSR factor premium heavily dependent on the methodology employed. Indeed, the portfolios examined by Kempf and Osthoff (2007), Dorfleitner et al. (2020), and Cakici and Zaremba (2022) should be insufficiently diversified. Thus, the results obtained could be heavily driven by the returns of a limited number of stocks. To account for this issue, we employ the conventional thresholds introduced by Fama and French (2015) that are extensively used in the factor premium literature. Third, previous studies have almost unequivocally assumed that the CSR factor premium is homogeneous across market capitalization partitions. Solely Dorfleitner et al. (2020) and Cakici and Zaremba (2022) acknowledge the relevancy of size effects in the emergence of a CSR factor premium. Hence, our study attempts (1) to shed light on the importance of size effects in the emergence of the CSR factor premium, (2) to support this moderating effect with adequate theoretical foundations, and (3) to analyze its robustness using both portfolio and panel regressions.
Corporate responsibility and risk-adjusted returns
Regarding whether firms should engage in CSR, an intense debate has been initiated between two opposing groups of academics: the alleged “Friedman-Freeman” debate. The oldest intuitions are based on the neoclassical view of economics and are supported by over two centuries of scholarly research. This group of academics asserts that the only relevant stakeholder to be considered is the shareholder (Friedman, 1970). In Adam Smith’s words, the “invisible hand” will ensure socially Pareto optimal solutions within the markets. Consequently, there is no need for firms to voluntarily engage in CSR activities. Supporters believe that companies must use their resources with the sole purpose of increasing shareholders’ utility. Otherwise, the administrative burden and compliance cost incurred will harm the firm’s economic performance and lead to competitive disadvantages (Aupperle et al., 1985). Overall, the distinction between economic and social objectives is significantly emphasized in this stream of literature, and proponents exert a conflicting interest between increasing economic performance and dedicating resources to CSR (Lerner & Fryxell, 1988).
Building on stakeholder theory, another stream of the literature proposes that companies have a tacit agreement with all of society’s constituents. Thus, a corporation’s authentic responsibility is to create and distribute wealth to stakeholders without separating business from ethics (Clarkson, 1995). Stakeholder theory has been the prevailing approach to explain how a firm’s commitment to CSR activities contributes to financial wealth. As suggested by Freeman (1994), corporate success is primarily driven by improved relations with all affected entities. In this setting, proponents compel firms to maximize societal welfare rather than corporate wealth itself. Corporations should act to maximize their “triple” bottom line and abstain from short-term actions, which are socially and environmentally harmful (Elkington, 1998). Following this rationale, improved CSP has been proven to be a potential source of competitive advantage (Vilanova et al., 2009). Among them, one can mention greater efficiency, acquisition of critical resources, product differentiation, and increased pricing premiums (Luo & Bhattacharya, 2006; Porter & Van der Linde, 1995). All these competitive advantages should increase a corporation’s fundamentals and the probability of survival over a long-term horizon (Fatemi et al., 2015).
While pursuing sustainable business activities should not adversely affect a company’s top line, the impact on the bottom line is still subject to debate. In the shareholder’s utility maximization view, the heightened costs due to CSR compliance will decrease corporate profit. As advocated by stakeholder theory, the costs of engaging in sustainable business activities should be more than offset by enhanced corporate revenue. Nevertheless, CSR’s beneficial or adverse effects should impact corporate fundamentals, which will eventually feed into stock prices. Thus, we consider that CSP and CFP should be inherently linked. While these two views discuss the implications of CSP, the existence of a CSR factor premium within the capital market should be contingent upon market efficiency. Given the numerous profitable anomalies in the developed markets (Zaremba et al., 2020), we contend that the spread in risk-adjusted returns between CSR-leading and -lagging firms should be empirically distinguishable.
Investors in the capital markets display heterogeneous beliefs regarding the impact of CSP. A typical participant trades off solely risk and returns to maximize his utility, whereas CSR-conscious individuals derive additional utility from ethical considerations. Given the tremendous growth of SRI assets in the last decades, the growing presence of ethical investors has naturally affected the demand for stocks contingent upon their level of CSP (Ferrat et al., 2022c). Heinkel et al. (2001) developed a theoretical equilibrium setting that attempts to comprehend the consequences of ethical screening on security returns. Building on Merton’s (1987) framework, they state that the financial boycott operated by ethical investors should alter the risk-sharing opportunities in the capital markets. Specifically, “green” stocks should be linked to a larger investor base and lower perceived risk compared to their “brown” counterparts. On one hand, the smaller investor base of “brown” firms requires higher returns in compensation for holding these stocks due to their accrued environmental risks (Bolton & Kacperczyk, 2021). On the other hand, the inflated demand for “green” stocks should raise their market valuations and lower their returns. As recently modeled by Pástor et al. (2021) and Pedersen et al. (2021), the contentions of Heinkel et al. (2001) remain valid in the context of CSP and not only environmental performance. Empirically, these contentions have been confirmed by (1) the lower cost of capital enjoyed by high CSR performing entities (El Ghoul et al., 2011; Ng & Rezaee, 2015) and (2) the statistically significant outperformance of “sin” stocks (Hong & Kacperczyk, 2009). Hence, the financial boycott operated by ethical investors leads to modified risk-sharing opportunities in the equity markets and ultimately higher returns for low CSR firms. This way, we establish the first hypothesis for our work:
Hypothesis H1. Firms with lagging CSR practices should exhibit higher returns than their leading counterparts.
On the moderating effect of size
An assertion made by scholars is that SRI mutual funds display significant exposures to common risk factors (Orlitzky & Benjamin, 2001). Indeed, these funds have been shown to be skewed toward smaller firms (Bauer et al., 2005; Gregory et al., 1997). Hence, we suggest that the inconsistent and non-significant results regarding the CSP–CFP relationship could be partly explained by the omission of moderating variables. While academic literature has only begun to identify relevant moderators, we suggest that one of the most prominent could be the size effect. Indeed, renewed interest in considering firm size in the management field and how it pertains to CSR motivates this decision (Cordeiro & Tewari, 2015; Darnall et al., 2010; Wickert et al., 2016). We advance that investors’ preferences and market segmentation support this contention.
Institutional investors’ preferences are guided by their fiduciary duty; they aim to provide a return on investment with a low risk to their trustees (Del Guercio, 1996). Given the heightened risk, large investors are averse to investing in smaller companies and tend to hold a lower stake (Falkenstein, 1996). This market segmentation of smaller firms is due to (1) the lower amount of information available, (2) the illiquidity and greater transaction costs, and (3) larger amounts traded by institutional investors, which would lead to considerable ownership. Thus, smaller corporations do not meet these investors’ typical requirements, resulting in a neglect effect (Arbel et al., 1983). Furthermore, these difficulties linked to investing in small market capitalization stocks constrain arbitrage activity, which is most often undertaken by large institutional investors (Shleifer & Vishny, 1997). Therefore, information diffusion into stock prices is likely to be delayed, allowing anomalies to persist in the stock of smaller firms (Boehmer & Kelley, 2009; Nagel, 2005). Moreover, SRI is frequently undertaken by institutional investors, who account for roughly 80% of total assets (GSIA, 2018). Thus, investor awareness for CSR is likely to be reduced in the small corporation partition. Based on these contentions, we believe that the alteration of returns due to SRI should be constrained by size thresholds. In other words, smaller firms being neglected by large investors, their return profile should only marginally be altered by market participants’ trading activity. Thus, smaller corporations should display the former market equilibrium where more substantial (lower) fundamentals reflected by high CSR-performing firms should translate into higher (lower) financial returns. However, the persistence of this equilibrium should only be temporary and pricing conditions will eventually adapt. Indeed, slower information diffusion and investor awareness for CSR should eventually resorb to reflect the novel equilibrium introduced by Heinkel et al. (2001). Hence, our second hypothesis:
Hypothesis H2. Smaller corporations should reflect the former market equilibrium, where CSR-leading firms display greater returns than their lagging counterparts.
Data and methodology
Sample
The research and analysis of extra-financial behavior, undertaken by third-party rating agencies, aims to assess the CSR profile of security issuers. ESG ratings and rankings are designed to evaluate the extra-financial performance and risk of these entities. These measures complete financial analysis by providing an approximation of the external costs and competitive advantages, which are absent from financial accounting. The rationale is that commonly used metrics—book values, cash flows, or earnings—are inappropriate measures of a firm’s implication and vulnerability to environmental and social issues. Using extra-financial ratings to measure CSP is a common practice accepted by academics and practitioners (Malik, 2015). Consistent with the study by Luo and Bhattacharya (2006), we define CSP as a corporation’s overall ranking in CSR. However, there is no single metric to evaluate CSP properly. As highlighted by Berg et al. (2022), CSR ratings significantly diverge across third-party rating agencies regarding the measurement of CSP, the scope of issues considered, and their weighting in the CSR rating.
Our study exploits MSCI ESG Research’s aggregated industry-adjusted ESG scores. Consistent with the concept of materiality by Khan et al. (2016), MSCI ESG Research weights issuers’ performance across 36 key ESG issues 2 to produce these aggregated ratings (MSCI ESG Research, 2020). These metrics reflect a firm’s extra-financial performance relative to its peer group, the so-called “best-in-class” ratings, and are utilized by numerous scholars (Ferrat et al., 2022a, 2022b, 2022c; Khan, 2019). The variable utilized can take three values contingents upon the firm’s practices: Leader, Average, or Laggard. Laggards are defined as companies that exhibit high exposure to extra-financial risks, which they fail to manage. On the contrary, Leaders display remarkable track records in controlling and monitoring ESG risks and opportunities. Finally, Average corporations are those with an unexceptional CSP and are excluded from our examined sample. Our matched database covers over 8,000 unique firms 3 and encompasses 156 monthly time frames. Our data set includes corporations across the main financial regions: Europe (EUR), Japan (JPN), North America (NAM), and Pacific ex-Japan (PAC). Taken all together, they form our developed market universe (WLD). The end-of-month periods analyzed span from 31 December 2006 to 31 December 2019. Table 2 reports the time-series average proportions of firms per ESG category across regions.
Distribution of ESG ratings.
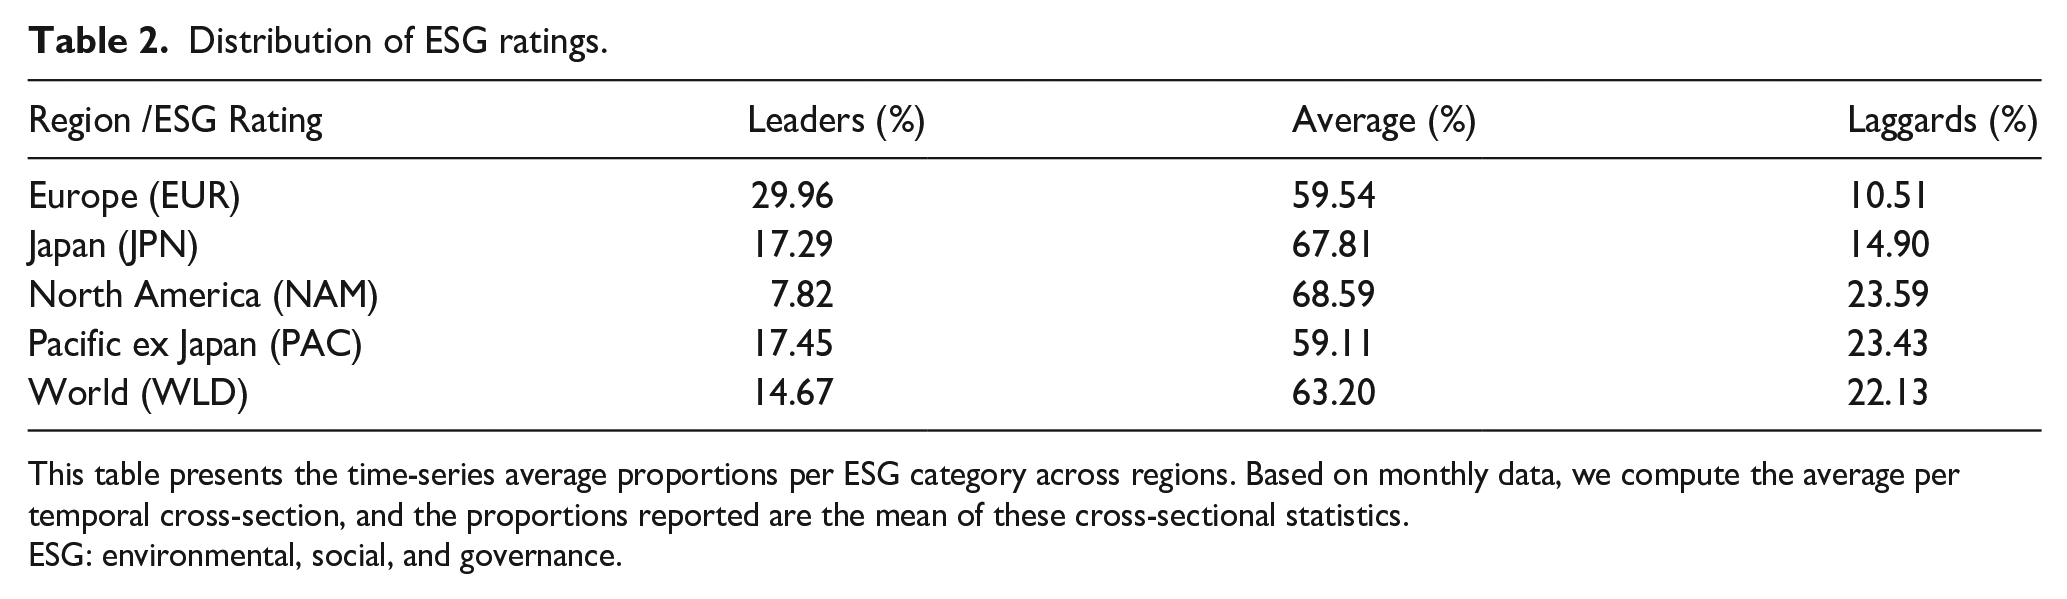
This table presents the time-series average proportions per ESG category across regions. Based on monthly data, we compute the average per temporal cross-section, and the proportions reported are the mean of these cross-sectional statistics.
ESG: environmental, social, and governance.
MSCI’s ratings are normalized by industry, which leads to an uneven distribution regionally. We observe that our sample is roughly two-thirds European or North American. Furthermore, European and Japanese ratings are skewed positively, while Laggards significantly outweigh Leaders in North America. However, we notice a similar proportion of average-rated firms across all regions. These regional discrepancies are also shared by Ho et al. (2011). To alleviate concerns about portfolio returns being driven by a limited number of stocks, we reform these three ESG rating groupings based on the MSCI’s ESG scores distribution. Across all regional partitions, the top (bottom) 30% by industry are labeled as Leaders (Laggards), and the remainder forms the Average group. This methodology is consistent with the one outlined in the study by Fama and French (2015) concerning financial item groupings. As detailed in MSCI ESG Research (2020), we also neutralize ESG categories by industry.
Stock returns and portfolio formation
The combination of ESG ratings and financial returns forms our examined data set. While the former was salvaged from MSCI ESG Research’s database, the latter was retrieved from Thomson Reuters (now Eikon) Datastream. However, we apply several modifications in the data retrieval process described by Ince and Porter (2006). Indeed, the statistical analysis of stock returns may be heavily biased by the inclusion of outliers. These extreme data points are likely to influence the inferences further made. To reduce this bias, we proceed by winsorizing the monthly returns of stocks examined. Based on our initial analysis of our sample, the threshold of 1% is used as a cut-off (Bali et al., 2016, p. 5). In each monthly cross-section, values above (below) the 99th (1st) percentile were set to this percentile.
Asset managers refer to ESG ratings when designing and managing portfolios, which helps them distinguish companies with responsible business practices. Therefore, we used this proxy to partition our data set. At the end of every month, distinct investment pools were formed based on the firms’ ESG category. To alleviate concerns concerning a look-ahead bias in our study, we lagged MSCI’s ESG ratings by a month. Corporations for which ratings were absent were automatically excluded for the subsequent period. Each stock was then equally, or market capitalization-weighted within their respective portfolios. Between two rebalancing dates, asset weights drift freely.
The equally weighted portfolio weights

with
On the contrary, the market capitalization portfolio’s weights

where
Furthermore, we construct long-short portfolios, which allow us to study the CSR factor premium, that is, the difference in returns between the CSR-leading and -lagging portfolios. These long-short portfolios are arbitrage ones, with a nil cost. They are constructed by buying top portfolios (Leaders) and by short-selling bottom portfolios (Laggards). 4 The portfolio returns are obtained by using the underlying security prices in US dollars and were then analyzed using a multi-factor model. Consistent with the study by Derwall et al. (2005), transaction costs are accounted for using a fixed fee of 50 basis points at each rebalancing date.
Performance assessment
Interest in whether financial markets value CSR performance dates to the beginning of the century. However, studies controlling for traditional risk factors, known to influence stock market performance, are limited. To empirically assess the risk-adjusted performance of our portfolios, we use the well-established Fama–French five-factor model augmented by the momentum factor (Carhart, 1997; Fama & French, 2015). Using this model allows researchers to control for market risk (Lintner, 1965; Mossin, 1966; Sharpe, 1964), size effects (Banz, 1981), value versus growth premiums (Fama & French, 1992), price momentum (Jegadeesh & Titman, 1993), and investment and profitability factors (Fama & French, 2015). 5 This is particularly important; researchers have found that the performance of SRI portfolios has been driven by significant risk loadings (Bauer et al., 2005; Galema et al., 2008; Gregory et al., 1997). For each portfolio examined, the following model is estimated by regressing excess portfolio returns on regional style factors using a time-series approach (Li et al., 2019)

where i denotes the portfolio examined and t the month,
Consistent with previous research, the risk-free rate and regional factor returns 6 are retrieved from Kenneth French’s website (Dorfleitner et al., 2020; Lee & Faff, 2009). Given that the portfolio returns, the risk-free rate, and the factor returns are dollar-denominated, empirical results reflect a US investor’s perspective. Furthermore, all reported regression coefficients consider the potential autocorrelation and heteroscedasticity issues involved in estimating time-series models. Consistent with previous literature (Derwall et al., 2005; Dorfleitner et al., 2020; Humphrey & Tan, 2014; Lee & Faff, 2009), we utilize the adjusted standard errors by Newey and West (1987) to derive the statistical significance of estimates obtained.
Empirical findings and econometric modeling
The categorical analysis
Every month, we formed mutually exclusive universes based on the ESG ratings provided by MSCI. Long-only equally weighted portfolios were then constituted from these universes as well as a difference portfolio referred to as the CSR factor premium. An analysis of the obtained portfolio returns can be found in Table 3. Consistent with conventional practice (Cakici & Zaremba, 2022; Dorfleitner et al., 2020; Ferrat et al., 2022a, 2022b; Khan, 2019; Li et al., 2019), this analysis was performed by regressing portfolio returns on the well-known anomalies and examining abnormal returns as well as factor loadings. The usual statistical significance thresholds of 10%, 5%, and 1% were employed and noted, respectively, as *, **, and ***.
Equally weighted portfolio analysis.
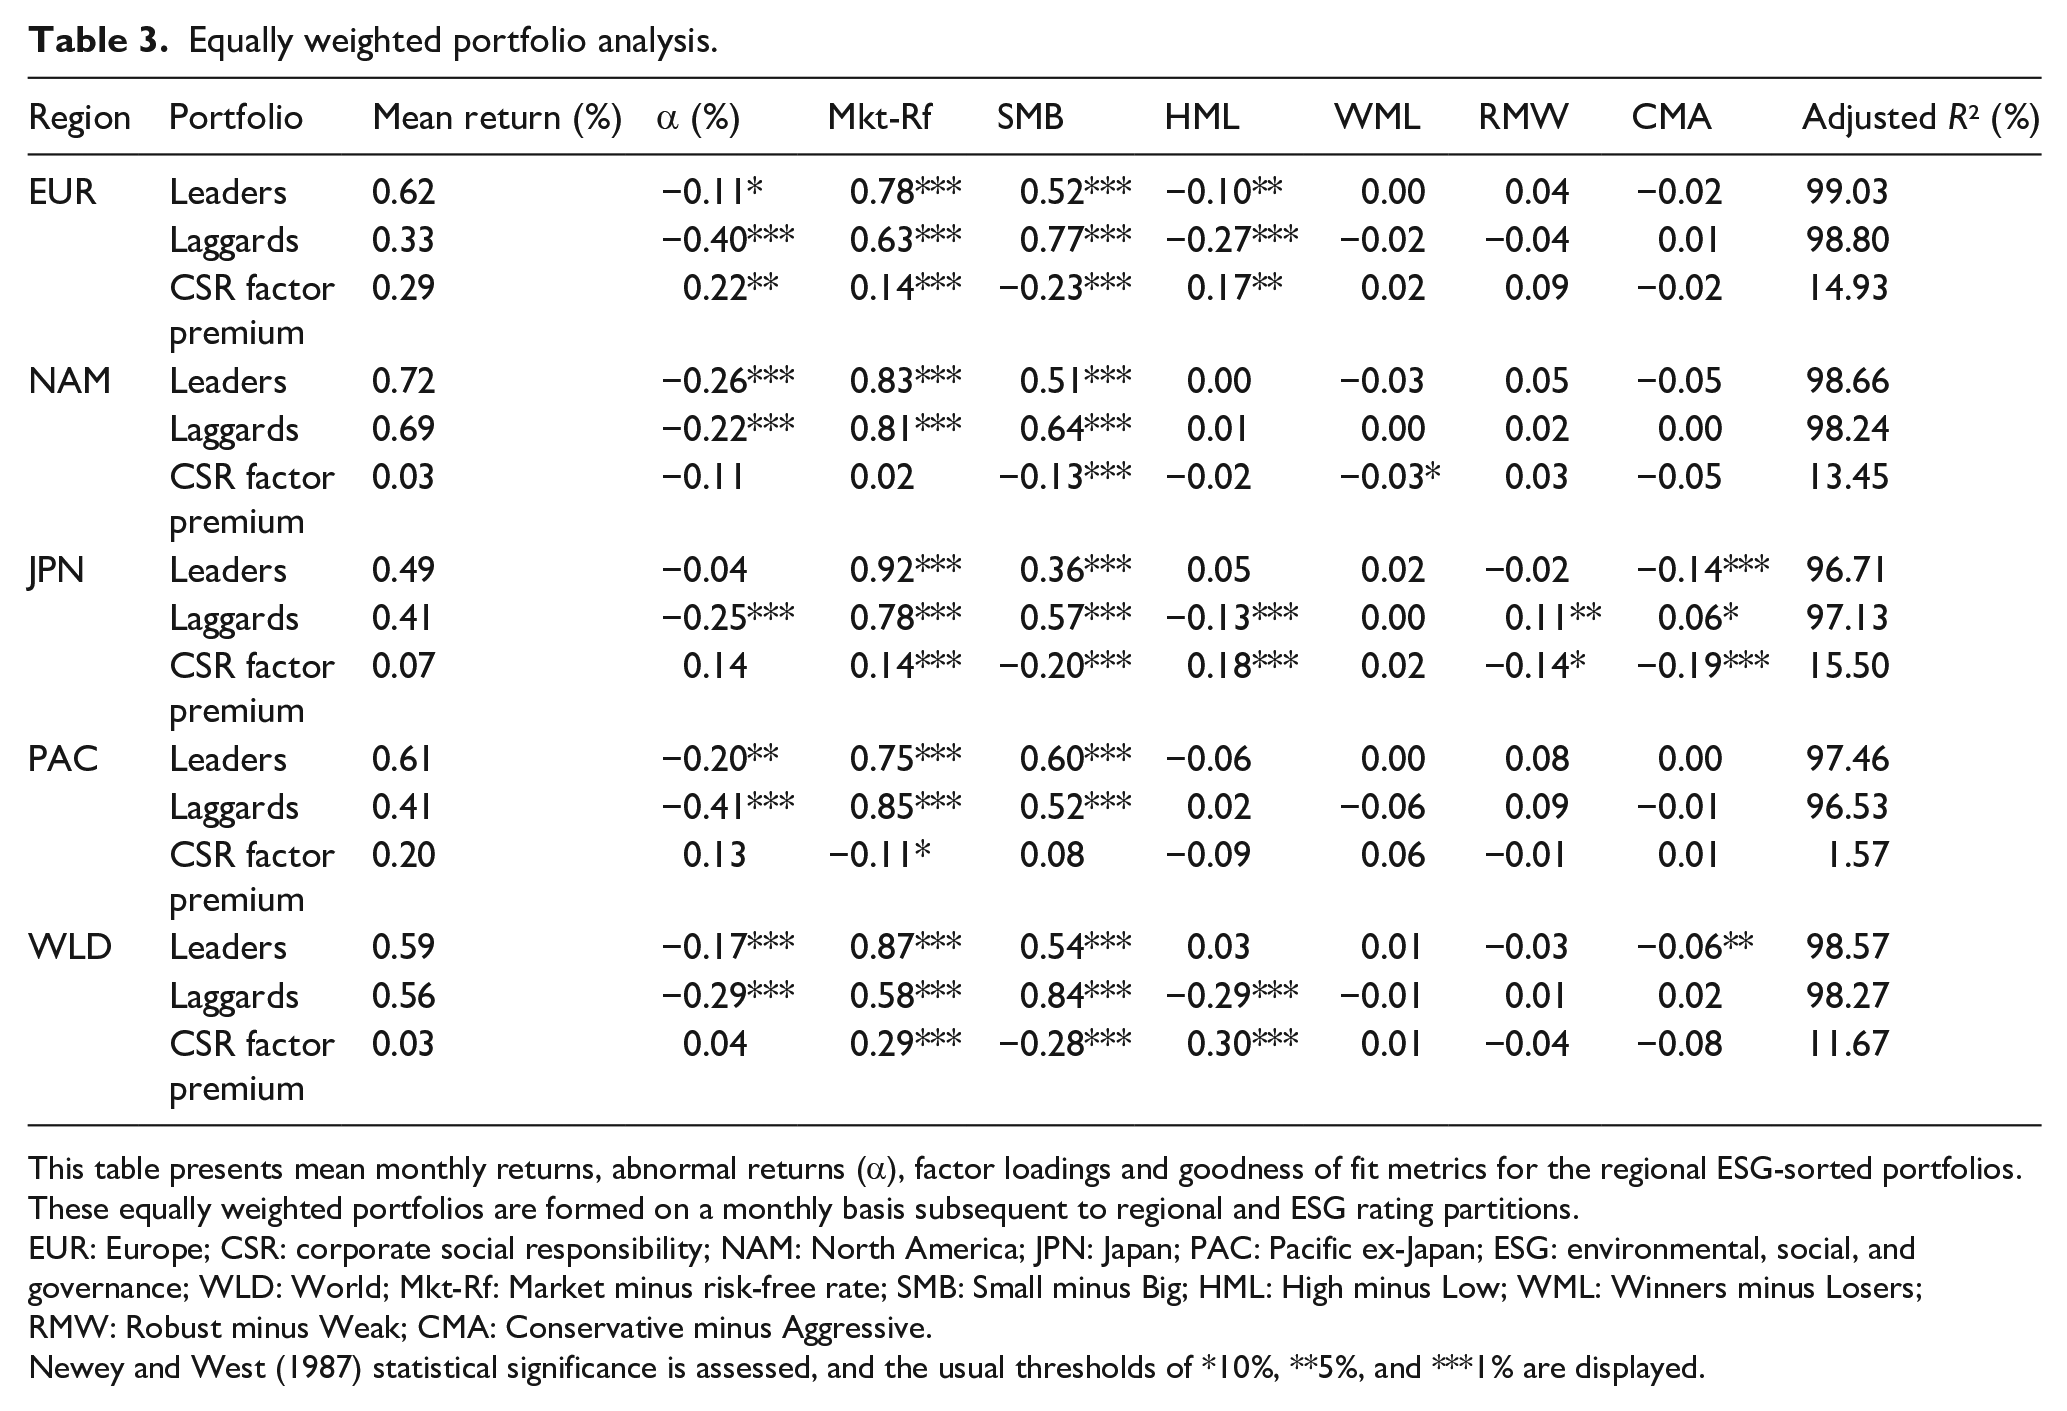
This table presents mean monthly returns, abnormal returns (α), factor loadings and goodness of fit metrics for the regional ESG-sorted portfolios. These equally weighted portfolios are formed on a monthly basis subsequent to regional and ESG rating partitions.
EUR: Europe; CSR: corporate social responsibility; NAM: North America; JPN: Japan; PAC: Pacific ex-Japan; ESG: environmental, social, and governance; WLD: World; Mkt-Rf: Market minus risk-free rate; SMB: Small minus Big; HML: High minus Low; WML: Winners minus Losers; RMW: Robust minus Weak; CMA: Conservative minus Aggressive.
Newey and West (1987) statistical significance is assessed, and the usual thresholds of *10%, **5%, and ***1% are displayed.
Overall, the long-only portfolios mainly display negative abnormal returns using Carhart (1997) and Fama and French (2015) factors. Focusing on the long-short portfolios, we obtain a significantly large and positive abnormal return through CSR in Europe (0.22% monthly or 2.67% annually). Although Leaders display abnormal returns superior to Laggards in the Pacific region and the developed market universes, CSR factor premiums are positive but not statistically significant at the 10% threshold. Although not statistically significant, North America is the only region where Leaders display significantly lower abnormal returns. Overall, the evidence suggests that portfolios with higher CSR ratings often earn superior or equal abnormal returns compared to low CSR portfolios. These findings confirm those of Statman and Glushkov (2009) and Khan (2019) and contrast with those reported by Dorfleitner et al. (2020) and Cakici and Zaremba (2022). Another interesting finding is that the extent of abnormal returns displayed by CSR-leading and -lagging portfolios appears to be region-specific. In Europe, where the share of SRI investors has been the highest over the sampled period (Ferrat et al., 2022c), the abnormal returns related to CSR are positive and statistically significant. In contrast, they appear not statistically significant in Japan, the region with the lowest share of SRI assets (GSIA, 2018).
SRI is most often undertaken by investment professionals, who are unlikely to weigh stocks equally within a portfolio. Indeed, this weighting scheme would (1) expose them to a large unintentional bias toward stocks of small market capitalization and (2) require intensive trading of some highly illiquid stocks (Falkenstein, 1996). Hence, we extend our examination in a “more realistic” setting, where portfolio holdings are weighted relative to their market capitalization. The analysis of market capitalization-weighted portfolios and obtained estimates are reported in Table 4. As suggested by the goodness of fit statistics, Carhart (1997) and Fama and French (2015) factors explain a significant proportion of variance in our portfolio returns. Albeit the significance levels in some regions, the Leaders portfolios seem to underperform the Laggards ones, and abnormal return estimates of the CSR factor premium appear negative. As obtained in North America, the estimates we present suggest that these abnormal returns may be as large as −0.30% monthly (or −3.54% annually). These findings are consistent with those reported by Lee and Faff (2009), Humphrey and Tan (2014), Dorfleitner et al. (2020), and Cakici and Zaremba (2022) and confirm the theoretical intuitions of Heinkel et al. (2001). However, this negative CSR factor premium obtained using market capitalization weightings contrasts with the one uncovered in the studies of Derwall et al. (2005) and Kempf and Osthoff (2007).
Market capitalization weighted portfolio analysis.
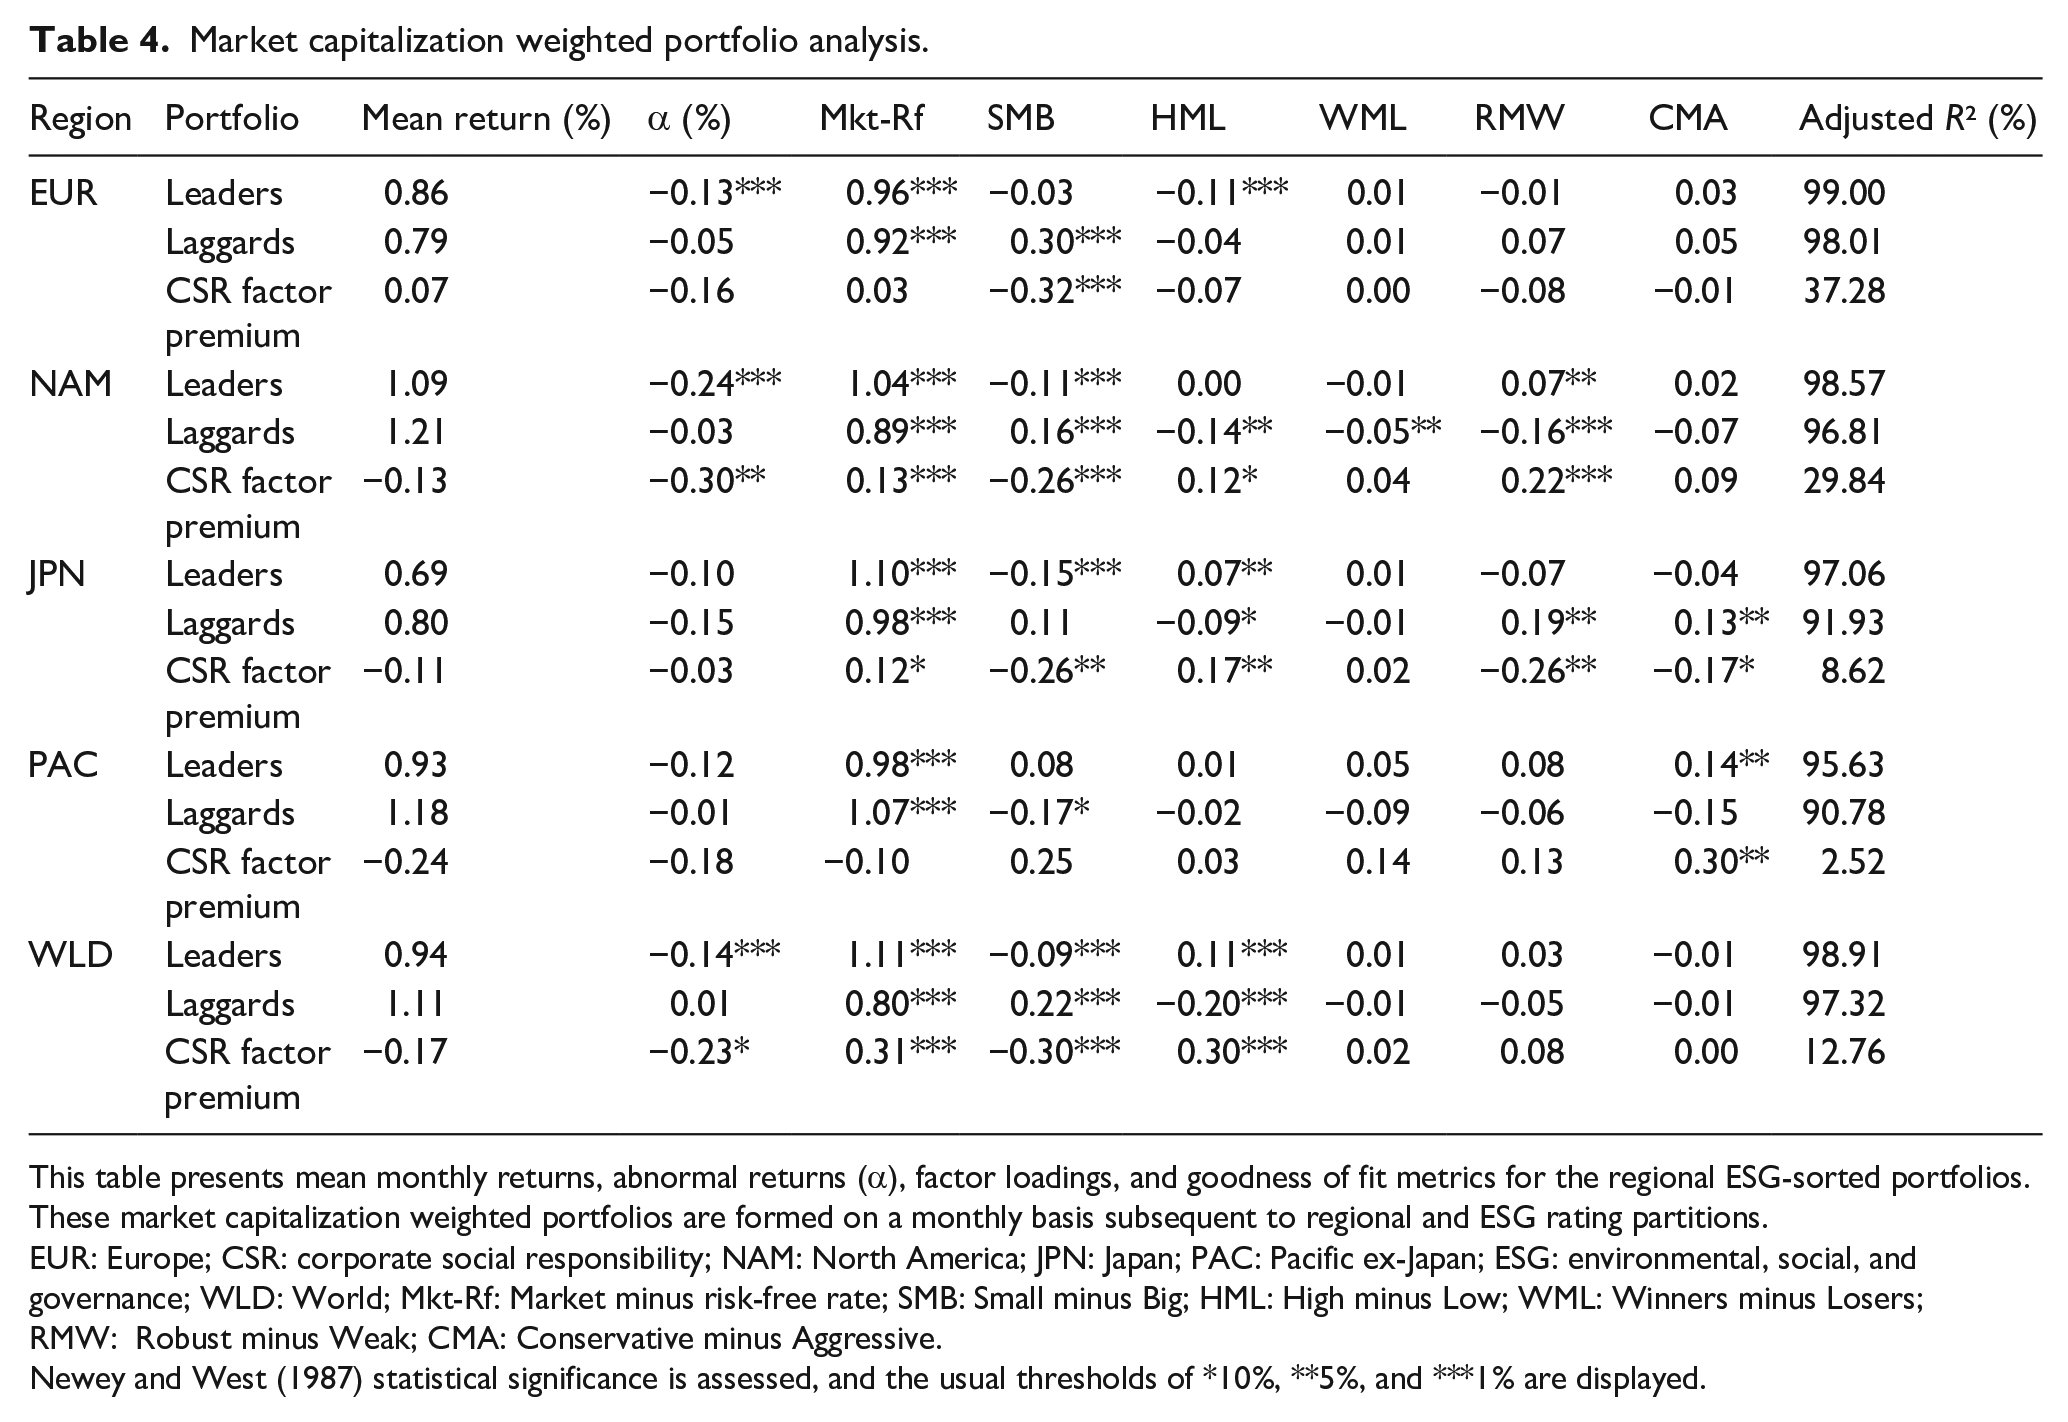
This table presents mean monthly returns, abnormal returns (α), factor loadings, and goodness of fit metrics for the regional ESG-sorted portfolios. These market capitalization weighted portfolios are formed on a monthly basis subsequent to regional and ESG rating partitions.
EUR: Europe; CSR: corporate social responsibility; NAM: North America; JPN: Japan; PAC: Pacific ex-Japan; ESG: environmental, social, and governance; WLD: World; Mkt-Rf: Market minus risk-free rate; SMB: Small minus Big; HML: High minus Low; WML: Winners minus Losers; RMW: Robust minus Weak; CMA: Conservative minus Aggressive.
Newey and West (1987) statistical significance is assessed, and the usual thresholds of *10%, **5%, and ***1% are displayed.
The size effect
Consistent with the studies by Statman and Glushkov (2009), Dorfleitner et al. (2020), Cakici and Zaremba (2022), and Ferrat et al. (2022a), we contend that the contrasting results presented in Tables 3 and 4 emphasize the impact of the weighting scheme utilized on the nature of the CSR factor premium. On one hand, equally weighted portfolios, which favor smaller stocks, hint at a non-negative CSR factor premium. On the other hand, the market capitalization-weighted portfolios, where returns are mainly driven by larger corporations, advocate for a non-positive one. These contradictory findings contingent upon weighting schemes naturally raise the question of whether size effects play a moderating role in the sign of the CSR factor premium. This contention is supported by the contrasting SMB factor loadings of portfolios obtained in Tables 3 and 4. To further investigate this issue, we determined the distribution of market capitalizations per ESG category, for example, Leaders and Laggards. Securities with market values below the 30th percentile of each ESG category were classified as Small, while those above the 70th percentile were classified as Large. These breakpoints are consistent with conventional academic practice (Fama & French, 2015) and contrast with the median approach employed by Dorfleitner et al. (2020). Assets held within these size-based universes were then market capitalization-weighted and rebalanced monthly. Since smaller corporations exhibit lower liquidity, we increased monthly rebalancing transaction costs from 50 to 100 basis points for small market capitalization portfolios. The summary of this analysis is reported in Tables 5 and 6, which present, respectively, the estimates obtained for Small and Large partitions.
Market capitalization-weighted portfolio analysis of small stocks.
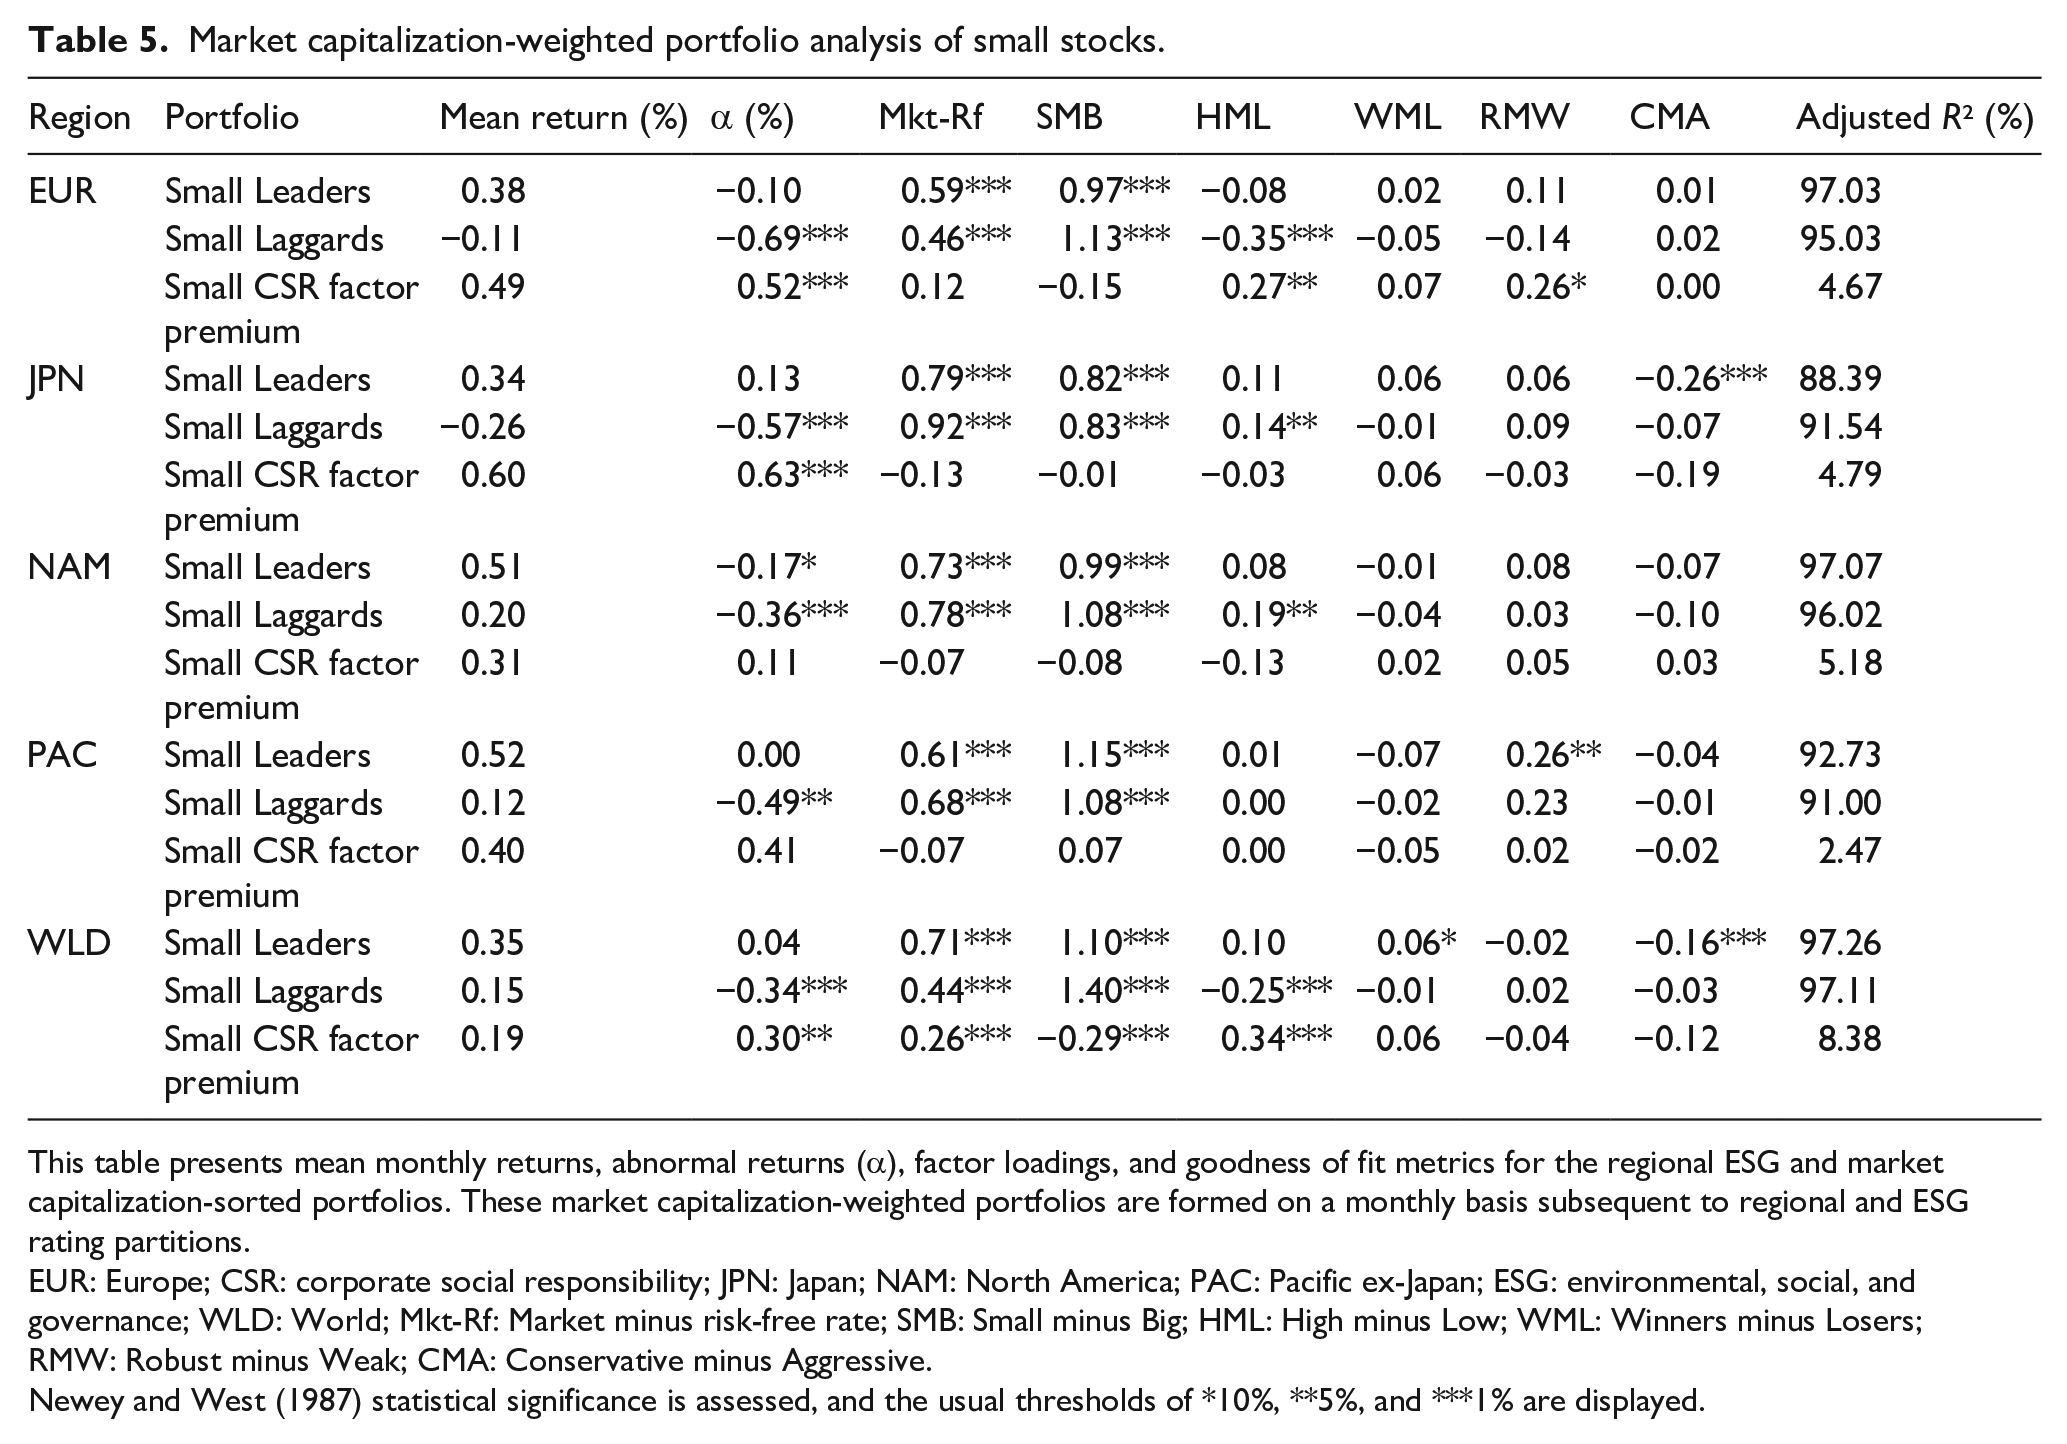
This table presents mean monthly returns, abnormal returns (α), factor loadings, and goodness of fit metrics for the regional ESG and market capitalization-sorted portfolios. These market capitalization-weighted portfolios are formed on a monthly basis subsequent to regional and ESG rating partitions.
EUR: Europe; CSR: corporate social responsibility; JPN: Japan; NAM: North America; PAC: Pacific ex-Japan; ESG: environmental, social, and governance; WLD: World; Mkt-Rf: Market minus risk-free rate; SMB: Small minus Big; HML: High minus Low; WML: Winners minus Losers; RMW: Robust minus Weak; CMA: Conservative minus Aggressive.
Newey and West (1987) statistical significance is assessed, and the usual thresholds of *10%, **5%, and ***1% are displayed.
Market capitalization-weighted portfolio analysis of large stocks.
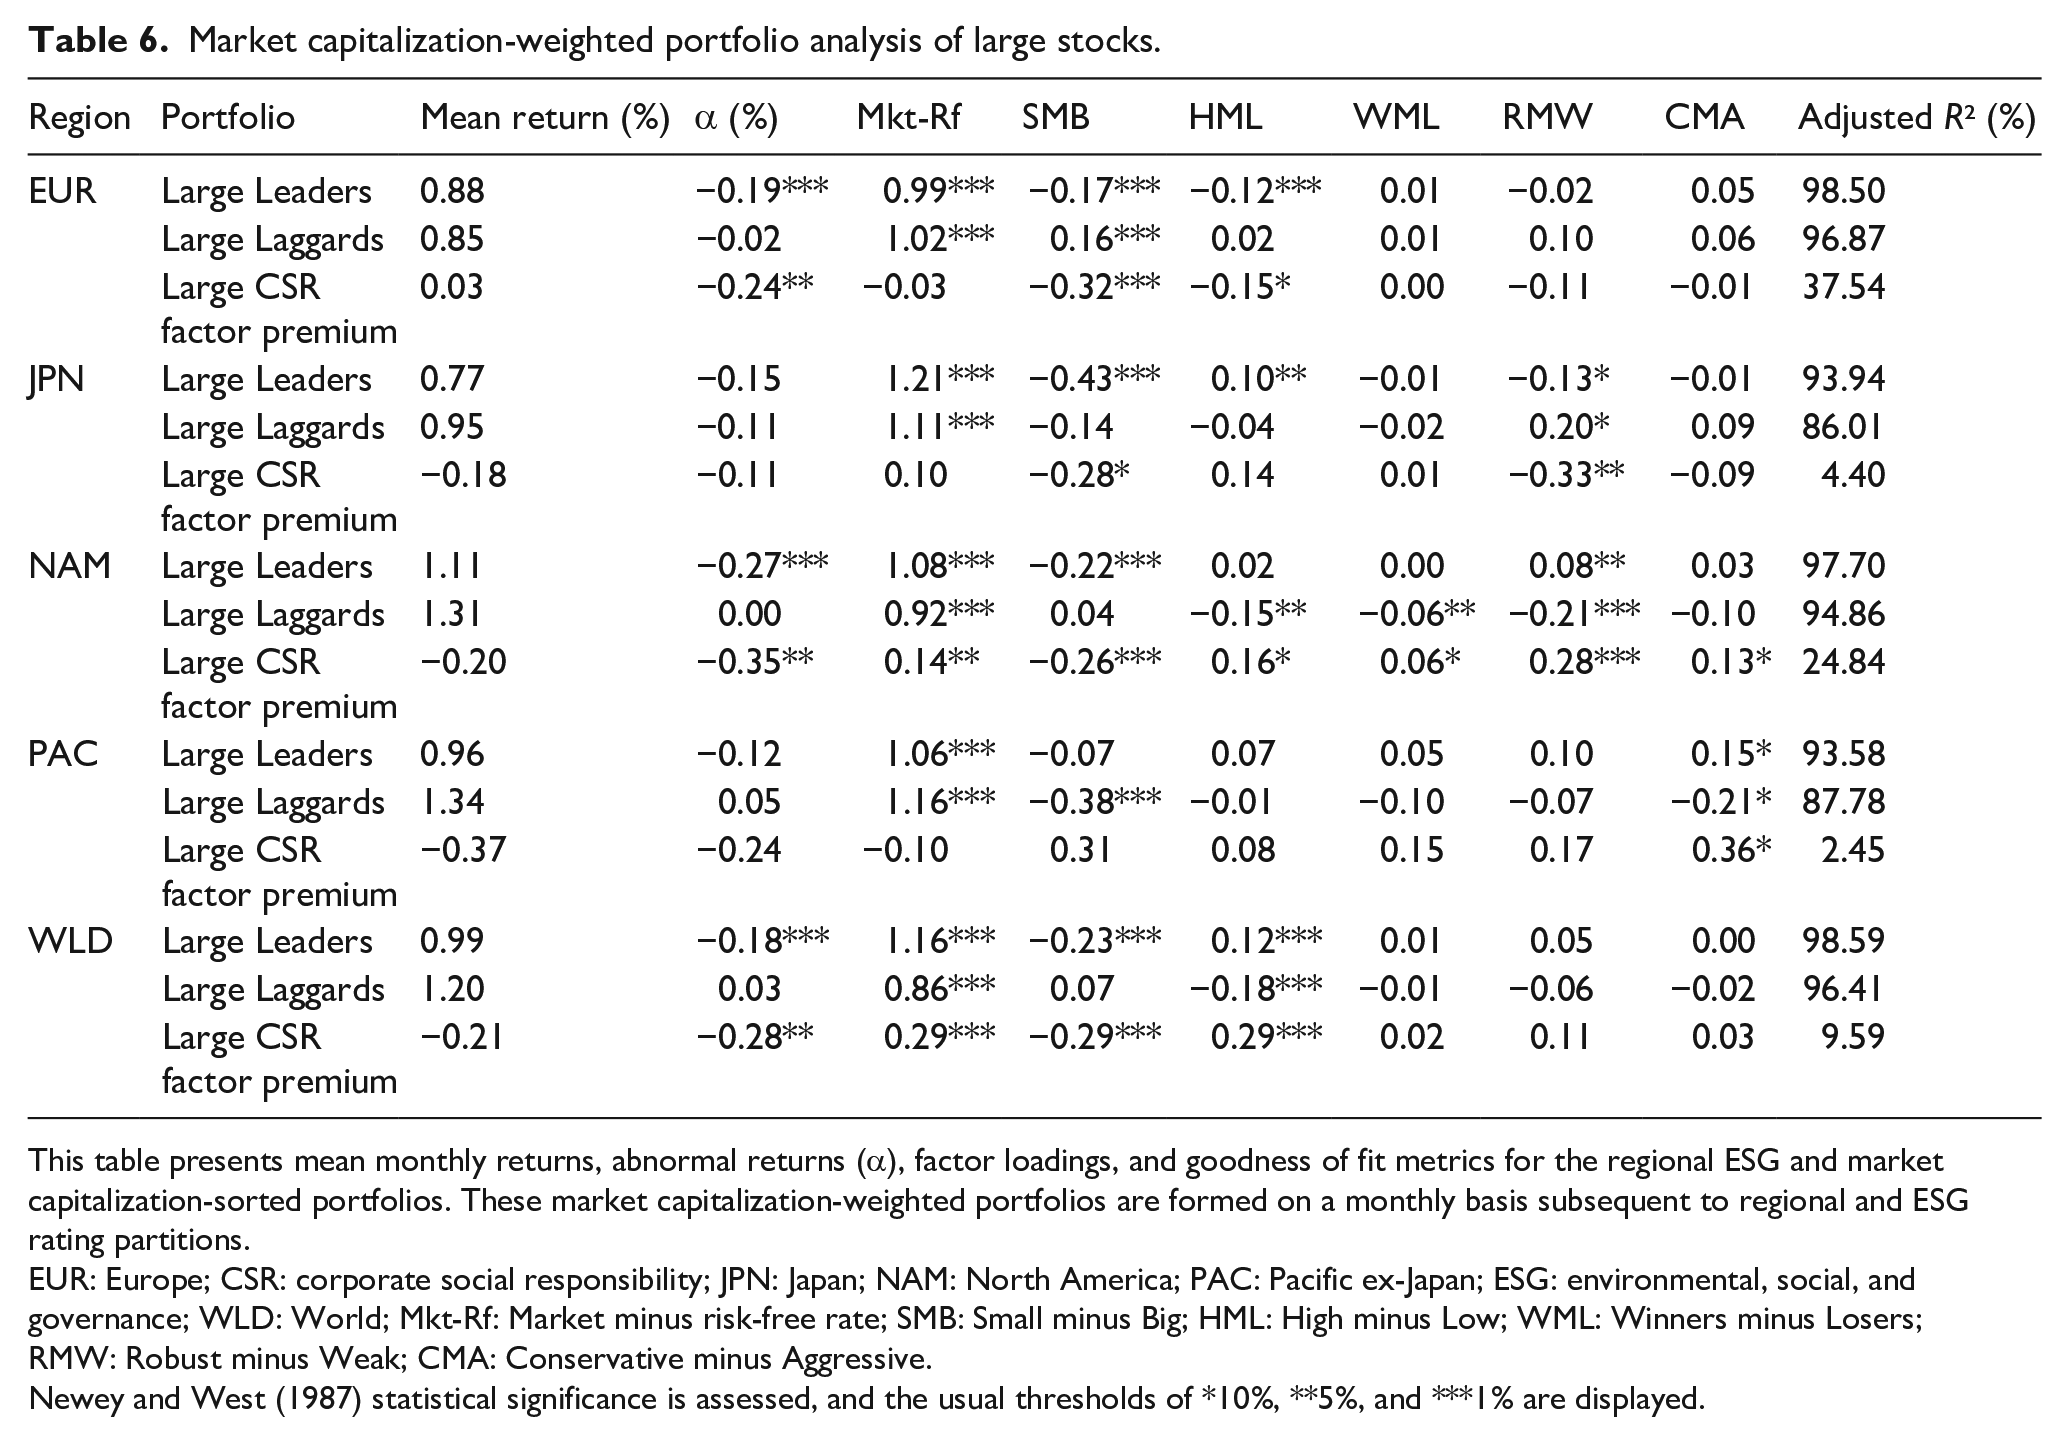
This table presents mean monthly returns, abnormal returns (α), factor loadings, and goodness of fit metrics for the regional ESG and market capitalization-sorted portfolios. These market capitalization-weighted portfolios are formed on a monthly basis subsequent to regional and ESG rating partitions.
EUR: Europe; CSR: corporate social responsibility; JPN: Japan; NAM: North America; PAC: Pacific ex-Japan; ESG: environmental, social, and governance; WLD: World; Mkt-Rf: Market minus risk-free rate; SMB: Small minus Big; HML: High minus Low; WML: Winners minus Losers; RMW: Robust minus Weak; CMA: Conservative minus Aggressive.
Newey and West (1987) statistical significance is assessed, and the usual thresholds of *10%, **5%, and ***1% are displayed.
Consistent with estimates presented in Table 3, smaller-sized Leaders display superior abnormal returns compared to smaller-sized Laggards. Hence, abnormal returns related to the CSR factor premium appear mainly positive and statistically significant and range from 0.11% to 0.63% monthly (or from 1.33% to 7.83% annually). These results are primarily driven by the highly negative abnormal returns of Laggards portfolios. Consistent with estimates reported in Table 4, we further observe that large Leaders underperform large Laggards. Although not always statistically significant, the abnormal returns associated to the CSR factor premium are negative, and estimates range between −0.11% and −0.35% monthly (or −1.31% and −4.12% annually). We thus argue that concerns of SRI portfolios building their outperformance by relying on small stocks appears to be plausible (Bauer et al., 2005; Gregory et al., 1997). Overall, the findings presented in Tables 5 and 6 contrast with those of Dorfleitner et al. (2020) and Cakici and Zaremba (2022). This divergence could be explained by ESG rating sources and cut-offs utilized to form the Leaders and Laggards portfolios.
For robustness purposes, we employ an alternative modeling approach to investigate further the moderating impact of corporation size on the CSR factor premium (Ferrat, 2021; Friede et al., 2015). In the asset pricing literature, scholars have suggested that stock prices are predictable, to some extent, using financial variables (Campbell & Shiller, 1988; Fama & French, 1988). Hence, we follow this trend and mobilize a model consistent with arbitrage pricing theory to explain stock returns (Roll & Ross, 1980). Consistent with the studies by Bali et al. (2016, pp. 89–100) and Fama and French (2015), we suggest that monthly stock returns may be explained by corporations’ exposure to the market factor (Lintner, 1965; Mossin, 1966; Sharpe, 1964), the size factor (Banz, 1981), the price to book factor (Fama & French, 1992), previous price momentum (Jegadeesh & Titman, 1993), as well as the investment and profitability factors (Fama & French, 2015). As described in Model (1), these explanatory variables are included in our baseline model. As illustrated by Model (2), we adjoin firms’ ESG ratings to uncover the relationship between CSP and CFP at the individual stock level (Galema et al., 2008). To test the relevance of the size effect moderation, we also employ an interaction term between the ESG rating and the size bucket. This most advanced model is described in Model (3). Consistent with the most recent models (Zaremba, 2019), country, firm-month, and industry effects are also accounted for. Overall, the models are performed in a stepwise manner and fully specified as follows 7
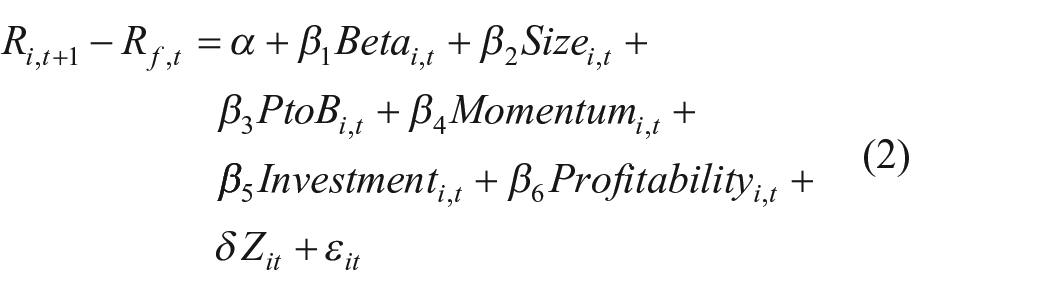
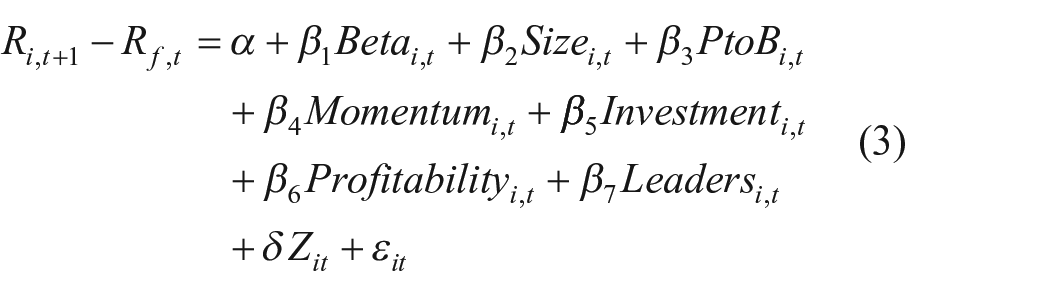
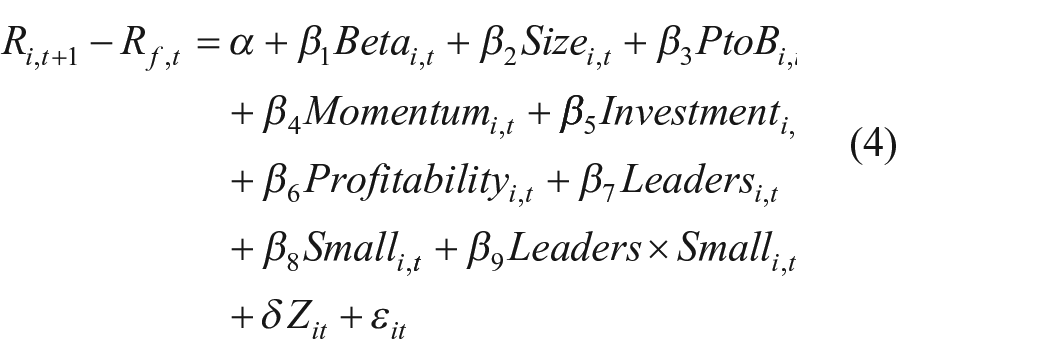
where i denotes the individual stock and t the month;
Using a sample of 180,608 firm-month records, the three models are estimated through a fixed-effect panel regression between 2007 and 2019. According to our calculations, none of the explanatory variables introduced display strong correlations, and variance inflation factors are under the conventional threshold. Thus, we suggest that multicollinearity concerns seem absent from our intended modeling. Estimates and associated p-values obtained for Models (1) to (3) are displayed in Table 7. Relatively to our baseline, for example, Model (1), the
Panel regression modeling.
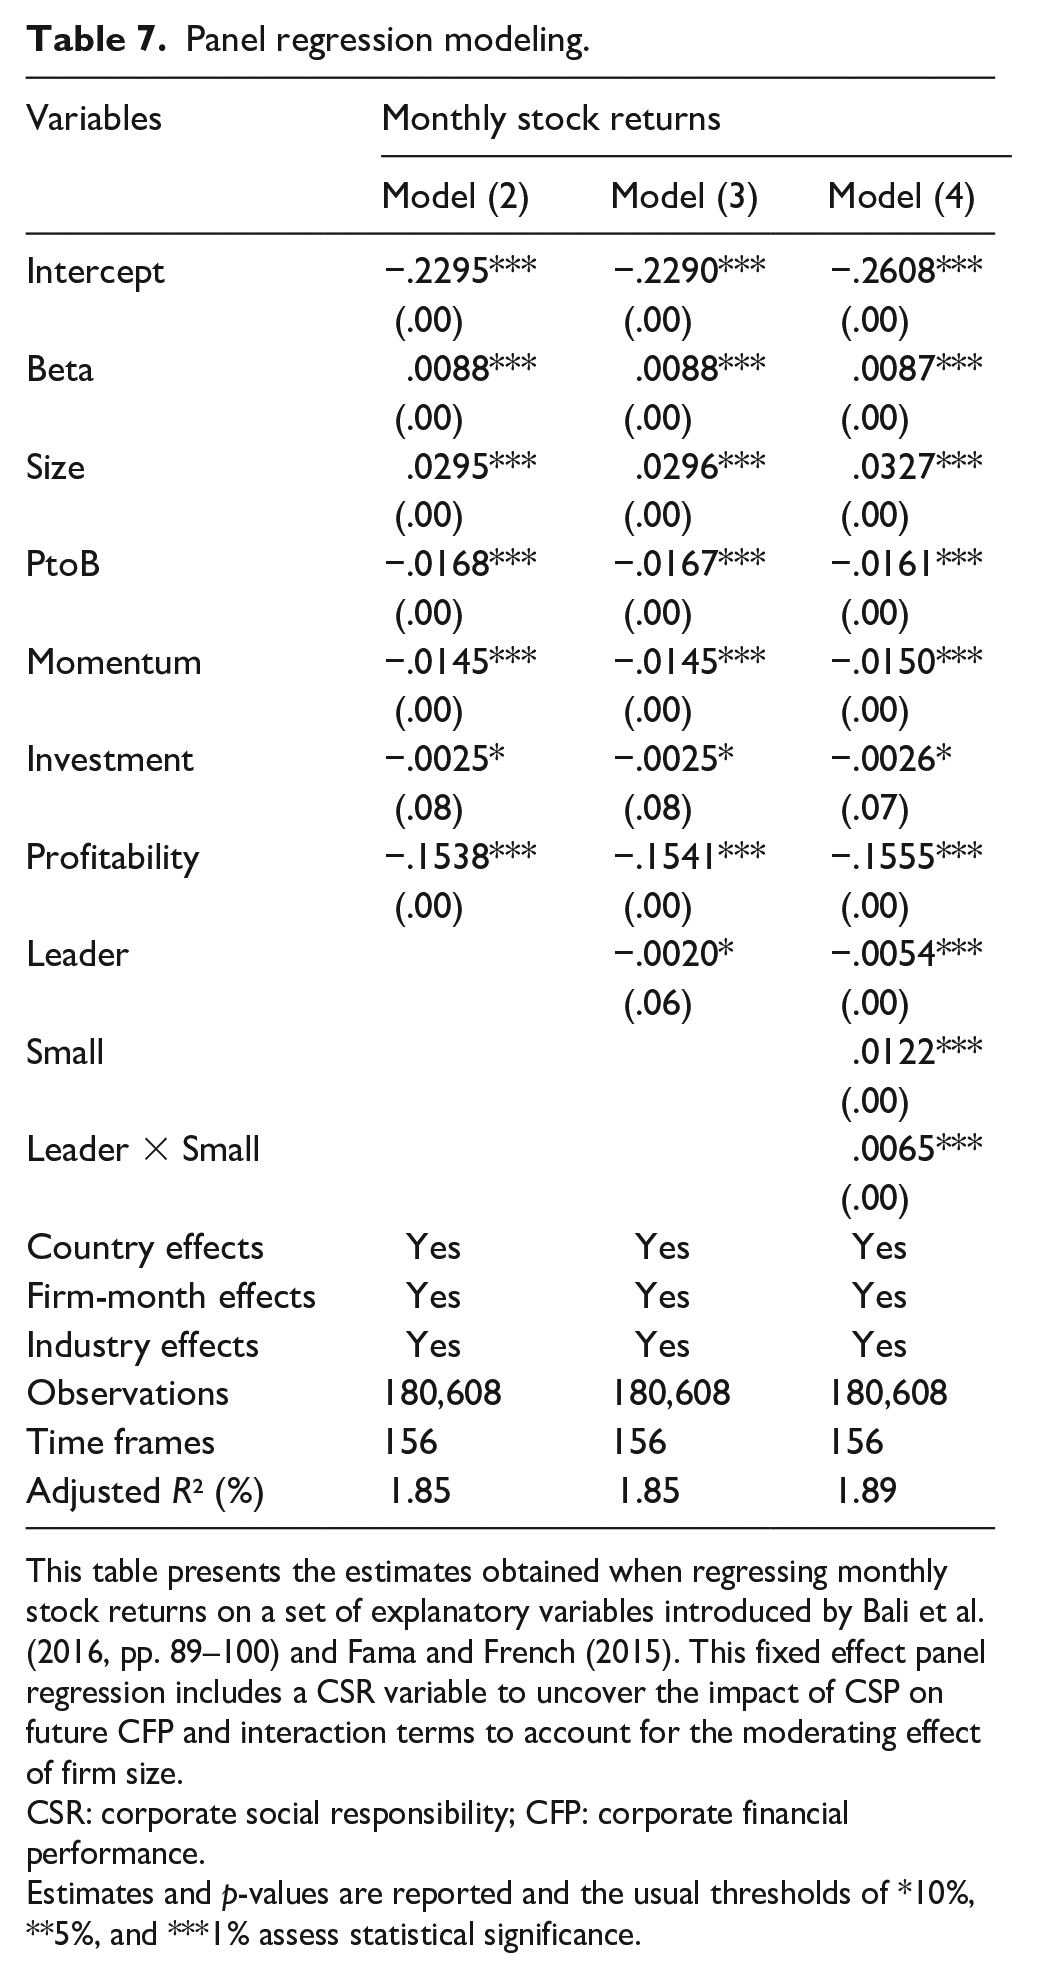
This table presents the estimates obtained when regressing monthly stock returns on a set of explanatory variables introduced by Bali et al. (2016, pp. 89–100) and Fama and French (2015). This fixed effect panel regression includes a CSR variable to uncover the impact of CSP on future CFP and interaction terms to account for the moderating effect of firm size.
CSR: corporate social responsibility; CFP: corporate financial performance.
Estimates and p-values are reported and the usual thresholds of *10%, **5%, and ***1% assess statistical significance.
As presented in Model (2), the spread in monthly returns between Leaders and Laggards stocks is negative and weakly statistically significant (p-value < .10). Ceteris paribus, Leaders display stock returns reduced by −0.20% monthly (or −2.37% annually). Although not accounting for size effects, Model (2) supports the underperformance of CSR-leading stocks presented in Table 4. Given the presence of an interaction term in Model (3), the findings should be carefully interpreted. While the difference in returns between Large Leaders and Large Laggards is measured through the estimate related to the variable
Discussion
In our theoretical framework, we introduced two opposing instrumental theories relating to the CSP–CFP relationship. Given the relevance of CSR content to market participants (Lackmann et al., 2012), we suggested that researchers observe distinct financial returns between CSR-leading and -lagging corporations. We relied on intuitions related to market equilibrium settings to determine the sign of the CSP–CFP relationship for stock returns. Indeed, we argued that the alteration in risk-sharing opportunities (Heinkel et al., 2001; Pástor et al., 2021; Pedersen et al., 2021) should yield a negative CSR factor premium (Hypothesis H1). As displayed by our empirical findings in Tables 3 and 4, we uncover a non-negative CSR factor premium when equally weighting stocks and a non-positive one when employing a market capitalization weighting scheme. Hence, the equally weighted results suggest that the pool of high CSR firms is equivalent to low CSR in terms of risk-adjusted returns. This result supports the contentions of stakeholder theory proponents (Fatemi et al., 2015; Luo & Bhattacharya, 2006; Porter & Van der Linde, 1995). However, the non-negative CSR factor premium obtained when employing market capitalization weights is consistent with the alteration of risk-sharing opportunities due to the presence of ethical investors (Heinkel et al., 2001; Pástor et al., 2021; Pedersen et al., 2021). These conflicting findings obtained with differing methodologies are consistent with the mixed conclusions shared by Friede et al. (2015) and empirical results reported by Statman and Glushkov (2009), Dorfleitner et al. (2020) and Cakici and Zaremba (2022). These uncovered results emphasize the relevance of size effects in the CSP–CFP relationship. Therefore, we argue that the inconclusive empirical literature in the field may be partly due to inconsistencies in the weighting methods employed.
In line with previous works of Luo and Bhattacharya (2006) and Dorfleitner et al. (2020), we hypothesize a moderated CSP–CFP relationship to investigate this issue further. We contend that previous studies have expected a direct link between CSP and CFP and thus misspecified this relationship (Orlitzky et al., 2003). Consistent with expectations in the management field (Cordeiro & Tewari, 2015; Darnall et al., 2010; Wickert et al., 2016), the framework we introduce sets a theoretical foundation in support of corporation size as a relevant moderator. Specifically, institutional investors should hold lower proportions of smaller corporations’ stocks (Falkenstein, 1996), which constrains arbitrage activity (Shleifer & Vishny, 1997) and leads to a neglect effect (Arbel et al., 1983). We thus argue that the CSP–CFP relationship should be unaltered by ethical investors’ preferences and not yet reflect the novel market equilibrium for smaller firms due to lower market efficiency and investor attention toward CSR (Hypothesis H2).
To verify this hypothesis, we further examined risk-adjusted returns derived by portfolios with distinct levels of CSP and contingent upon market capitalization groupings. Based on our results, assertions that the overperformance of SRI funds may be generated by exposure to the size premium seem confirmed (Bauer et al., 2005; Gregory et al., 1997). In Tables 5 and 6, we report a positive CSR factor premium in the small corporation partition and a neutral or even negative one for larger companies. Thus, the conflicting sign for the CSR factor premium in equal and market capitalization-weighted settings appears due to size effects. To fully confirm the moderating effect of firm size, we further employed an alternative modeling approach in line with arbitrage pricing theory (Roll & Ross, 1980). As presented in Table 7, the CSR factor premium is significantly negative in the Large firm partition and positive for the stock of Small firms. As suggested by the significance of the interaction term, size effects have moderated the CSR factor premium between 2007 and 2019 in the developed equity markets.
Overall, we contend that the CSR factor premium has become common knowledge and thus was fully integrated into share prices of larger firms. For these corporations, higher public scrutiny of CSR (Reverte, 2009) and the intense participation of institutional investors in high CSR stocks (GSIA, 2018) has probably eliminated the anomaly. This contention is consistent with recent empirical studies documenting the reduced profitability of well-known anomalies (Zaremba et al., 2020). Furthermore, the price pressure of SRI funds has been so intense that the returns of large high CSP firms may be pushed below those of low CSP counterparts. This phenomenon is especially visible in Europe and North America, where SRI accounted for half and a quarter of professionally managed assets in the last decade (Ferrat et al., 2022c). Consistent with the contentions of Heinkel et al. (2001), Pástor et al. (2021), and Pedersen et al. (2021), we thus contend that the inflated demand for the stock of large high CSP companies has driven the CSP–CFP relationship neutral or even negative over time. Thus, Large firms now reflect the new market equilibrium. In contrast, the constraints of institutional investors render the price of smaller stocks less efficient, which allows anomalies to persist. Indeed, we observe a persistent and significantly positive CSR factor premium in the small firm partition, where market efficiency and investor attention for CSR are at their lowest. We thus contend that while the developed equity markets have fully integrated the factor premium for sizable corporations, the learning effect for smaller firms has not yet taken place, where they display former pricing conditions.
While the theoretical foundation employed to justify our results appears rather sound, the diverging results presented by Dorfleitner et al. (2020) and Cakici and Zaremba (2022) suggest that conclusions appear to be contingent upon the source of CSR ratings. Indeed, third-party rating agencies collect, analyze, and summarize CSR content to form an opinion regarding an issuer’s level of CSP. Given the significant level of information asymmetry exhibited (Chiang & Venkatesh, 1988), distinguishing high and low CSP issuers in the small corporation partition is undoubtedly complex. Indeed, smaller corporations have been shown to disclose significantly less than their larger counterparts (Barbu et al., 2022). Hence, we argue that the divergence of CSR ratings across rating agencies reported by scholars (Berg et al., 2022) could be mainly present for smaller corporations. This contention could explain the contrasting size effect we uncover.
Conclusion
As of 2018, US$30 trillion, or one-third of developed countries’ professionally managed assets employed to some extent CSR in their investment decisions (GSIA, 2018). Accordingly, academic research in this field has been burgeoning, and scholars have examined whether a CSR factor premium has emerged in the equity markets. While the US markets have been extensively studied, a limited number of studies focus on the other regional markets. In this spirit, our study seeks to analyze the nature of the CSR factor premium within the international equity markets. We contribute to the growing literature on CSR by contending that the direct CSP–CFP relationship is a common misconception, and we highlight the moderating role of size effects. The novelty of our study resides in: (1) providing a theoretical background for the emergence of a CSR factor premium and the associated moderator, (2) examining the factor premium across the main developed country regions, (3) shedding light on size effects as a relevant moderator, and (4) confirming the moderation using both portfolio and panel-based regression models. Our recommendations for investors can be summarized as follows. First, the pool of high CSR stocks is at least equivalent to the pool formed by their low CSR counterparts. Hence, investing responsibly can be environmentally and socially virtuous as well as financially rewarding. Second, the weighting scheme employed by SRI portfolios deserves greater attention. While large high CSR corporations exhibit lower stock returns than large low CSR ones, significant outperformance can be achieved using CSR ratings in the segmented smaller corporation partition. Thus, reducing minimal market capitalization thresholds for CSP-leading firms may be a source of additional value.
However, our study is not exempt from flaws, which constitute avenues for future research. Our findings contrast with those reported by the studies of Dorfleitner et al. (2020) and Cakici and Zaremba (2022), which impairs the reliability of the inferences made regarding the CSR factor premium. We contend that these diverging results may be explained by numerous methodological discrepancies as well as data sources (Berg et al., 2022; Friede et al., 2015; Orlitzky et al., 2003). Among these reasons can be mentioned partition cut-offs, such as those employed to classify high and low CSR stocks or those utilized to examine the relevance of size effects. While we employ the widely accepted cut-offs of Fama and French (2015), Dorfleitner et al. (2020) exploit the top and bottom deciles of CSR ratings and the median value for market capitalization partitions. We thus encourage future research to discuss methodological choices to enhance the comprehension of their results. A second aspect explaining our contrasting findings is the source of CSR ratings. Indeed, recent studies have exerted that CSR ratings significantly diverge across third-party rating agencies (Gibson et al., 2021). By order of importance, Berg et al. (2022) attribute this divergence to (1) measurement, for example, the evaluation of CSP, (2) scope, for example, the issues evaluated within the CSR rating, and (3) weights, for example, the relative importance granted to CSR issues in the aggregate rating. Hence, we urge future research to triangulate the moderating effect of size on the CSR factor premium with multiple third-party rating agencies.
Footnotes
Acknowledgements
We are grateful to MSCI ESG Research LLC, who have provided the ESG scores, and OFI Asset Management, for granting us access to the database. We thank Ghilas Ferrat for his diligent research assistance and are deeply grateful to Juan Macias, editor-in-chief, and Wolfgang Drobetz, associate editor, as well as two anonymous reviewers for their constructive comments.
Disclosures
All research disclosed in this article should not be considered as investment advice regarding securities in the financial markets. There is no guarantee that the forecasts, made using historical data, will continue to persist. MSCI ESG Research LLC and OFI Asset Management (the Parties) do not guarantee the accuracy, adequacy, or completeness of any information disclosed in this research article. In no event shall the Parties have any liability regarding any investments made using the results of this study. The views expressed in this research article are of the authors alone.
Declaration of conflicting interests
The author(s) declared no potential conflicts of interest with respect to the research, authorship, and/or publication of this article.
Funding
The author(s) disclosed receipt of the following financial support for the research, authorship, and/or publication of this article: This work was supported financially by OFI Asset Management under a doctoral fellowship [CIFRE 2018/1606].