
Abstract
This study contributes to the emerging literature on board co-option by examining how and to what extent co-opted directors influence managers’ attitudes about earnings management. We find robust evidence that co-option mitigates both real activities and accrual-based earnings management. Our findings support the view that higher co-option reduces managerial short-termism because it enhances managers’ job security as co-opted directors are known to be less likely to remove managers from office. Our results are robust to different measures of both co-option and earnings management, and they continue to hold after accounting for endogeneity and selection concerns. Finally, we provide additional evidence showing that a higher degree of co-option lowers the likelihood of the chief executive officer (CEO) being forcefully removed from the office for managing earnings in the previous year.
Introduction
Corporate directors fulfill their fiduciary responsibilities by monitoring managers and alleviating the agency conflicts that the separation of ownership and control elicits. The literature broadly suggests that board independence is necessary for effective supervision of corporate behavior since outside directors are more objective (L. Cohen et al., 2012). However, Coles et al. (2014) report that the chief executive officer (CEO) can co-opt the board when new directors are appointed, thereby reducing the monitoring efficacy of the board as a whole. They document that the sensitivity of CEO turnover to firm performance diminishes with co-option because co-opted directors insulate managers from efficiency pressures given their loyalty to the chief executive involved in their appointment. This study extends the literature on board co-option by exploring its impact on earnings management.
Co-option gauges the fraction of directors that is appointed after the incumbent CEO assumes office, and several recent studies document strong evidence of reduced board oversight as a corollary of co-option. 1 For instance, Wilson (2018) reports that the number of board meetings held decreases as co-option increases. Withisuphakorn and Jiraporn (2017) suggest that because co-opted directors impose less stringent supervision, the CEO is able to exercise a great deal of latitude in running the firm. Coles et al. (2014) find that CEOs with a higher fraction of co-opted directors receive higher pay, invest in noneconomic projects, and are less likely to be removed from office due to poor performance. These executives also take more risks (Jiraporn et al., 2017) and retain more free cash flows (Jiraporn & Lee, 2018) than their peers. Congruently, Harris, Glegg, and Buckley (2019) suggest co-option reduces firm productivity as managers over-invest in inefficient research and development (R&D).
From a unique perspective, however, Coles et al. (2014) propose that co-option could be beneficial as CEOs who are protected from dismissal threats may invest in risky projects with long-term payoffs. Building on this proposition, Chintrakarn et al. (2016) argue that co-option mitigates managerial short-termism (i.e., myopia) because it reduces the probability of executive removal and so motivates managers to make long-term investments as they are likely to stay in office to reap the benefits. CEOs tend to behave myopically when they are under market pressure (Stein, 1989); they tend to cut or delay long-term investments to deliver short-term performance (Chan et al., 2015; Graham et al., 2005), especially if their incentives become more short-term (Ladika & Sautner, 2020). Hence, co-option may curtail short-termist behavior because it insulates managers from dismissal risk and affords them more motivation to invest for the long-term (Chintrakarn et al., 2016). By the same token, Nguyen et al. (2020) document that co-opted boards foster firm innovation because they insulate managers from performance pressures.
Likewise, it is commonly argued that the frequency of corporate disclosure and the pressure from capital markets to meet earnings targets cause managers to engage in earnings management. As a result, managers use discretionary accruals or depart from normal operating activities to manage earnings (Dechow & Dichev, 2002; Roychowdhury, 2006). Financial reports also convey information about firm performance that directly impacts managers’ personal wealth as performance measures are used in their contracting. Cheng et al. (2016) point out that managers engage in earnings management due to career concerns because employment risk is related to short-term performance. Conversely, managers are less likely to manage earnings when they are under contractual protection (Chen, Cheng, et al., 2015), heavily entrenched (Di Meo et al., 2017), and have longer tenure (Ali & Zhang, 2015) because they are under lower pressure to meet short-term goals and, thus have fewer motives to behave myopically.
Our article builds on these two lines of literature by examining the impact of board co-option on earnings management. To the extent that managers with co-opted boards are subject to fewer career concerns than other managers, we theorize that they behave less myopically about managing earnings. We consider both real activities and accrual-based manipulation since Zang (2012), Farooqi et al. (2014), and others suggest that the degree of accounting manipulation depends on how successful managers are in using operational actions to meet their earnings targets. 2 As such, we expect co-option to assuage both real-activities and accrual-based earnings management, suggesting a negative correlation. This predicted relation between board co-option and accrual-based manipulation may, however, be counterbalanced by the increased regulatory scrutiny of financial reports following the enactment of the Sarbanes-Oxley Act (hereafter, SOX). Even so, we expect the impact of co-option on real earnings management to persist since firms switched away from accrual manipulation to real activities manipulation as a result of the heightened scrutiny of accounting practices (e.g., D. A. Cohen et al., 2008; A. Cohen & Zarowin, 2010).
We test these predictions over the 1996–2014 sample period using an unbalanced panel dataset of 18,009 firm-year observations. Pursuant to Coles et al. (2014), we employ two alternative measures of co-option: (1) tenure-weighted co-option, which is the sum of the tenure of co-opted directors divided by the total tenure of all directors and (2) tenure-weighted independent director co-option, which is the sum of the tenure of co-opted independent directors relative to all directors. 3 We examine several traditional measures of both real and accrual-based earnings management found in the literature (e.g., D. A. Cohen et al., 2008; A. Cohen & Zarowin, 2010; Farooqi et al., 2014). Provided that traditional measures have limitations (W. Chen et al., 2017), we also analyze performance-matched measures as these are found to improve upon earlier measures of earnings management (D. A. Cohen et al., 2020; Kothari et al., 2005).
Our empirical results indicate that greater board co-option is associated with significantly lower real activities management, as well as lower accrual-based management. These inverse correlations are robust to alternative measures of co-option as well as alternative measures of both accruals and real activities management. The main findings continue to hold even after controlling for copious factors known in the literature to influence earnings management behavior, as well as after employing an instrumental variable approach to address CEO tenure-related endogeneity concerns. The results are also robust to Heckman’s (1979) two-step procedure, which corrects for potential sample selection bias. We also check the validity of our results by utilizing the Zang (2012) trade-off framework that allows for the substitutive interplay between real activities management and accruals management. Yet, our results continue to hold.
Overall, the negative association between board co-option and earnings management documented in this study supports the view that higher co-option mitigates managerial short-termism because it enhances managers’ job security (see Chintrakarn et al., 2016) as co-opted directors are less likely to remove them from office (e.g., Coles et al., 2014). Furthermore, our findings are consistent with Di Meo et al. (2017) who report that entrenched managers are less concerned about their careers, thus they behave less myopically with regard to managing earnings to meet short-term financial goals. We further analyze this explanation for our main findings by jointly relating co-option and earnings management to CEO turnover using both multinomial logistic regression analyses and traditional logit regression analyses. Hazarika et al. (2012) propose that corporate boards act proactively to fire executives who aggressively manage earnings before the manipulation leads to costly external consequences. However, we posit and find support for the argument that the likelihood of a forced ouster from office for managing earnings is less pronounced in firms with greater board co-option. We also find some evidence that co-opted directors react to accrual management because it is easier to detect and can damage the firm reputation. Even then, co-opted boards appear to ask CEOs to leave voluntarily instead of forcefully removing them from the office.
Our study contributes to the literature in several ways. We add to the literature on board governance. The fraction of independent directors was the primary measure of board efficacy until Coles et al. (2014) put forward the co-option measure indicating that directors’ objectivity can be compromised when they are appointed by, work alongside, and share potential social ties with the CEO. Our study provides evidence that co-option alleviates managerial short-termism by improving managers’ job security owing to less board oversight. Moreover, we offer new insights for the earnings management literature by relating co-option, as a proxy for career concerns, to both real activities and accrual manipulations. Our results buttress the argument that managers’ concern about their tenure is one of the main drivers behind earnings management.
We also add to the literature on the consequences of strong board monitoring. Our results are consistent with the position that stringent monitoring exacerbates managerial myopia (Faleye et al., 2011), intensifies the pressure on management to meet or beat earnings forecasts (Ge & Kim, 2014), and by corollary that managers manage earnings due to compensation and career concerns Chen, Cheng, et al., 2015; Cheng et al., 2016). Our results also support studies showing that corporate mechanisms such as takeover protection, staggered board, and contractual protection increase managers’ perceived job security and thereby reduce their tendency to engage in earnings management (see Chen, Cheng, et al., 2015; Ge & Kim, 2014; Zhao et al., 2012).
As a final point, we build upon earlier findings that relate earnings management to CEO turnover by accounting for the effect of co-option on turnover risk. Hazarika et al. (2012) suggest that boards act proactively to remove managers that aggressively manage earnings before the manipulation lead to costly external consequences. However, they do not consider the potential mitigating effects of co-opted directors’ allegiance to the CEO on turnover, nor do they consider real earnings management. This is an important oversight because, following SOX, executives have increasingly used real business activities to manage earnings instead of accruals; after all, the former is more difficult to detect. Our findings not only affirm earlier results that higher co-option lowers the likelihood of CEO removal, but they also show that to the extent that some level of earnings management is inevitable (Hermalin & Weisbach, 2008), when it inordinately occurs, higher co-option lowers the likelihood that the CEO is forcefully removed from office.
The rest of the article is as follows. Section “Literature review and hypothesis development” discusses the literature on board independence and motivates our hypotheses. Section “Data and variable description” explains the data and describes the variables that we used in our analyses. Section “Empirical multivariate results” presents the empirical models and discusses the results. To end, section “Conclusion” provides the concluding remarks.
Literature review and hypothesis development
Board independence—the status where the majority of the board consists of outside directors—is commonly viewed as a necessary condition for effective monitoring since outside directors can evaluate managers more objectively (e.g., Fama & Jensen, 1983). Director independence correlates positively with the sensitivity of CEO turnover to firm performance (e.g., Weisbach, 1988), lowers the likelihood of corporate fraud (Uzun et al., 2004), and increases firm value (Rosenstein & Wyatt, 1990). Consequently, shareholders penalize firms following the resignations of outside directors, especially when their departures result in a decrease in the degree of board independence (Gupta & Fields, 2009). Hence, it is axiomatic that independent directors are considered the guardians of shareholder wealth (e.g., L. Cohen et al., 2012). In fact, following the passage of SOX, the major stock exchanges in the United States 4 require a larger fraction of the board of enlisted corporations to consist of independent directors.
Nevertheless, board independence has been criticized since CEOs manage appearances by hiring directors who are formally independent but who are socially close to top management (Westphal & Graebner, 2010). Dey and Liu (2010) report that an independent director’s social ties with the firm’s CEO lower monitoring effectiveness. Hence, it is likely that “so-called” independent directors have some affiliation with managers before their board appointments that may undermine their independence (Adam & Ferreira, 2007). Coles et al. (2014) show that the social network of corporate elites enables the CEO to co-opt formally independent directors, which weakens board oversight. They find that co-option is associated with a lower sensitivity of CEO turnover to firm performance, higher CEO pay, and more suboptimal investments, thereby suggesting that co-opted directors are loyal to the CEO (Jiraporn & Lee, 2018). Moreover, boards with more co-opted directors meet less often and afford managers greater latitude in running their firms (Wilson, 2018; Withisuphakorn & Jiraporn, 2017).
Empirical evidence documents that earnings management is affected by the strength of board monitoring. Accrual manipulation is higher, for example, when the board meets less frequently (Xie et al., 2003) and when director independence is compromised by social ties with top managers (Krishnan et al., 2011). The lack of appropriate oversight from the board may, therefore, allow executives to make decisions that maximize their personal wealth rather than firm value, thereby creating reasons to manage corporate earnings. Consequently, one may expect a positive association between board co-option and firms’ involvement with earnings management activities as a corollary of reduced board monitoring.
In sharp contrast, there is compelling evidence that suggests that stringent board oversight may cause managers to resort to managing earnings. For example, the 2017–2018 NACD Public Company Governance Survey affirms that 74% of directors indicate that the pressure to meet short-term expectations attenuates managers’ focus on long-term goals. 5 As a result, executives behave myopically by cutting or delaying long-term investment to meet short-run performance targets (Graham et al., 2005). As short-term performance measures are used in employment contracts, managers have valuable financial and career-based incentives to engage in short-termist behavior (Ladika & Sautner, 2020), and so manage earnings to prop up their firms’ stock prices (e.g., Cheng et al., 2016). In fact, stronger board monitoring can lead to more myopic behavior. Faleye et al. (2011) show that more intense board monitoring comes at the significant cost of weaker strategic advising and greater managerial myopia. They suggest that firms with boards that monitor intensely develop a lack of trust between managers and directors which eventually hurts corporate innovation.
Coles et al. (2014), however, show that co-opted directors are reluctant to fire managers following poor performance, implying that co-option lowers managers’ career concerns and so may reduce myopia. Jiraporn et al. (2017) explore the effect of co-opted directors on corporate risk-taking, and report that co-option facilitates a weakened governance climate that allows managers to take more risk. Chintrakarn et al. (2016) posit that managers with more co-opted directors are better motivated to make long-term investments than their peers because they are less likely to be terminated. In support of this view, they show that co-option leads to higher R&D investments, which implies that co-opted boards help to alleviate myopia. Nguyen et al. (2020) document a positive association between board co-option and firm innovation and attribute this finding to the insulation of managers from innovation risk.
Hence, to the extent that board co-option reduces managerial myopia by easing career concerns, we posit that it may influence the degree of earnings management. The reduced vulnerability to being sacked following poor performance should assuage short-termist behavior about managing earnings among managers with more co-opted directors relative to their peers. For instance, Chen, Cheng, et al. (2015) show that managers who are granted contractual protection through employment agreements and severance pay are less likely to cut R&D expenses to avoid earnings decreases and engage in higher real earnings management than other managers. Di Meo et al. (2017) also find that managerial entrenchment results in less myopic behavior and lowers the likelihood of earnings management because entrenched managers are subject to less turnover risk. Moreover, executives in firms with more co-opted directors face less pressure to meet earnings targets, and so may be less likely to manage earnings compared with other executives. Therefore, we theorize that the degree of earnings management is less pronounced in firms with co-opted boards because managers are subject to lower employment risk than other managers.
Data and variable description
Sample selection
This study employs the board co-option data provided by Coles et al. (2014) that is obtained from the RiskMetrics database over the period 1996–2014. 6 The dataset covers the S&P 500, S&P MidCap, and S&P SmallCap firms and gives an initial sample of 26,136 firm-year observations. We retrieve all accounting data from Compustat and data on board-characteristics (i.e., board size and independence) from RiskMetrics. The data relevant about individual CEO’s gender, tenure, and equity-incentives is obtained from ExecuComp. To be consistent with prior literature, we exclude firms in the financial services (SIC 6000-6999) and utilities industries (SIC 4900-4999) because of their special regulatory environment. We also eliminate firms that are incorporated outside the United States. This selection process yields a final sample of 18,009 firm-year observations representing 2,035 unique firms.
Table 1 reports sample summary statistics. Panel A of the table shows the frequency distribution by year. As the results show, the observations are uniformly distributed over the sample period, with each year accounting for approximately 5% of the full sample. It is also important to note that the majority of the sample covers the period after the passage of SOX in 2002. As a result, our sample is dominated by observations where firms are under greater accounting scrutiny from regulators and auditors. In Panel B, we report the sample distribution by sector. The sample primarily consists of firms in the manufacturing and chemicals industry (SIC range 3,000–3,999), which accounts for 34.43% of the sample. Firms operating in wholesale and retail trade and those in services industries also represent a large subsection of the sample. The smallest concentration is in the agriculture-, forestry-, and fishing-related industry (SIC range 0–999), which accounts for only 0.15% of the observations.
Frequency distribution and descriptive statistics.
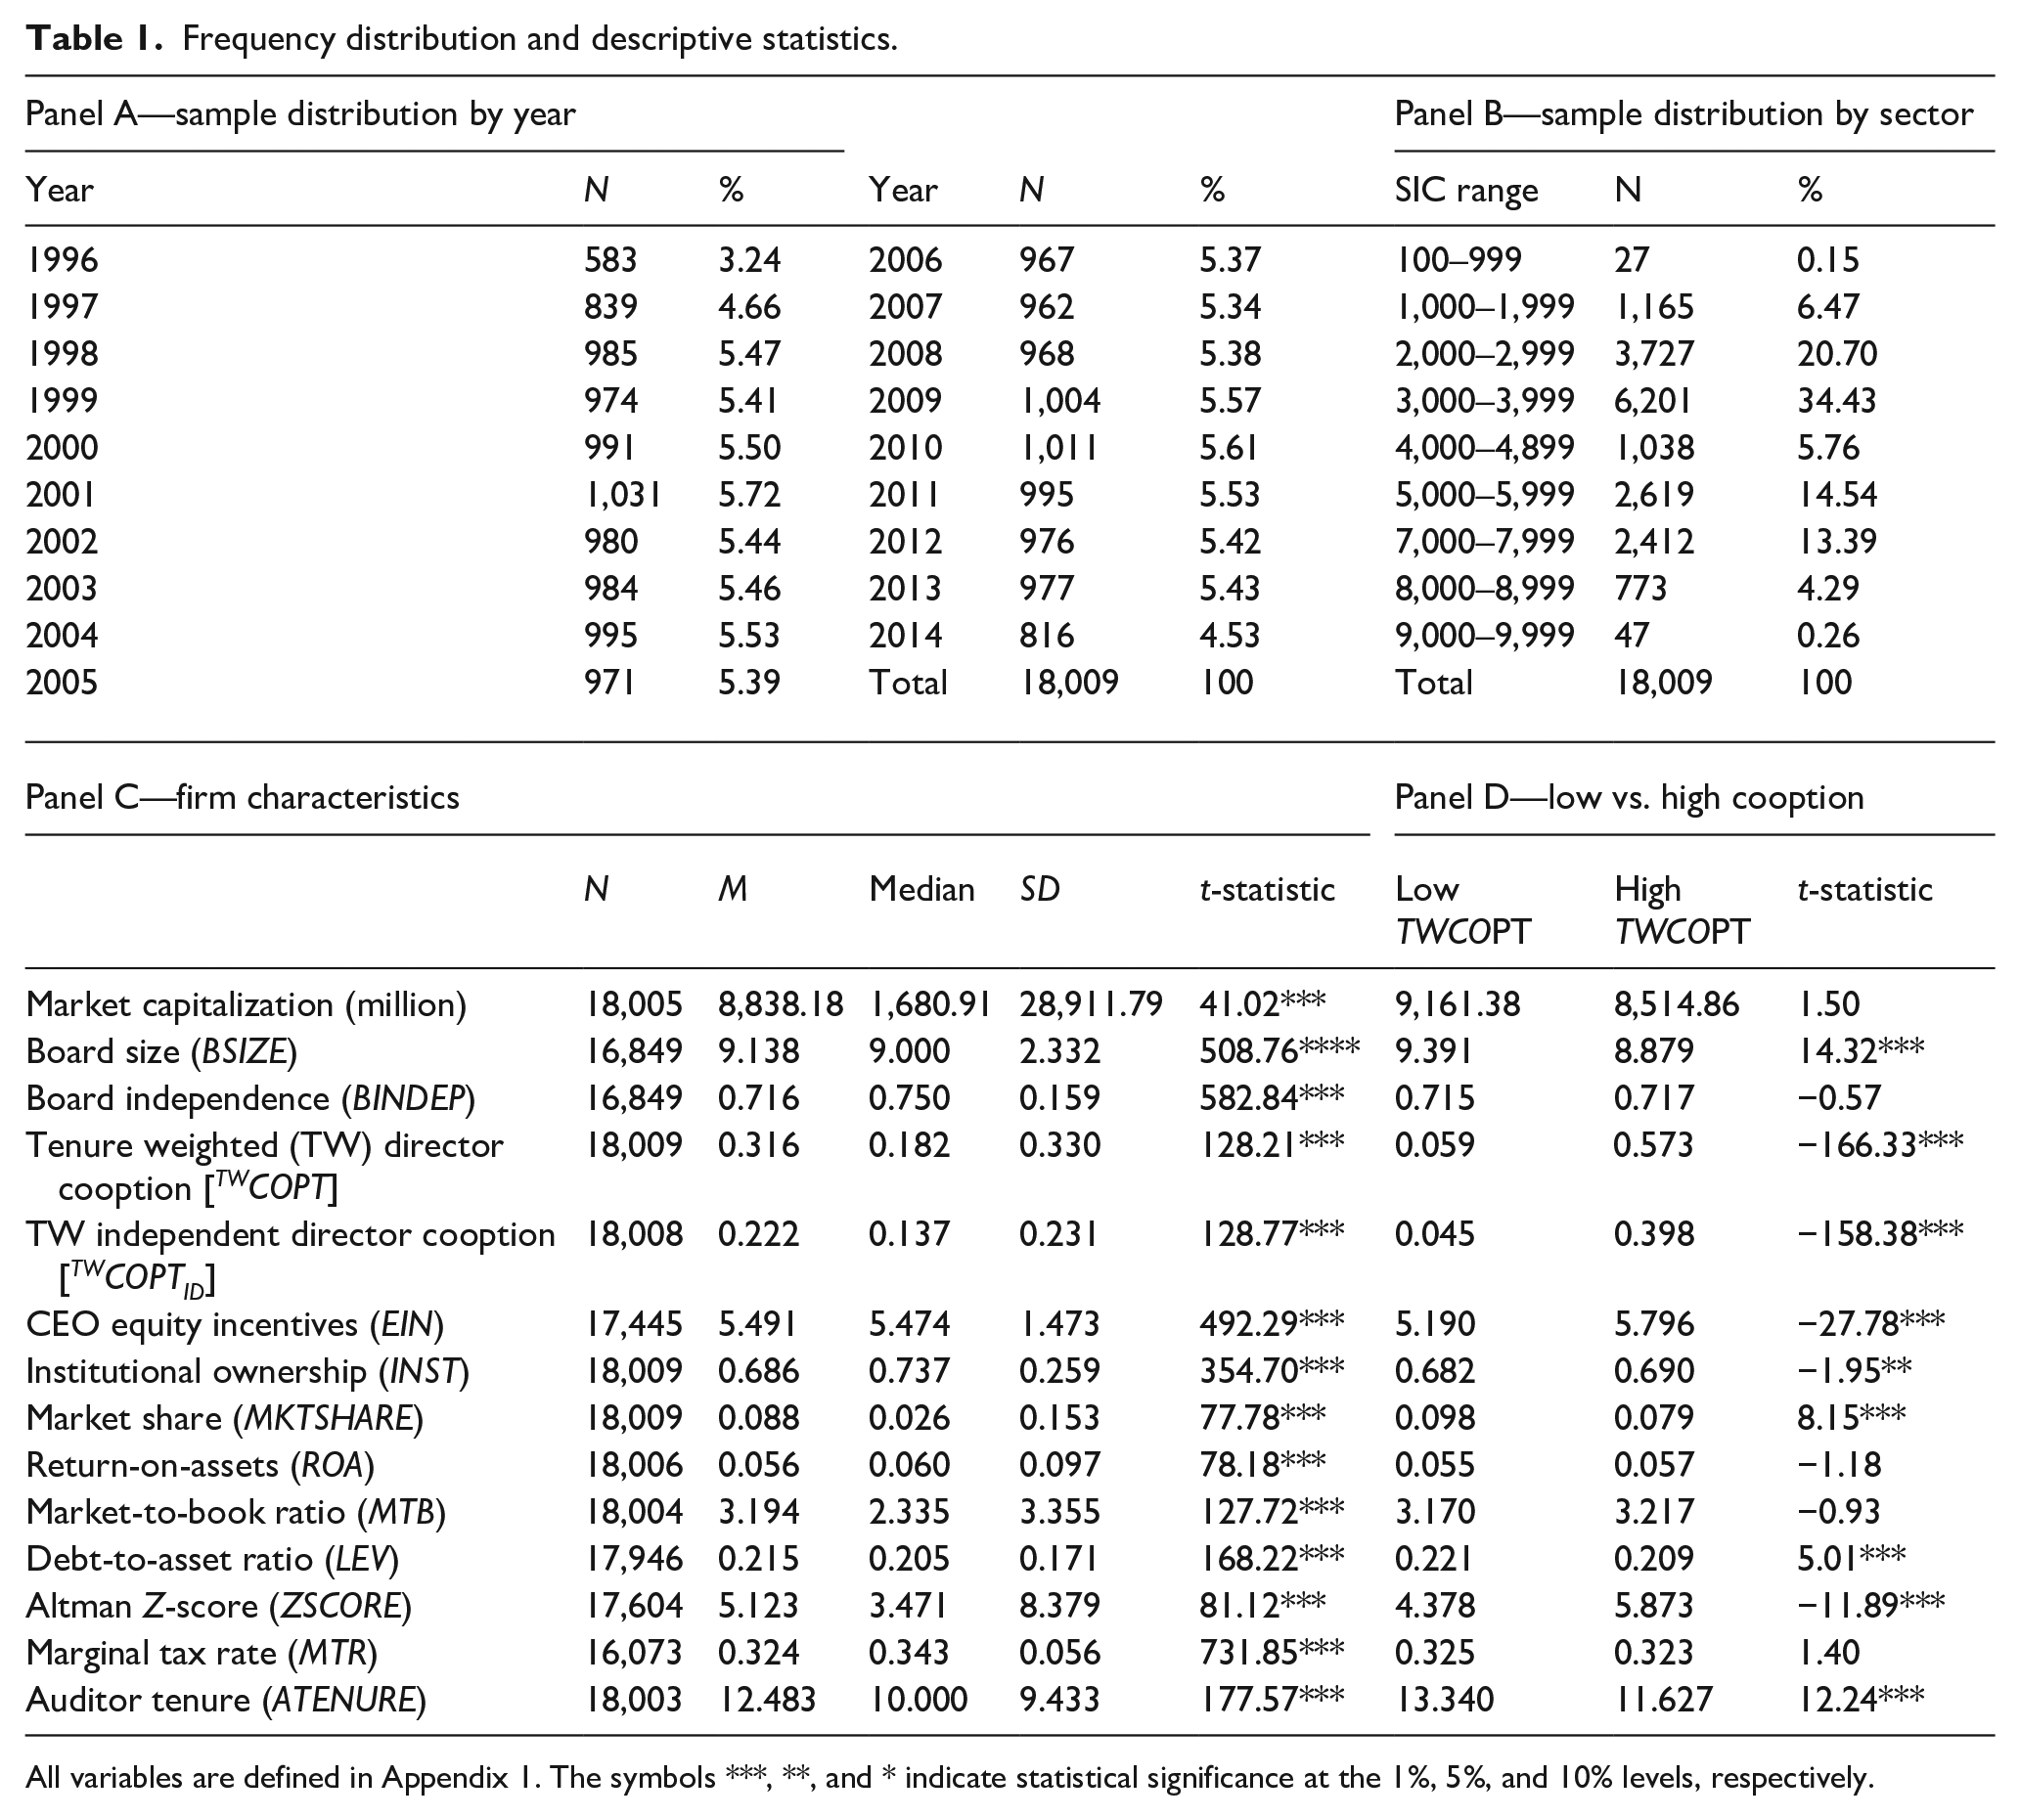
All variables are defined in Appendix 1. The symbols ***, **, and * indicate statistical significance at the 1%, 5%, and 10% levels, respectively.
In Panel C, we provide sample summary statistics on firm characteristics. The market capitalization of the average firm in the sample is US$8,838.18 million. Board size is the total number of directors and board independence is the fraction of independent directors, where independent directors are those not classified as inside or gray directors in RiskMetrics. These traditional corporate governance measures suggest that the typical firm in the sample has nine board members of which 71.6% are truly independent directors. Unlike traditional measures of board efficacy, board co-option captures the directors’ allegiance to the CEO (see Coles et al., 2014) and severs as the main variable of interest in this manuscript. Coles et al. (2014) compile four board co-option measures; however, we focus on their two proposed tenure-weighted co-option variables as these measures account for the tenure effect within co-opted boards.
Tenure-weighted board co-option (TWCOPT) is defined as the sum of the tenure of co-opted directors divided by the total tenure of all directors, and we adopt the measure compiled by Coles et al. (2014). Co-option ranges from 0 to 1, with higher values indicating greater fidelity to the CEO. On average, TWCOPT is 0.316; the median is 0.182. Hence, after accounting for director tenure, on average, 31.6% of all directors are co-opted. This estimate is consistent with other studies (see Chintrakarn et al., 2016; Jiraporn & Lee, 2018). Even so, this co-option measure does not differentiate between insider directors and independent directors. For this reason, we also employ tenure-weighted independent director co-option (TWCOPTID) which is calculated as the sum of the tenure of co-opted independent directors relative to the total tenure of all directors. The mean is 0.222 (median = 0.137) for this alternative measure of board co-option, suggesting that 22.2% of all the independent directors are co-opted.
Panel C also reports summary statistics on other firm attributes. The average equity-based incentive (vega-to-delta ratio) of the CEO is 5.491, suggesting that managers are compensated with plenty of risk-taking incentives. We use institutional ownership as an external firm governance mechanism (data from Thomson Reuters). On average, institutional investors own 68.6% of outstanding shares. Firms typically control around 8.8% of the market share in their industries. Return on assets (ROA) is on average 5.6% and the market-to-book ratio is 3.194, indicating that the average firm has notable growth prospects. Likewise, the mean debt-to-asset ratio is 0.215 and the Altman Z-score has an average value of 5.12, which both suggest that the typical sample firm is financially healthy. In addition, the average firm is subject to a 32.5% marginal tax rate and has an established relationship with the same auditor for more than 12 years.
We split the sample into two groups based on the median co-option level. The above-median subsample is denoted “high co-option” and the below-median subsample is denoted “low co-option.” Panel D of Table 1 compares the firm characteristics of the two groups. There are some notable differences. For instance, firms with a high degree of co-option tend to have smaller boards and are also associated with higher CEO equity incentives than their counterparts. Yet, high co-option firms exhibit lower market share, less debt, and have a shorter established relationship with the same auditor compared to low co-option firms. Overall, these findings support the notion that board co-option assuages managerial oversight.
Earnings management variables
The literature categorizes earnings management into real activities manipulation and accrual manipulation. By definition, real activities manipulation involves actions that change the timing or structuring of an operating, investment, and/or financing transaction, while accrual manipulation involves accounting choices to misrepresent a firm’s true performance (D. A. Cohen et al., 2008; A. Cohen & Zarowin, 2010; Farooqi et al., 2014; Ge & Kim, 2014; Graham et al., 2005; Harris, Karl, and Lawrence, 2019; Roychowdhury, 2006; Zang, 2012). As in earlier studies, we use abnormal production costs and abnormal discretionary expenses to gauge real earnings management activities. Similarly, we follow prior research and gauge accrual-based earnings management using discretionary accruals.
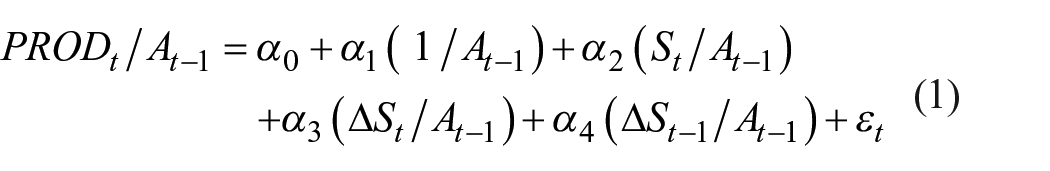
Pursuant to the literature, the normal level of production costs is measured as
The normal level of discretionary expenditures is given as

The normal level of total accruals is given as
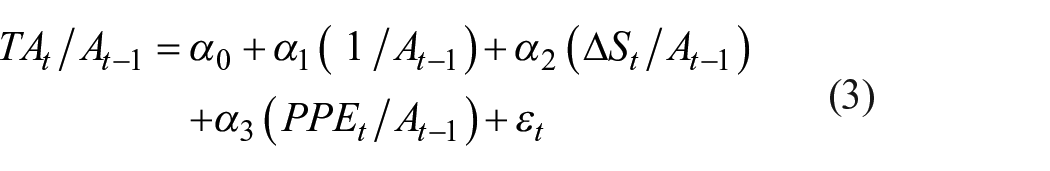
where PRODt is the sum of the cost of goods sold in year t and the change in inventory from year t–1 to year t, while DISXt is the discretionary expenditures (i.e., the sum of advertising, R&D, and SG&A expenditures) in year t. TAt is the total accruals in year t measured as earnings before extraordinary items and discontinued operations minus operating cash flows. At–1 is total assets in year t–1, St is the net sales in year t, ΔSt is the change in net sales from year t–1 to year t, and PPEt is the gross value of property, plant, and equipment in year t. Each model is estimated cross-sectionally each year by industry (by 2-digit SIC code), with at least 15 observations to control for year and industry fixed effects.
Abnormal production costs (denoted Ab_ PROD) are computed as the difference between the actual value and the normal level predicted from equation (1). A higher Ab_ PROD indicates more overproduction of inventory, which decreases a firm’s cost of goods sold, so it may report a better operating margin. Likewise, abnormal discretionary expenditures (denoted Ab_DISX) are given as the estimated residual from equation (2). Discretionary accruals (denoted Ab_AC) are computed as the estimated residual from equation (3). Higher values of Ab_AC suggest more accrual-based earnings management (see Zang, 2012). Although it is customary in the literature to multiply Ab_DISX by −1 such that higher values indicate greater cuts in discretionary expenses to manage earnings upwards, we postpone this adjustment for now so that we can compare our point estimates in Table 2 with those reported in D. A. Cohen et al. (2020). This explains why we refrain from taking the absolute value of the earnings management variables and so implicitly assume that earnings management is income increasing. By comparing our estimates with D. A. Cohen et al. (2020), we examine whether our proxies are appropriately estimated.
Comparison of average earnings management variables by board cooption quintiles.
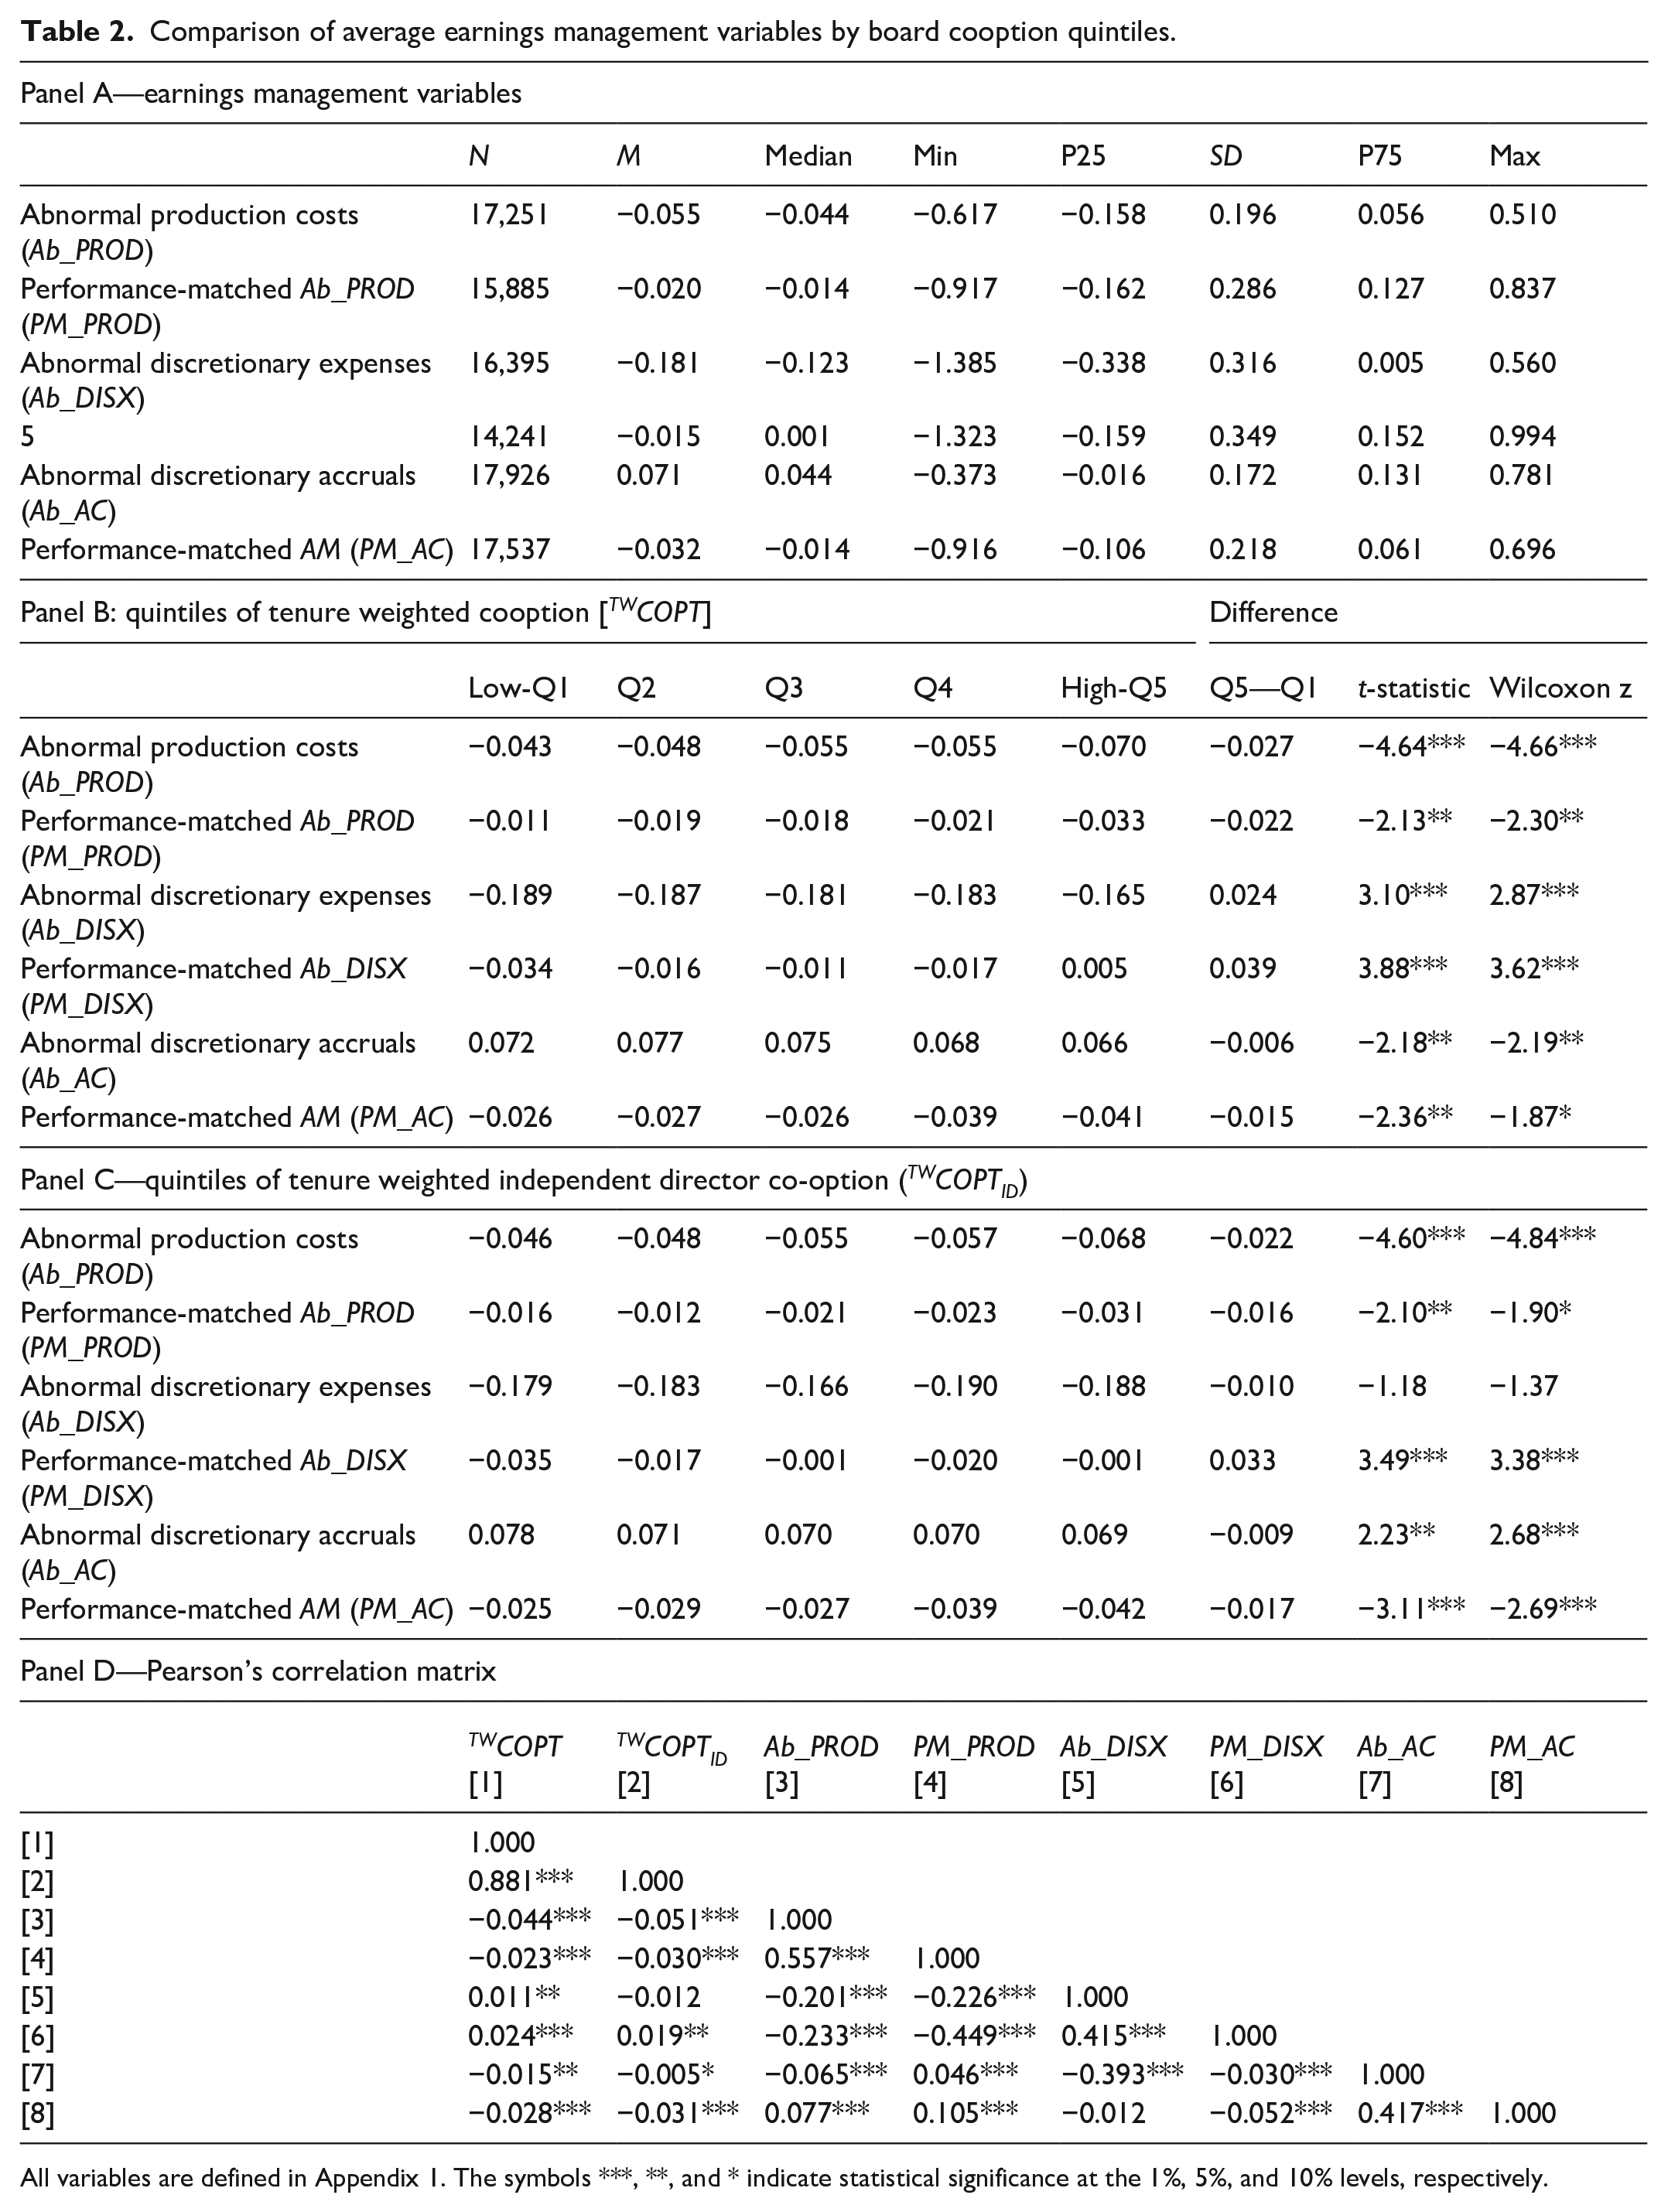
All variables are defined in Appendix 1. The symbols ***, **, and * indicate statistical significance at the 1%, 5%, and 10% levels, respectively.
Besides, while these standard earnings management measures are widely utilized in the literature, they have several limitations (see D. A. Cohen et al., 2020; Kothari et al., 2005). Therefore, following prior research, we also calculate a performance-matched alternative of each earnings management measure (symbolized as PM_PROD, PM_DISX, and PM_AC). The performance-matched version is the difference between the sample firm’s traditional earnings management measure and that of its closest performance-based matching firm. As in Kothari et al. (2005), we choose the matching firm in the same 2-digit SIC code and year with the closest ROA, where ROA is defined as the income before extraordinary items divided by the lagged total assets. We winsorize the earnings management variables at the 1% level (as is customary) to avoid noise from extreme observations (Cohen et al., 2020; Farooqi et al., 2014; Zang, 2012). We provide summary data on the different earnings management variables in Panel A of Table 2.
The mean abnormal production costs (Ab_ PROD) and performance-matched abnormal production costs (PM_PROD) are −0.055 and −0.020, respectively. These estimates are consistent with D. A. Cohen et al. (2020), who report abnormal production costs of −0.022 and performance-matched abnormal production costs of 0.001. In addition, we find abnormal discretionary expenses (Ab_DISX) and performance-matched discretionary expenses (PM_DISX) of approximately −0.181 and −0.015, while D. A. Cohen et al. (2020) report estimates of −0.085 and 0.003. The slight difference in the estimates may be explained by the performance matching control employed. Consequently, the means of the real activities management proxies are not zero, which suggests that firms employ real earnings management strategies. Likewise, the mean discretionary accrual (Ab_AC) is 0.071, indicating that, on average, managers also engage in accrual management. The estimate is also comparable to earlier studies.
Univariate results
Panels B and C of Table 2 show the univariate results for the tenure-weighted co-option (TWCOPT) variables and tenure-weighted independent director co-option (TWCOPTID) variables, respectively. We test the difference in means between the top and bottom quintiles of co-option. The results show that higher co-option elicits a strong negative effect on the real activities variables. For instance, as reported in Panel B, our first measure of real activities management (Ab_ PROD) exhibits the highest mean value (−0.043) in the lowest quintile of the TWCOPT variable. In contrast, the highest quintile of the TWCOPT variable is associated with the smallest mean (Ab_ PROD) value (−0.070). The difference in means between the lowest and highest quintiles is significant at the 1% level (t-statistic = −4.64; Wilcoxon Z-statistic = −4.66). The second real activities measure (Ab_DISX) elicits very similar results where the smallest mean value (−0.189) for the lowest quintile and the highest mean value (−0.165) for the highest quintile of the TWCOPT variable. Likewise, there is strong evidence that higher degree of board co-option has a definitive negative effect on accrual manipulation (Ab_ AC) and performance-matched accrual manipulation (PM_ AC). Overall, these findings are virtually consistent with the other definitions of board co-option (TWCOPTID) in Panel C, which strengthens the argument that co-option reduces earnings management.
To conclude Table 2, Pearson’s correlations for the focal variables are reported in Panel D. As these results show, there is a robust negative (positive) and significant relationship between abnormal production cost (abnormal discretionary expenses) and the two board co-option measures. These findings imply that more co-option leads to lower real activities management, since a higher Ab_ PROD indicates more overproduction of inventory to report better operating margins and a lower Ab_DISX indicates greater cuts in discretionary expenses to manage earnings upwards. Abnormal accruals (Ab_ AC) and performance-matched abnormal accruals (PM_ AC) also larger exhibit a negative and significant relationship with the various co-option measures. The correlations are significant at the 5% level or better, except for the correlation between TWCOPTID and Ab_AC. Taken as a whole, these results further support the position that co-option curtails short-termist behavior because it increases managers’ job security and reduces the pressure to meet earnings expectations.
Empirical multivariate results
Regression model
To test the effects of board co-option on earnings management, we estimate a model of the general form as
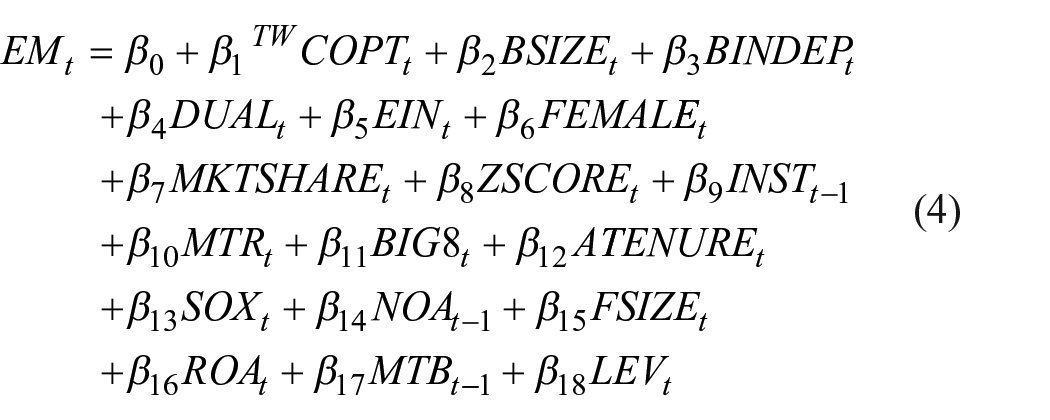
We estimate the model using ordinary least squares (OLS) while controlling for industry and year fixed effects. The dependent variable EM denotes the set of earnings management measures outlined earlier in section “Earnings management variables.” Again, there are six alternative variables in the set: Ab_PROD, PM_PROD, Ab_DISX, PM_DISX, Ab_AC, and PM_AC. The variable of interest is TWCOPT, which represents tenure-weighted board co-option. This variable accounts for the possibility that board members are likely to befriend executives, and so are prone to monitor management less over time, especially as they become less mobile and marketable (Vafeas, 2003). For robustness, we employ tenure-weighted independent director co-option (TWCOPTID), which focuses on the co-option of independent directors relative to all directors.
We control for several factors shown to affect a firm’s level of earnings management. First, we include several traditional measures of board quality. The variable BSIZE is the natural logarithm of the total number of directors to control for board size, while BINDEP denotes the fraction of independent directors to account for board independence. Studies show that the top manager’s degree of corporate power, level of equity-based pay, and gender also affect earnings management behavior (see Chen, Lee, and Chou, 2015; Davidson et al., 2004; Harris, Karl, and Lawrence, 2019; Hsu et al., 2020). Therefore, we include DUAL to control for CEO duality (a lack of separation of CEO and board chair positions), EIN to control for CEO equity incentives (vega-delta ratio) (Appendix 2 explains the calculation of CEO vega and CEO delta in details), and FEMALE to control for the CEO’s gender.
Zang (2012) provides evidence that real earnings management is constrained by a firm’s competitive status in the industry, financial health, scrutiny from institutional investors, and the immediate tax consequences of manipulation. Hence, we control for market share (MKTSHARE), the Altman’s Z-score (ZSCORE), institutional ownership (INST), and the firm’s marginal tax rate (MTR). Prior studies suggest that accrual management is constrained by the presence of high-quality auditors, regulatory scrutiny, and the flexibility within firms’ accounting systems. Since scrutiny increases with the presence of a Big 8 audit firm (A. Cohen & Zarowin, 2010), BIG8 equals 1 if the firm’s auditor is one of the Big 8 audit firms and 0 otherwise. We also include the natural logarithm of the number of years the auditor has been with the firm (ATENURE). The heightened scrutiny of accounting practices after SOX is known to alter the earnings management behavior (D. A. Cohen et al., 2008). So we control for the enactment of SOX. Accrual flexibility is constrained by prior accrual management (Zang, 2012). Net operating assets at the beginning of the year (NOA) are used to proxy accrual management in the previous period.
Following Farooqi et al. (2014) and others, we also control for firm size (FSIZE) using the natural logarithm of total assets. Studies also suggest that firms manage earnings to conceal poor performance (see Dechow et al., 2011). Therefore, we use ROA to control for profitability and the market-to-book ratio at the beginning of the year (MTB) as a proxy to control for growth opportunities (Zang, 2012). In addition, we include the debt to assets ratio (LEV) to control for financial leverage. The precise definitions of all the variables in the model are provided in Appendix 1. We also include year fixed-effects in the regression to control for the general economic conditions in each year, and sector fixed-effects to control for the conditions that are specific to each business sector.
Table 3 provides the baseline results from equation (4) where the dependent variable is abnormal production costs. Panel A of the table reports the results for tenure-weighted board co-option (TWCOPT), while Panel B reports the results for tenure-weighted independent director co-option (TWCOPTID). We use the traditional abnormal production costs (Ab_ PROD) as the dependent variable in Model 1 and the performance-matched alternative (PM_PROD) in Model 2. Moreover, given W. Chen et al.’s (2017) recent criticism of two-step approaches to study earnings management, we also test our hypothesis using a single-step regression and report the results in Model 3. For this single-step model, we include all the regressors from equation (4) as well as the industry-year indicators into equations (1) to (3). The results reported in all the models in both Panels A and B of Table 3 consistently show that there is a strong negative relationship between both measures of board co-option and abnormal production cost, as well as its performance-based alternative. The marginal effect is about −0.02 for Models 1 and 2 across both panels and all the estimates are significant at the 5% level or better. However, in the single-step regression in Model 3 where we use total production costs (PROD) as the dependent variable, TWCOPTID is significant at the 1% level, while TWCOPT only exhibits significance at the marginal 10% level.
Regression results of board co-option on abnormal and total production costs.
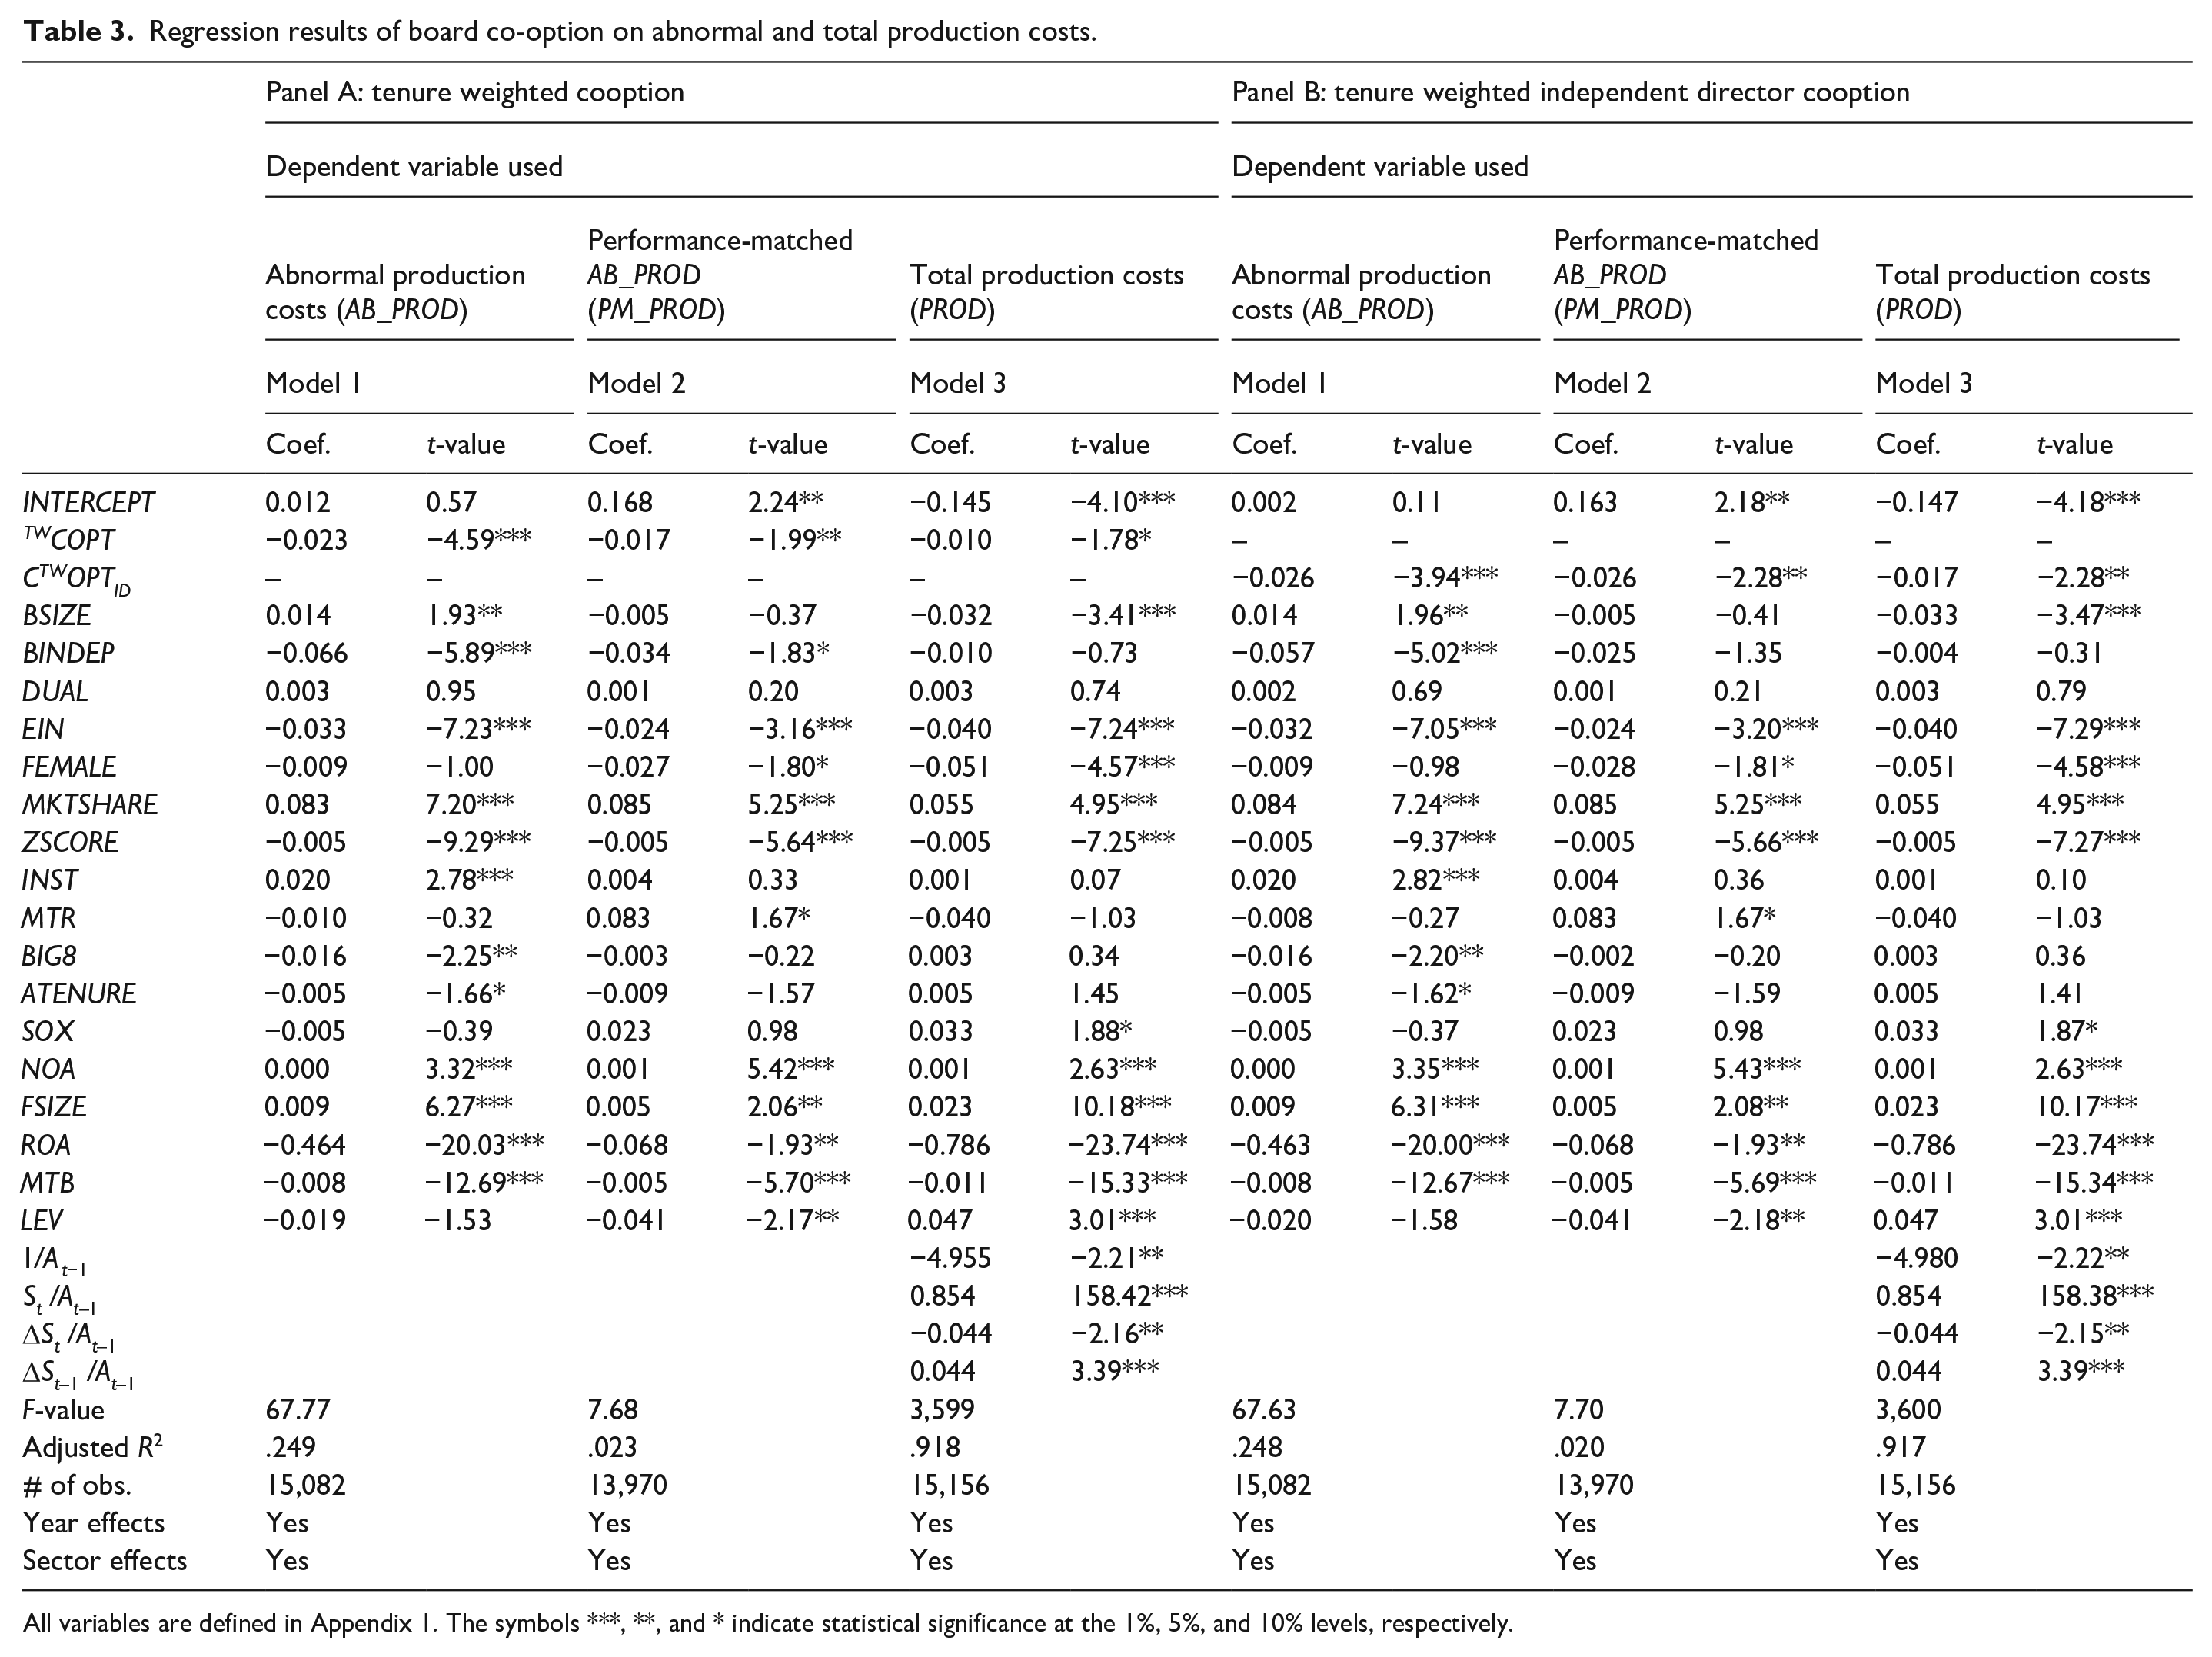
All variables are defined in Appendix 1. The symbols ***, **, and * indicate statistical significance at the 1%, 5%, and 10% levels, respectively.
Table 4 provides the results where abnormal discretionary expenses are used as the dependent variable. Models 1 and 2 in Panel A show that both Ab_DISX and PM_DISX are positive and significantly related to TWCOPT at the 1% level. Thus, both abnormal discretionary expenses and its performance-matched alternate increase with tenure-weighted board co-option. Recall that Ab_DISX and PM_DISX are kept in their raw values (as opposed to being multiplied by −1) so that we may compare with those of D. A. Cohen et al. (2020). As a result, higher abnormal discretionary expenses show less real earnings management in our analyses, which explains the positive and significant relationship with the co-option variable. This strong positive relation holds when we employ the single-step model in Model 3 and when we use the tenure-weighted independent director co-option (TWCOPTID) in Panel B.
Regression results of board cooption on abnormal and total discretionary expenditures.
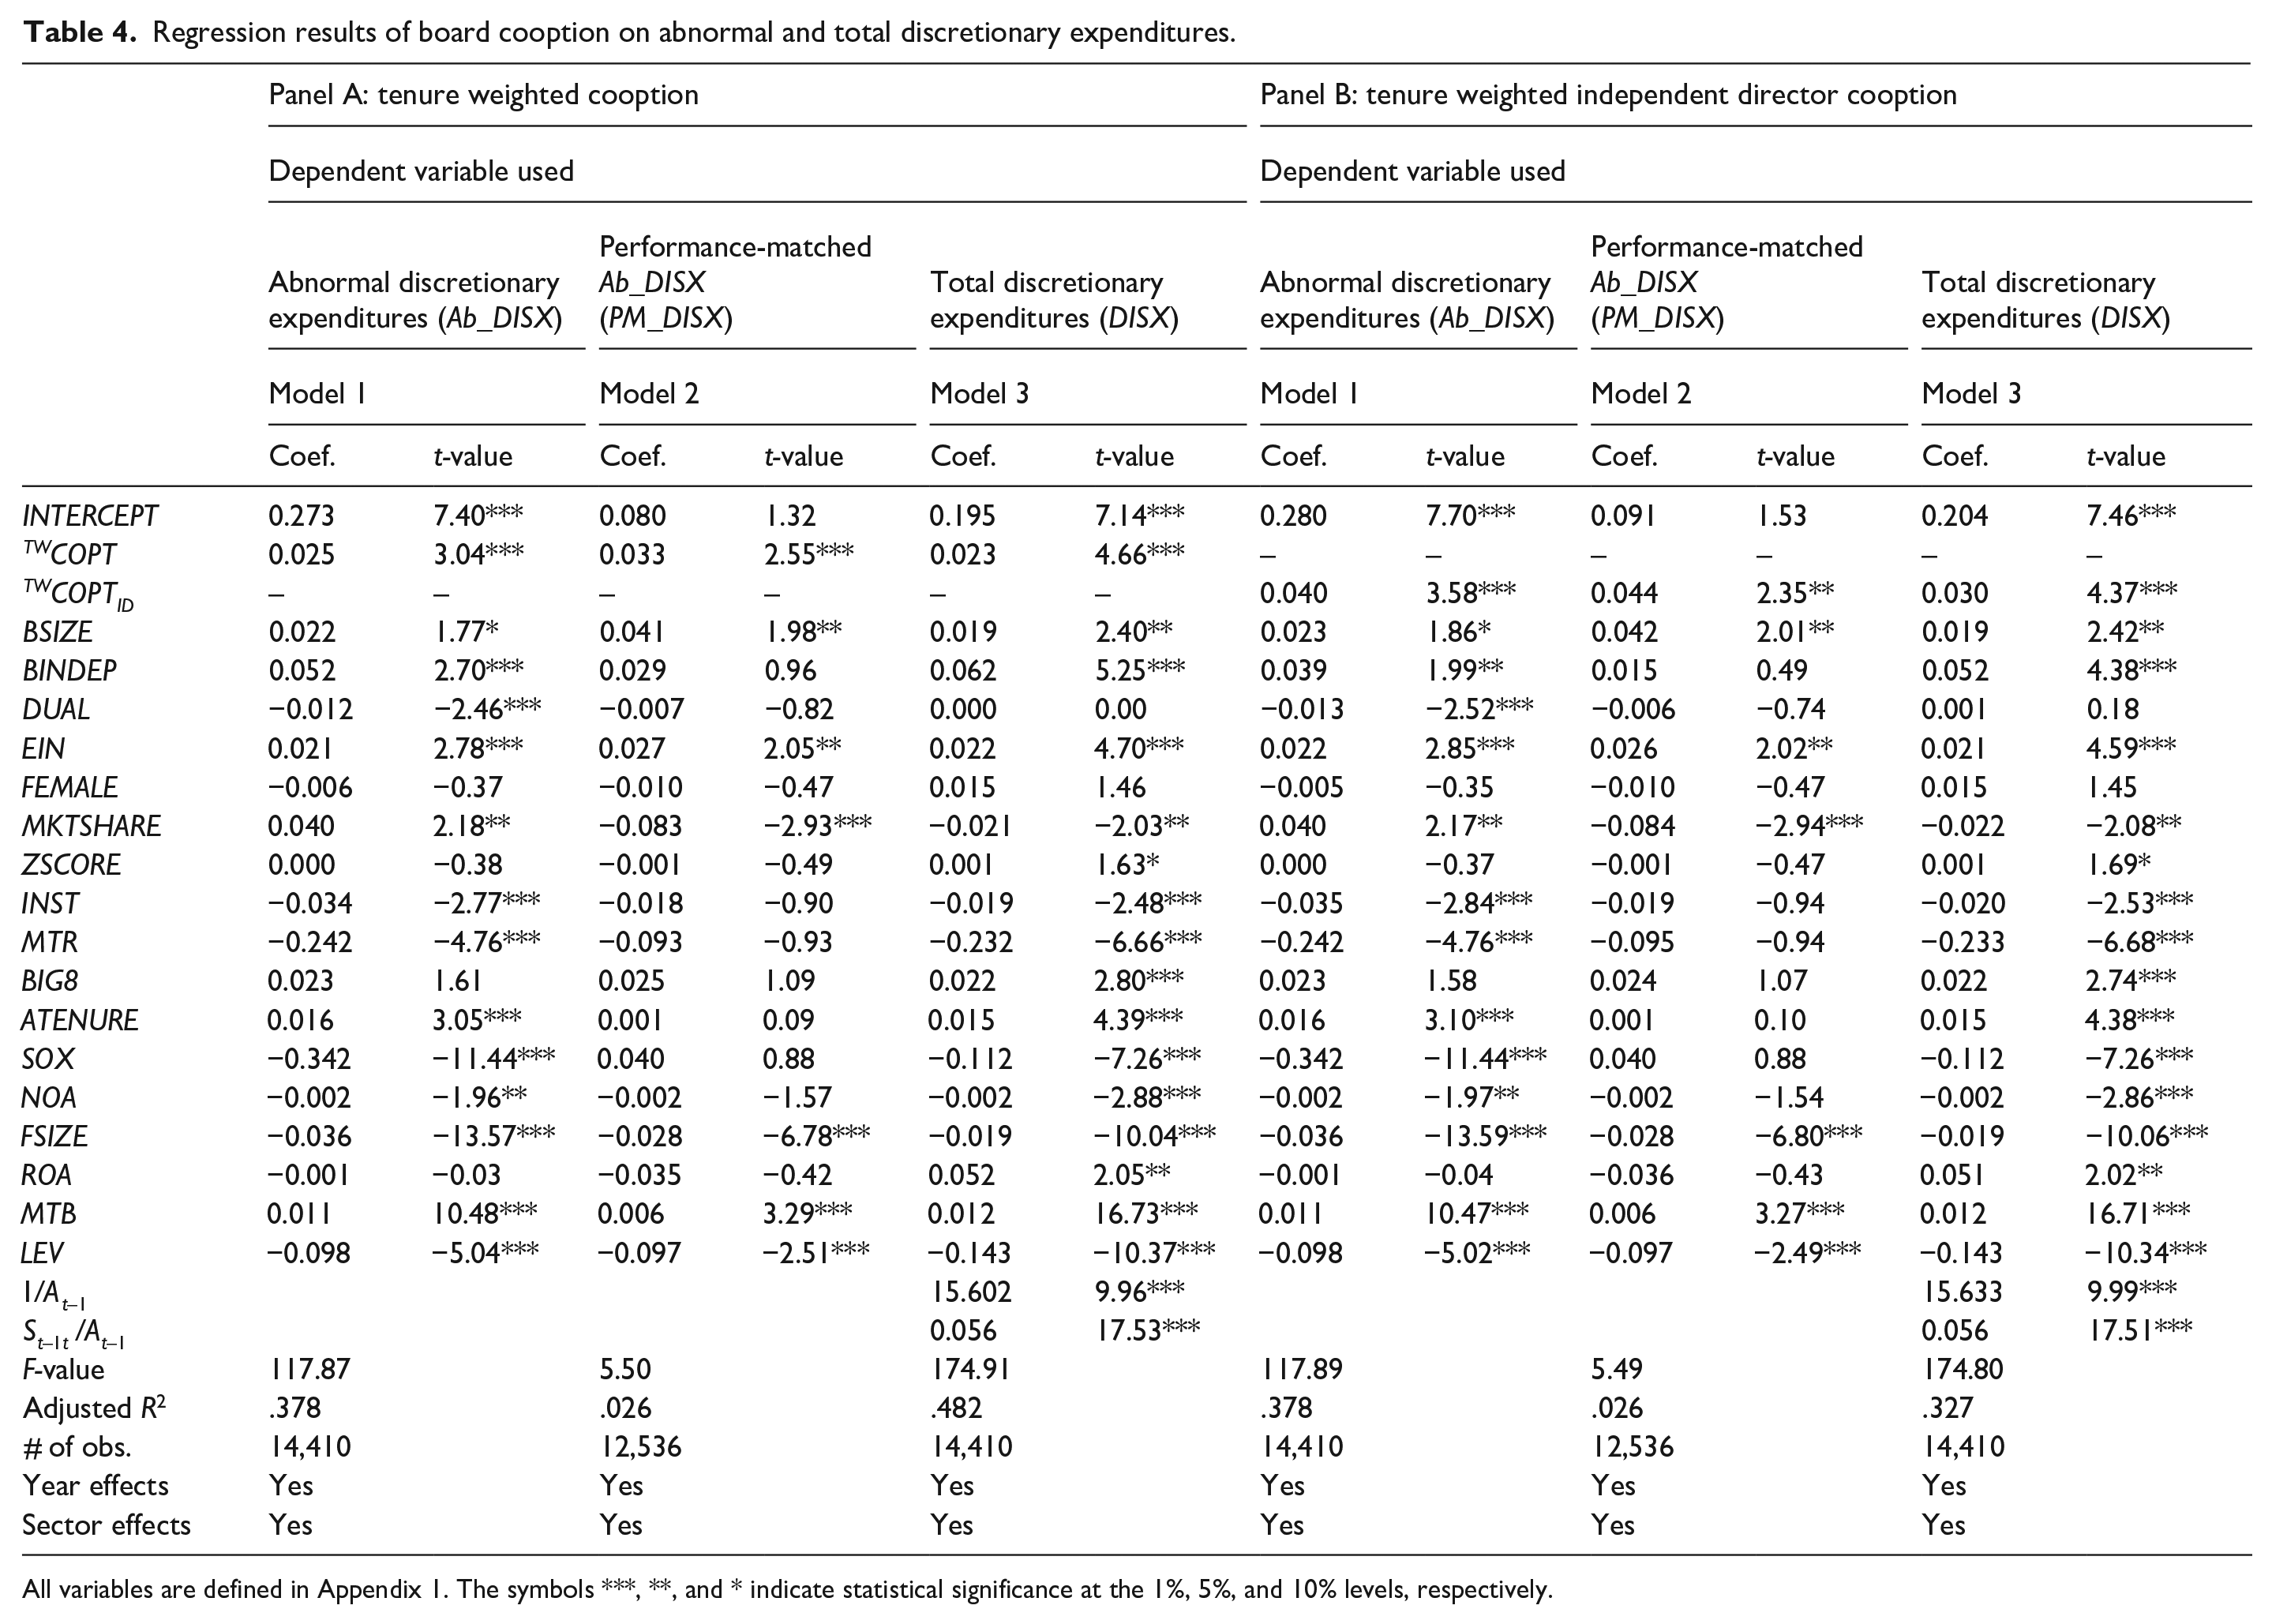
All variables are defined in Appendix 1. The symbols ***, **, and * indicate statistical significance at the 1%, 5%, and 10% levels, respectively.
In Table 5, we present the regression results where abnormal discretionary accrual is the dependent variable. The results are consistent with those presented in Tables 3 and 4. In particular, board co-option is negative and significantly related to the two measures of abnormal accruals at the 5% level or better. The results continue to hold when we use the single-step approach in Model 3. Furthermore, they are robust to using tenure-weighted independent director co-option (TWCOPTID) in Panel B. Nevertheless, it is important to note that the magnitude of the impact of co-option on abnormal discretionary accruals is relatively smaller than its impact on abnormal production cost and abnormal discretionary expenses. This is expected since managers shift earnings management tools in the post-SOX period.
Regression results of board cooption on discretionary and total accruals.
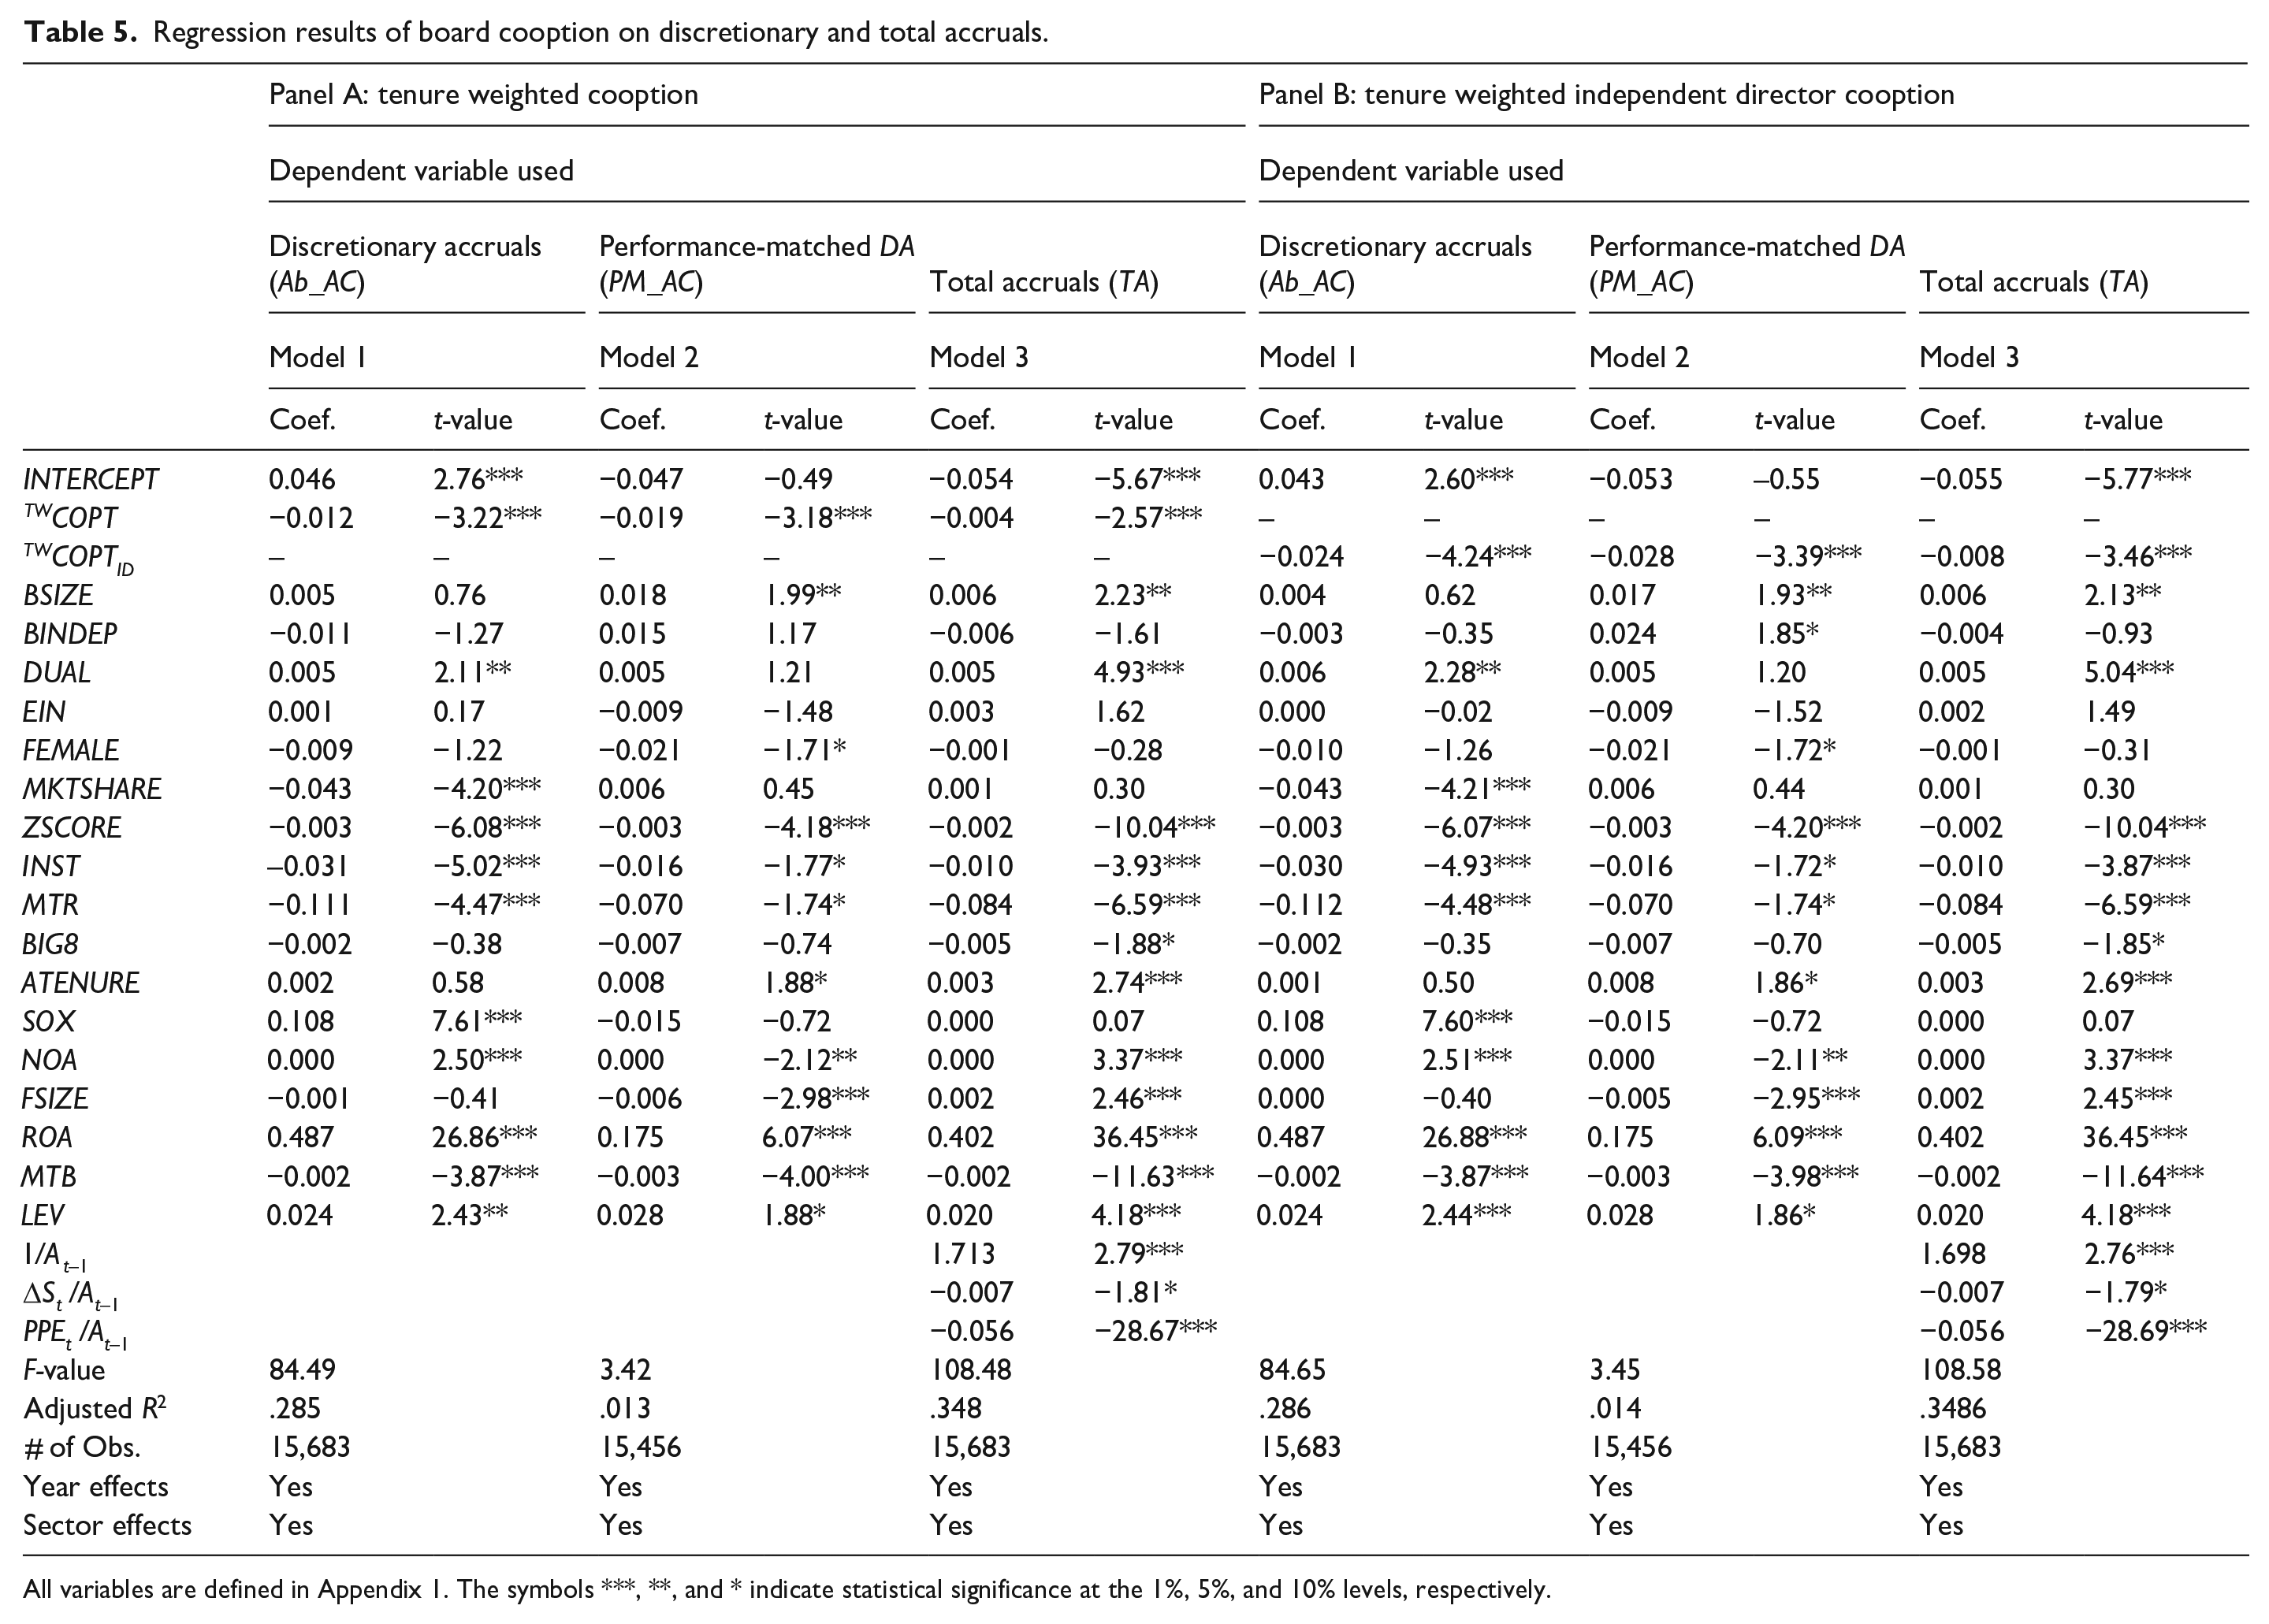
All variables are defined in Appendix 1. The symbols ***, **, and * indicate statistical significance at the 1%, 5%, and 10% levels, respectively.
A number of the control variables in Tables 3 to 5 are statistically significant, and overall the coefficients exhibit the expected signs. For example, consistent with prior studies, we document some evidence that both real and accrual-based earnings management are constrained by a firm’s financial health. Firms with more growth prospects and higher profitability tend to manipulate less (e.g., Dechow et al., 2011; Zang, 2012). Interestingly, CEOs with larger equity-based compensation are less likely to engage in real earnings management. Although this finding contradicts with earlier studies, suggesting that higher equity-based incentives elicit higher earnings management (see Bergstresser & Philippon, 2006; Cheng & Warfield, 2005; Harris, Karl, and Lawrence, 2019), it is consistent with other recent studies showing that stock-based compensation restrains CEOs from engaging in real earnings management (Chen, Lee, and Chou, 2015; Hsu et al., 2020).
Endogeneity concerns
Orthogonalization approach
While our results are robust to alternative definitions of board co-option, arguably co-option increases with CEO tenure. Consequently, a conceivable concern is that our results may be capturing a CEO tenure effect, suggesting a potential for endogeneity bias. To circumvent endogeneity concerns, we consider an orthogonalization approach to construct a co-option proxy that is uncorrelated with CEO tenure. Following Coles et al. (2014), we estimate the variable RES.TWCOPT as the residual from a regression of tenure-weighted board co-option (TWCOPT) against on CEO tenure. 7 By design, the residuals from this regression are uncorrelated with the CEO tenure. We then estimate a model of the general form as
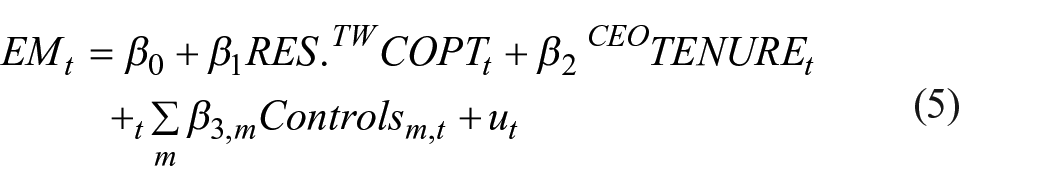
where again the dependent variable EM denotes the set of six alternative earnings management variables: Ab_PROD, PM_PROD, Ab_DISX, PM_DISX, Ab_AC, and PM_AC. The variable of interest is RES.TWCOPT, which represents residual tenure-weighted co-option. CEOTENURE is the natural logarithm of the number of years the CEO has been in office to control for CEO tenure, and Controls is the vector of other control variables from equation (4). We also include sector and year fixed-effects in the regression.
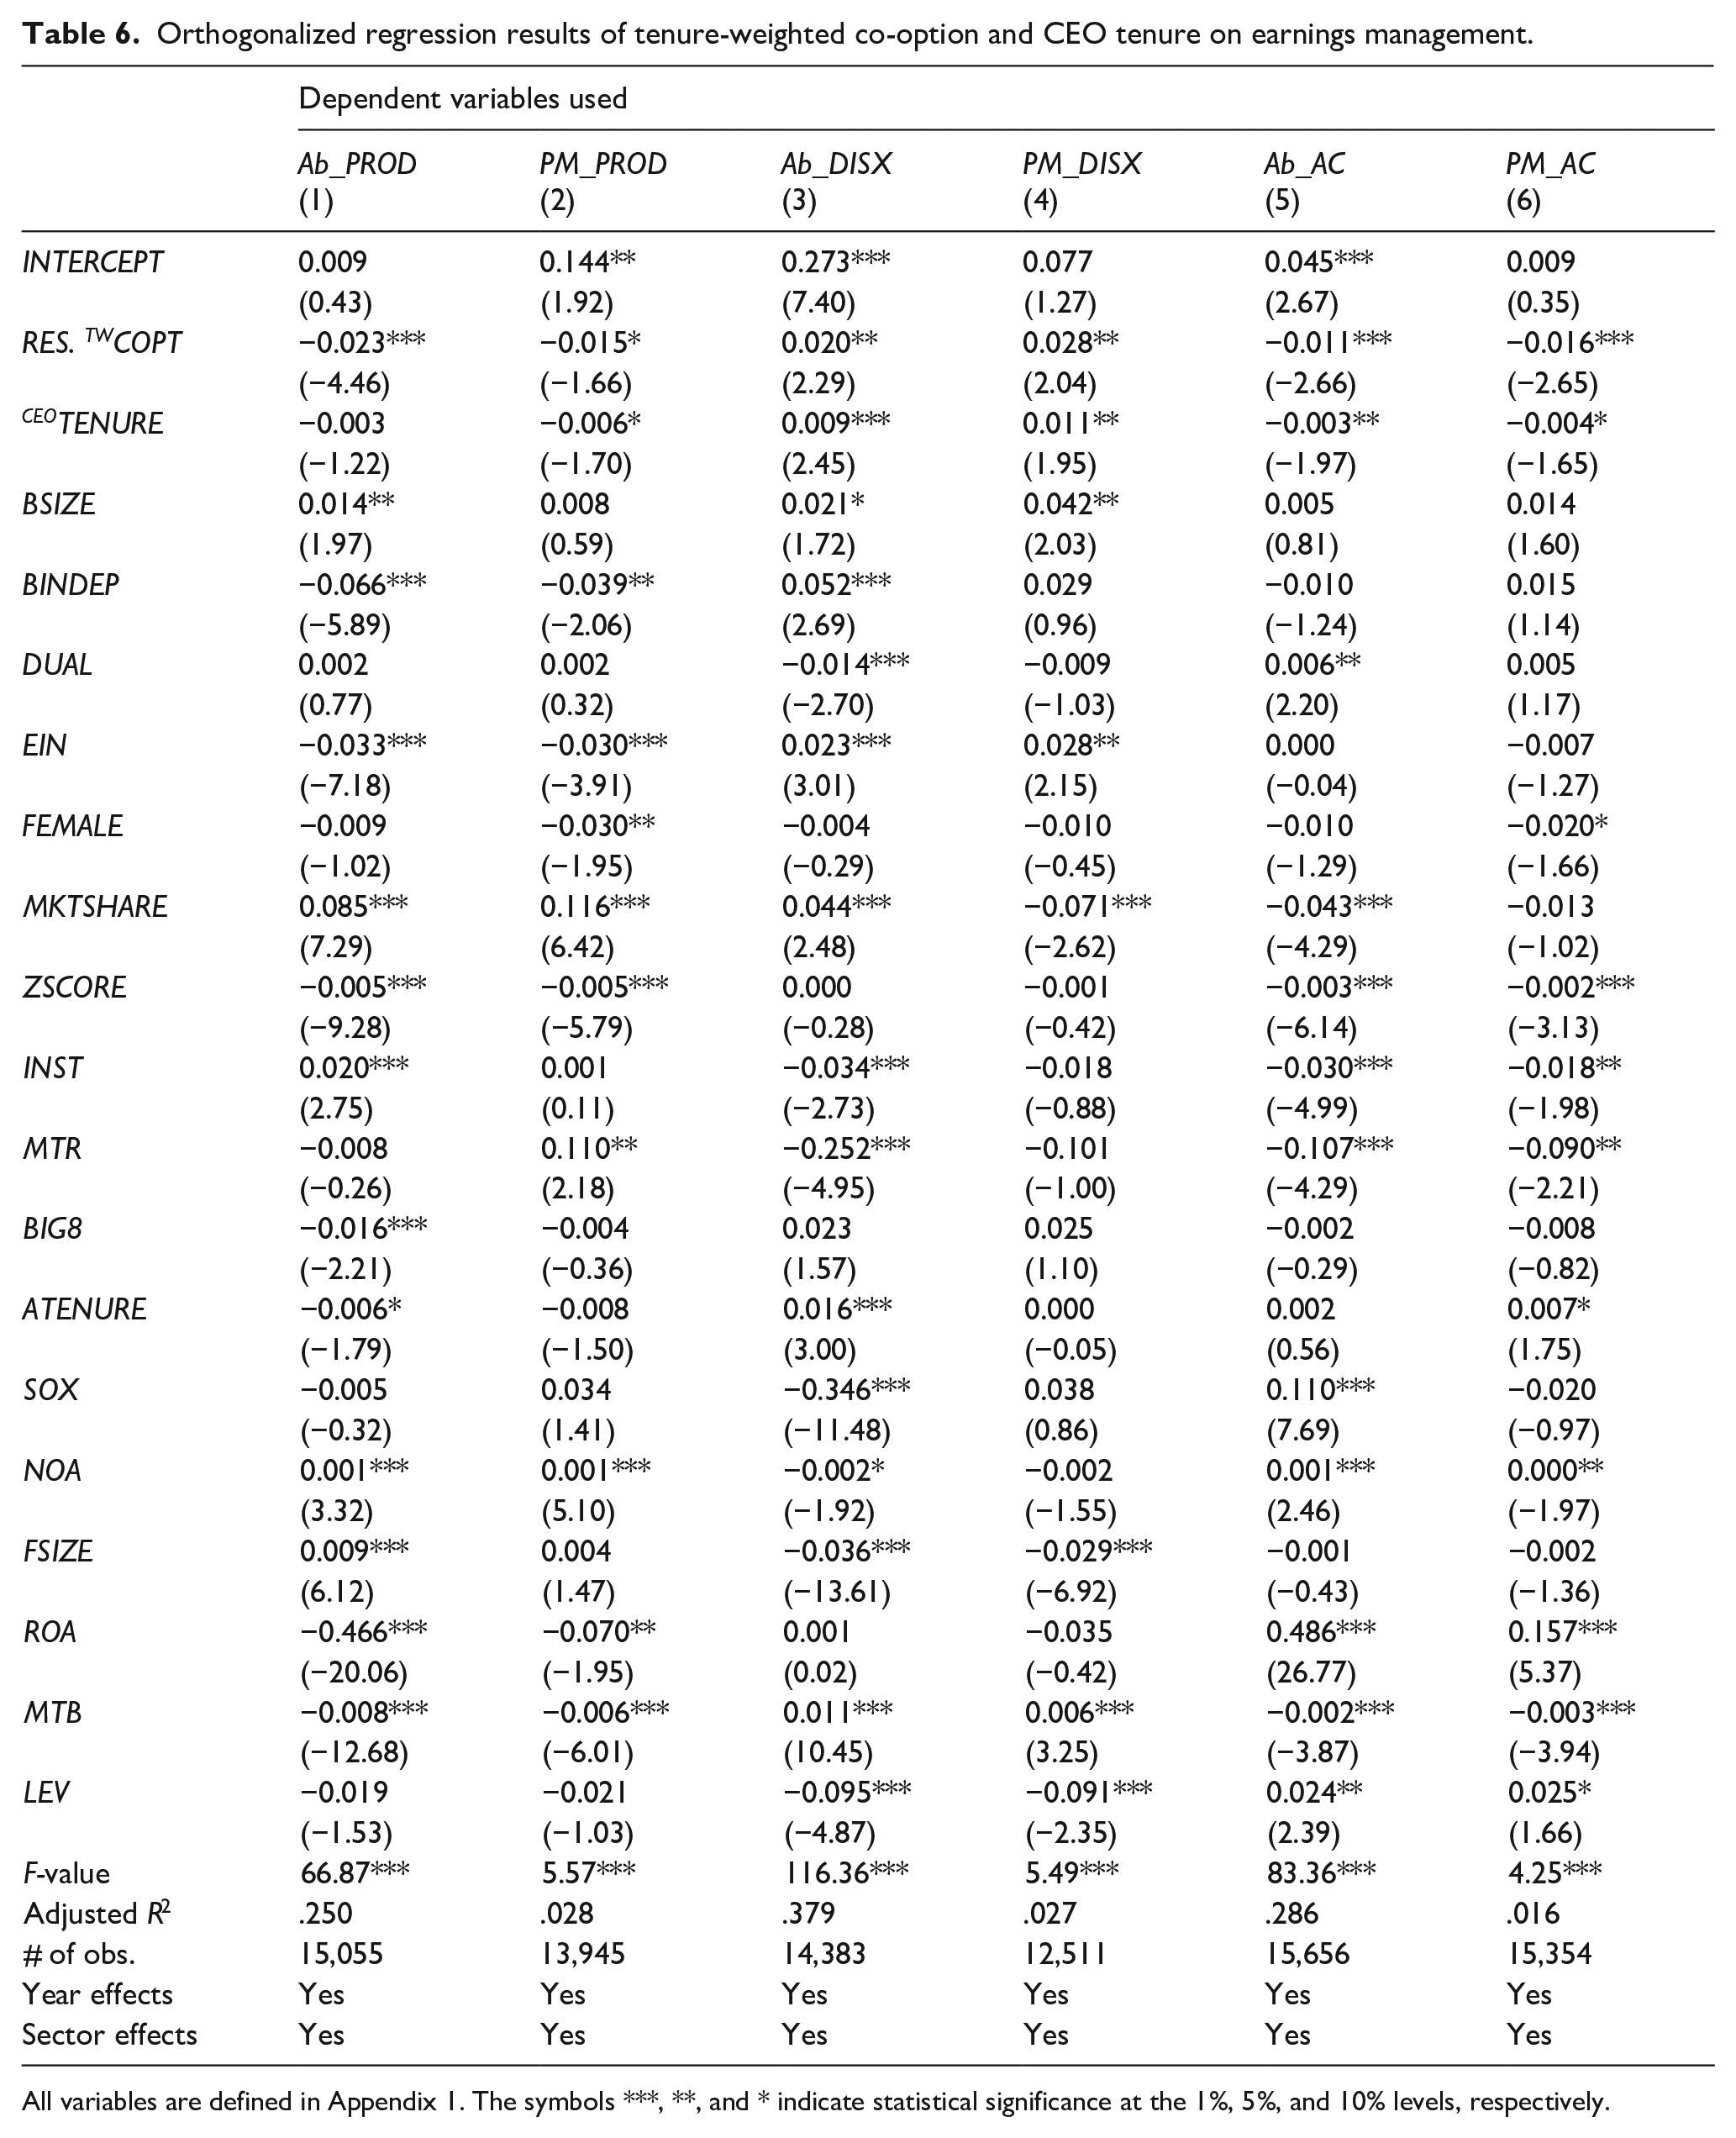
We present the orthogonalized results in Table 6. Models 1 to 6 showcase the regression results where Ab_PROD, PM_PROD, Ab_DISX, PM_DISX, Ab_AC, and PM_AC are used as the dependent variables, respectively. The results of each model consistently show that the impact of co-option on both real and accrual-based earnings management remains negative and highly significant even after decoupling co-option for CEO tenure effects. Yet, the impact that board co-option exhorts on earnings management declines after isolating the CEO tenure effect. The coefficients on the various co-option variables are now notably lower, but largely significant at the 5% level or better. Nevertheless, these findings confirm the validity of our main results and demonstrate that they are not capturing the impact of CEO tenure. Moreover, in Columns (2) to (6) there is significant evidence indicating that CEOs with longer tenure manage earnings less than other CEOs. Hence, co-option has a clear negative effect on earnings management that is distinct from CEO tenure. The coefficients on several control variables are also significant, and overall they exhibit their expected signs.
Orthogonalized regression results of tenure-weighted co-option and CEO tenure on earnings management.
All variables are defined in Appendix 1. The symbols ***, **, and * indicate statistical significance at the 1%, 5%, and 10% levels, respectively.
Heckman’s two-step procedure
Considering that the composition of the board can affect the likelihood that a firm will engage in earnings management (see Xie et al., 2003), another potential concern is selection bias. We address this issue by employing Heckman’s (1979) two-step procedure. In the first step, we estimate the following logit model to explain firms suspected of earnings management
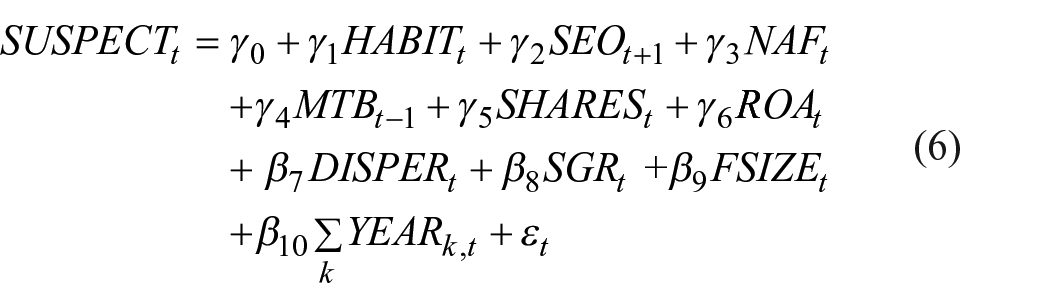
where SUSPECTt is an indicator variable equal to 1 if the firm just beats or meets its earnings benchmark; 0 otherwise. Appendix 1 provides the definitions of the other variables used in the model. We obtained the inverse Mills ratio (INVMILLS) from the first-step regression. In the second step, we include INVMILLS as an additional control variable in the orthogonalization model outlined in equation (5) as a correction for any potential selection bias.
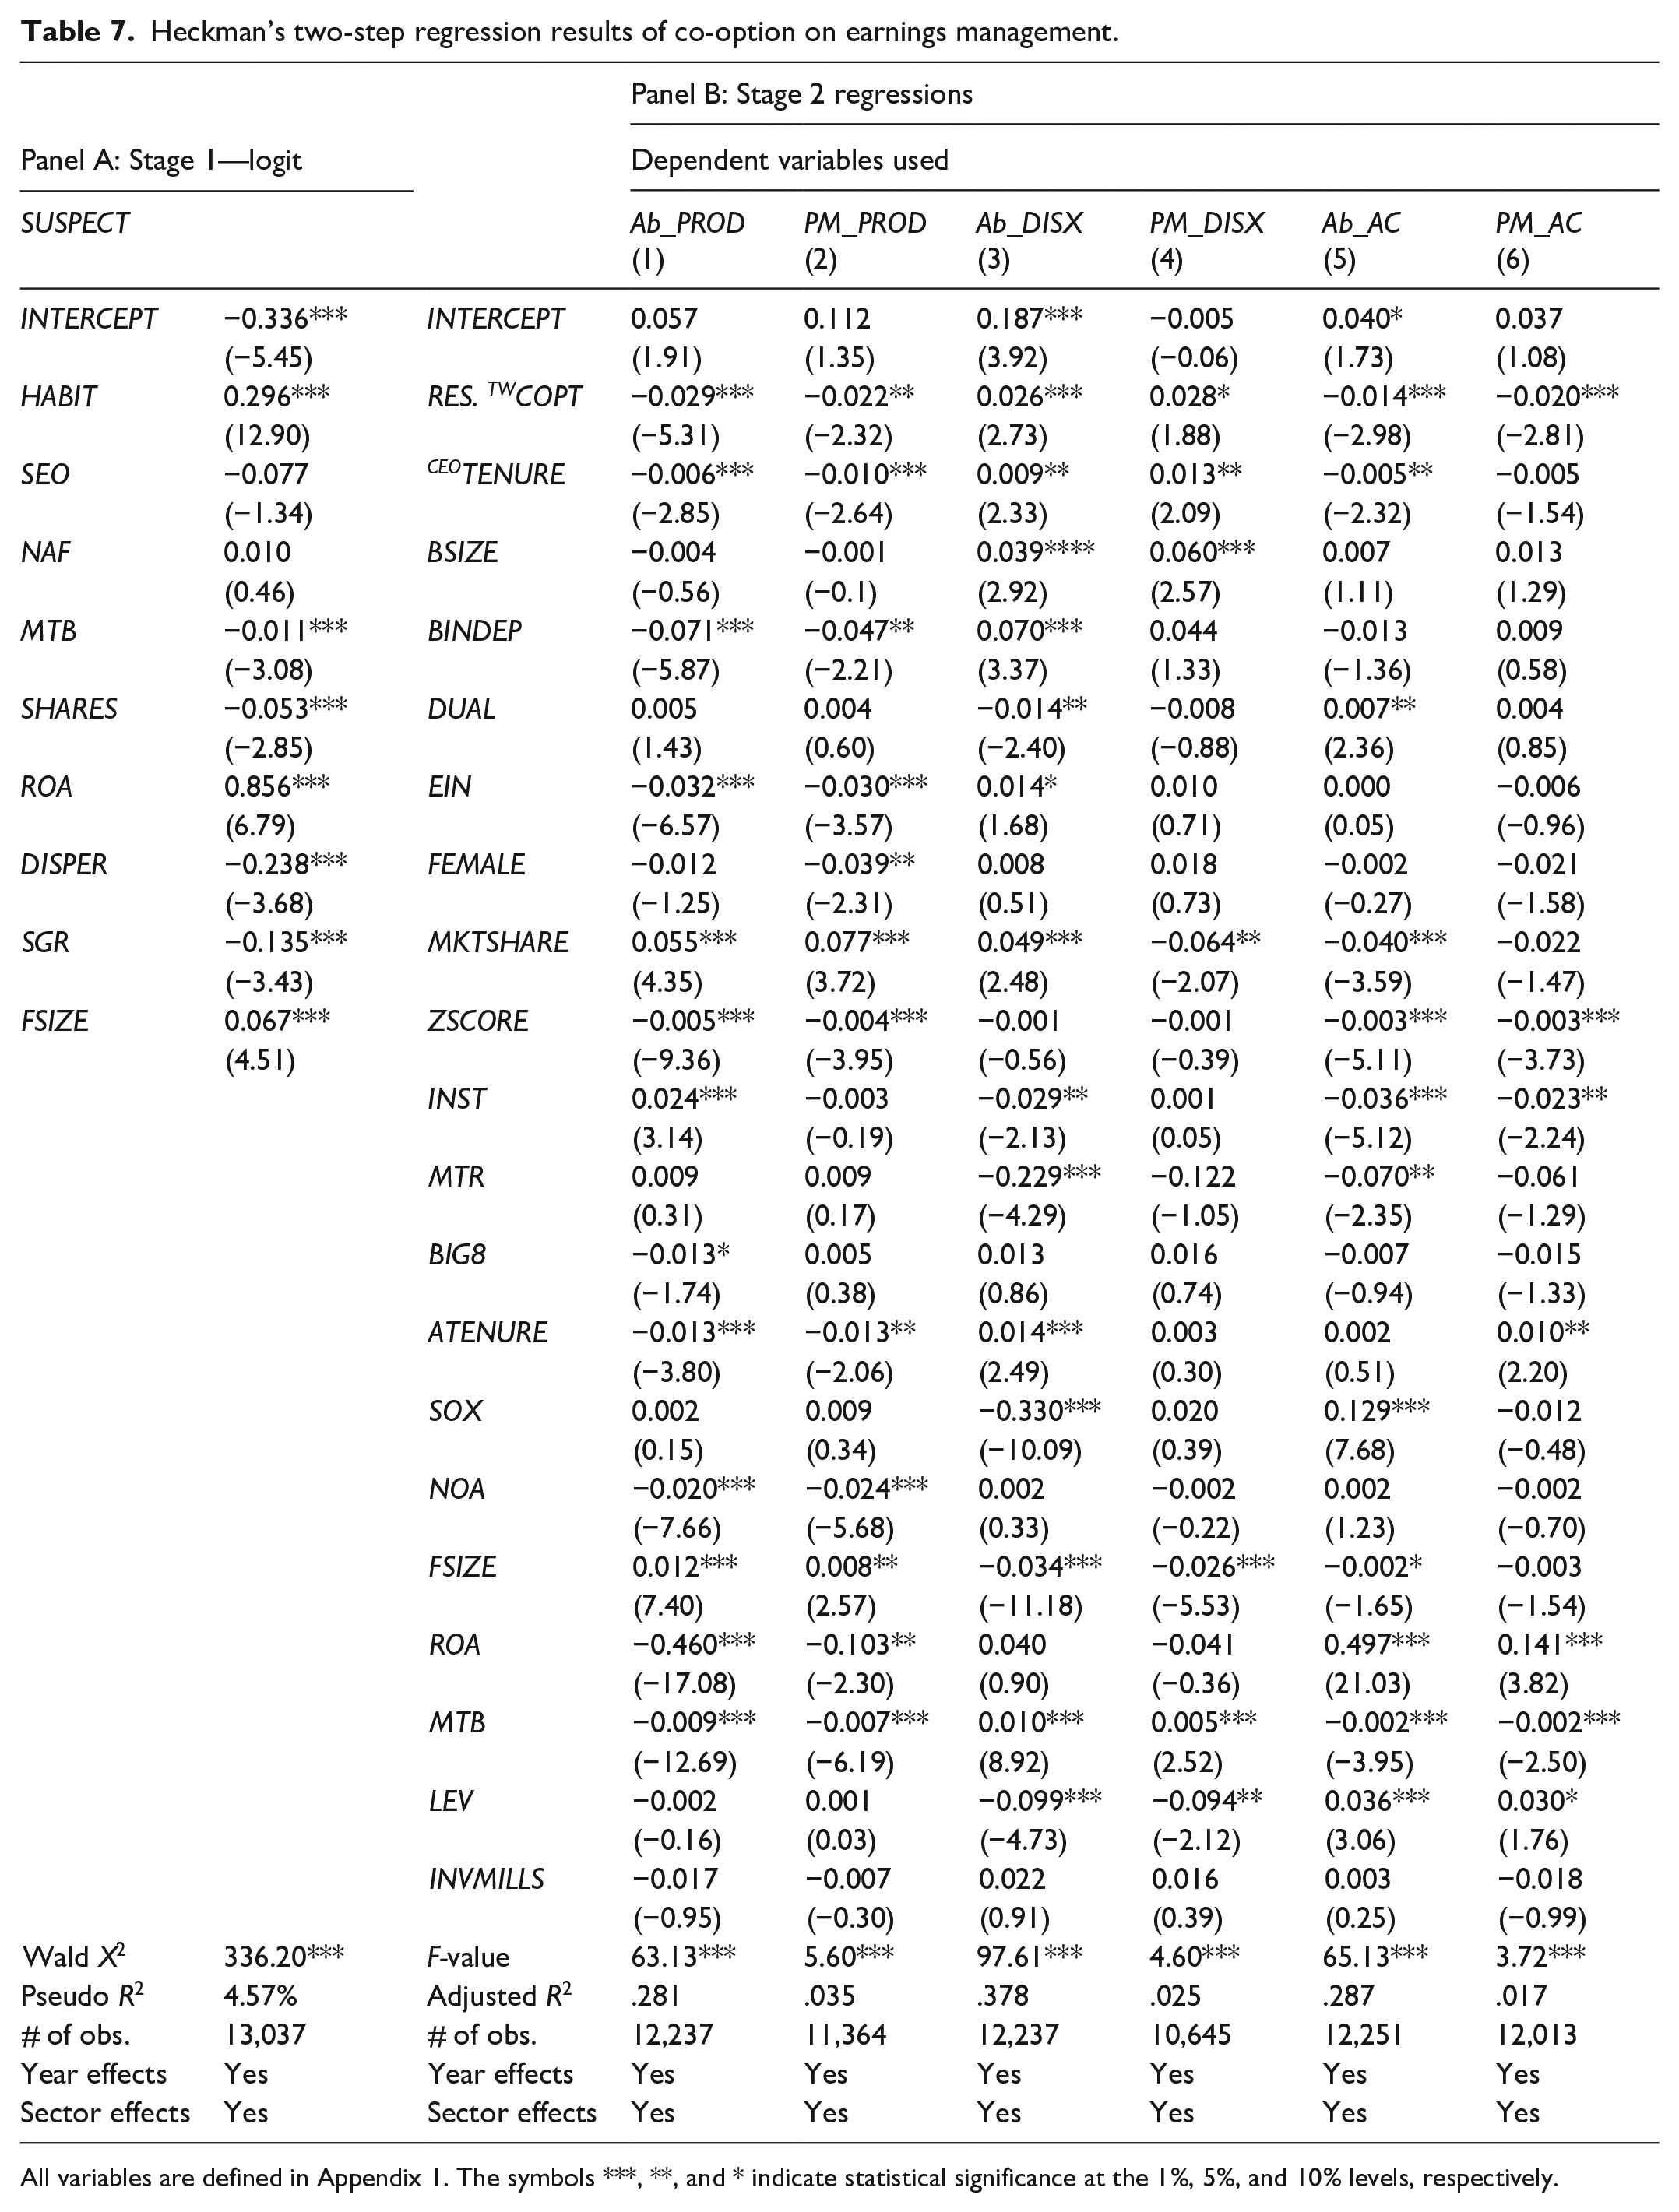
Table 7 summarizes the results of Heckman’s two-step procedure. Panel A reports the estimation results for the first-step logit model. The coefficient of the HABIT variable is positive and highly significant. This result shows that firms that consistently meet or beat earnings expectations in the past have a stronger incentive to engage in earnings management in the current period. Also, larger firms (FSIZE) and firms with higher profitability (ROA) are more likely to manage their earnings. However, a larger number of shares outstanding (SHARES), higher growth prospects (MTB), greater dispersion in analysts’ forecasts (DISPER), and higher sales growth (SGR) significantly reduce managers’ propensity to misreport.
Heckman’s two-step regression results of co-option on earnings management.
All variables are defined in Appendix 1. The symbols ***, **, and * indicate statistical significance at the 1%, 5%, and 10% levels, respectively.
Panel B shows the second-stage regression results for the different earnings management variables. Models 1−6 employ Ab_PROD, PM_PROD, Ab_DISX, PM_DISX, Ab_AC, and PM_AC as the dependent variables, respectively. The negative coefficients on RES.TWCOPT in the Ab_PROD and Ab_AC models and the positive coefficient on Ab_DISX models are highly significant at the 1% level and favor the hypothesis that board co-option mitigates earnings management. Thus, even after correcting for any self-selection bias and isolating the CEO tenure effect, residual co-option solicits a strong negative influence on earnings management. The coefficient on the Heckman’s correction factor (INVMILLS) is not statistically significant. This result suggests that selectivity bias is not a major concern for our sample firms. Furthermore, the results continue to hold when performance-matched earnings management variables are employed. These findings bolster the argument that co-option reduces managers’ short-termist attitude, and provides strong support for the job security explanation of earnings management (see Chen, Cheng, et al., 2015; Chintrakarn et al., 2016).
Trade-off between real activities and accrual management
As a final point, Zang (2012) reports that managers “fine-tune” accruals at fiscal year-end based on the outcome of their real activities manipulation during the fiscal year. She documents a sequential relationship between the two types of earnings management in which managers adjust discretionary accruals at fiscal year-end based on their realized real activities management during the fiscal year. The rationale is that because real activities manipulation changes actual business transactions, these activities take place during the fiscal year, whereas accruals are manipulated after the fiscal year-end.
In this section, we check the robustness of our findings under this trade-off framework. We take advantage of the model developed by Zang (2012) that accounts for the interchange between total real activities manipulation and accrual manipulation based on their relative costs. As suggested by studies like A. Cohen and Zarowin (2010), Farooqi et al. (2014), Zang (2012), and others, we combine the two real activities manipulation variables into a comprehensive proxy of the total real earnings management. More specifically, as in earlier studies, we multiply Ab_DISX by −1 such that higher values indicate greater cuts in discretionary expenses to manage earnings upwards and then add it to Ab_PROD to construct total real earnings management (denoted REM). Consequently, higher values of REM suggest more real earnings management. As is customary in the literature, we use the discretionary accruals estimated from equation (3) to gauge the total accrual-based earnings management, which is henceforth denoted AEM.
Pursuant to Zang (2012), we estimate the following trade-off model
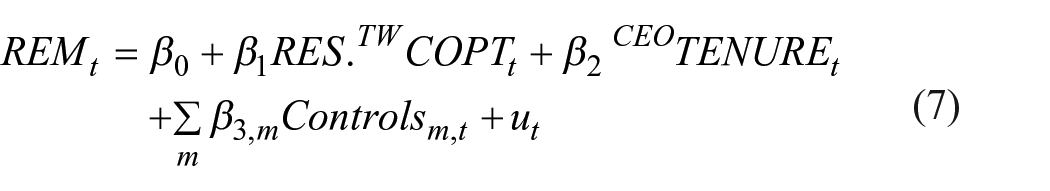
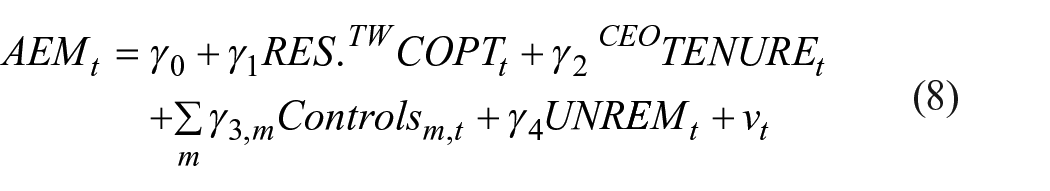
In this framework, we accordingly control for unexpected real activities manipulation in the accruals-based earnings management model in equation (8); hence, UNREMt is the estimated residual from the total real earnings management model in equation (7). All the control variables in the trade-off model are as described earlier, and the model includes sector-year fixed effects. The regression results are reported in Table 8.
Heckman’s two-step regression results of co-option on earnings management based on the trade-off approach.
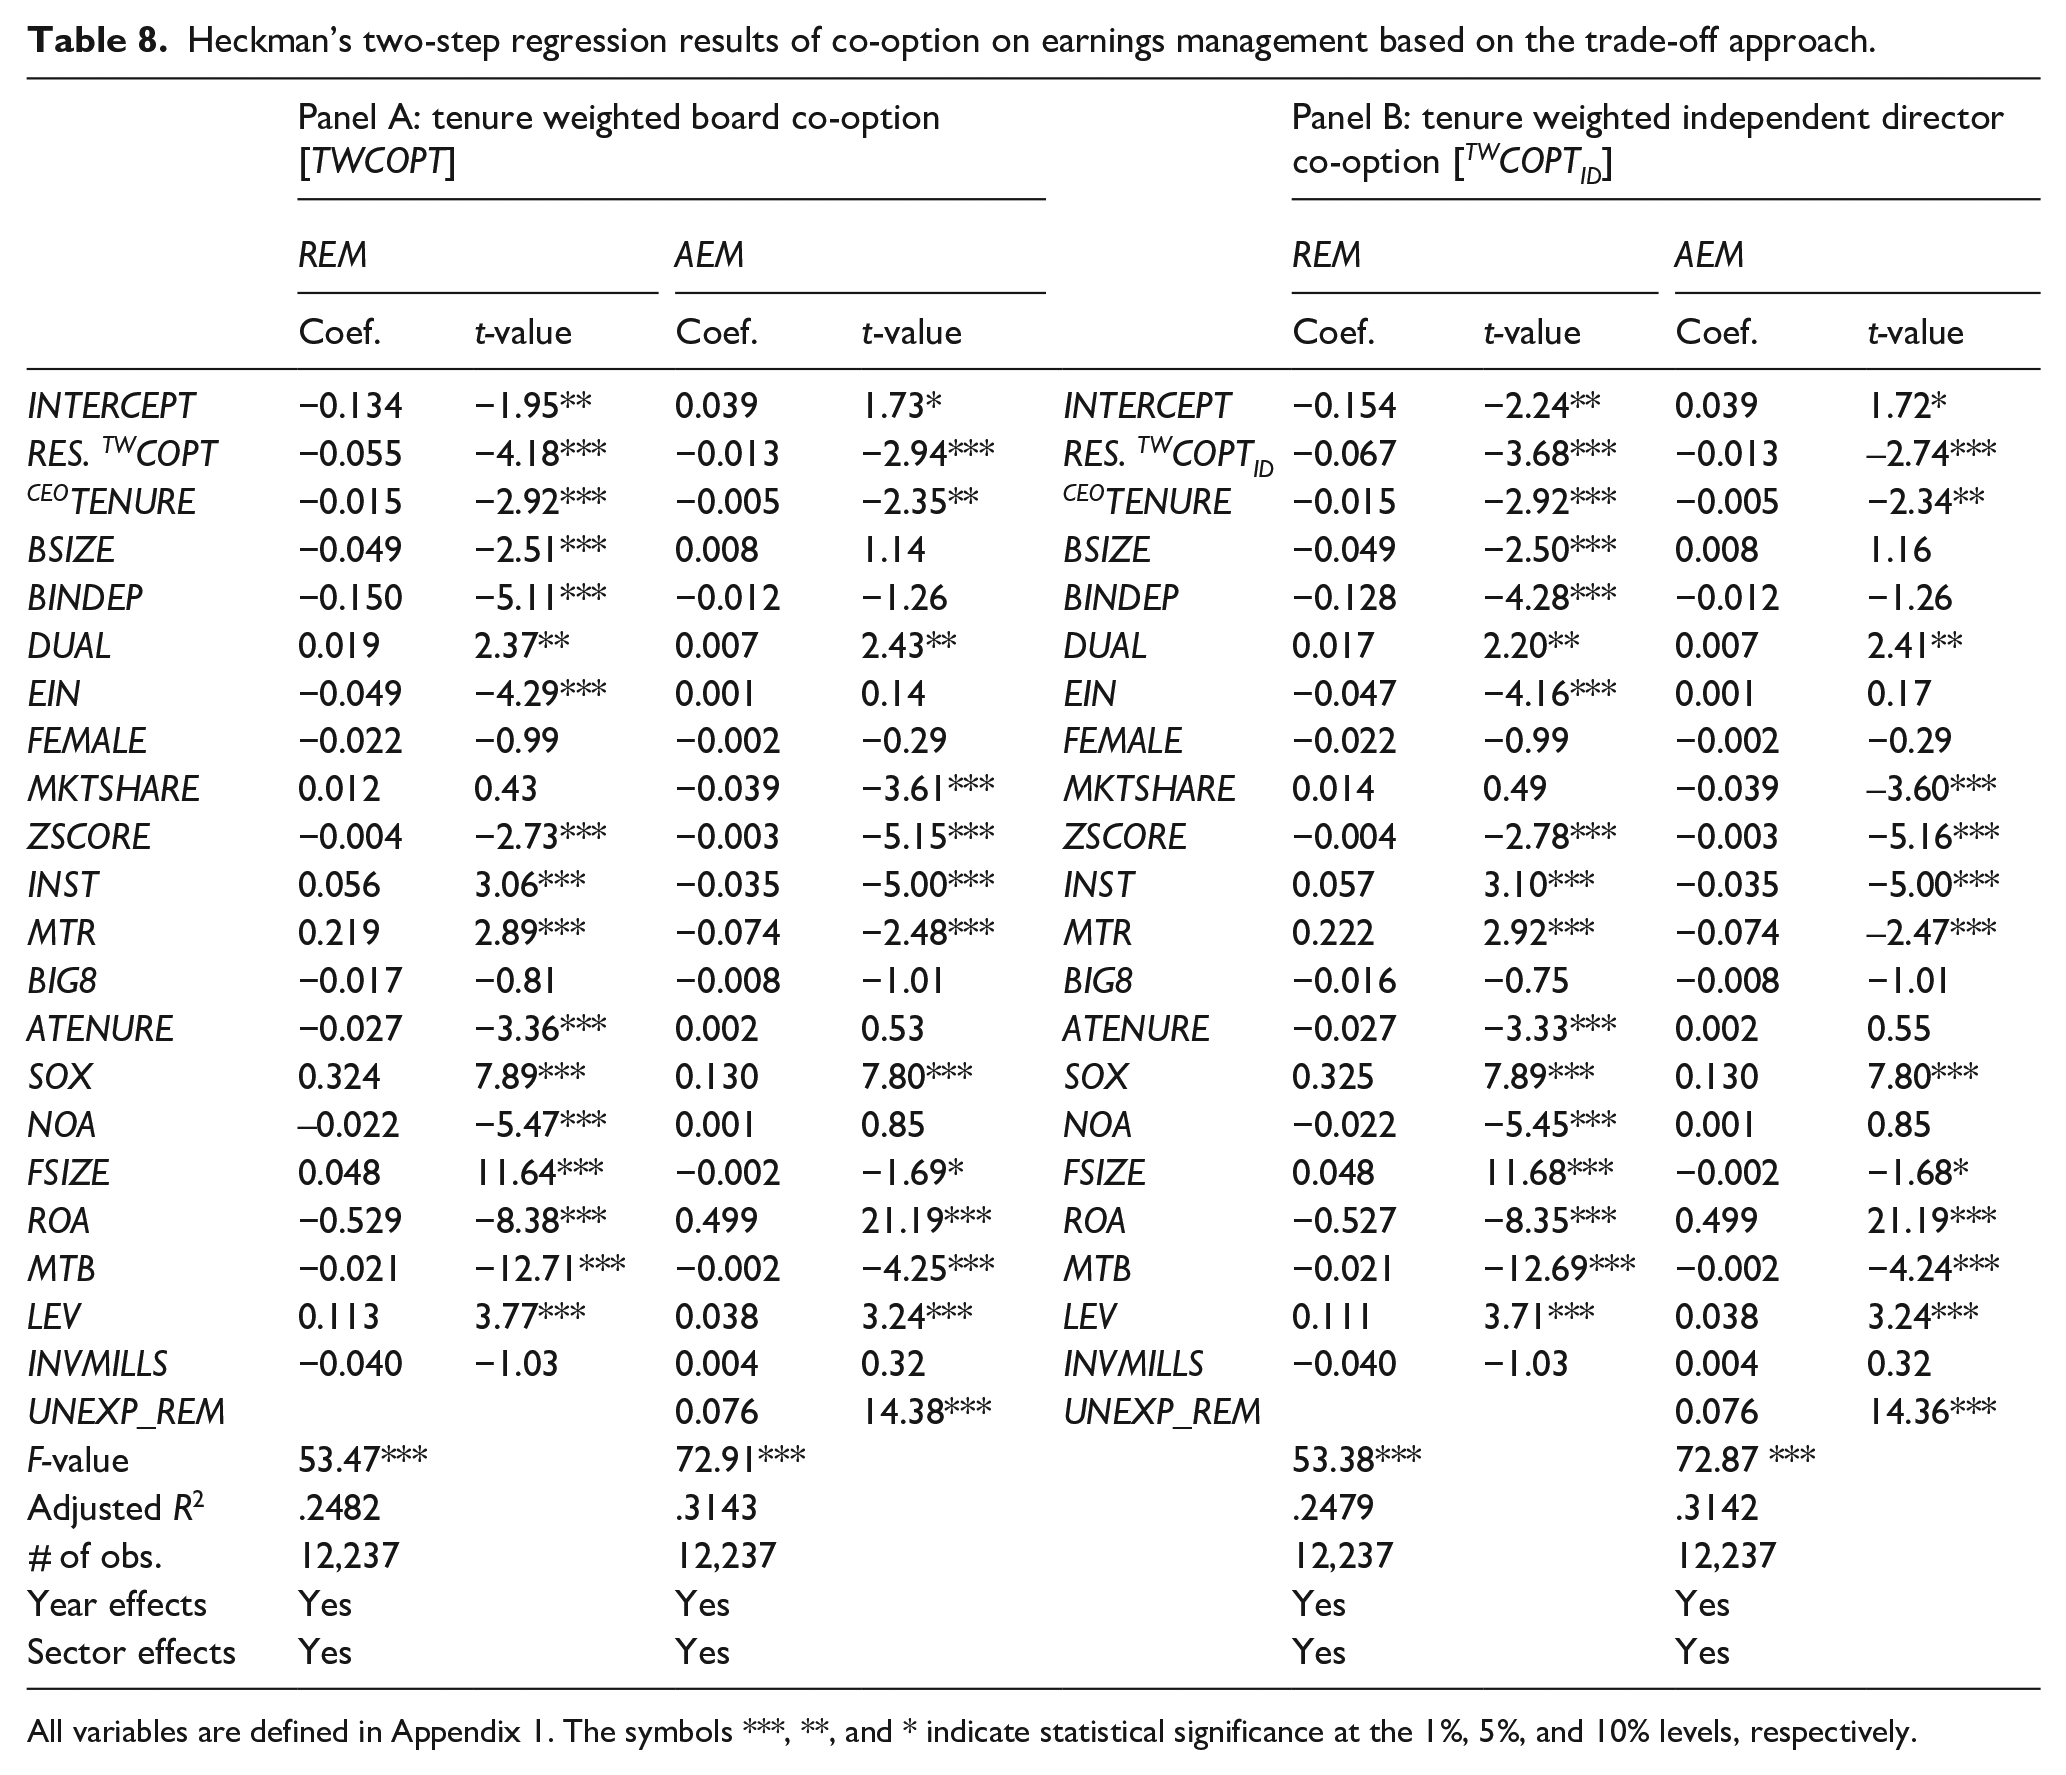
All variables are defined in Appendix 1. The symbols ***, **, and * indicate statistical significance at the 1%, 5%, and 10% levels, respectively.
Panels A and B report the results of the trade-off model for where residual tenure-weighted board co-option (RES.TWCOPT) and residual tenure-weighted independent director co-option (RES.TWCOPTID) are used as the main independent variables of interest. In Panel A, the coefficient on RES.TWCOPT is −0.055 and statistically significant at 1% (t-value of −4.18) for the total real earnings management variable REM and −0.013 and statistically significant at 1% (t-value of −2.94) for the accrual management variable AEM. Panel B portrays similar results for the alternative co-option variable RES.TWCOPTID. These findings collectively suggest that board co-option has a significant and negative effect on firms’ involvement in earnings management entirely. Notwithstanding prior studies reporting a decrease in accruals management in the post-SOX in favor of more real activities management, we provide strong evidence that both types of earnings management decline in firms with more co-option as a corollary of reduced short-termist behavior arising from better job security. These results are also robust to endogeneity and potential selectivity bias.
Board co-option, earnings management, and a subsequent forced CEO turnover
Prior research indicates that co-option reduces managers’ turnover risk. For instance, Nguyen et al. (2020) suggest that co-option insulates managers from career concerns because co-opted boards promote incentive contracts that motivate innovation. Coles et al. (2014) show that the probability of a forced CEO turnover is lower when the board is co-opted; this buttresses the argument that managers with more co-opted directors are less likely to be removed from office (see Chintrakarn et al., 2016). Notwithstanding, Hazarika et al. (2012) suggest that corporate boards act proactively to terminate executives who aggressively manage earnings before the manipulation leads to costly external consequences. They report a positive association between accruals management and forced CEO turnovers in the subsequent year. 8
However, Hazarika et al. (2012) do not consider the potential mitigating effects of co-opted directors’ allegiance to the CEO on dismissal risk. Nor does their study consider real activities-based earnings management. Yet, executives increasingly manage earnings in the post-SOX environment through real business activities instead of accruals because the former is more difficult to detect (see D. A. Cohen et al., 2008). So, we build upon prior studies in this section of the manuscript by jointly relate co-option and earnings management to CEO turnover.
Hazarika et al. (2012) suggest that earnings management is costly because it reduces transparency and increases the probability that firms (1) restate earnings, (2) face sanctions from the Securities and Exchange Commission, or (3) suffer adverse publicity. Hence, they argue that managers who decrease the transparency of their financial reports face an increased risk of ouster from office. Even so, Cheng et al. (2016) point out that executives manage earnings due to career concerns since short-term performance is used in their contracting. Therefore, executives often manage earnings to achieve certain targets. Chintrakarn et al. (2016) report that higher board co-option curtails managerial short-termist behavior because co-opted directors afford managers better job security. Likewise, Coles et al. (2014) and Nguyen et al. (2020) affirm that board co-option lowers managers’ employment risk. As a result, CEO may behave less myopically about managing earnings when they have more co-option related job security and may face lower dismissal risk than their counterparts when they do manage earnings owing to the greater fidelity from co-opted directors on the board. Hence, we posit that the likelihood of a forced CEO turnover for managing earnings is less pronounced in firms with greater board co-option.
We obtained data on forced CEO turnover from the Wharton Research Data Services (WRDS) Forced CEO Turnover database as provided by Peters and Wagner (2014). The dataset contains the dates of forced CEO turnovers (not voluntary turnover) of all firms recorded in the ExecuComp. Our sample size is reduced because the database covers the period between 2001 and 2016. The WRDS research team underscores that an important feature of this dataset is that it records forced turnovers also for the cases where a company is dropped from ExecuComp as of year t to year t + 1. As a result, all firm-year observations from ExecuComp that are not coded as “forced” in this dataset are either no turnovers or voluntary turnovers. The criteria for classifying a CEO turnover as forced are described in detail in Peters and Wagner (2014). We augment the dataset with ExecuComp to identify voluntary removals.
Our inquiry relates a CEO turnover to the previous year’s earning management, which results in 423 forced turnovers and 2348 voluntary turnovers over the revised sample period from 2001 to 2015. These data largely cover the post-SOX period, an era of enhanced regulatory scrutiny that prompted managers to shift away from accounting maneuvers to manage earnings to more operational activities. We jointly relate board co-option and aggressive earnings management to CEO turnover using both multinomial logistic regression analyses and traditional logit regression analyses.
As in Hazarika et al. (2012), the dependent variable in the multinomial logit regressions (denoted TURNOVER) takes the value 2 if the CEO turnover in a given firm-year is classified as voluntary, 1 if the turnover is classified as forced, and 0 otherwise. We estimate a multinomial model of the general form
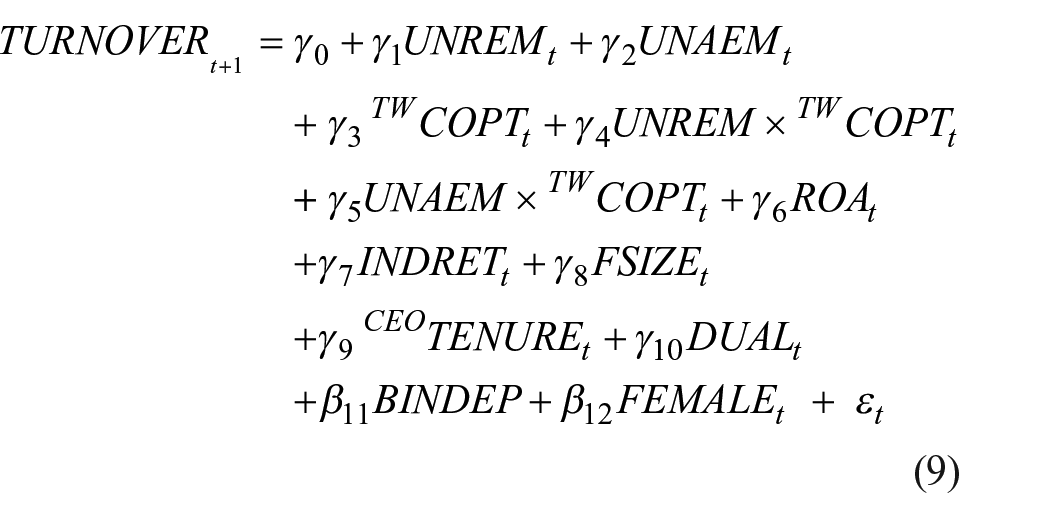
UNREM is the residual from equation (7) denoting unexpected real activities manipulation, and UNAEM is the residual from equation (8) denoting unexpected accrual management. Hermalin and Weisbach (2008) suggest that some level of earnings management is inevitable, so these excess earnings management measures are suitable for this inquiry. As aforementioned, TWCOPT denotes tenure-weighted board co-option, while UNREM × TWCOPT and UNAEM × TWCOPT are interaction terms between TWCOPT and the level of UNREM and UNAEM, respectively. The interactions capture the joint impact of co-option and excess earnings management on turnover.
We include a number of controls known to affect CEO turnover. As in earlier studies, we control for firm and industry-based performance. ROA is the ROA at fiscal year-end, while INDRET is the market-adjusted industry return (based on Fama-French 48 industries). We also control for firm size. In addition, we include several CEO-level and firm-governance control variables, including the CEO’s tenure, duality, and gender, as well as board independence. These control variables are as previously specified (see Appendix 1).
Analogously, we estimate the following logit regression
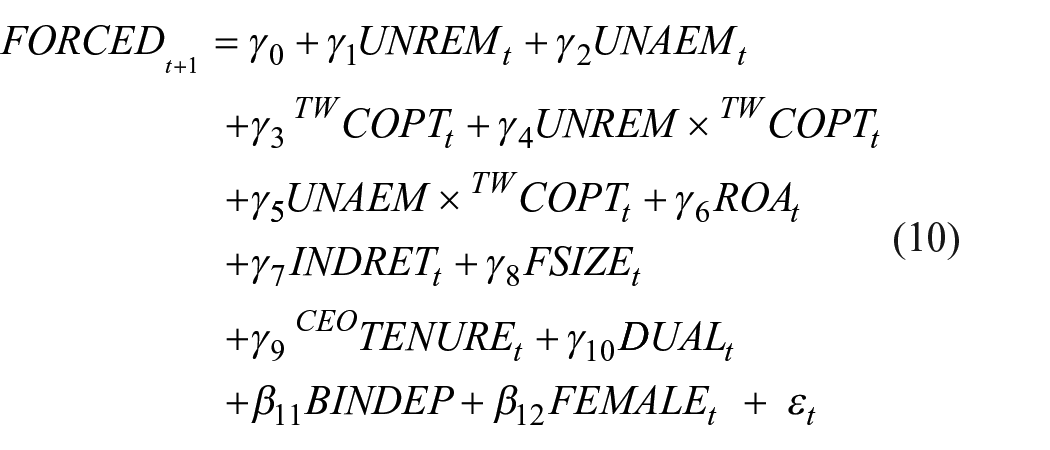
The dichotomous dependent variable (FORCED) takes the value of 1 if the turnover is classified as forced and the value of 0 if the turnover is voluntary. All the independent variables are as specified above.
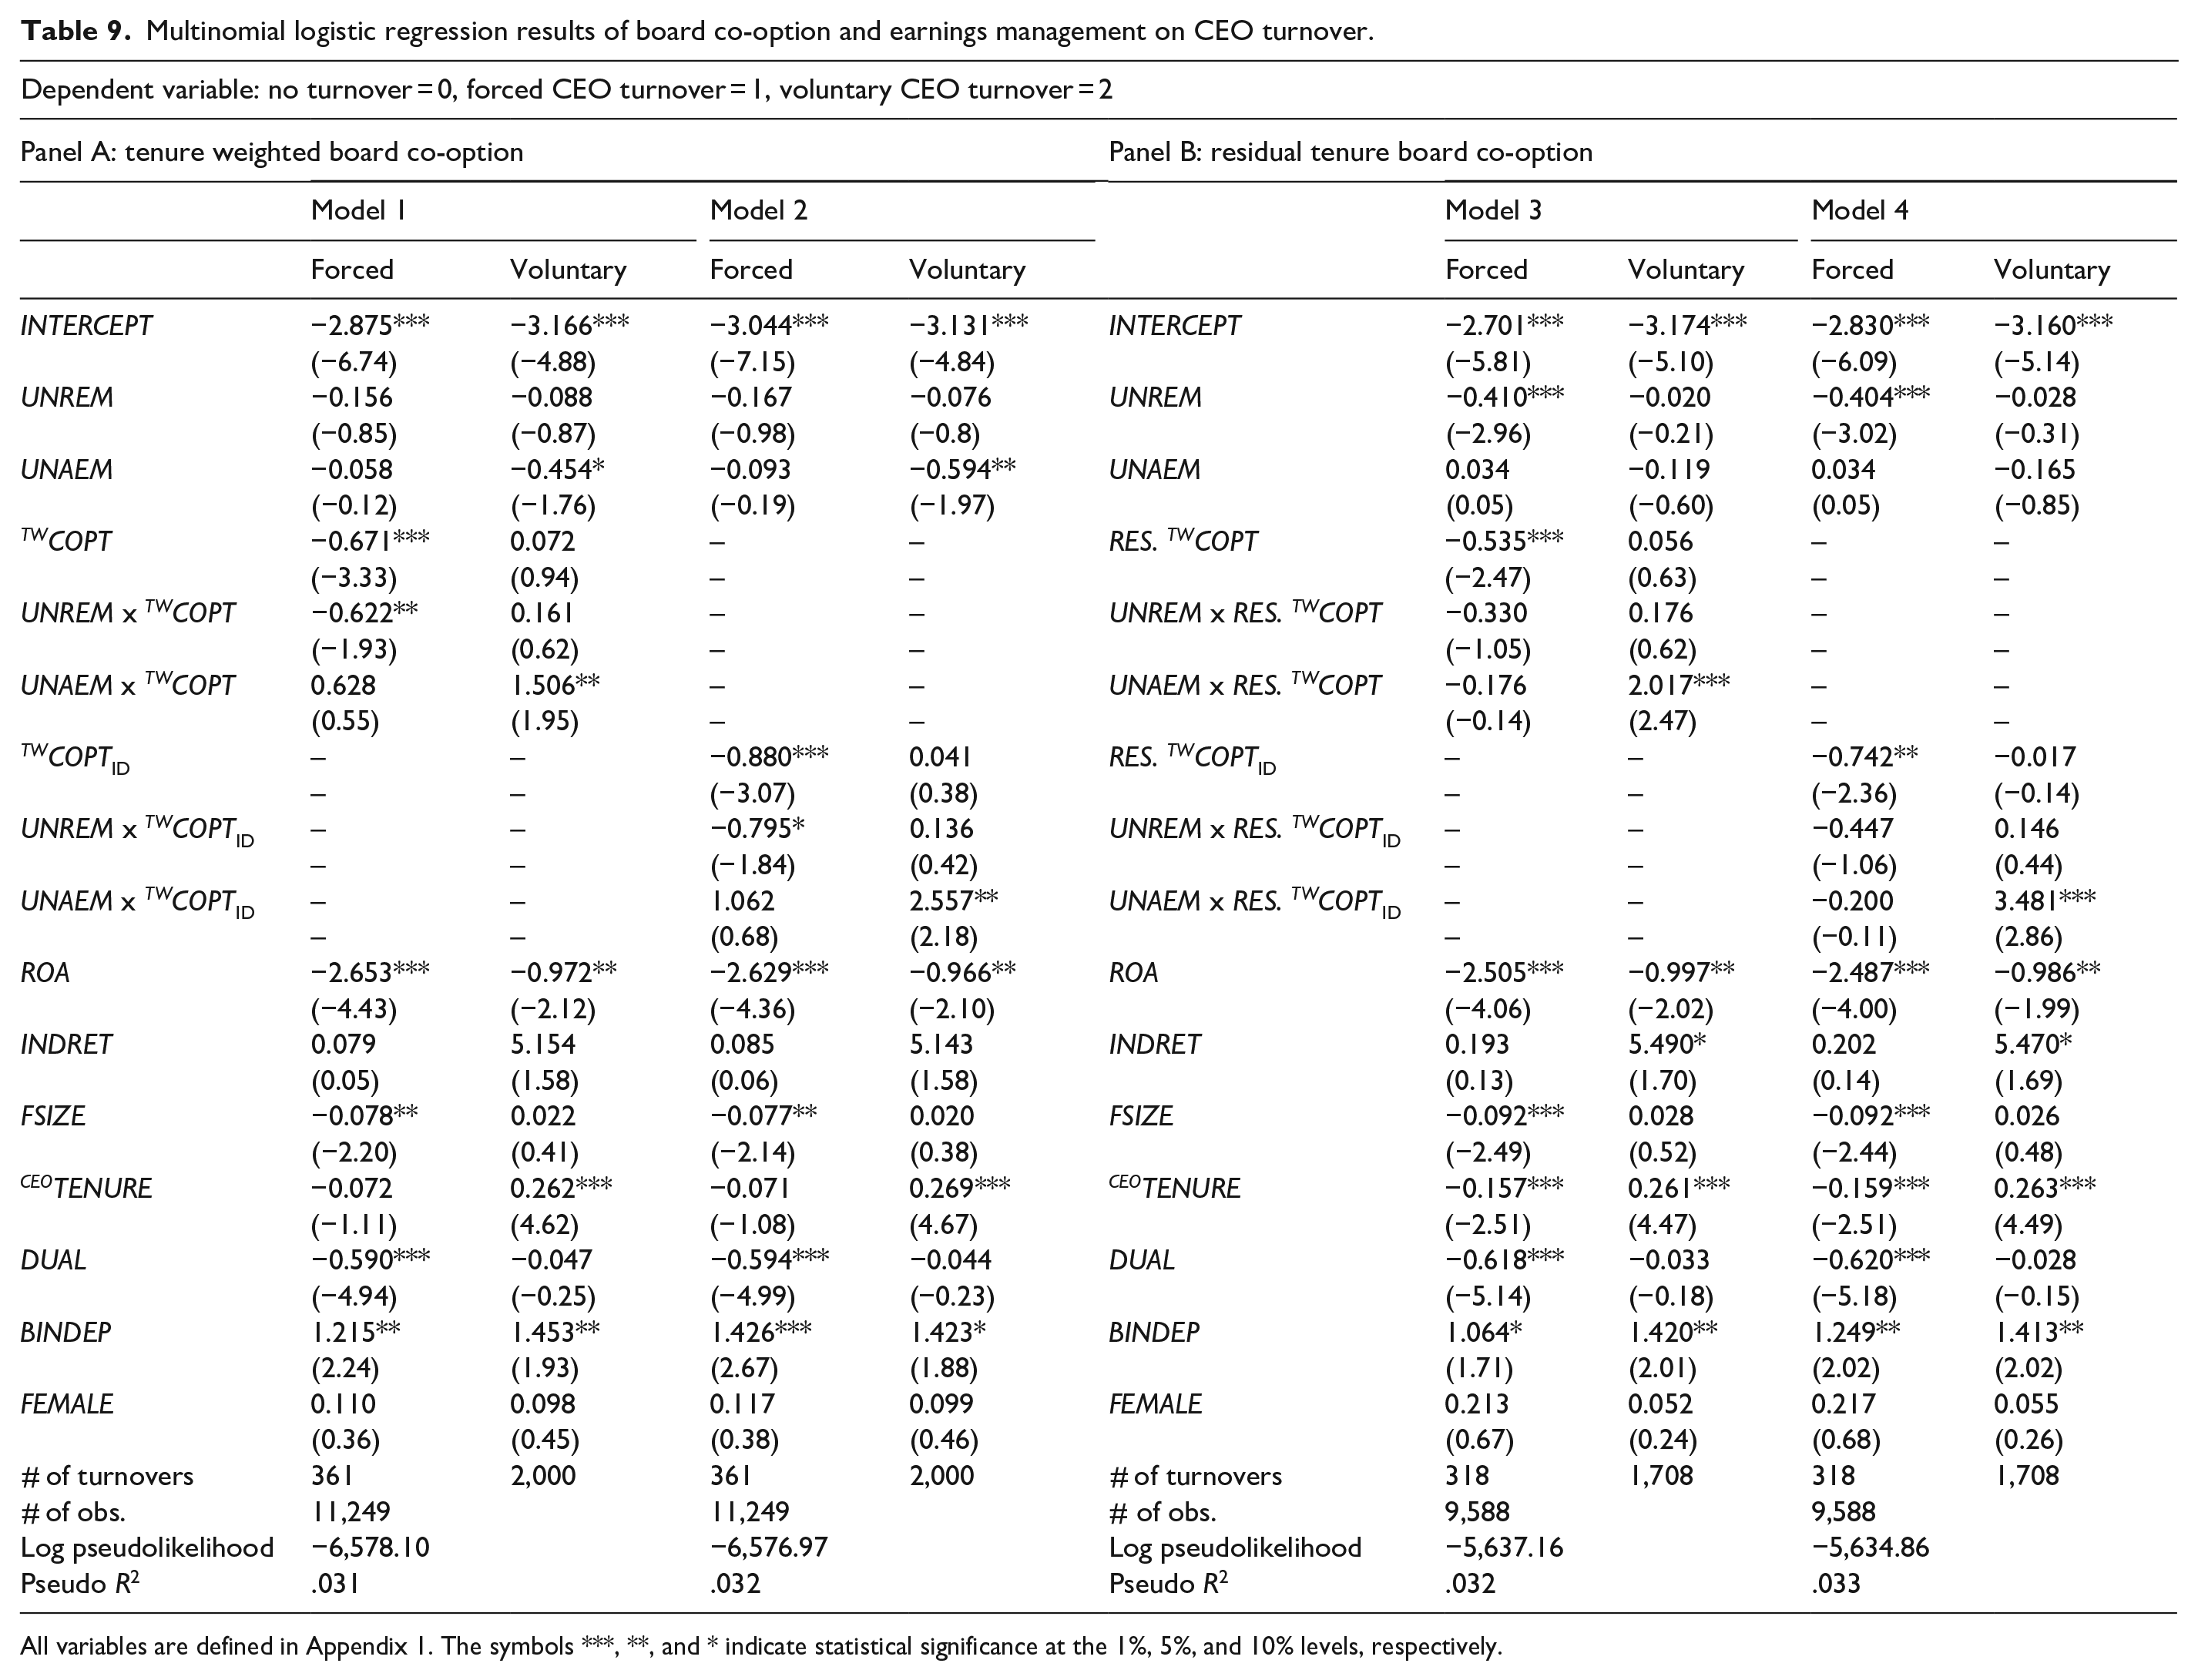
Table 9 presents the multinomial logit regression results. Model 1 in Panel A reports the results for the baseline model in equation (9), while Model 2 presents the results using tenure-weighted independent director co-option (TWCOPTID) as an alternative measure for board co-option. Panel B of the table provides the results based on the two corresponding residual co-option variables RES.TWCOPT (in Model 3) and RES.TWCOPTID (in Model 4) obtained from orthogonalizing board co-option against CEO tenure. As the results show, the coefficients on all four co-option variables are negative and significant for forced CEO turnover, and positive but insignificant for voluntary turnover. These findings are consistent with the view that co-opted directors are loyal to the CEO and less likely to force a removal from the office.
Multinomial logistic regression results of board co-option and earnings management on CEO turnover.
All variables are defined in Appendix 1. The symbols ***, **, and * indicate statistical significance at the 1%, 5%, and 10% levels, respectively.
The coefficients on UNREM ×TWCOPT and UNREM × TWCOPTID in Panel A are negative and significant for forced turnovers, and positive and insignificant for voluntary turnovers. Thus, real earnings management amplifies the impact of co-option on forced CEO turnover. Evidently, co-opted directors do not consider aggressive operational decisions made to manage earnings as grounds for a forced dismissal, especially since the CEO was involved in their appointment. This result is not surprising since real activities manipulation is hard to detect and allows less area for auditors, regulators, and investors to challenge financial reports. In fact, Panel B shows that the coefficients on UNREM ×RES.TWCOPT and UNREM ×RES. TWCOPTID are both insignificant, which further supports the view that co-opted directors do not pay much attention to real earnings management when deliberating a forced CEO removal.
Interestingly, the coefficients on UNAEM ×TWCOPT, UNAEM × TWCOPTID, UNAEM ×RES.TWCOPT, and UNAEM ×RES. TWCOPTID are positive and statistically significant for voluntary turnovers, but not for forced turnovers. These findings suggest that co-opted boards react to excess accrual manipulation presumably because accrual-based earnings management is easier to detect and can damage firm reputation. Even so, co-opted boards appear to ask CEOs to leave office voluntarily rather than to facilitate forced turnovers. Hence, we find only partial support for the argument that corporate boards act proactively to terminate managers that aggressively manage earnings (see Hazarika et al., 2012). Moreover, in contrast to the findings of Hazarika et al. (2012), the coefficient on the UNAEM variable is negative and significant for voluntary turnovers in Models 1 and 2, implying that CEOs are less likely to be removed from the office for managing earnings through accruals. This result may be due to the difference in sample periods. Specifically, they cover mostly a pre-SOX period (1992–2004) which is associated with less regulatory scrutiny, and thus more accrual-based earnings management.
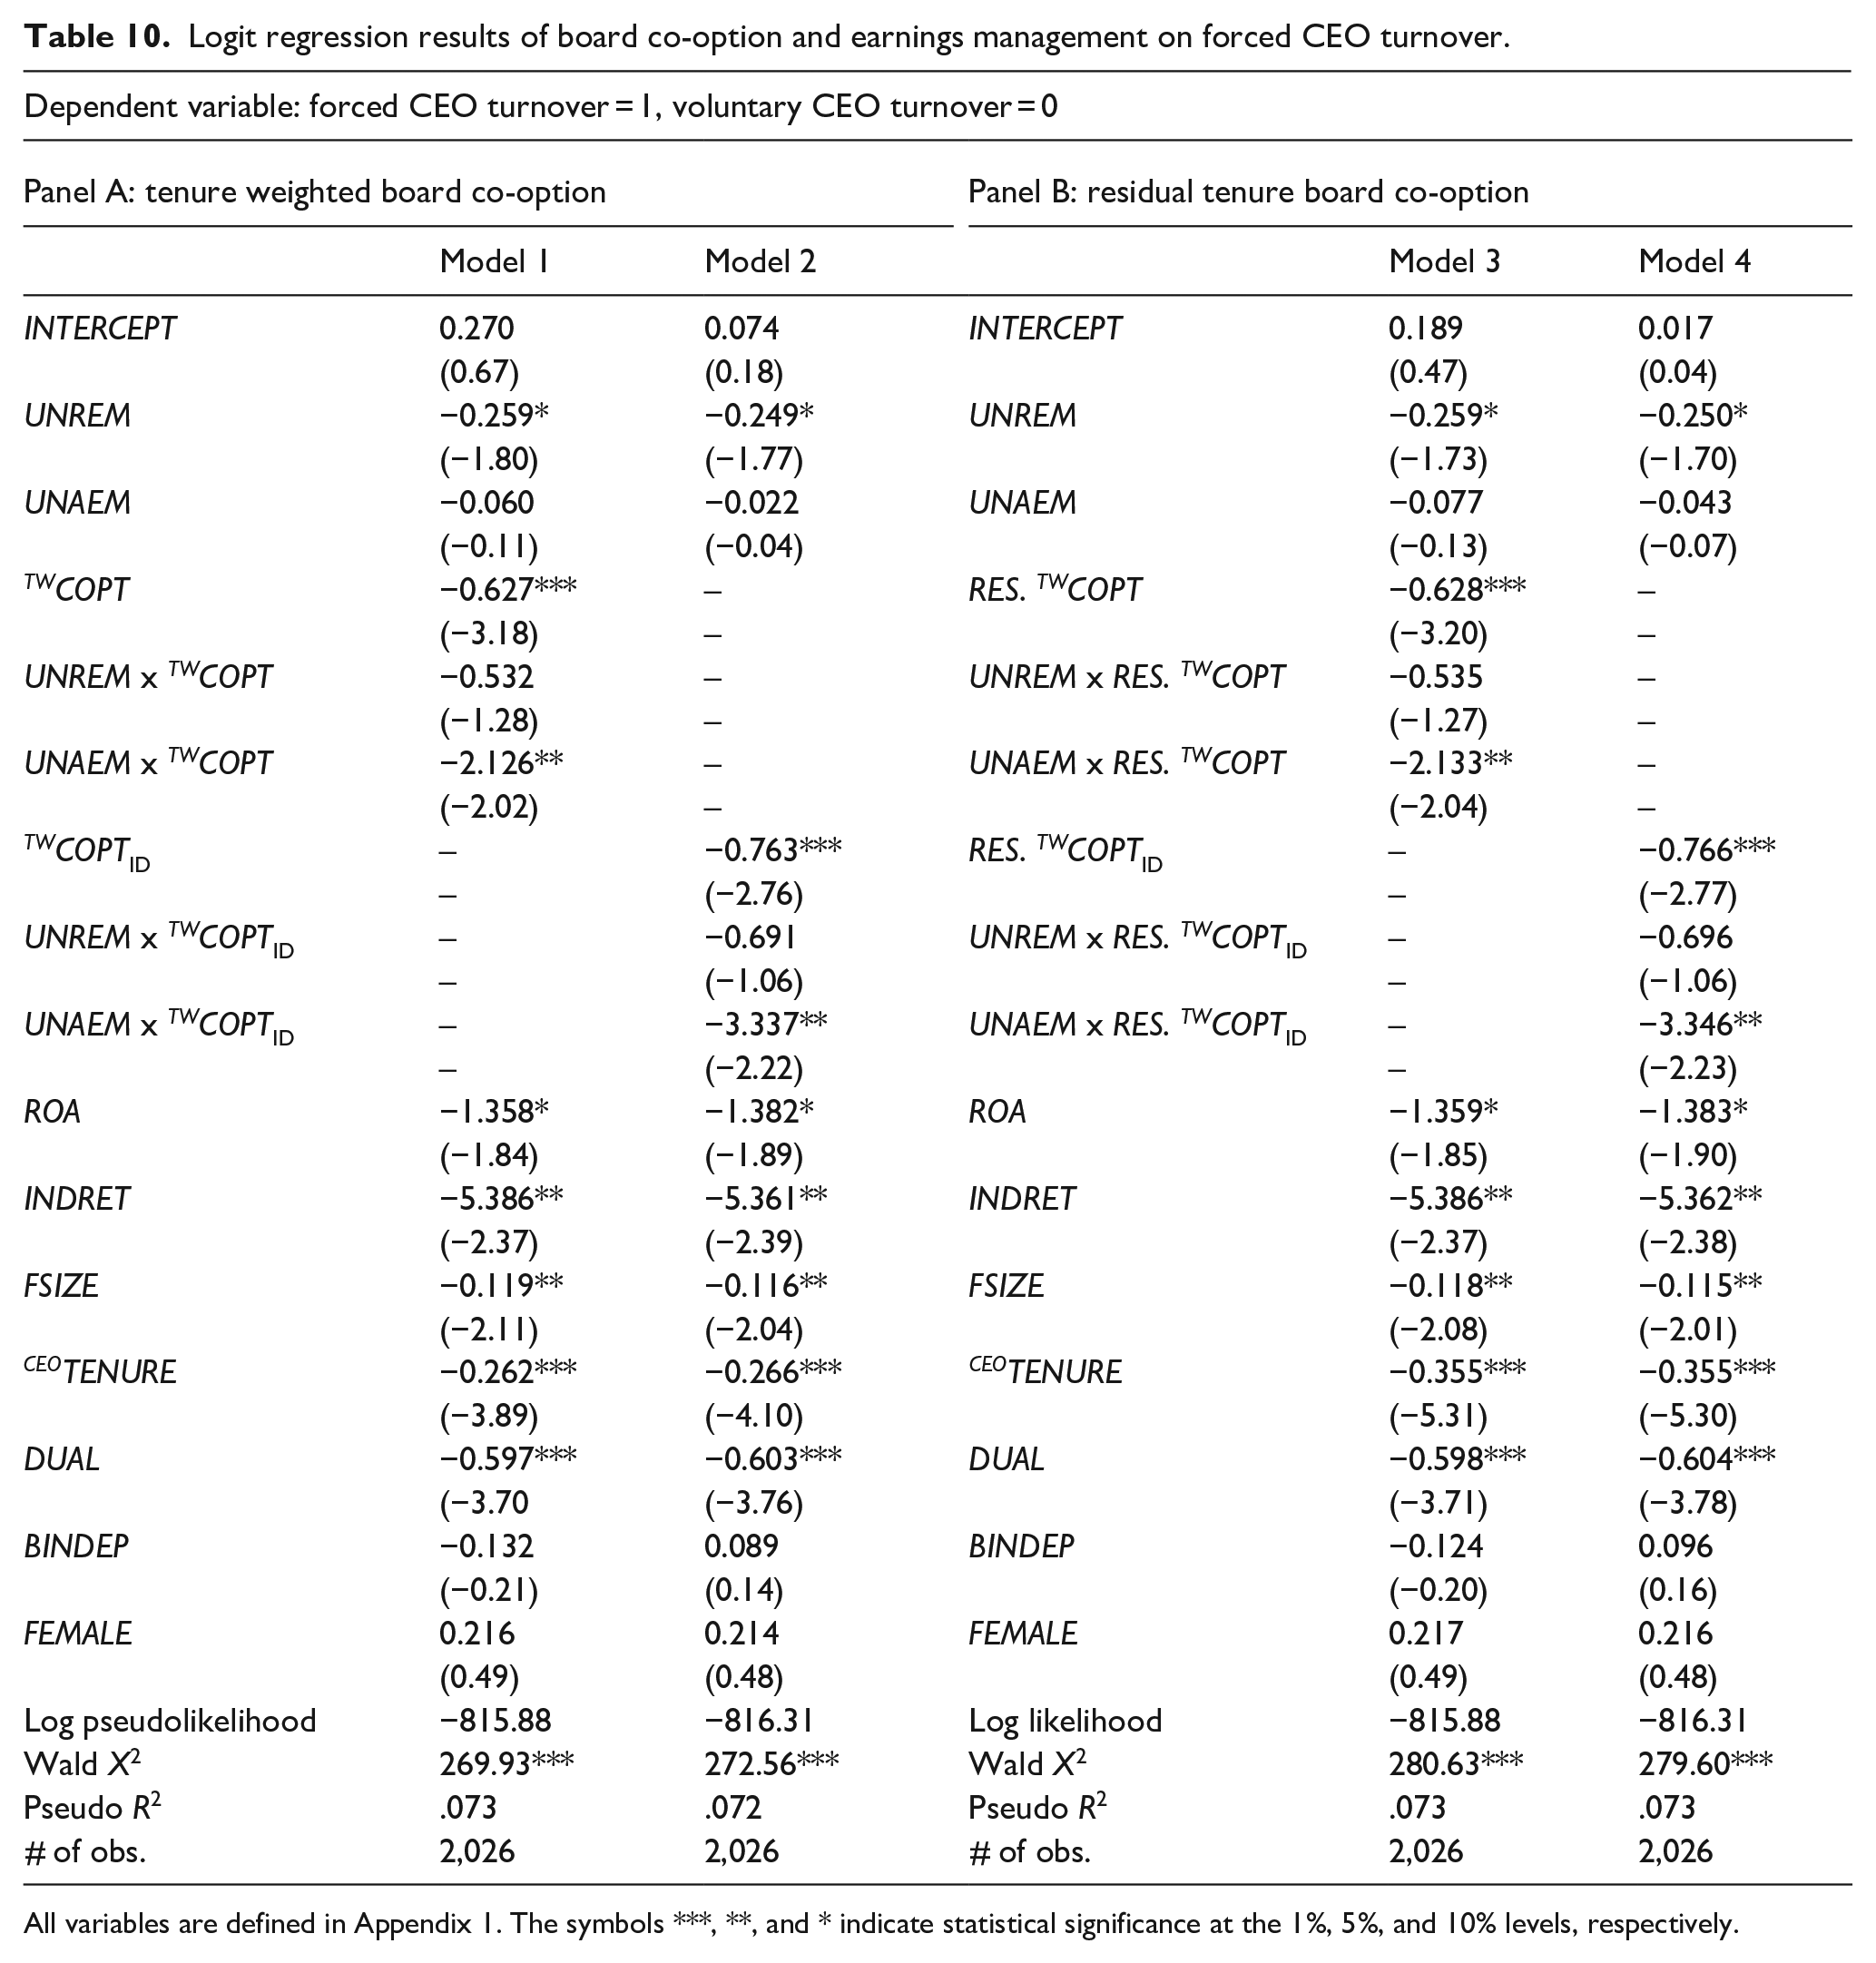
We directly assess the likelihood of a forced turnover relative to a voluntary turnover using the traditional logit model in equation (10) and report the results in Table 10. As before, Model 1 in Panel A presents the regression results for the baseline model, whereas Model 2 presents the results using TWCOPTID. Models 3 and 4 in Panel B provide the results using the residual co-option variables RES.TWCOPT and RES.TWCOPTID. The coefficient on the UNREM variable is negative and significant in all four models, implying that CEOs are less likely to be forcefully removed from the office for managing earnings through real activities. UNAEM is insignificant perhaps because accrual management is no longer a widely used tool.
Logit regression results of board co-option and earnings management on forced CEO turnover.
All variables are defined in Appendix 1. The symbols ***, **, and * indicate statistical significance at the 1%, 5%, and 10% levels, respectively.
Consistent with the results in Table 9, the coefficient on the TWCOPT variable is negative and highly significant in all model specifications. These results provide further support that co-option lowers the probability of a forced turnover. The coefficients on the first set of interaction terms, UNREM ×TWCOPT, UNREM × TWCOPTID, UNREM ×RES.TWCOPT and UNREM ×RES. TWCOPTID, are all negative but not statistically significant. These results confirm the findings presented earlier in Table 9 that co-opted boards give no weight to real activities manipulation when considering a forced turnover as real earnings management is hard to detect or be disputed by auditors and regulators and above all, co-opted directors are dutiful to the CEO that appointed them. In contrast, the coefficients on the second set of interaction terms, UNAEM ×TWCOPT, UNAEM × TWCOPTID, UNAEM ×RES.TWCOPT, and UNAEM ×RES. TWCOPTID, are negative and statistically significant at the 5% level or better. Hence, when firms excessively engage in accrual management, co-option reduces the likelihood that the CEO will be forcefully dismissed. This finding underscores that board co-option curbs managers’ employment risk even in cases where a dismal could be easily justified. All four model specifications yield similar results.
The coefficients on several control variables are significant and of the expected signs. For instance, CEOs are less likely to be fired when their firms exhibit higher profitability and greater industry-adjusted returns. The length of the CEO tenure and the dual position as chairman of the board are also negatively related to the probability of being forcefully removed from office.
Conclusion
Academic research has long questioned the efficacy of independent directors. Coles et al. (2014) show that not all independent directors are effective monitors and introduce a novel board co-option measure that captures directors’ reluctance to monitor CEOs and to remove them from office upon poor performance. The emerging literature documents that co-option leads to less frequent board meetings, higher executive pay, lower dividend payout, more risk-taking, and less forced CEO turnovers owing to less fiduciary oversight. Even so, evidence also shows that co-option is associated with higher long-term investments and more innovation as a corollary of managers’ enhanced job security.
This study contributes to the literature by examining how and to what extent co-opted directors influence managers’ attitudes about earnings management. We find robust evidence that co-option mitigates both real and accrual-based earnings management. Our results are robust to alternative measures of both board co-option and earnings management, and they continue to hold even after controlling for endogeneity and potential selection bias. We also document compelling evidence that managers with co-opted boards are less likely to be forced from office even when they excessively engage in accruals management which is a long-established viable reason for removal.
Overall, our findings suggest that co-option reduces managerial myopia around earnings management because it insulates the career concerns of top management from employment risk. That is, as managers’ employment risk declines due to higher co-option, they manage earnings less because their sensitivity for meeting earnings expectations is lower. We contribute to the literature by providing further evidence that co-option is a less noisy measure of board efficacy and by offering new insights on how the degree of earnings management varies across firms based on board oversight. Our findings complement studies showing that co-option reduces managerial short-termism. In addition, our results are also in keeping with studies suggesting that more stringent monitoring amplifies the pressure to meet earnings forecasts, and by corollary that managers manipulate earnings due to career concerns.
Footnotes
Appendix 2
Appendix 1
Variable measurements.
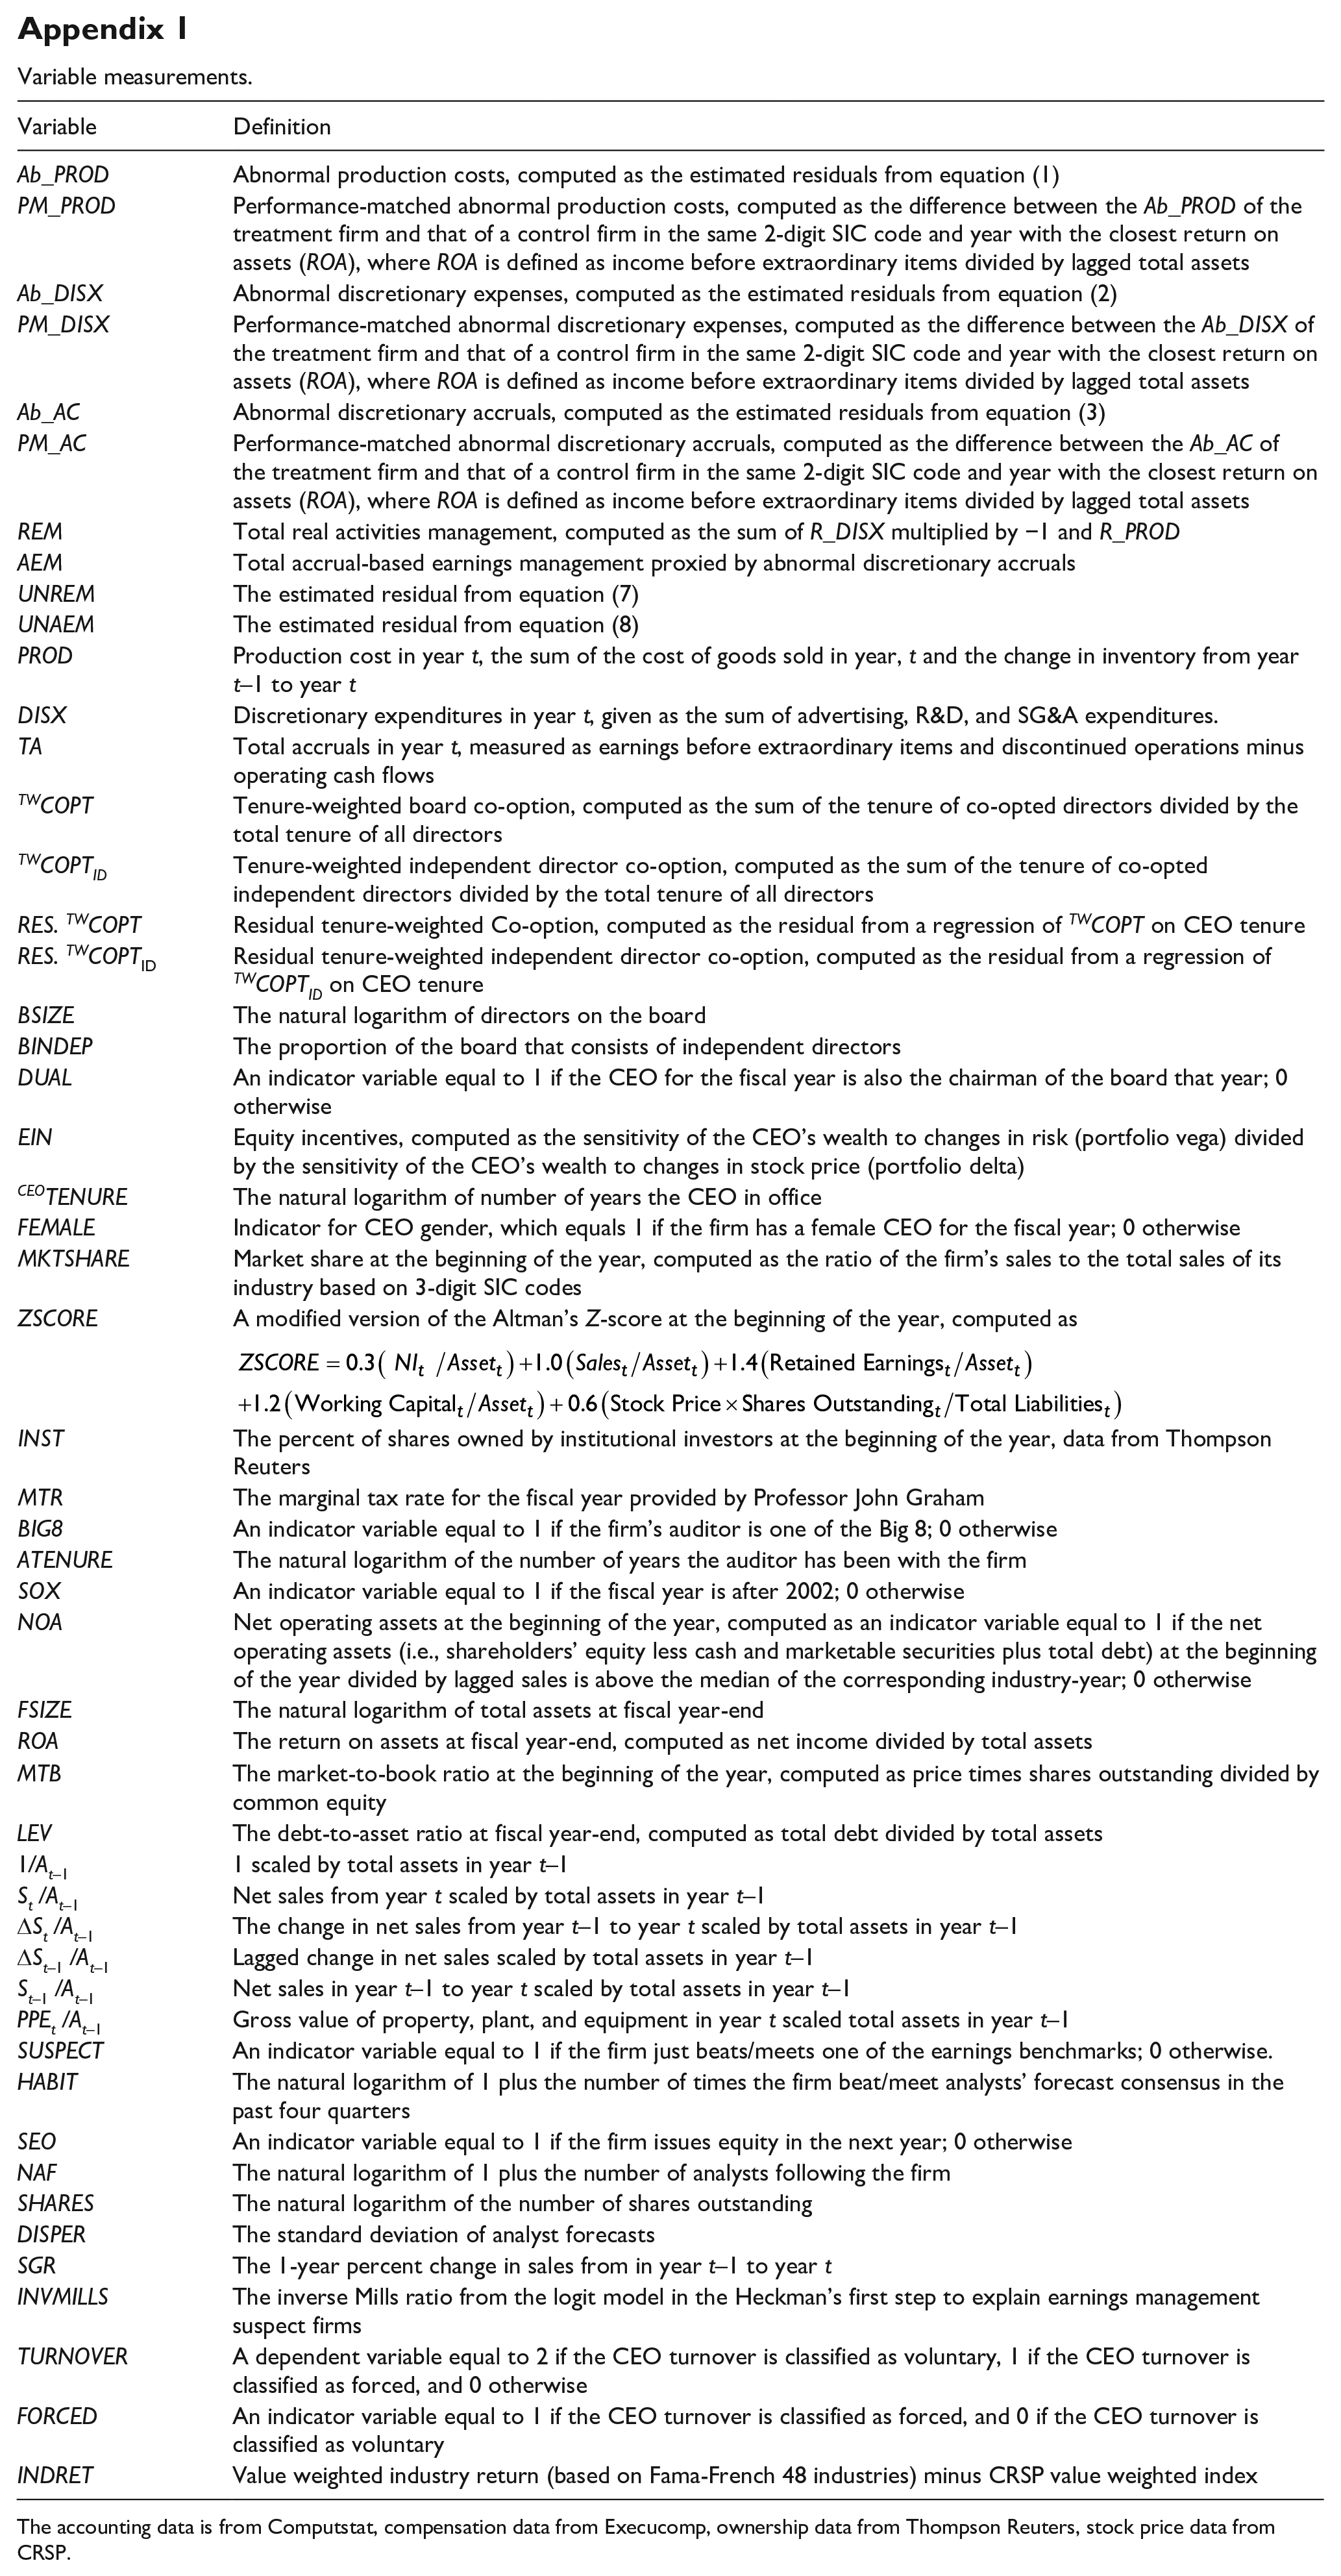
| Variable | Definition |
|---|---|
| Ab_PROD | Abnormal production costs, computed as the estimated residuals from equation (1) |
| PM_PROD | Performance-matched abnormal production costs, computed as the difference between the Ab_PROD of the treatment firm and that of a control firm in the same 2-digit SIC code and year with the closest return on assets (ROA), where ROA is defined as income before extraordinary items divided by lagged total assets |
| Ab_DISX | Abnormal discretionary expenses, computed as the estimated residuals from equation (2) |
| PM_DISX | Performance-matched abnormal discretionary expenses, computed as the difference between the Ab_DISX of the treatment firm and that of a control firm in the same 2-digit SIC code and year with the closest return on assets (ROA), where ROA is defined as income before extraordinary items divided by lagged total assets |
| Ab_AC | Abnormal discretionary accruals, computed as the estimated residuals from equation (3) |
| PM_AC | Performance-matched abnormal discretionary accruals, computed as the difference between the Ab_AC of the treatment firm and that of a control firm in the same 2-digit SIC code and year with the closest return on assets (ROA), where ROA is defined as income before extraordinary items divided by lagged total assets |
| REM | Total real activities management, computed as the sum of R_DISX multiplied by −1 and R_PROD |
| AEM | Total accrual-based earnings management proxied by abnormal discretionary accruals |
| UNREM | The estimated residual from equation (7) |
| UNAEM | The estimated residual from equation (8) |
| PROD | Production cost in year t, the sum of the cost of goods sold in year, t and the change in inventory from year t–1 to year t |
| DISX | Discretionary expenditures in year t, given as the sum of advertising, R&D, and SG&A expenditures. |
| TA | Total accruals in year t, measured as earnings before extraordinary items and discontinued operations minus operating cash flows |
| TWCOPT | Tenure-weighted board co-option, computed as the sum of the tenure of co-opted directors divided by the total tenure of all directors |
| TWCOPTID | Tenure-weighted independent director co-option, computed as the sum of the tenure of co-opted independent directors divided by the total tenure of all directors |
| RES. TWCOPT | Residual tenure-weighted Co-option, computed as the residual from a regression of TWCOPT on CEO tenure |
| RES. TWCOPT ID | Residual tenure-weighted independent director co-option, computed as the residual from a regression of TWCOPTID on CEO tenure |
| BSIZE | The natural logarithm of directors on the board |
| BINDEP | The proportion of the board that consists of independent directors |
| DUAL | An indicator variable equal to 1 if the CEO for the fiscal year is also the chairman of the board that year; 0 otherwise |
| EIN | Equity incentives, computed as the sensitivity of the CEO’s wealth to changes in risk (portfolio vega) divided by the sensitivity of the CEO’s wealth to changes in stock price (portfolio delta) |
| CEOTENURE | The natural logarithm of number of years the CEO in office |
| FEMALE | Indicator for CEO gender, which equals 1 if the firm has a female CEO for the fiscal year; 0 otherwise |
| MKTSHARE | Market share at the beginning of the year, computed as the ratio of the firm’s sales to the total sales of its industry based on 3-digit SIC codes |
| ZSCORE | A modified version of the Altman’s Z-score at the beginning of the year, computed as |
| INST | The percent of shares owned by institutional investors at the beginning of the year, data from Thompson Reuters |
| MTR | The marginal tax rate for the fiscal year provided by Professor John Graham |
| BIG8 | An indicator variable equal to 1 if the firm’s auditor is one of the Big 8; 0 otherwise |
| ATENURE | The natural logarithm of the number of years the auditor has been with the firm |
| SOX | An indicator variable equal to 1 if the fiscal year is after 2002; 0 otherwise |
| NOA | Net operating assets at the beginning of the year, computed as an indicator variable equal to 1 if the net operating assets (i.e., shareholders’ equity less cash and marketable securities plus total debt) at the beginning of the year divided by lagged sales is above the median of the corresponding industry-year; 0 otherwise |
| FSIZE | The natural logarithm of total assets at fiscal year-end |
| ROA | The return on assets at fiscal year-end, computed as net income divided by total assets |
| MTB | The market-to-book ratio at the beginning of the year, computed as price times shares outstanding divided by common equity |
| LEV | The debt-to-asset ratio at fiscal year-end, computed as total debt divided by total assets |
| 1/At–1 | 1 scaled by total assets in year t–1 |
| St /At– 1 | Net sales from year t scaled by total assets in year t–1 |
| ΔSt /At–1 | The change in net sales from year t–1 to year t scaled by total assets in year t–1 |
| ΔSt–1 /At–1 | Lagged change in net sales scaled by total assets in year t–1 |
| St– 1 /At– 1 | Net sales in year t–1 to year t scaled by total assets in year t–1 |
| PPEt /At– 1 | Gross value of property, plant, and equipment in year t scaled total assets in year t–1 |
| SUSPECT | An indicator variable equal to 1 if the firm just beats/meets one of the earnings benchmarks; 0 otherwise. |
| HABIT | The natural logarithm of 1 plus the number of times the firm beat/meet analysts’ forecast consensus in the past four quarters |
| SEO | An indicator variable equal to 1 if the firm issues equity in the next year; 0 otherwise |
| NAF | The natural logarithm of 1 plus the number of analysts following the firm |
| SHARES | The natural logarithm of the number of shares outstanding |
| DISPER | The standard deviation of analyst forecasts |
| SGR | The 1-year percent change in sales from in year t–1 to year t |
| INVMILLS | The inverse Mills ratio from the logit model in the Heckman’s first step to explain earnings management suspect firms |
| TURNOVER | A dependent variable equal to 2 if the CEO turnover is classified as voluntary, 1 if the CEO turnover is classified as forced, and 0 otherwise |
| FORCED | An indicator variable equal to 1 if the CEO turnover is classified as forced, and 0 if the CEO turnover is classified as voluntary |
| INDRET | Value weighted industry return (based on Fama-French 48 industries) minus CRSP value weighted index |
The accounting data is from Computstat, compensation data from Execucomp, ownership data from Thompson Reuters, stock price data from CRSP.
Declaration of conflicting interests
The author(s) declared no potential conflicts of interest with respect to the research, authorship, and/or publication of this article.
Funding
The author(s) received no financial support for the research, authorship, and/or publication of this article.