
Abstract
After the financial crisis of 2007–2008, some bank performance dimensions have been the subject of debate, two of which are bank efficiency and bank risk-taking behavior. The literature on bank efficiency and productivity has grown considerably over the past three decades, and has gained momentum in the aftermath of the financial crisis. Interest in bank risk-taking behavior, usually focusing on its links to monetary policy, has been relatively low, but has also increased exponentially in more recent years. This article combines these two streams of research. Specifically, we test whether more inefficient banks take greater risks when selecting borrowers, charging interests, and requiring collateral, and whether these links between inefficiency and risk change according to the type of bank. Our analysis centers on the Spanish banking system, which has been severely affected by the burst of the housing bubble and has undergone substantial restructuring. To test our hypotheses, we created a database with information on banks and savings banks, their borrowers (non-financial firms), and the links between them. The study also contributes to the literature by considering a novel profit frontier approach. Our results suggest that more inefficient banks take greater risks in selecting their borrowers, and that this high-taking behavior is not offset by higher interest rates.
Introduction
Regulators have long concerned for excessive risk-taking by banks, for several reasons, among which we should highlight the existence of misaligned incentives. On one hand, in the case of a limited liability structure, shareholders would respond only for their initial investment, which some authors refer to as a “limited skin in the game” (Park & van Horn, 2015). On the other hand, should shareholders respond for all banks’ losses (i.e., extended liability structure), then private risk-taking decisions and socially optimal risk taking would be more closely aligned (Park & van Horn, 2015). In this regard, the relatively poor incentives that arise under limited liability mechanisms are partly related to the magnitude and harshness of the 2007/2008 financial crisis, given the links with excessive banks’ risk taking during the preceding years. Indeed, under limited liability structures, the incentives to take immoderate risks might be high, since the downside exposure is limited while simultaneously receiving the entirety of upside gains from (risky) projects.
Under these circumstances, research interest in bank risk-taking behavior has gained momentum. Most studies have examined environmental variables, interest rates, and monetary policy in combination with the increased risk taken by banks, in an attempt to ascertain some of the likely causes of the financial and subsequent economic crisis. The recent literature in this line includes, to name a few, Dell’Ariccia et al. (2014), who considered a theoretical model to show that a decline in interest rates was followed by an increase in bank risk taking, or Boyd and Hakenes (2014), who modeled both bank risk-taking behavior and regulatory policy in times of crisis—proposing two models which differed due to considering owner-managers’ capital only or including outside equity holders. In the case of Spain, the focus of this article, Jiménez et al. (2014), using a rich and detailed database, have analyzed the impact of monetary policy on the risk banks assumed in the period between 2002 and 2008 (see also Jiménez & Saurina, 2004; Salas & Saurina, 2002, 2003).
Taking these considerations into account, we analyze the links between bank performance, measured via frontier methods, and risk-taking behavior in Spanish banking. Relatively few studies evaluating performance from a frontier perspective have explicitly considered how controlling for risk may bias bank performance, despite the relevance of the issue. In this literature, although we might consider a variety of classifications, two different categories can be distinguished, one focusing on the risk behavior of the lender, and the other on that of the borrower. Therefore, the approach we consider has a twofold perspective—that is, from the perspective of the lender and from the perspective of the borrower.
Specifically, part of the literature controls for credit risk from a lender perspective, considering variables at the bank level, using as proxies for risk either loan loss provisions (LLPs)—or nonperforming loans (NPLs) when the information is available. Some almost classic studies in the field such as Hughes and Mester (1996) acknowledged this reality, concluding that disregarding the impact of risk could lead to mismeasurements of banks’ inefficiency levels. Due to the growing relevance of this issue, the number of bank efficiency evaluations taking risk explicitly into account has increased notably during the past 20 years; some relevant examples are Färe et al. (2004), Koetter (2008), Altunbas et al. (2007), and more recently, Fiordelisi et al. (2011) and Epure and Lafuente (2015), among others.
From this lender’s perspective, one of our contributions is to consider several variables to measure bank credit risk. Despite the advantages of NPLs over LLPs that Berger and DeYoung (1997) refer to, the frequent unavailability of data on the former, and the discretionary nature of the latter, led us to consider an alternative strategy. Specifically, we consider some accounting modifications to control provisions that add a discretional component to the use of LLPs—that is, we will consider two additional proxies for credit risk which help us in discerning whether banks could have actually altered (or manipulated) this information during the analyzed period (Givoly et al., 2010; Lo, 2008). The frontier approach we consider takes explicitly into account the quality of the variables that affect the measurement of bank profits (Dechow et al., 2010; Roychowdhury, 2006). As far as we know, this approach has rarely been used in the literature to measure bank performance from a profit frontier perspective.
Other research initiatives have considered not only bank credit risk but also the risk attributable to the probability of bankruptcy or insolvency of their borrowing companies—that is, considering the firm level and therefore extending the perspective to the borrowers. In this case, although some contributions such as Foos et al. (2010) or Fiordelisi et al. (2011) have dealt with related issues (in the context of the banking industries of 16 advanced economies, and for European banks, respectively), the issue as to how the risk characteristics of the borrowing firms interact with banks’ performance, on which we focus, has received much less research attention. However, as indicated in the first lines of this introduction, this can be particularly relevant today since during the expansion years prior to the financial crisis, several factors—such as the growth in securitization, the degree of bank competition, external finance imbalances, corporate governance in the banking sector, the relative tightness of monetary policy, or the intensity of bank supervision and policy responses to the crisis—led to looser credit standards and laxer screening of borrowers, contributing to the expansion of credit and to the deterioration of loan quality in many Western economies (see also Keys et al., 2010).
Our focus in this study is on the Spanish banking system. As indicated by Foos et al. (2010), the current financial crisis is a clear example of the materialization of the risks that banks took during the period of economic growth, including excessively low interest rates and lax criteria for issuing loans. In the case of Spain, these tendencies were especially severe, and the financial crisis has had devastating consequences for the entire economy, leading to the most extensive restructuring process in the history of its banking system. Some authors point to Spain as one of the clearest illustrations of the issues responsible for the crisis—a huge housing bubble, partly stoked by financial innovation (in particular securitization), which led to looser credit standards and, ultimately, financial instability (Carbó-Valverde et al., 2012). Against this background, our study examines whether the most inefficient Spanish banks offered loans to firms that were, among other aspects, financially riskier. To do so, we measure risk from three different points of view: (a) ex ante risk; (b) ex post risk, and finally, given some of the most intrinsic characteristics of Spanish savings banks; and (c) savings banks’ risk, depending on whether they carry out their main activities in their home market or other markets. 1
As mentioned above, our study also differs from previous research in that it deals with risk from both the banks’ and the non-financial firms’ perspectives. First we analyze whether the most inefficient banks chose riskier customers, and second, we determine whether this risk materialized. The results show that the most inefficient banks did actually lend to riskier customers. We also examine whether this risk was offset by higher interest rates. Stiglitz and Weiss (1981) argue that the riskiest customers are willing to accept higher interest rates, since they understand that the probability of their repaying the loan will be lower. In contrast, Foos et al. (2010) find that some banks, to issue higher volumes of loans, might lower the interest rates and require less collateral.
The article proceeds as follows. After this introduction, the second section presents the key assumptions and empirical predictions; the third section describes the models used to measure bank performance; the fourth section explains the econometric methodology to evaluate the impacts on performance; the fifth section briefly describes the data and variables (for both banks and their borrowing firms), and the results are explained and reported in the sixth section. Finally, the seventh section provides some concluding remarks.
Hypotheses on the links between banks’ performance and the risk characteristics of their borrowing firms
We consider three different hypotheses regarding the relationship between bank performance and risk-taking behavior. The first one considers whether the most inefficient banks have sought to increase their profits by granting more loans—even to firms with the worst financial results. The second hypothesis considered is the second part to Hypothesis 1. We will first consider if the most inefficient banks, due to the fact they grant riskier credits, offset the extra risk by charging higher interest rates and, second, if these banks provide credit to companies with lower probability of paying back. The final hypothesis refers to savings banks only. Specifically, in light of the savings bank branch geographic expansion of the end of 1990s and 2000s, it stipulates whether savings banks behave differently, granting new loans in their new markets compared with their home markets.
Hypothesis 1. The most inefficient banks lend to riskier borrowers
This first hypothesis is in line with Berger and DeYoung’s (1997) “bad management” hypothesis. These authors proposed four hypotheses to analyze the relationship between risk and efficiency: (a) the bad management hypothesis, (b) the skimping hypothesis, (c) the moral hazard hypothesis, and (d) the bad luck hypothesis.
According to the “bad management” hypothesis, banks’ low efficiency is related to poor management skills, which might lead to taking excessive risks. Therefore, there is a positive relationship between banks’ inefficiency and the risk in which they incur. In addition, Williams (2004) found empirical evidence of this “bad management” hypothesis for European savings banks.
Hypothesis 1a. The most inefficient banks will lend to less profitable or more inefficient firms
This hypothesis considers the lagged Z-score as a dependent variable. When banks have to make a decision on whether or not to grant a loan to a firm, the information they possess is related to the firm’s balance sheet and profit and loss account corresponding to the previous year. If the lending banks grant a loan to a company with solvency problems, this can be considered as an ex ante risk. Such prior information can be considered “hard information,” and is based on objective criteria.
However, another type of information, called “soft information” (Berger & Udell, 2002) can also affect lending decisions. This soft information cannot be observed by third parties, and is based on the data obtained from the relationship with the company, the owner, and the local community. A second hypothesis is therefore required to capture the effect of ex post risk.
Hypothesis 1b. Firms that have access to credit from inefficient banks are more likely to go bankrupt
Berger and DeYoung (1997) find empirical evidence that inefficiency may be an important indicator of future credit problems in the U.S. market. However, they only consider cost efficiency and bad loans, but not the profitability of the borrowing firm. Other studies also show evidence of the relationship between efficiency and LLPs, which can also be considered as a proxy for ex post risk (see, for instance, Chortareas et al., 2011; Williams, 2004).
Hypothesis 2. The most inefficient banks charge higher interest rates because of their risk-taking behavior
The literature reports two views on the rates of interest charged. On one hand, as Jiménez and Saurina (2004) explain, in a context of asymmetric information between the bank and the borrower, loan contracts differ according to borrower type: the riskiest borrowers are charged higher interest rates and do not provide collateral, whereas the least risky borrowers are charged lower interest rates and are required to provide less collateral.
On the other hand, authors such as Ogura (2006) argue that, in a competitive environment, in order to attract new customers, banks should charge lower interest rates. Foos et al. (2010) finds evidence that total lending increases when interest rates are lower. These authors find a relationship between loan growth and banks’ risk taking between 1997 and 2007 in 16 advanced economies.
In this study, we follow the arguments of Jiménez and Saurina (2004), and our hypothesis is therefore that the most inefficient banks charge their clients higher interest rates. In addition, the analysis is extended to test whether riskier banks lend to companies that cannot provide so much collateral. Berger and Udell (1990) present empirical evidence for the U.S. market that the guarantees are more frequently associated with riskier borrowers and riskier banks. In the same vein, and for the Spanish case, Jiménez and Saurina (2004) show that the probability of firms’ bankruptcy increases with increased collateral requirements.
Hypothesis 3. Savings banks’ inefficiency will affect the type of borrowers according to whether they are located in the savings bank’s home markets or new markets
Until the end of 1988, Spanish banking regulations did not allow savings banks to expand geographically. They could not operate outside their own region (or comunidad autónoma) of origin, or what may be more properly defined as their home or natural markets (Fuentelsaz et al., 2004; Illueca et al., 2014, 2009). However, at the end of 1988, the barriers were lifted and savings banks were able to expand into new markets, usually in other regions. Some of them opened branches outside their traditional geographic boundaries, although today, the territorial distribution of savings banks is still conditioned by the pre-1989 regulations on geographical expansions.
These institutions originally specialized in lending to small businesses in their own city or province, in other words, their home markets. Since 1975, state regulations had restricted the geographic scope of savings banks’ operations to their natural markets. However, the European banking harmonization process of the 1980s meant the savings banks’ sector underwent extensive deregulation to increase their competitiveness in a process that included the lifting of barriers to territorial expansions. We will therefore define the savings banks’ market of origin—or natural market—in this particular context, in line with Illueca et al. (2014, 2009) Specifically, we adopt Illueca et al.’s (2014) definition of the home market of a savings bank i as those provinces that met at least one of the following two criteria in 1988: (a) savings bank i has more than 5% of the total number of the branches of all of the banks located in a province; or (b) savings bank i has more than 50% of its own branches in a province. 2
Some authors argue that banks operate differently in their home markets than they do in new markets. For instance, Illueca et al. (2009) show that savings banks expanding geographically outside their home markets obtain higher productivity gains. We consider this hypothesis to assess whether savings banks behave differently depending on the markets in which they are located. We ask whether savings banks, in an attempt to grant more loans, adopt riskier credit policies in new markets either because they lack “soft information” on the new markets, or because of more “aggressive” competitive practices. Illueca et al. (2014) found evidence for different behavior among Spanish savings banks, showing that savings banks’ geographic expansion is associated with increased risk. In contrast, if savings banks have market power in their home markets they will be able to charge higher interest rates. This hypothesis, in turn, can be divided into two, as below:
Hypothesis 3a. Savings banks’ inefficiency will influence the probability of bankruptcy of their borrowers according to their location
Following the deregulatory initiatives of the 1980s and 1990s, most savings banks began ambitious geographic expansion plans outside their traditional (or home) markets. As Shaffer (1998) stated, entering new markets can generate adverse selection problems, which might affect savings banks’ risk-taking behavior in new markets.
Hypothesis 3b. Savings banks’ inefficiency will influence the interest rate corporate borrowers pay according to their location
This hypothesis is based on the idea that the savings banks could have market power in the regions where they have traditionally operated—that is, in their home markets. Wong (1997) proposed a theoretical model according to which the interest margins of banks are positively related to their market power and their credit risk. For a database of banks from 80 countries during the years 1988–1995, Demirgüç-Kunt and Huizinga (1999) show that lower levels of market power lead to lower margins and higher profits. Foreign banks had higher margins and profits than their domestic counterparts in developing countries, while in developed countries the opposite result was found.
As we shall see in the fourth section, the direction of causality is an issue worth investigating, although this would deserve specific examination. What we would like to point out in this section is that some of the literature considered here has focused on explaining bank efficiency/inefficiency (or productivity), and the likely existence of reverse causality. However, our point is rather how banks’ inefficiency might impact on their borrowers. Therefore, although one might conclude that this literature has not been correctly selected, our hypotheses should actually be interpreted as part of some indirect effects. For instance, some variables such as the poor senior management practices referred to by the “bad management” hypothesis (Berger & DeYoung, 1997) might impact on the bank’s efficiency and this, in turn, have an effect on different risk variables at the firm (borrower) level. This would imply that poor senior practices have no direct impact on borrowers’ risk but rather an indirect impact via bank inefficiency. Unfortunately, contributions evaluating the links (either direct or indirect) between non-financial firms (i.e., data at the firm level) and their lenders’ inefficiency levels are almost entirely yet to come, making this section difficult to place rightly in the literature.
Performance measurement: a profit frontier model
Some banks perform better than others. This is an indisputable fact, but how do we actually recognize a high performing bank? Is a very profitable bank a high performer? Before we can answer this question, we must consider the degree of reliability we should grant to the variables needed to define banking industry profits. In order to do this, we begin by defining the synthetic components that make up the profits of a banking firm
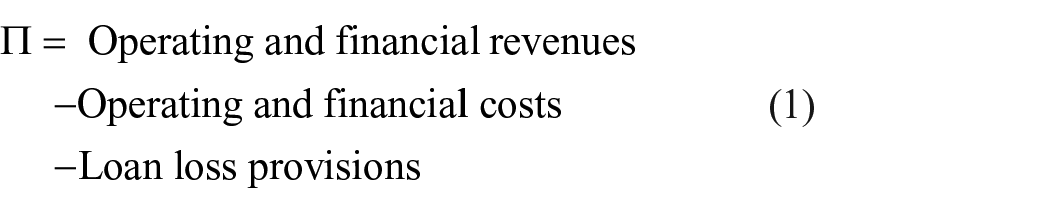
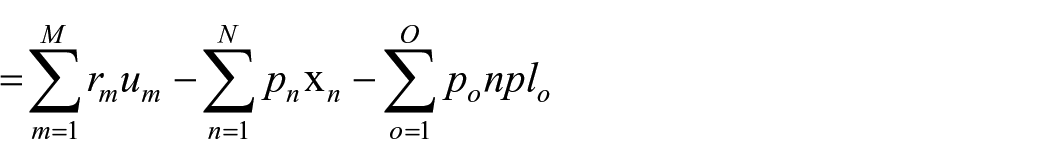
where ∏ are the profits, rm and um are the price and quantity for output m (m = 1, . . . , M), respectively (in our case M = 2, and includes interest income and other operating income), pn and xn are the price and quantity for input n (n = 1, . . . , N), respectively (in our empirical application N = 3 and includes interest expense, personnel expense and other operating expenses), po is the estimated price (for instance, the percentage of write-offs) for nonperforming asset o, and nplo refers to its monetary value (quantity).
Clearly, the degree of accuracy of p depends on the quality of each of its basic elements. In this regard, the literature on earnings quality assesses of the quality of the variables that have an impact on periodic profits (see, for instance Dechow et al., 2010, for a review of some of the variables used in this literature). On one hand, under certain specific circumstances there are several choices to consider at the moment the transactions occur—or there are incentives to manipulate real operations (Roychowdhury, 2006)—and this can affect the amount of flow of real variables to consider (um, xn, nplo). This is what the earnings quality literature refers to as timeliness and timely loss recognition (Dechow et al., 2010). On the other hand, when prices are determined internally (a situation that could affect both pn and po), subjective and opportunistic choices could be considered to “embellish” (or “manipulate”) the profits to be disclosed. In this respect, in the particular case of the banking industry, profits are commonly manipulated to deal with the problems caused by credit risk—bad loans, problem loans or provisions for loans losses (see, for instance Beaver & Engel, 1996).
From the perspective of earnings quality, banks have incentives to reduce volatility by decreasing earnings in years with an unexpectedly strong performance, and increasing earnings in years with a weak performance. A smoother stream of earnings might help to reduce the information asymmetry between managers and outside investors (Beatty et al., 2002; Beatty & Harris, 1999; Liu & Ryan, 2006). In the majority of previous studies, there is evidence that managers smooth earnings via LLP and recognize security gains and losses. Accordingly, these are the variables to be accounted for when earnings quality is under scrutiny.
Different approaches can be considered to incorporate the risk-taking behavior of banks in estimating efficiency indicators. Following the previous literature, NPLs can be incorporated into the bank’s production function as a bad output (or, in terms of the profit function, an expense that decreases total profits). Under Spanish accounting standards, banks must classify a loan as nonperforming when either interest or principal payments are more than 90 days overdue. In addition, all loans granted to borrowers in default are also considered as nonperforming, irrespective of whether or not they are overdue.
Because many of these loans are finally repaid, writing off the whole amount of NPLs (npl) as an expenditure would lead to overestimation of the effects of risk on profit efficiency scores. We therefore take an alternative approach that consists of including LLPs (defining
Expected or “non-manipulated” LLPs are estimated at the bank level. Specifically, we regress LLP on the increase in npl in t − 2, t − 1 (backward looking component) and t. 4 Furthermore, in order to control for accounting conservatism, the increase in npl in t + 1 is also incorporated in our regression model as an independent variable (forward looking component)

We run a regression for each bank for the sample period. To carry out the estimation, two different specifications are considered. We first include total LLPs as the dependent variable, considering not only the specific component of loan losses, but also the dynamic LLPs, introduced by the Bank of Spain in 2000. Since the dynamic provisioning system had a profound impact on the relationship between npl and LLP, we run a second set of regressions excluding the dynamic, or time series, LLPs from the dependent variable. 5 This gives us two sets of “non-manipulated” LLPs, that is, static (cross-section) and dynamic (time series), for which we consider this counter-cyclical LLP. 6
Having estimated the degree of earnings manipulation present in the Spanish banking system, we estimate a non-convex short-run profit frontier model. This model basically follows Färe et al. (1994), taking the original variables (in the case of the bad output, considering the realized LLPs only) and classifying the inputs into variable (xv) and fixed (xf) inputs (see also Primont, 1993, for a short-run cost frontier definition). Therefore, we will be modeling variable profit maximization
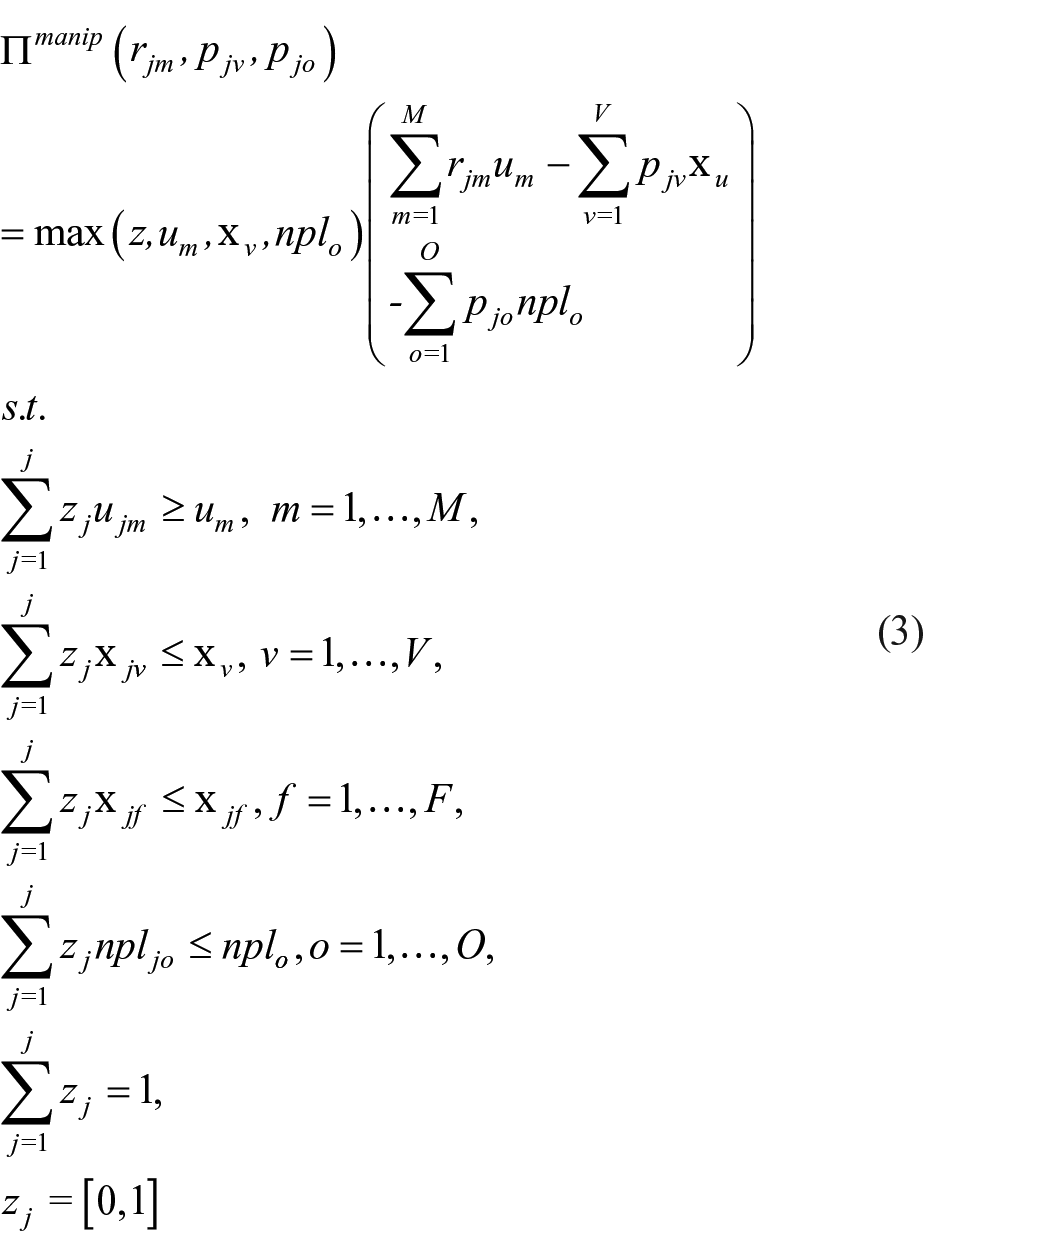
where rjm ∈
As a second step, we will rerun the previous variable profit maximization model in equation (3), but replacing the variables subject to manipulation with their estimated values
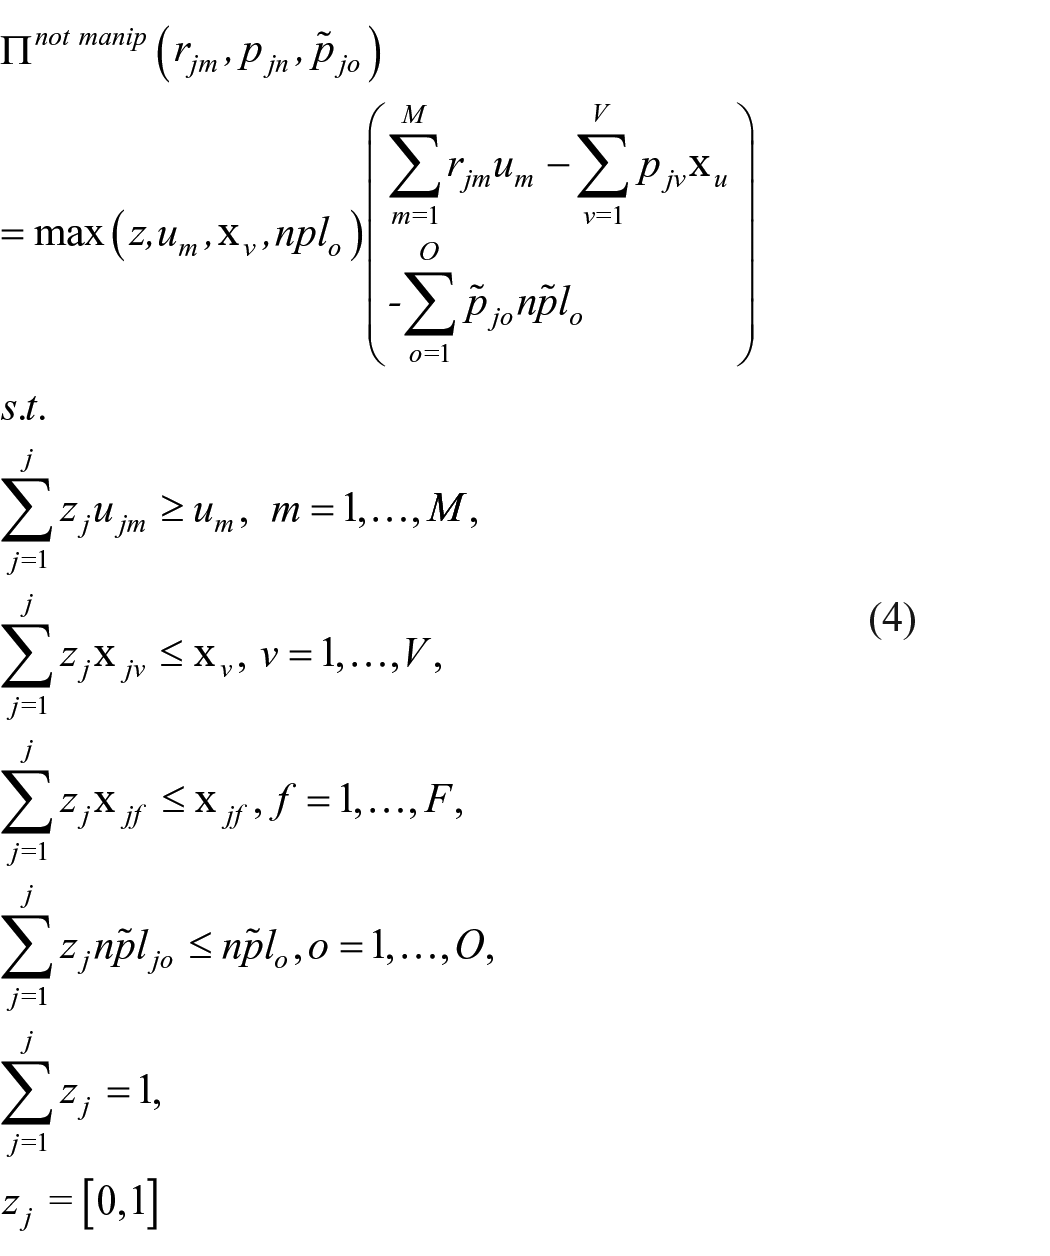
Obviously,
Our article, although very closely related to the literature that has traditionally evaluated profit efficiency in banking, differs in some regards. Among this relevant literature we should highlight contributions by, among others, Berger et al. (1993), Berger and Mester (1997), DeYoung and Hasan (1998), DeYoung and Nolle (1996), Hughes et al. (1996) and, in the case of Spain, the study by Lozano-Vivas (1997) stands out. Despite the importance of these contributions, they are not entirely comparable to ours because of several issues, the most important one being that we propose a nonparametric approach, as opposed to the parametric ones considered by most profit efficiency studies in banking.
Although less important in number, similarly to us some studies have also adopted nonparametric approaches to evaluate different aspects related to profits, productivity, and efficiency in banking. Among them, we should highlight contributions by Devaney and Weber (2002), Färe et al. (2004), Ariff and Luc (2008), Fu et al. (2016) and, in the case of Spanish banking, Grifell-Tatjé and Lovell (1999) and Maudos and Pastor (2003). While the vast majority of these studies, similarly to us, match the quantities and prices for inputs and outputs, Maudos and Pastor (2003) consider the alternative profit measure in order to allow for the existence of market power. Although this approach is undoubtedly interesting, it cannot be directly adopted here given that we must decompose the different components of both costs and revenues (we focus on their quality), which cannot be done for revenues when adopting the alternative profit efficiency proposed by Maudos and Pastor (2003). 7
It should also be noted that the interpretation of the inefficiency indices is a bit different from the standard interpretations of efficiency/inefficiency scores, which is part of the reason why our results cannot be directly compared with previous contributions in the field. Specifically, our inefficiency indices should be interpreted as the return on assets (ROA) lost due to inefficiencies, divided by the total assets. A key advantage of this type of index is that it is always positive (since we compute potential-observed profit, which will always be either positive, or zero).
Econometric model
As stated above, we investigate the links between banks’ performance and their borrowing firms’ characteristics, considering the three main hypotheses presented in the previous section.
We consider two types of analyses with regard to the first of the hypotheses (Hypothesis 1), related to the performance of firms’ lenders. The first one (Hypothesis 1a) considers bank profit efficiency and an ex ante risk-taking behavior. The firm’s Z-score is the proxy for the ex ante risk, and it is calculated with data from the period before the bank issues the credit. To do this, we estimate the following model using OLS

where i and j are subscripts corresponding to firm i and bank j, respectively, Zij is the Z-score,
In the second analysis of the first hypothesis (Hypothesis 1b), we consider ex post risk. The econometric approach to test for this type of risk relies on a logit model of borrower defaults. In this case, the dependent variable is BANKRUPT, which equals one if a firm defaults and zero otherwise

Seven different models are tested when running the regressions corresponding to both equations (5) and (6). For the first four models, bank inefficiency is measured considering the variable B_INEF_ROA, which corresponds to the “manipulated” earnings model in the previous section. This type of inefficiency includes LLPs in the estimation, implying that we are controlling for risk. A univariate analysis is considered, and then we include firms’ control variables sequentially (
The objective of the second hypothesis (Hypothesis 2), related to interest rate charges, is to test whether inefficient banks charge higher interest rates, and whether they lend to firms with more capacity to pledge collateral. The dependent variables are, initially, interest rates the firm pays (F_INT) and, in a second stage, an inverse measure of firm’s ability to pledge collateral (F_INV_COLLAT). Both types of control variables (firms’ and banks’) are included in the regressions. Similar to the models featured above, we also consider different models for each type of efficiency measurement (Models M3.1–M3.6), as well as two additional variables to test for differences in results between commercial banks and savings banks (Models M3.7–M3.8). The models considered are as follows


The third hypothesis (Hypothesis 3), related to savings banks’ expansion strategies, attempts to disentangle whether savings banks’ behavior in their home markets differs from that in the new markets. Four different models are estimated. The first two (Models M4.1 and M4.2) consider as dependent variables the F_ZSCORE in home markets and, in a second stage, in new markets (Models M4.3 and M4.4). Models M4.1 and M4.3 consider firms’ interest as the dependent variable (F_INT), whereas Models M4.2 and M4.4 consider our inverse measure of the firms’ ability to pledge collateral (F_INV_COLLAT). All regressions include two variables of the firm in the analysis, that is, the number of bank relationships (lagged), F_BANK_REL, the year of the firm’s registration (F_REGIS); four bank variables are also included: the bank loan to total asset ratio (B_LOANTA), bank equity to total assets ratio (B_EQTA), bank deposits to total assets ratio (B_DEPTA), and profit inefficiency (with total LLPs, B_INEF_ROA). All models include year and industry fixed effects, and their expressions are as follows


The analysis of the opposite direction of causality, that is, if borrowers’ risk-taking behavior might impact on their lenders inefficiency levels deserves a specific investigation and, probably, a different approach, because of several reasons. First, our main objective is to explain how banks’ inefficiency impact on their borrowers’ risk-taking behavior. While the other direction of causality might also be of interest, it is not the specific aim of the article and raises questions from a theoretical point of view. Second, the issue as to what determines efficiency/inefficiency has been debated for a long time by the efficiency and productivity literature and, even today, is far from being solved. This has been acknowledged in several contributions such as Simar and Wilson (2007, 2011), Balaguer-Coll et al. (2007), or Banker and Natarajan (2008), among others. More recently, Bădin et al. (2014) has summarized most contributions in the field, proposing new methods which also advocate to evaluate if separating the two stages is possible, that is, measuring efficiency in the first stage and analyzing the determinants in the second stage (see Daraio et al., 2018). Third, it might also raise the question regarding the validity of some causality tests when one of the variables is estimated via linear programming methods—that is, without satisfying the independence (in the statistical sense) condition.
Data and variables
In this section, the information does not entirely coincide with that in the previous sections, since we collected information not only on Spanish banking firms but also on Spanish non-financial firms in order to create a single database at the business-bank-year level. This will enable us to model the relationship between the lending banks and their potential borrowers—that is, new loan applicants.
Data from non-financial firms come from the SABI database (Sistema de Análisis de Balances Ibéricos), which is based on the public commercial registry in Spain. It contains accounting data and banking information on 42,617 non-financial firms for the 1997–2009 period. All accounting variables (balance sheet and profit and loss account) refer to the year before the start of the new banking relationship. Table 1 presents the summary statistics for the non-financial firms in the database, reporting information on firms’ size, liquidity, productivity, and firm–bank relationship.
Descriptive statistics for firms.
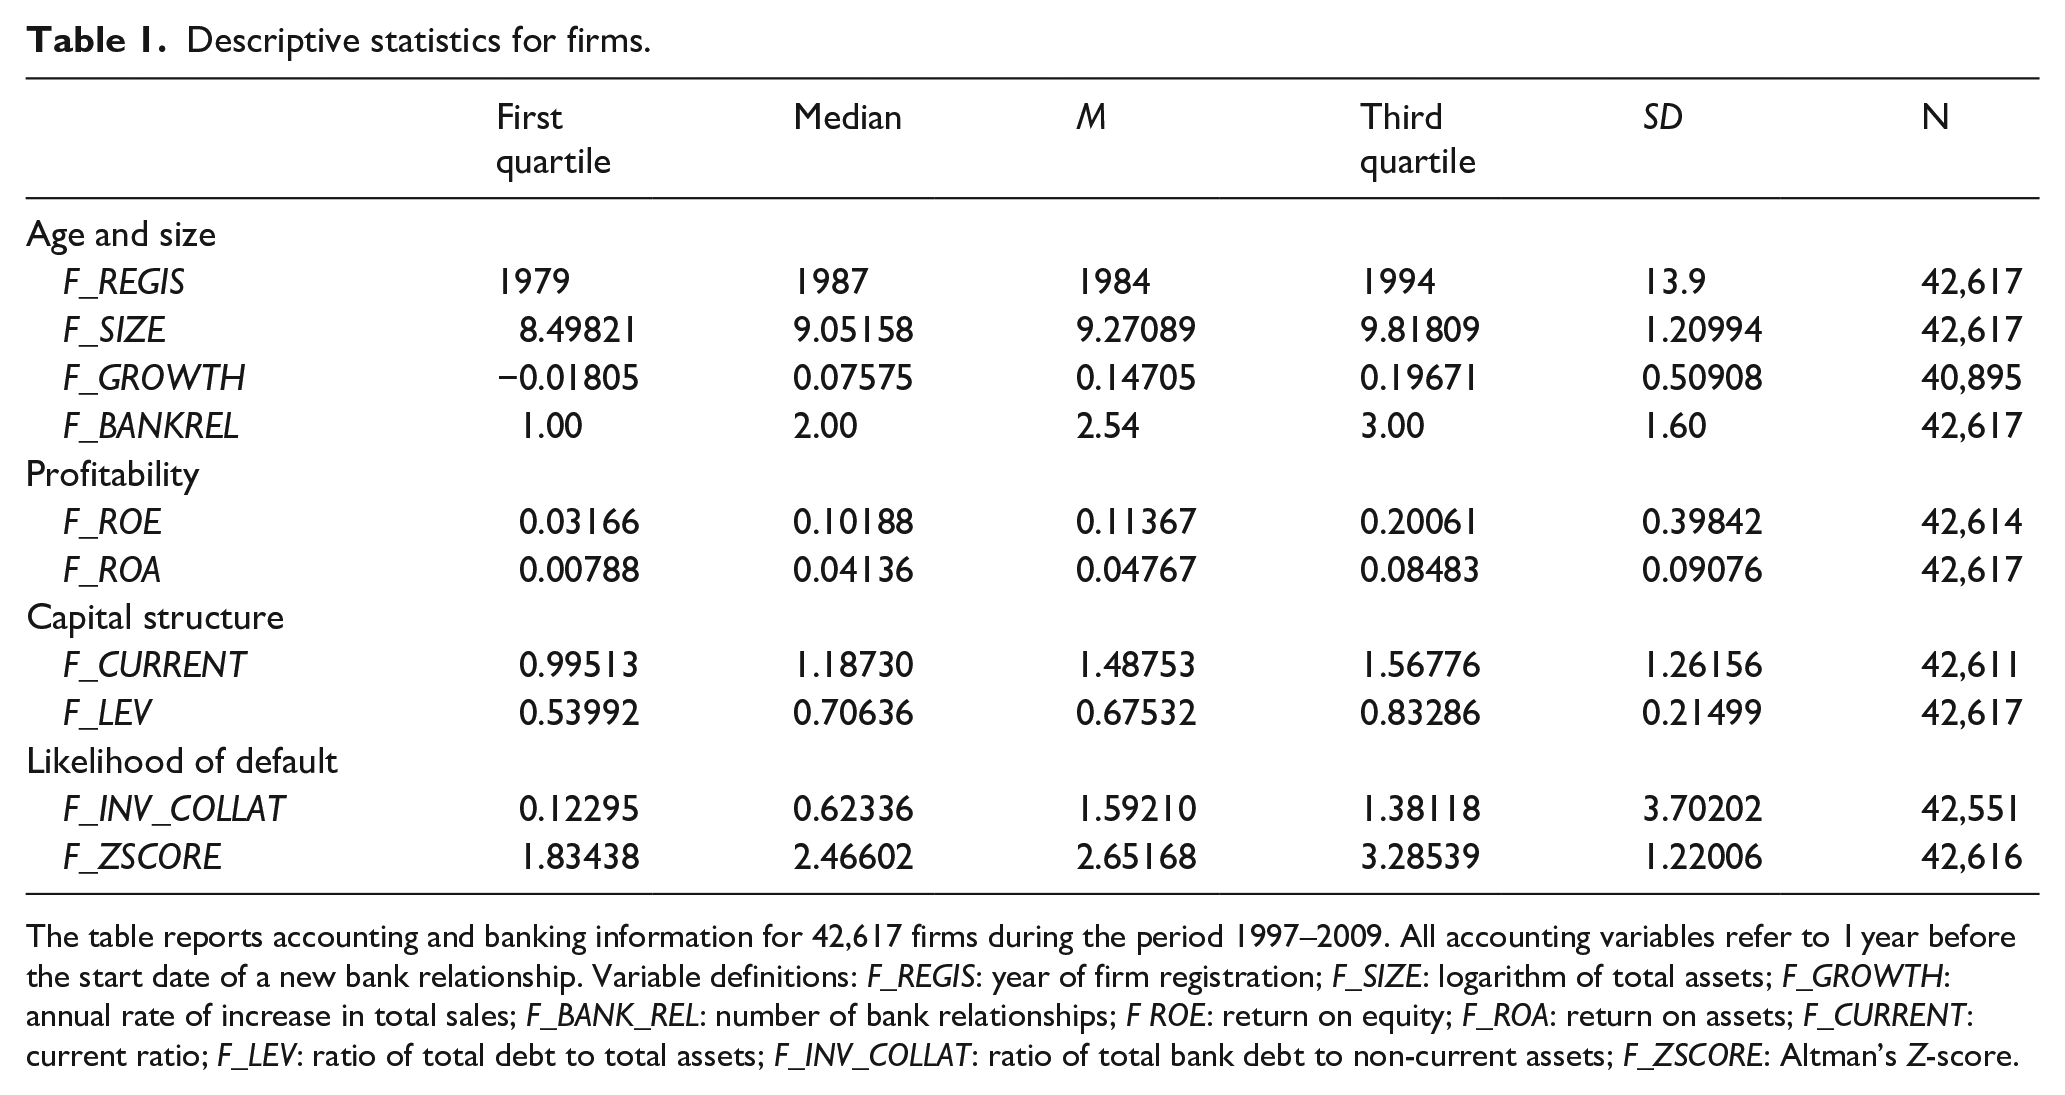
The table reports accounting and banking information for 42,617 firms during the period 1997–2009. All accounting variables refer to 1 year before the start date of a new bank relationship. Variable definitions: F_REGIS: year of firm registration; F_SIZE: logarithm of total assets; F_GROWTH: annual rate of increase in total sales; F_BANK_REL: number of bank relationships; F ROE: return on equity; F_ROA: return on assets; F_CURRENT: current ratio; F_LEV: ratio of total debt to total assets; F_INV_COLLAT: ratio of total bank debt to non-current assets; F_ZSCORE: Altman’s Z-score.
Data on banking firms include financial statements, as well as information on savings banks’ home markets. Information for commercial banks is provided by the Spanish association for banking (AEB, Asociación Espan~ola de Banca), whereas that for savings banks comes from the Spanish confederation of savings banks (CECA, Confederación Espan~ola de Cajas de Ahorros). Table 2 provides accounting information on 51 financial institutions, both commercial banks and savings banks.
Descriptive statistics for banks.
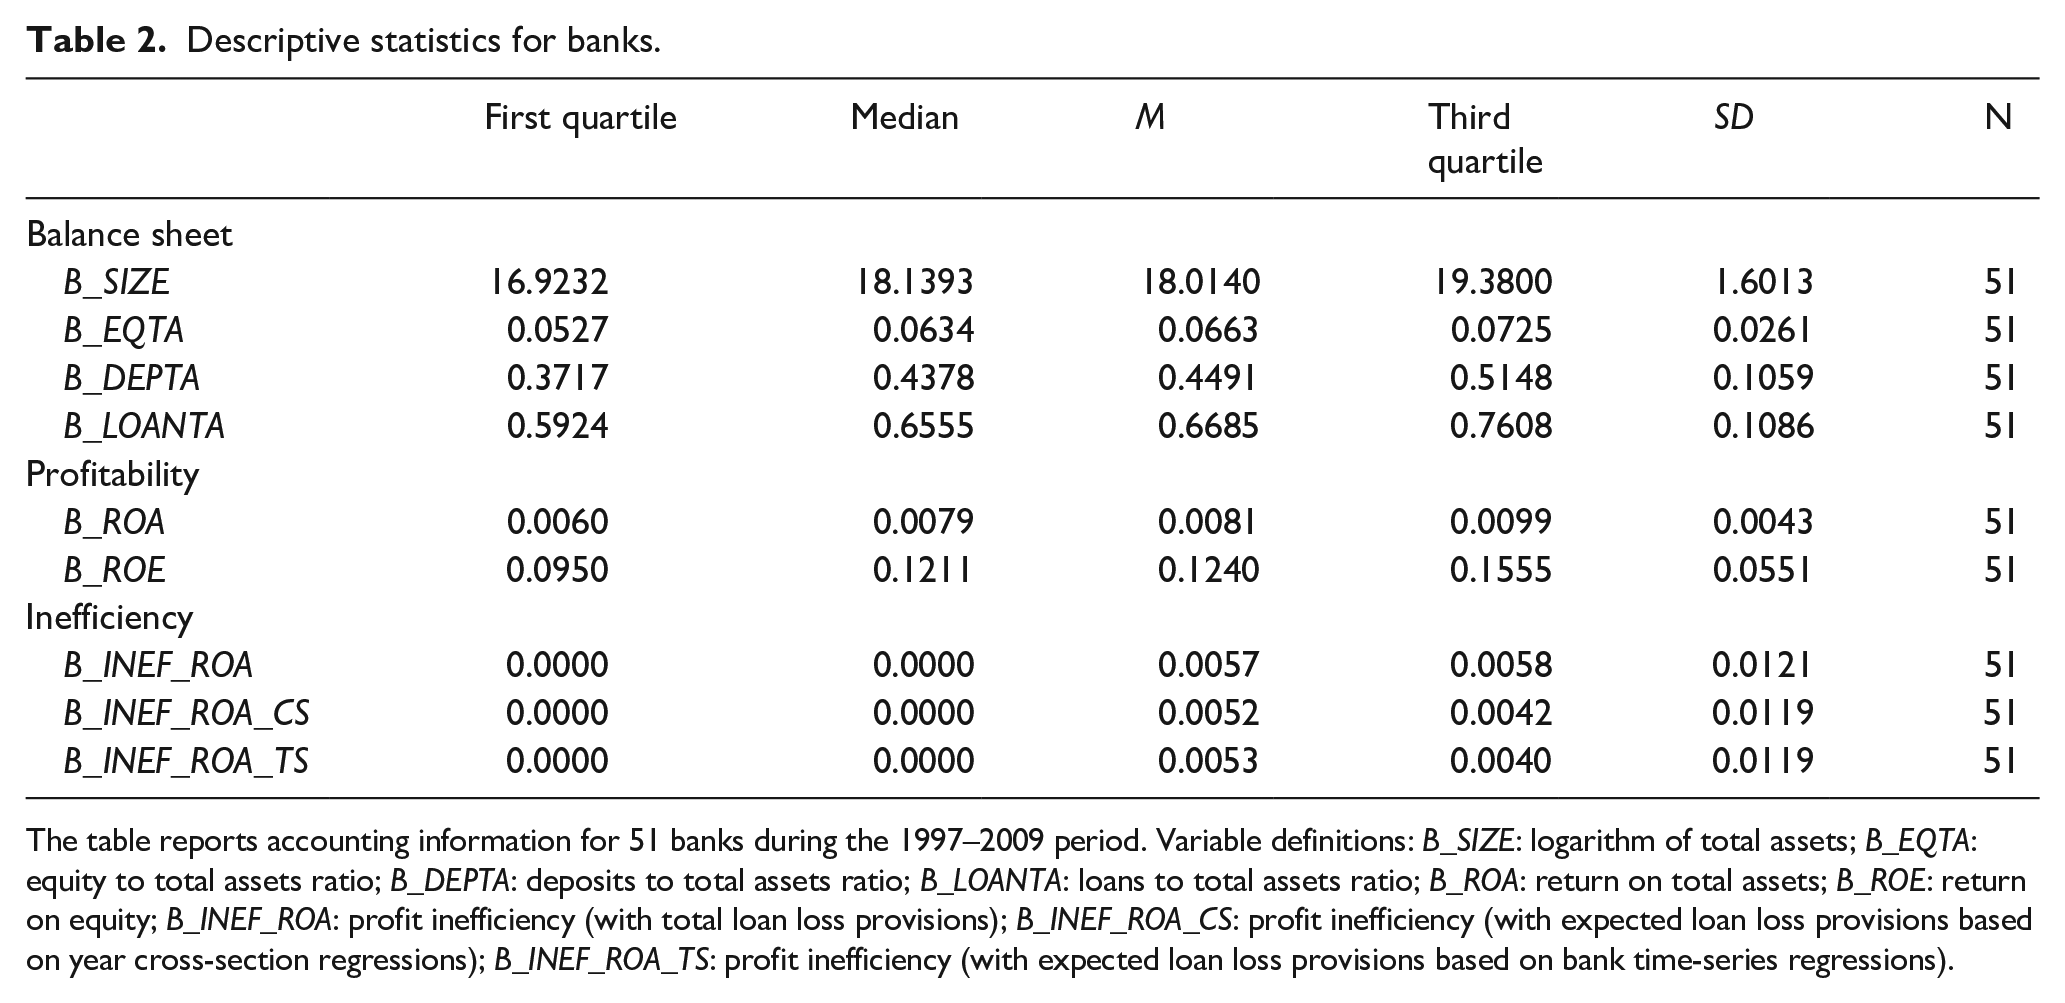
The table reports accounting information for 51 banks during the 1997–2009 period. Variable definitions: B_SIZE: logarithm of total assets; B_EQTA: equity to total assets ratio; B_DEPTA: deposits to total assets ratio; B_LOANTA: loans to total assets ratio; B_ROA: return on total assets; B_ROE: return on equity; B_INEF_ROA: profit inefficiency (with total loan loss provisions); B_INEF_ROA_CS: profit inefficiency (with expected loan loss provisions based on year cross-section regressions); B_INEF_ROA_TS: profit inefficiency (with expected loan loss provisions based on bank time-series regressions).
The information for borrowing firms corresponds to the left-hand side of each equation, whereas the information for lenders (banks) is in the corresponding right-hand side, from equations (5) to (10). Matching these two sets of information is relatively straightforward, given each firm has to be associated with its corresponding lenders and, should the former operate with several banks, this information would be included more than once.
Data on banking firms
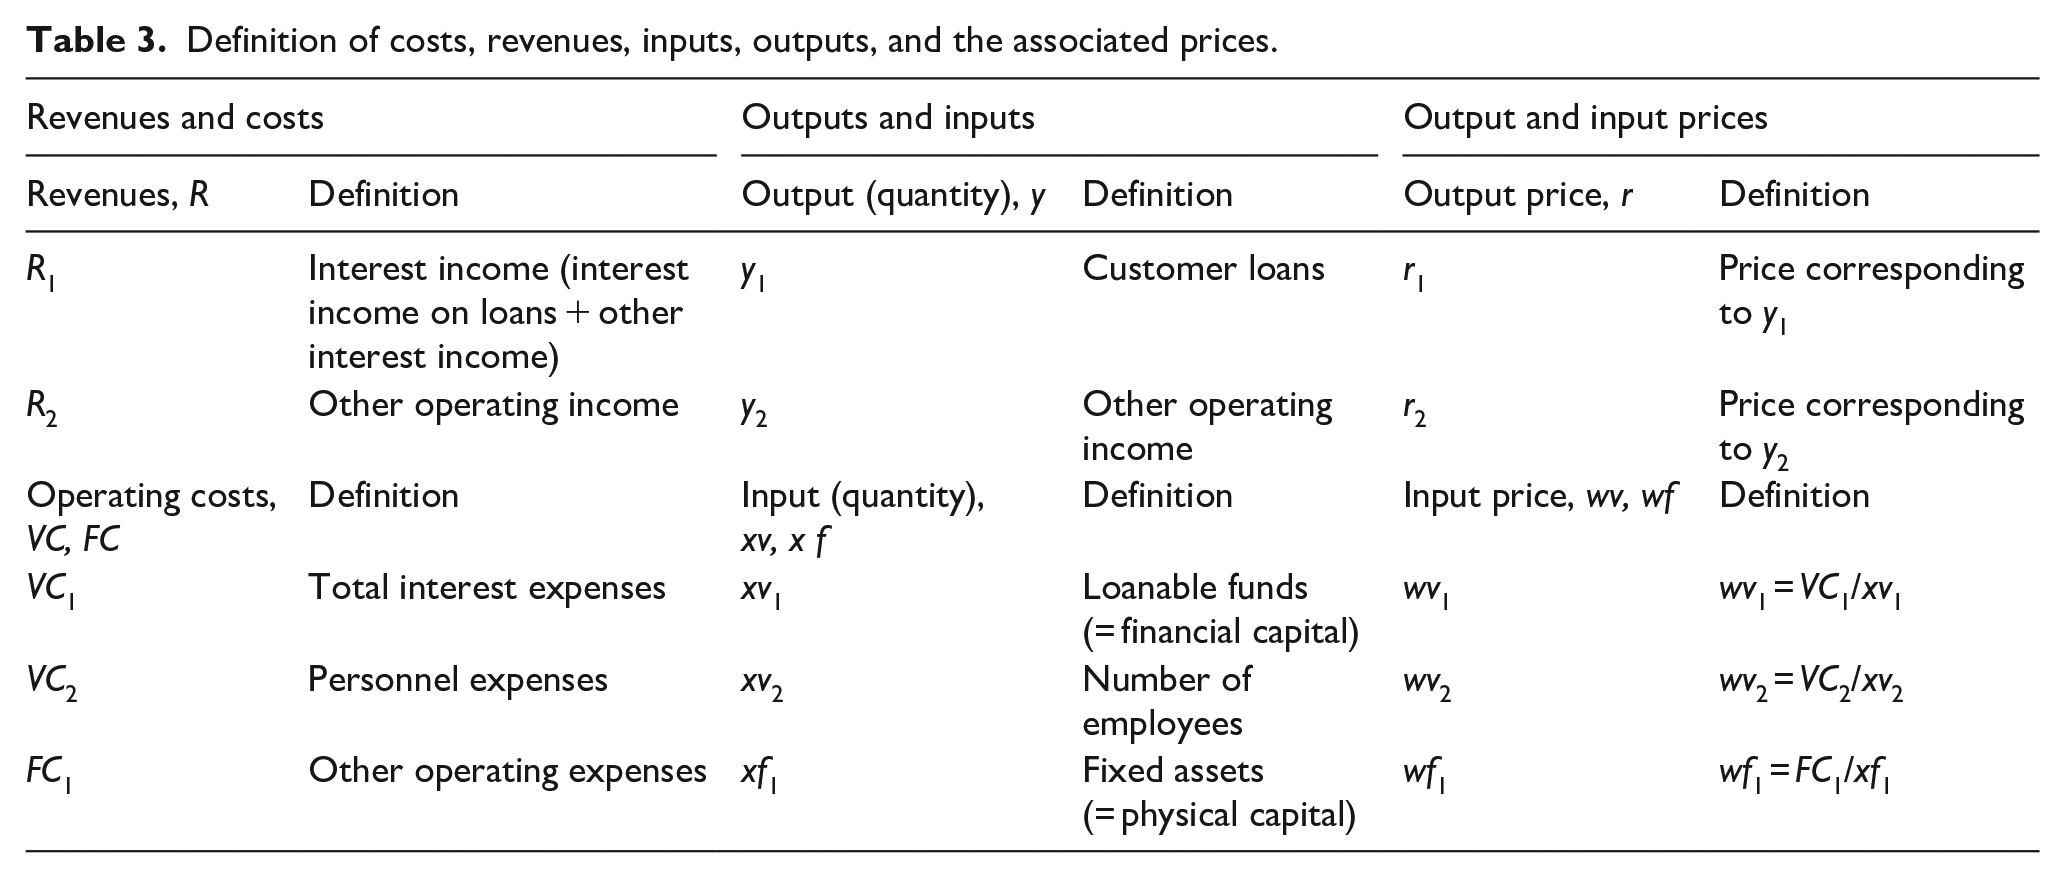
Our decomposition of banks’ profits requires detailed information on revenues, costs and LLPs. All three magnitudes have associated both quantities and their corresponding prices. In the case of LLPs these associated quantities correspond to the NPLs. In the case of costs, the three specified categories correspond to the cost of funds (total interest expenses), the cost of labor (personnel expenses), and other operating expenses. We will refer to these three magnitudes as VC1, VC2, and FC1, respectively—the first two variables reflect variable costs, whereas the last one refers to the costs generated by fixed assets and consequently represents a fixed cost. These three cost categories are generated by their corresponding input categories, that is, loanable funds (or financial capital, xv1), number of employees (xv2), and fixed assets (or physical capital, xf1).
Defining bank outputs is a more difficult task, and has been an ongoing concern for many years; some of the first relevant contributions were Fixler and Zieschang (1992) and, in the context of efficiency in banking, Berger and Humphrey (1992). According to Tortosa-Ausina (2002), there are three approaches to define banks’ output, that is, the asset approach, the value added, and the user cost. All these three approaches correspond to the intermediation approach (as opposed to the production approach), the most widely used approach to define bank activities. The definition of bank outputs has generally been conditioned by the available statistical information, which in most cases is scant, with the result that most studies have disregarded the user cost approach and, usually, the value added approach, for similar reasons.
However, as Colangelo and Inklaar (2012) note, statistical agencies have usually considered the user cost approach, according to which banks do not charge explicit fees for many of the services they provide but bundle the payment for services with the interest rates charged on loans and paid for deposits. This approach has recently been given a new twist thanks to contributions from Colangelo and Inklaar (2012), Basu et al. (2011), and Diewert et al. (2012), since the recent international financial crisis suggests there could be some mismeasurements in the banking sector. 8 Yet most of these proposals are based on information that is only available at the country level. Therefore, extending these revamped contributions to the bank level is generally not possible because the information they use is not available at this individual level of disaggregation.
In this study we face the added difficulty that, since we are focusing on the detailed de-composition of bank profits, we must be able to attach each particular revenue to each output category. This implies that we are not strictly taking the asset approach to define output, because we consider other output categories apart from assets. Specifically, we will consider two outputs, namely (a) loans that represent traditional lending activity and (b) other operating income, which refers to non-lending activities.
A further added difficulty concerns the incorporation of banks’ risk-taking behavior into the estimation of efficiency scores, for which three different approaches are considered. Following the previous literature, we first incorporate NPLs into the profit function of banks as an additional cost. In Spanish accounting standards, Spanish banks must classify a loan as nonperforming when either interest or principal payments are more than 90 days overdue. In addition, all loans granted to the borrowers in default are also considered as nonperforming, irrespective of whether or not they are overdue. In turn, the inputs consist of (a) total interest expenses; (b) personnel expenses; and (c) other operating expenses. Table 3 provides detailed definitions of inputs, outputs, and their corresponding prices. Analogously, Table 4 provides definitions for the LLPs, NPLs, and their associated prices.
Definition of costs, revenues, inputs, outputs, and the associated prices.
Definition of loan loss provisions, nonperforming loans and the associated prices.
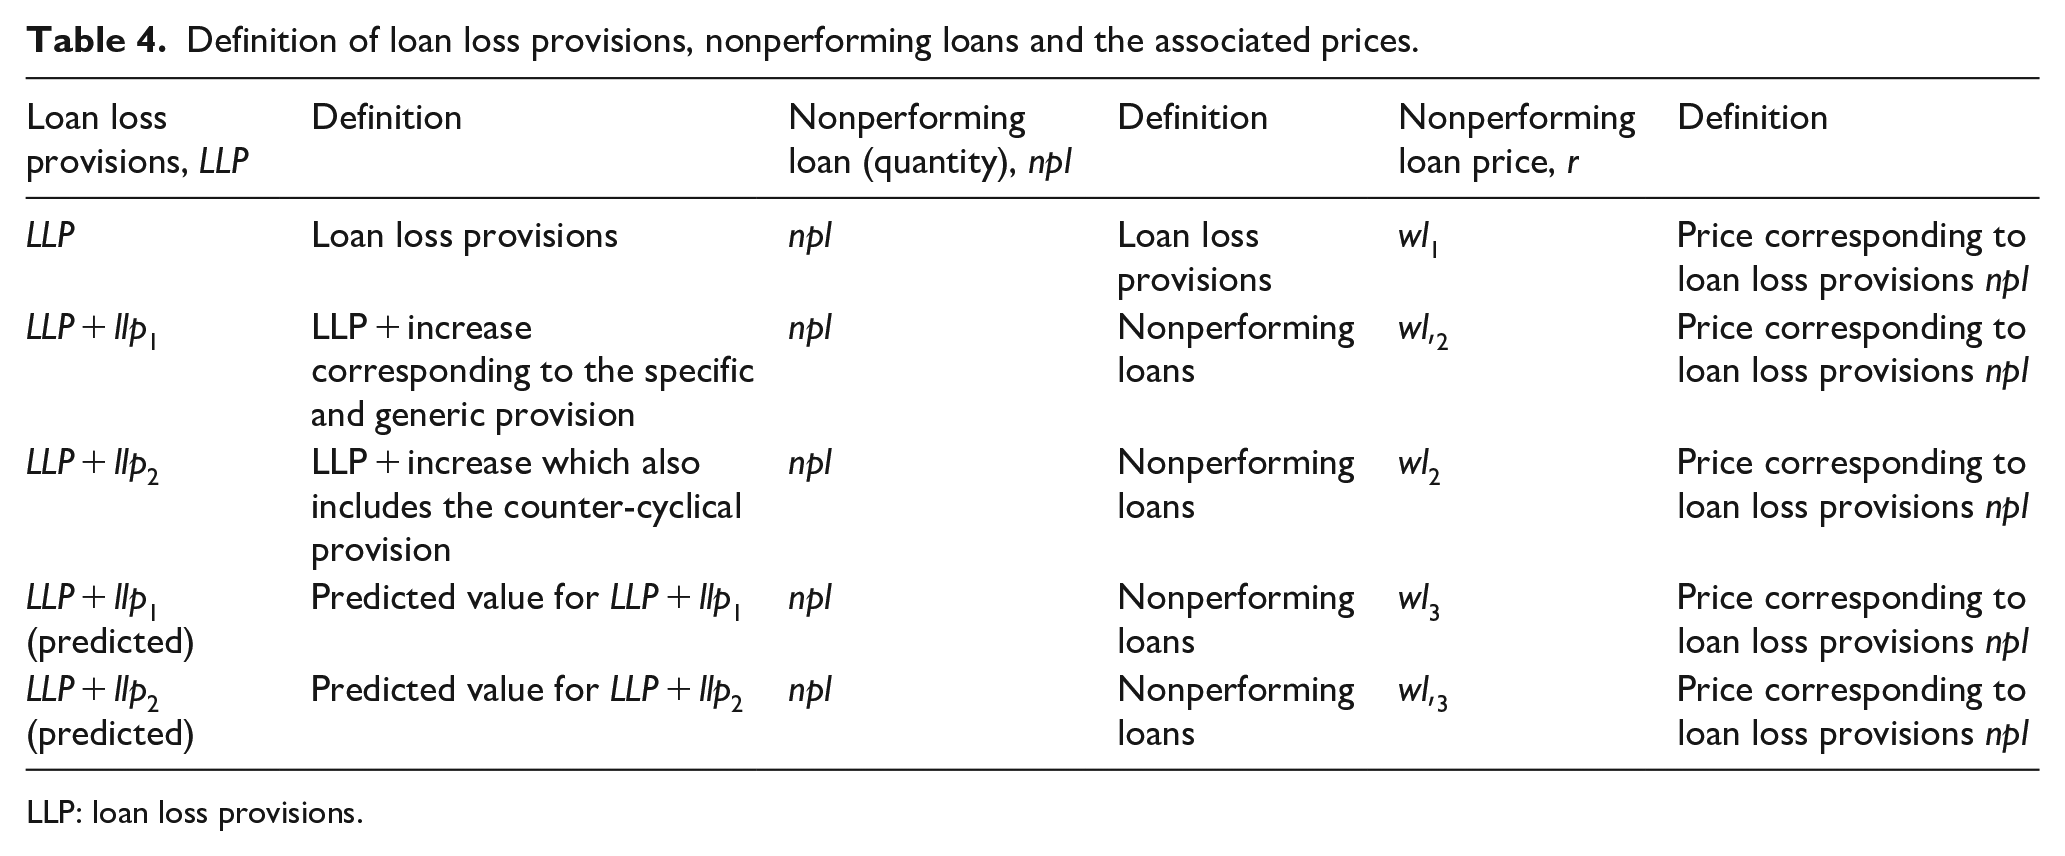
LLP: loan loss provisions.
In addition to bank inefficiency, we also consider bank control variables. These include the deposit to total assets ratio (B_DEPTA) and the loans to total assets ratio (B_LOANTA). As Keeley (1990) states, these two balance sheet variables reflect the notion that market power exists for both deposit and loan markets.
We also include equity to total asset ratio (B_EQTA), since a high capital ratio might suggest a highly risky loan portfolio (Casu & Girardone, 2006). Salas and Saurina (2003) found that banks with lower capital tended to operate with higher levels of credit risk in line with the moral hazard hypothesis. And to control for the differences between commercial banks and savings banks, we include a dummy variable that equals one if the lender is a commercial bank and zero otherwise, CB, as well as the product of CB and B_INEF_ROA, that is, CB_INEF_ROA.
Data on non-financial firms
We also consider variables at the firm level, namely, the year of firm’s registration (F_REGIS), the number of bank relationships of the non-financial firm (F_BANKREL), when many banks lend to the same borrower, the “soft” information is much more diluted. We include F_INV_COLLAT, which is the inverse measure of the ability of the firm’s ability pledge collateral, measured as the ratio of total bank debt to non-current assets, as well as F_ZSCORE, corresponding to the lagged Altman Z-score formula for predicting bankruptcy; this is a broader concept than that of firm inefficiency or firm profitability. The last two variables on non-financial firms are F_INT, representing firms’ interest rates, and BANKRUPT, which is a dummy variable that equals one if a firm defaults and zero otherwise. Stiglitz and Weiss (1981) show that higher interest rates induce firms to undertake projects with a lower probability of success.
Results
Analyzing the relationship between bank performance and risk-taking behavior
This section presents evidence on the relationship of bank profit efficiency risk taken when choosing the borrowing firms (non-financial). For this purpose, three different scenarios are compared. The results are presented in Tables 5 to 8.
Bank profit efficiency and ex ante risk-taking behavior.
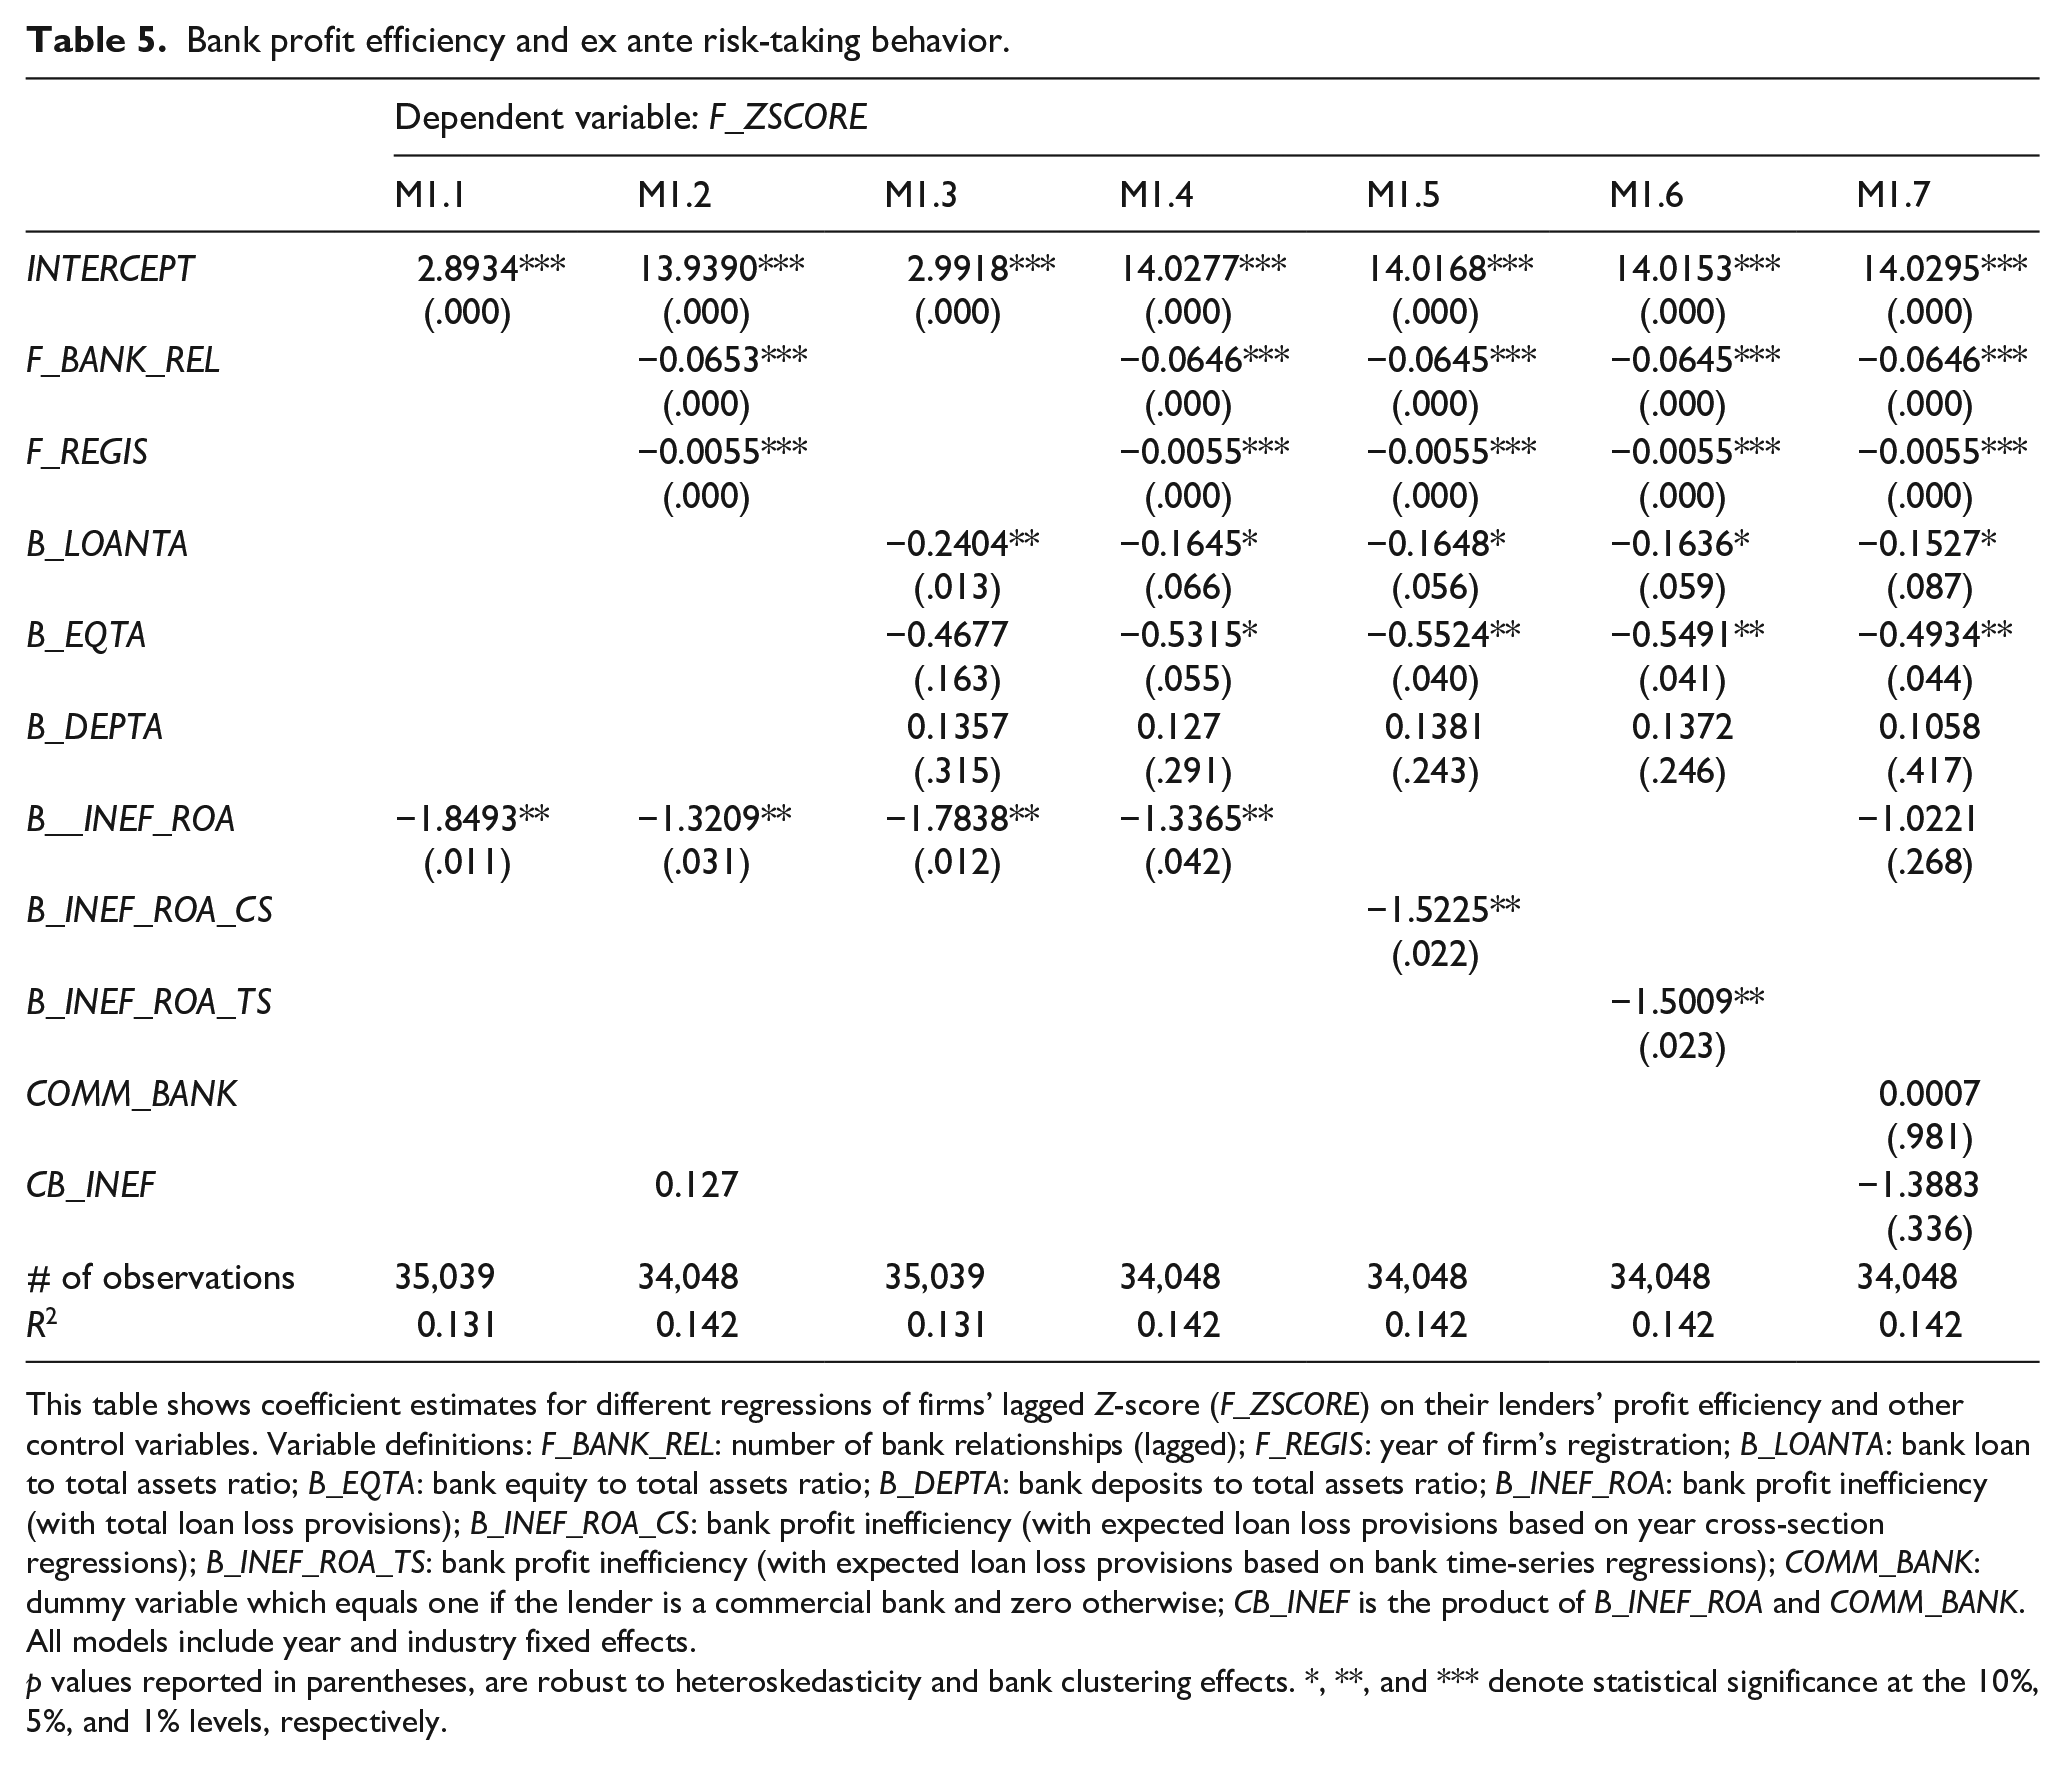
This table shows coefficient estimates for different regressions of firms’ lagged Z-score (F_ZSCORE) on their lenders’ profit efficiency and other control variables. Variable definitions: F_BANK_REL: number of bank relationships (lagged); F_REGIS: year of firm’s registration; B_LOANTA: bank loan to total assets ratio; B_EQTA: bank equity to total assets ratio; B_DEPTA: bank deposits to total assets ratio; B_INEF_ROA: bank profit inefficiency (with total loan loss provisions); B_INEF_ROA_CS: bank profit inefficiency (with expected loan loss provisions based on year cross-section regressions); B_INEF_ROA_TS: bank profit inefficiency (with expected loan loss provisions based on bank time-series regressions); COMM_BANK: dummy variable which equals one if the lender is a commercial bank and zero otherwise; CB_INEF is the product of B_INEF_ROA and COMM_BANK. All models include year and industry fixed effects.
p values reported in parentheses, are robust to heteroskedasticity and bank clustering effects. *, **, and *** denote statistical significance at the 10%, 5%, and 1% levels, respectively.
Bank profit efficiency and borrower defaults.
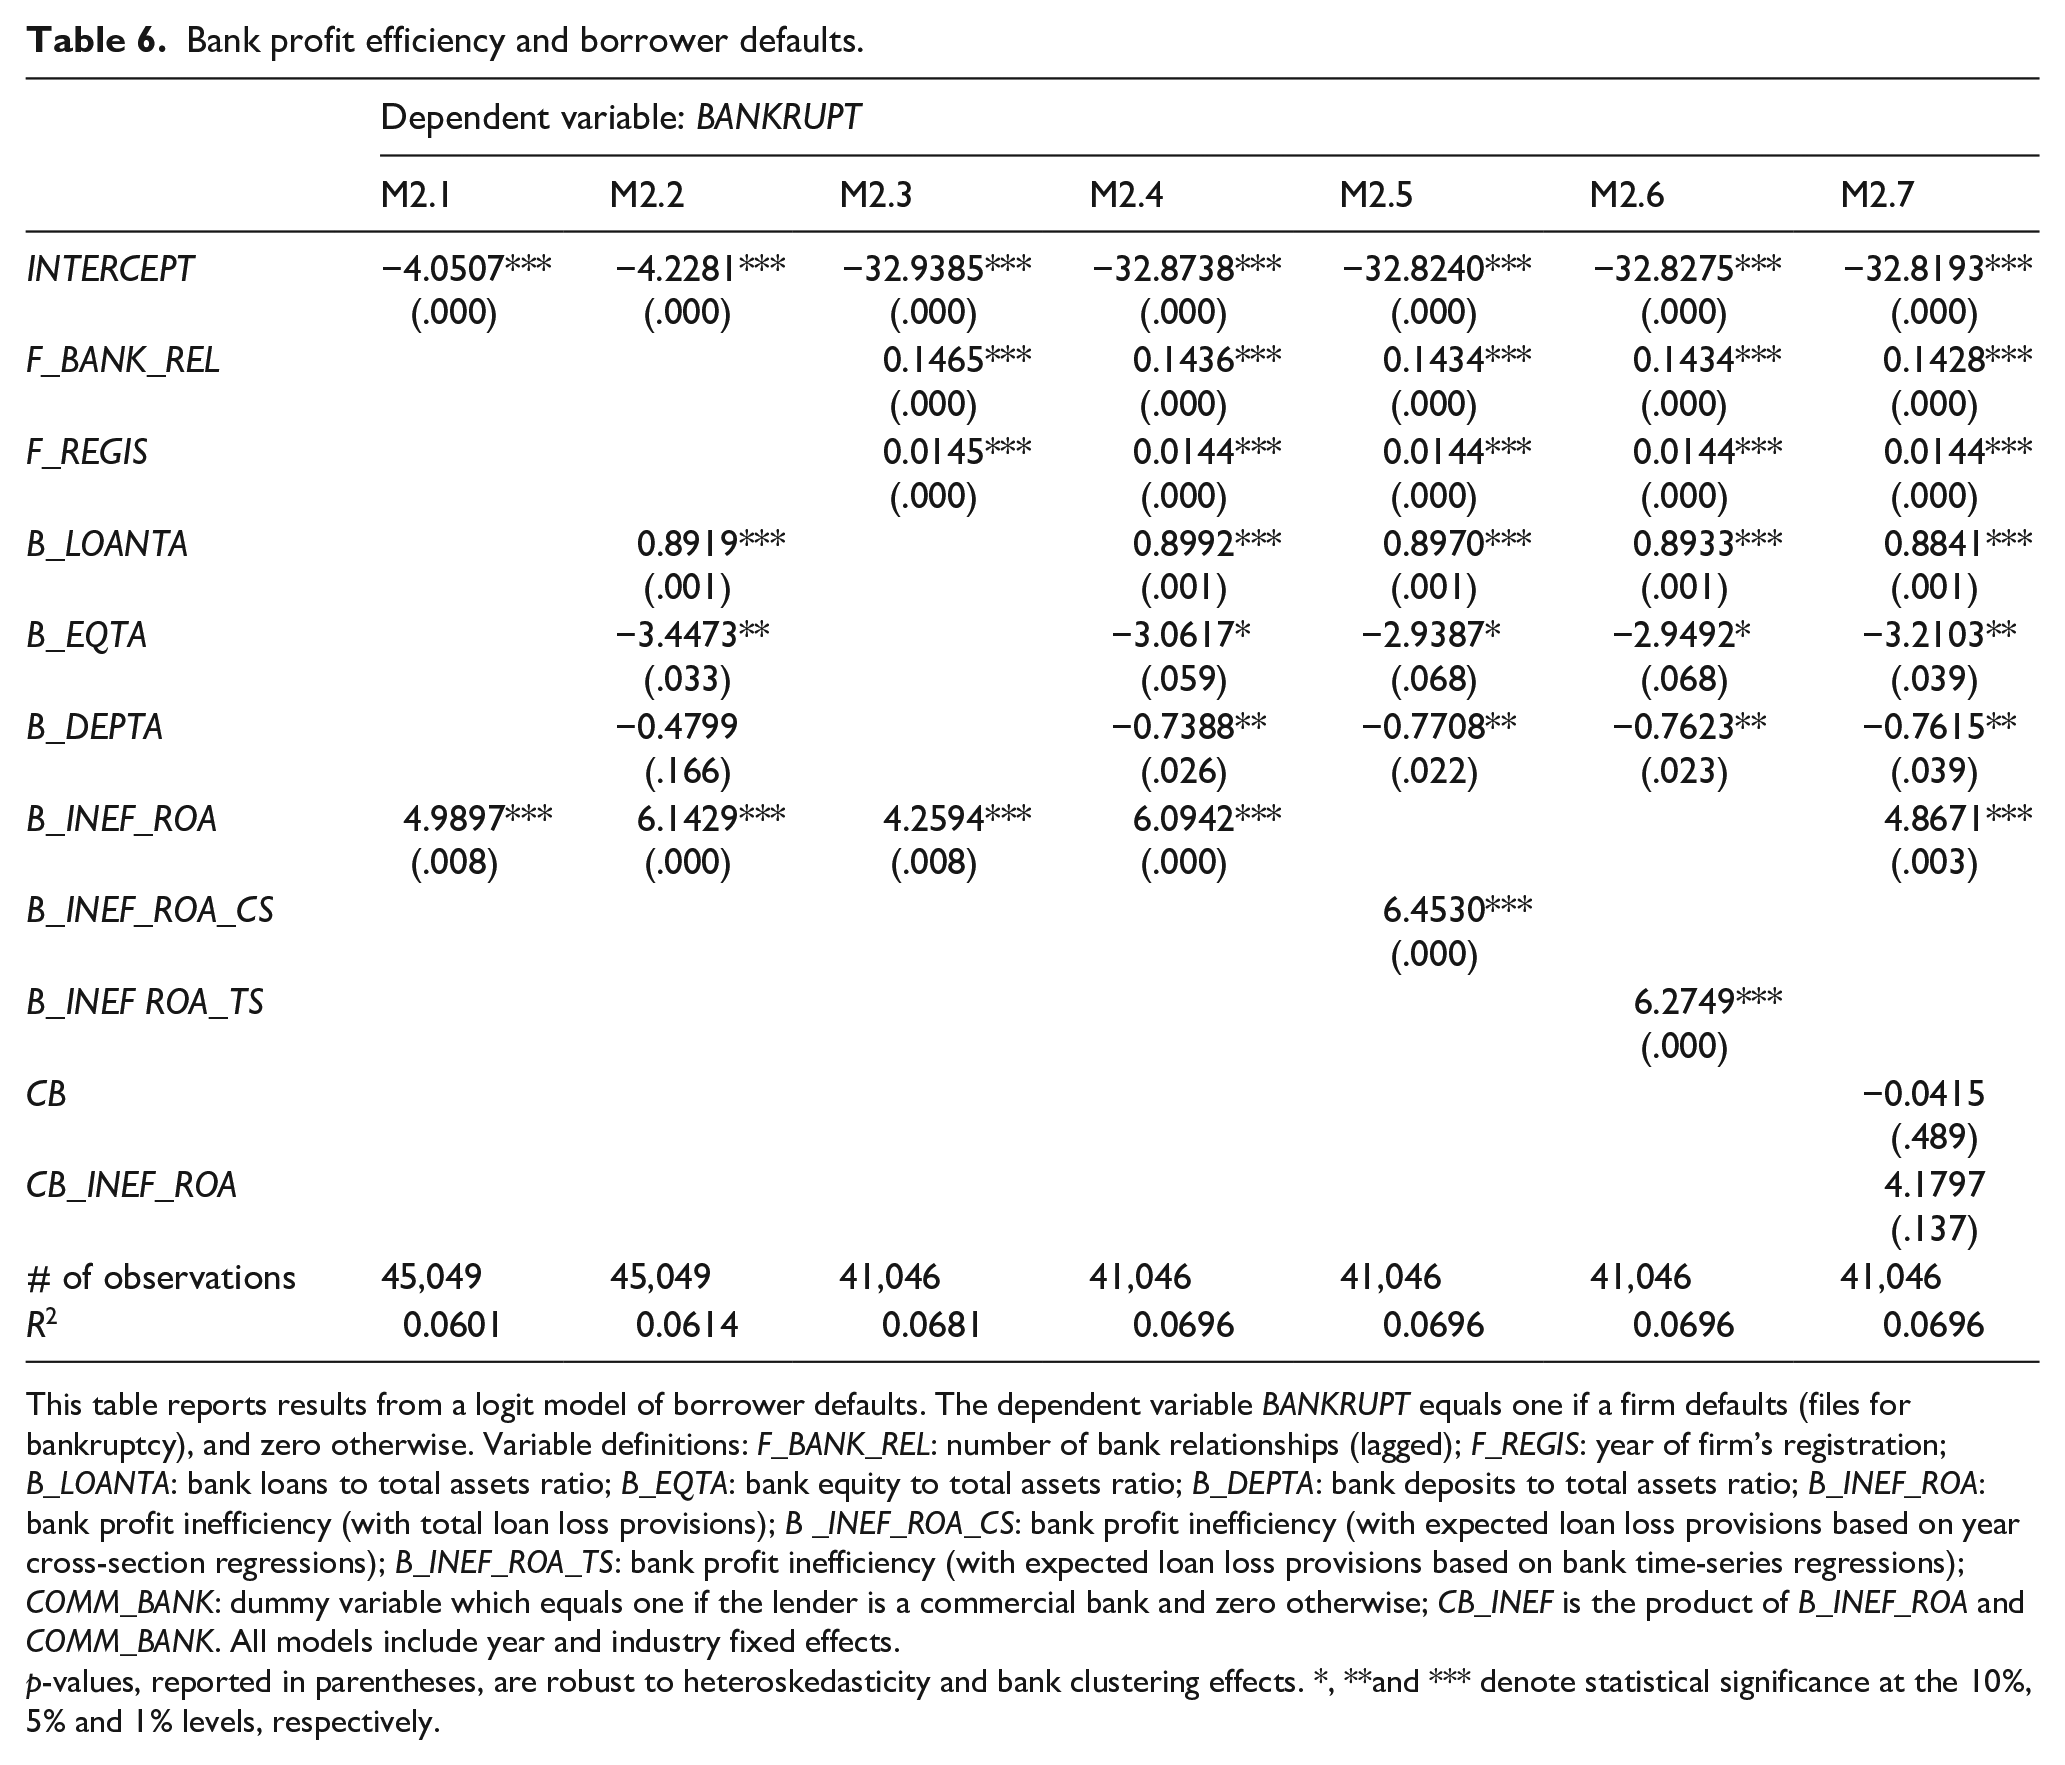
This table reports results from a logit model of borrower defaults. The dependent variable BANKRUPT equals one if a firm defaults (files for bankruptcy), and zero otherwise. Variable definitions: F_BANK_REL: number of bank relationships (lagged); F_REGIS: year of firm’s registration; B_LOANTA: bank loans to total assets ratio; B_EQTA: bank equity to total assets ratio; B_DEPTA: bank deposits to total assets ratio; B_INEF_ROA: bank profit inefficiency (with total loan loss provisions); B _INEF_ROA_CS: bank profit inefficiency (with expected loan loss provisions based on year cross-section regressions); B_INEF_ROA_TS: bank profit inefficiency (with expected loan loss provisions based on bank time-series regressions); COMM_BANK: dummy variable which equals one if the lender is a commercial bank and zero otherwise; CB_INEF is the product of B_INEF_ROA and COMM_BANK. All models include year and industry fixed effects.
p-values, reported in parentheses, are robust to heteroskedasticity and bank clustering effects. *, **and *** denote statistical significance at the 10%, 5% and 1% levels, respectively.
Bank profit efficiency, interest rates and collateral.
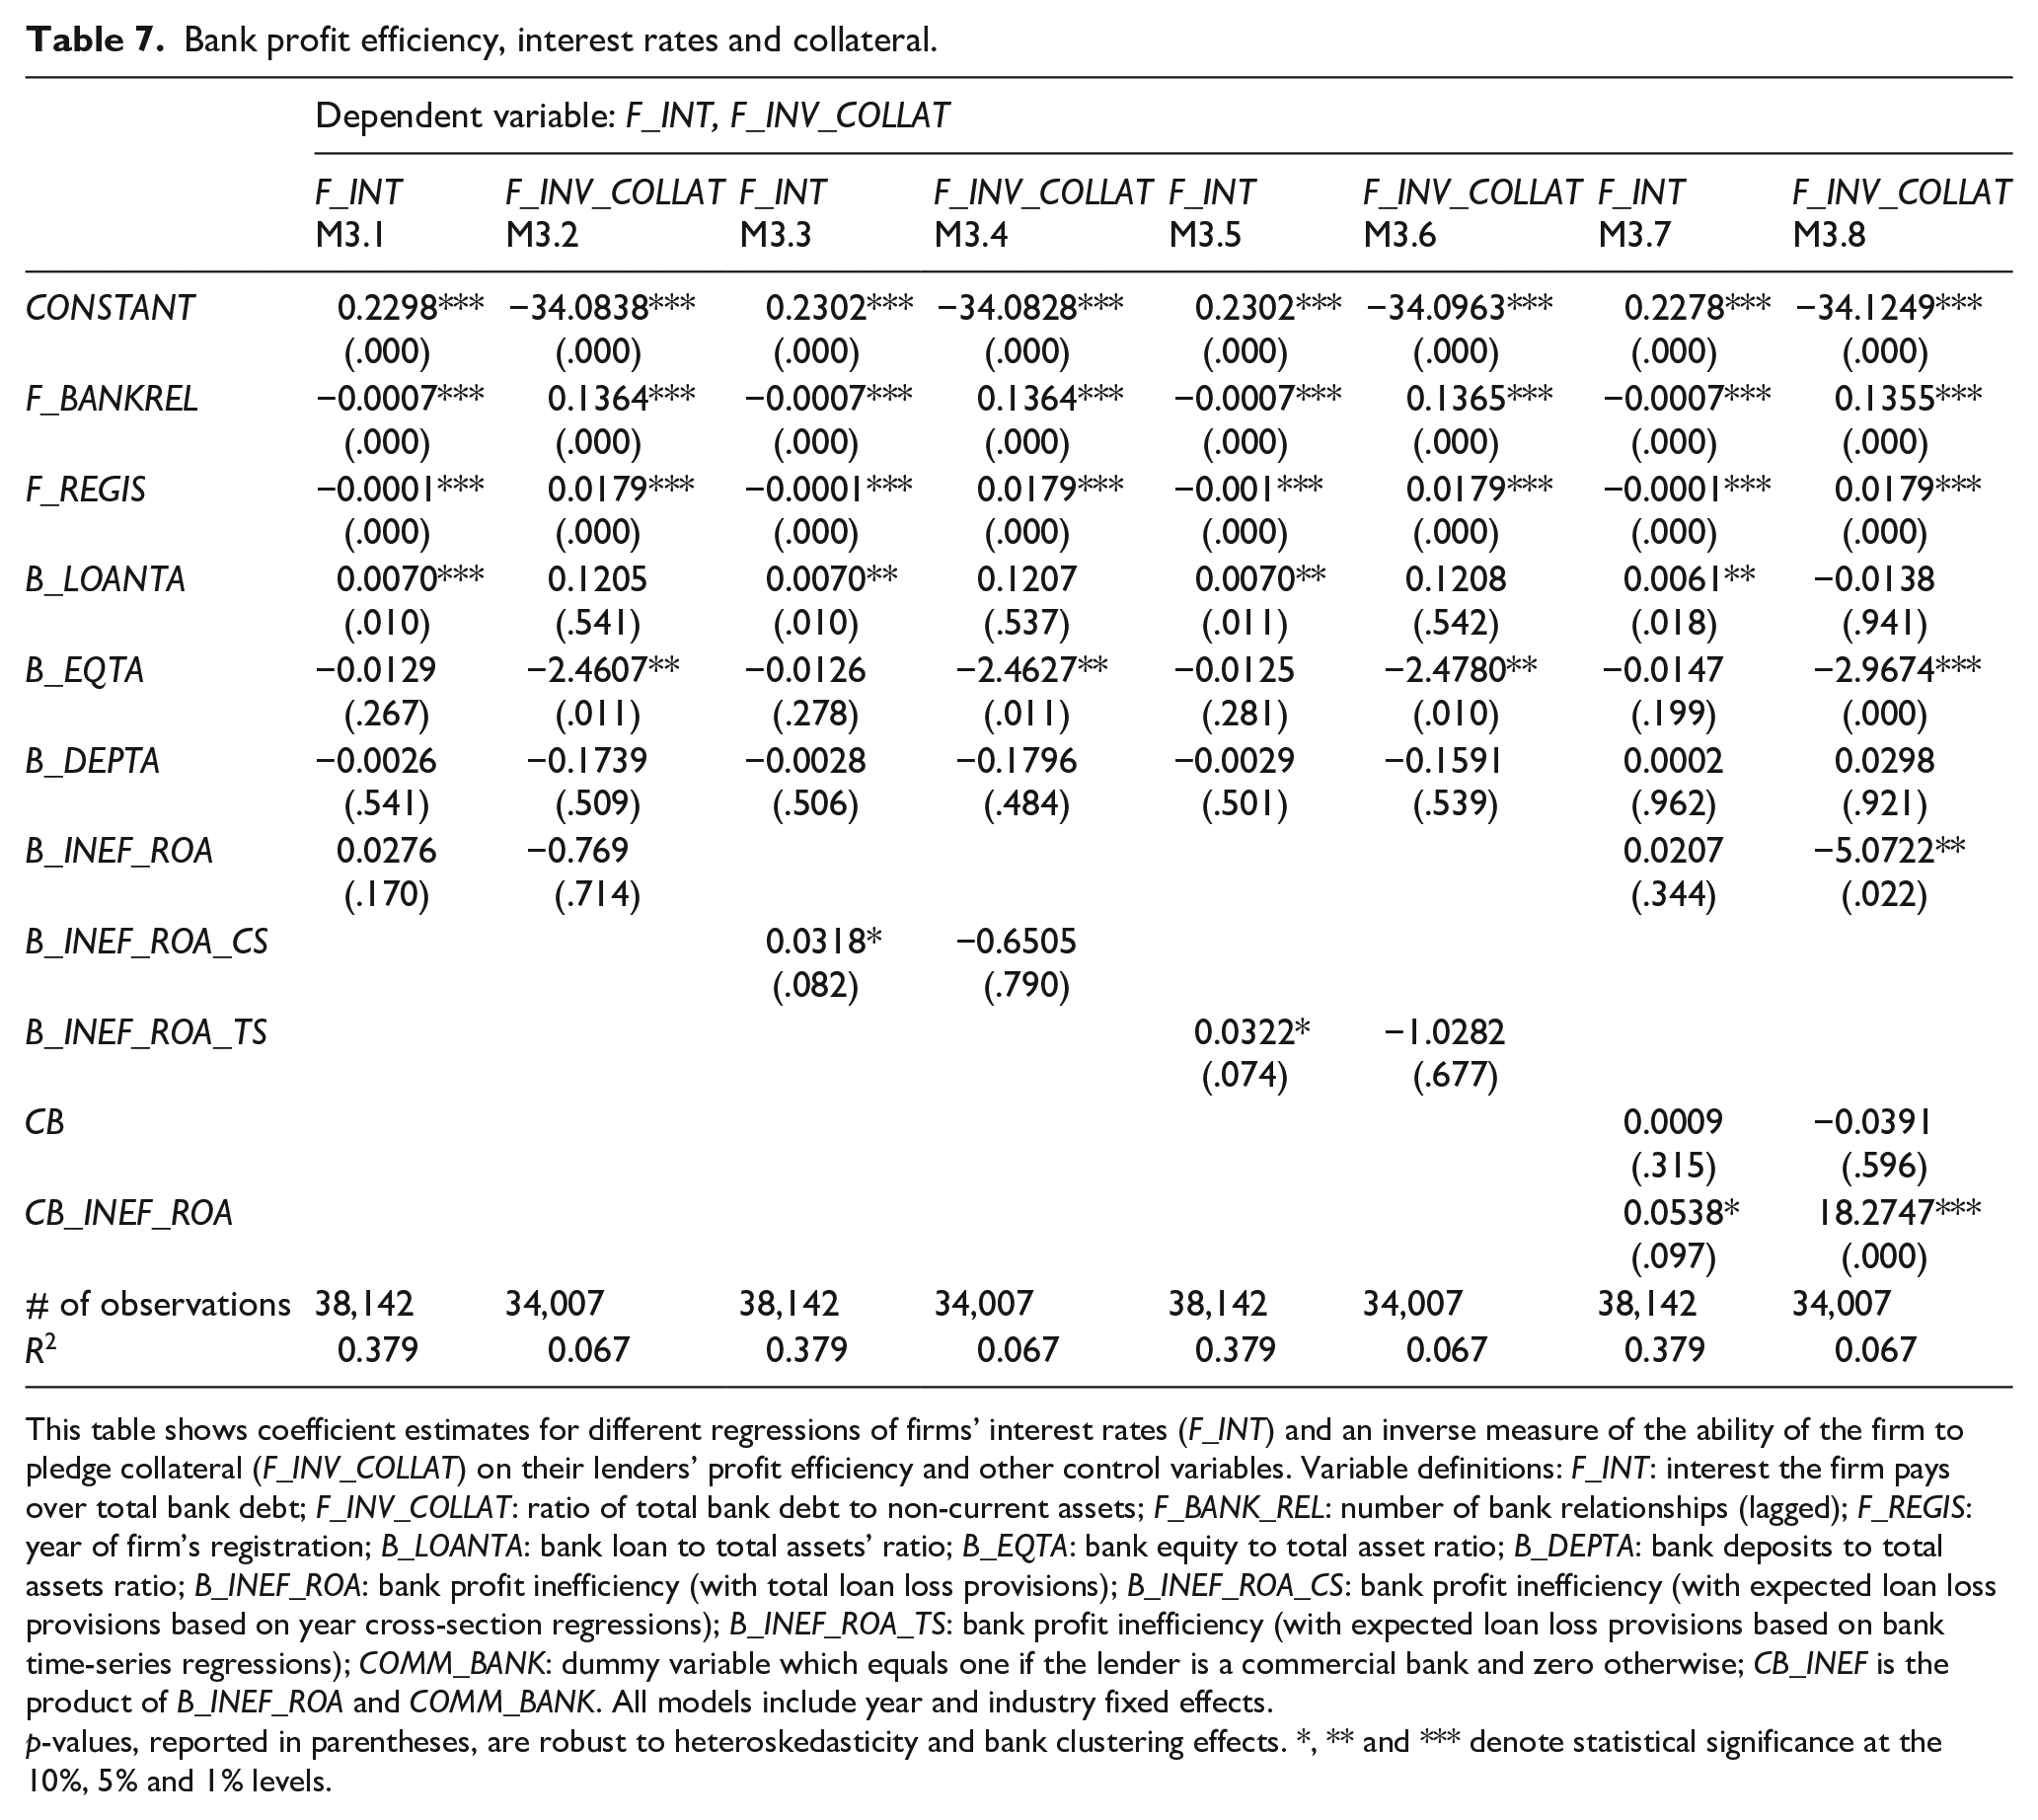
This table shows coefficient estimates for different regressions of firms’ interest rates (F_INT) and an inverse measure of the ability of the firm to pledge collateral (F_INV_COLLAT) on their lenders’ profit efficiency and other control variables. Variable definitions: F_INT: interest the firm pays over total bank debt; F_INV_COLLAT: ratio of total bank debt to non-current assets; F_BANK_REL: number of bank relationships (lagged); F_REGIS: year of firm’s registration; B_LOANTA: bank loan to total assets’ ratio; B_EQTA: bank equity to total asset ratio; B_DEPTA: bank deposits to total assets ratio; B_INEF_ROA: bank profit inefficiency (with total loan loss provisions); B_INEF_ROA_CS: bank profit inefficiency (with expected loan loss provisions based on year cross-section regressions); B_INEF_ROA_TS: bank profit inefficiency (with expected loan loss provisions based on bank time-series regressions); COMM_BANK: dummy variable which equals one if the lender is a commercial bank and zero otherwise; CB_INEF is the product of B_INEF_ROA and COMM_BANK. All models include year and industry fixed effects.
p-values, reported in parentheses, are robust to heteroskedasticity and bank clustering effects. *, ** and *** denote statistical significance at the 10%, 5% and 1% levels.
Profit efficiency and the lending behavior of Spanish savings banks: home vs. new markets.
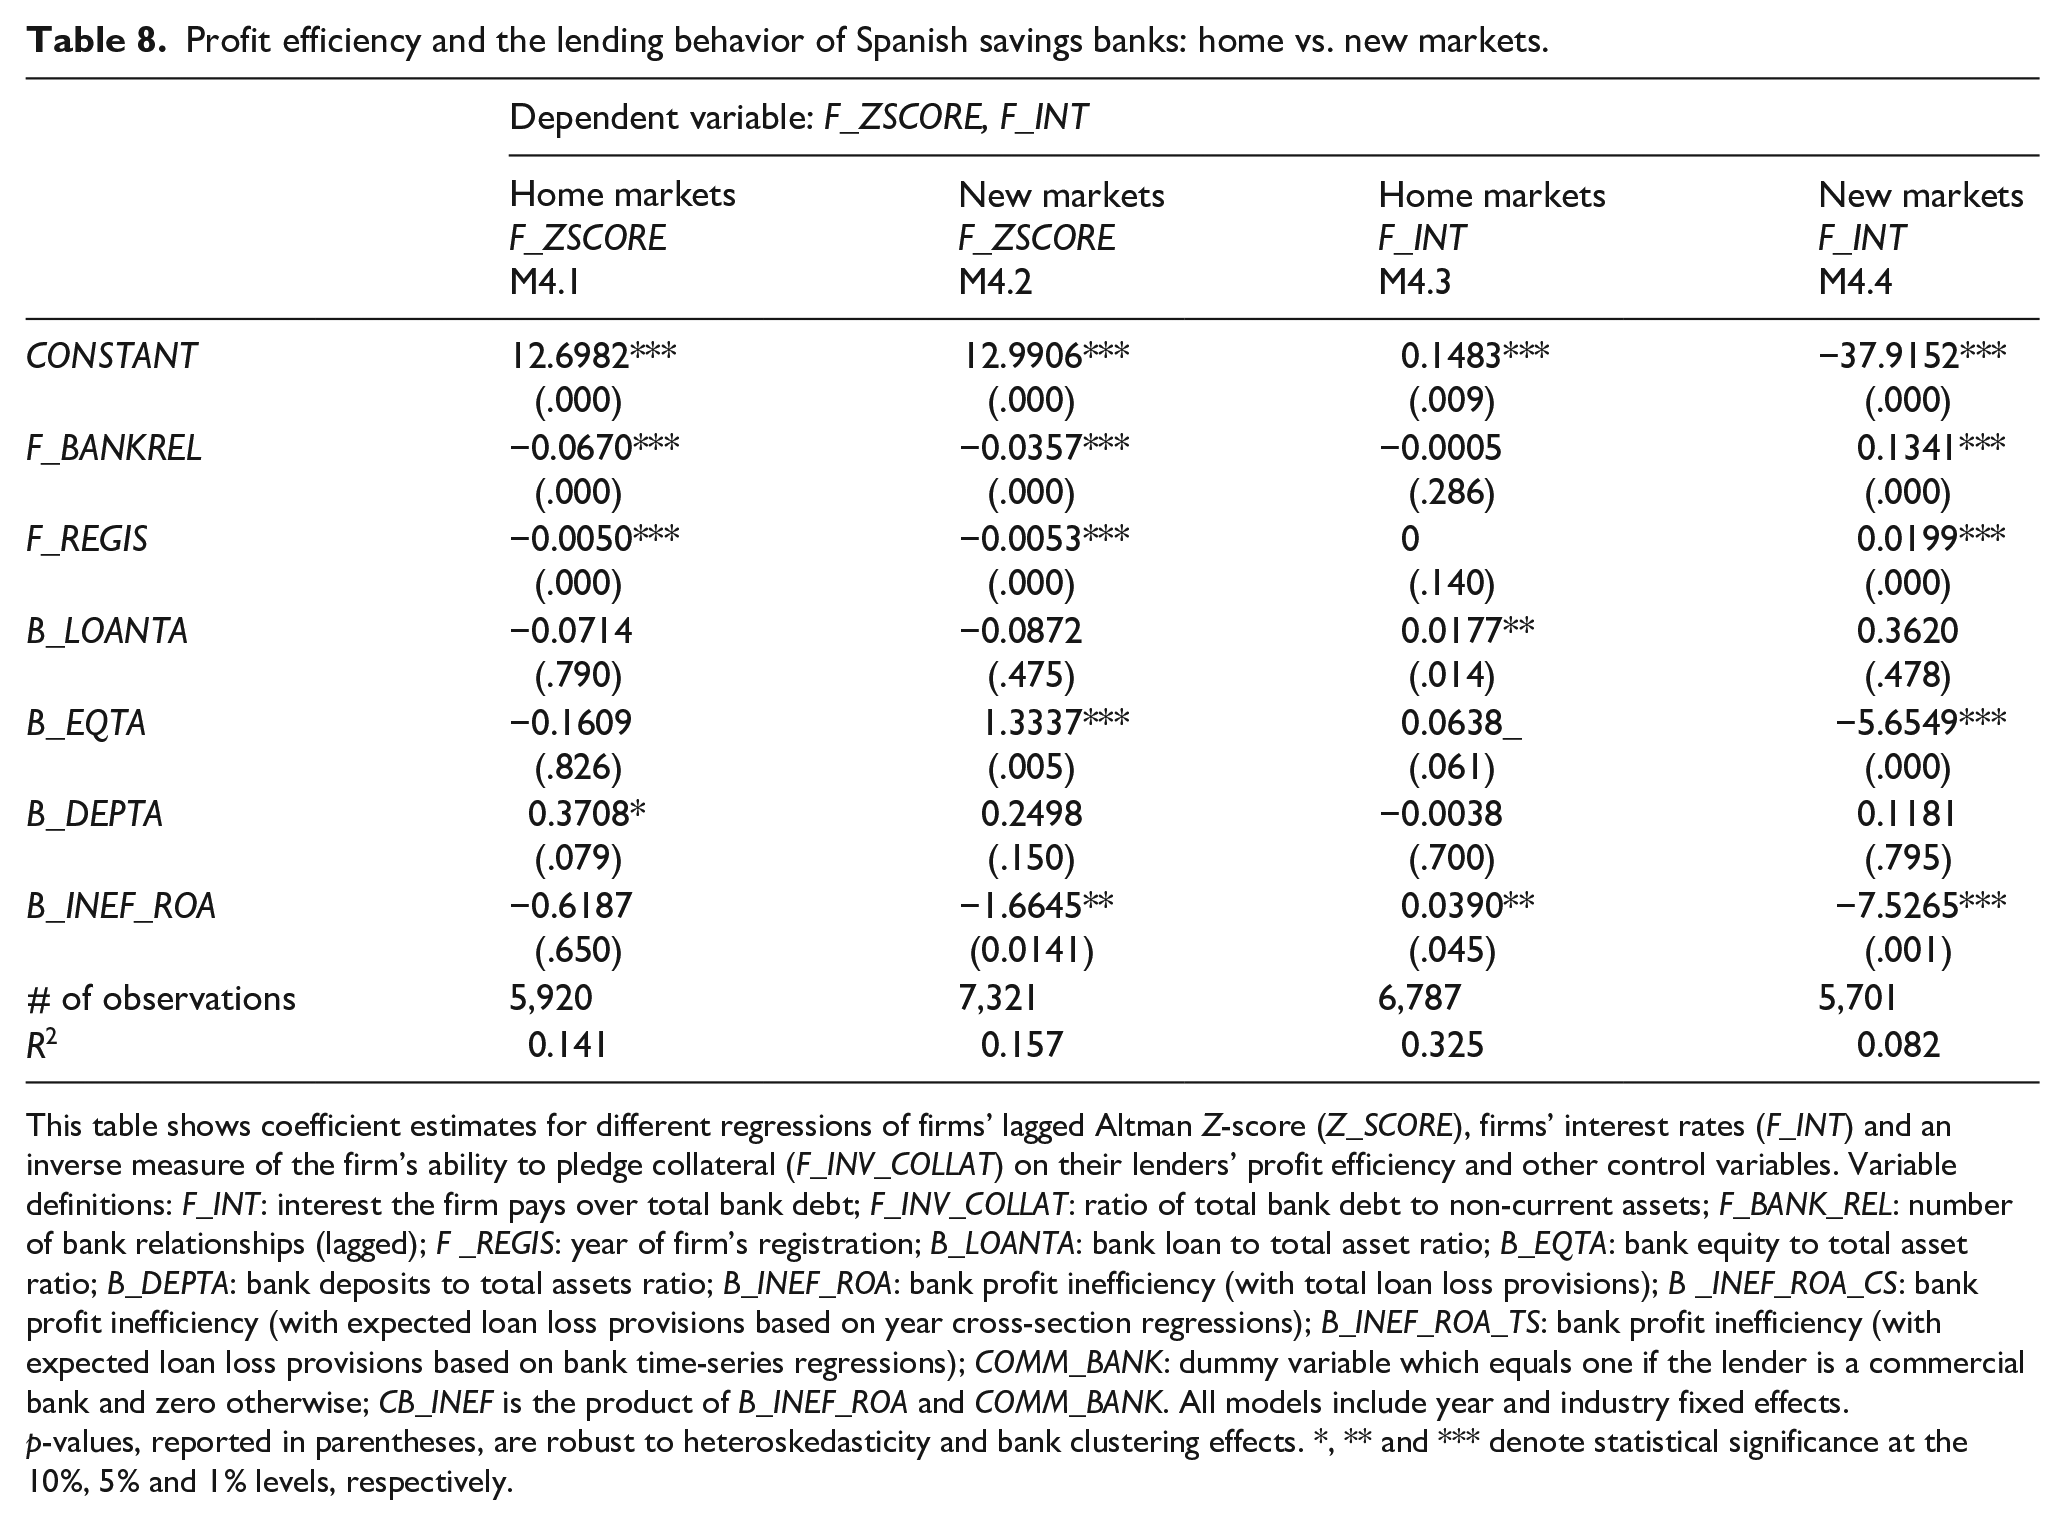
This table shows coefficient estimates for different regressions of firms’ lagged Altman Z-score (Z_SCORE), firms’ interest rates (F_INT) and an inverse measure of the firm’s ability to pledge collateral (F_INV_COLLAT) on their lenders’ profit efficiency and other control variables. Variable definitions: F_INT: interest the firm pays over total bank debt; F_INV_COLLAT: ratio of total bank debt to non-current assets; F_BANK_REL: number of bank relationships (lagged); F _REGIS: year of firm’s registration; B_LOANTA: bank loan to total asset ratio; B_EQTA: bank equity to total asset ratio; B_DEPTA: bank deposits to total assets ratio; B_INEF_ROA: bank profit inefficiency (with total loan loss provisions); B _INEF_ROA_CS: bank profit inefficiency (with expected loan loss provisions based on year cross-section regressions); B_INEF_ROA_TS: bank profit inefficiency (with expected loan loss provisions based on bank time-series regressions); COMM_BANK: dummy variable which equals one if the lender is a commercial bank and zero otherwise; CB_INEF is the product of B_INEF_ROA and COMM_BANK. All models include year and industry fixed effects.
p-values, reported in parentheses, are robust to heteroskedasticity and bank clustering effects. *, ** and *** denote statistical significance at the 10%, 5% and 1% levels, respectively.
Hypothesis 1. The most inefficient banks take more risks when selecting their borrowers
Hypothesis 1a. The most inefficient banks will lend to less profitable or more inefficient firms
The first part of the first hypothesis tests whether the most inefficient banks lend to less profitable or efficient firms. The results of estimating equation (5) are shown in Table 5 and represent the link of firms’ Z-scores (F_ZSCORE), lagged, with respect to their lenders’ profit efficiency levels. The F_ZSCORE variable is Altman’s Z-score bankruptcy predictor, and it is used as a proxy for firms’ financial distress.
The first column of Table 5 (Model M1.1) reports the results of the regression when only bank profit inefficiency is included as an independent variable. The results show a statistically significant correlation between F_ZSCORE and B_INEF_ROA (bank profit inefficiency including total LLPs). This negative sign might be corroborating the first hypothesis, which stated that the most inefficient banks will lend to less profitable firms. In other words, the most inefficient banks will grant the loan, despite being aware of the relative insolvency of their client. Although several explanations for this strategy might exist, and we should not discard the possible existence of reverse causality (which would deserve a specific investigation), these banks might be trying to offset their lack of profit efficiency by increasing their customers base, which would be partly achieved by relaxing the requirements for lending (Foos et al., 2010).
The second regression (second column in Table 5, Model M1.2) adds two regressors related to the borrowing firms, namely, the age of the company (F_REGIS) and the number of lending banks each company has (F_BANK_REL). The results show the three variables have a statistically significant effect on the firms’ Z_SCORE. The signs of the relationship are negative, implying that the least profitable firms have fewer bank lenders, are younger, and borrow from the most inefficient banks. If a firm is a poor financial performer, fewer banks will be willing to grant it a loan. Diamond (1991) argues that companies in continuous existence for longer periods have already shown they can survive the difficulties in the early stages of their business life. Cole (1998) finds evidence that firms receiving loans are older and more profitable. However, the B_INEF_ROA variable is the one with a highest coefficient and, therefore, it is the most important variable for the least profitable companies.
The third regression (third column in Table 5, Model M1.3) considers bank-related variables, instead of firm-related variables. The variables taken into account are B_INEF_ROA, B_LOANTA (bank loan to total assets ratio), B_EQTA (bank equity to total assets ratio), and B_DEPTA (total deposits as a share of total assets). In this case, only the B_INEF_ROA and B_LOANTA variables are statistically significant, and their effect is negative. This would indicate that banks with a higher share of loans to total assets are the ones lending to the riskiest firms. This result is in line with Foos et al. (2010), who found that credit growth contributes to increased bank risk. Again, the variable representing lender’s inefficiency, with a coefficient of −1.7838, has the greatest impact on the firm’s economic situation.
The fourth regression (fourth column in Table 5, Model M1.4) considers both types of variables—that is, related to both non-financial firms and banks. All variables are significant and with a negative sign, except B_DEPTA, which remains nonsignificant. The B_LOANTA variable is less significant than in Model M1.3.
However, the B_EQTA, related to banks’ insolvency, is now significant—although only at the 10% significance level, that is, banks’ insolvency levels do influence their borrowers’ probability of bankruptcy.
Models M1.5 and M1.6 (fifth and sixth columns in Table 5) only differ from those in Model M1.4 in the way they measure bank inefficiency. Model M1.5 uses the B INEF ROA CS variable, that is, bank profit inefficiency with expected LLPs based on year cross-section regressions. The results are similar, and the main differences are, first, that the B_EQTA variable improves the level of significance from 10% to 5% and, in addition, that the coefficient corresponding to bank inefficiency increases (in absolute terms) from −1.3365 to −1.5225. The measure of the inefficiency of banks in Model M1.6 is B_INEF_ROA_TS, bank profit inefficiency with expected LLPs based on bank time-series regressions, and the results do not show significant differences from Model M1.5.
For Model M1.7 (seventh column in Table 5), we include two additional variables, CB_INEF and COMM_BANK, to check for differences between savings banks and commercial banks. The results indicate that the B_INEF_ROA variable is not statistically significant. We can conclude that the relationship between bank inefficiency and their borrowing firms’ low profitability levels is not affected by the type of bank (commercial banks or savings banks).
From these results we can infer that bank profit inefficiency indicates that they are taking an ex ante risk, risk being measured as the lagged Z-score of the borrowing firms. It is therefore possible to tentatively conclude that less efficient banks will grant loans to less profitable firms.
Hypothesis 1b. Firms that obtain credits from inefficient banks are more likely to go bankrupt
The second part of the first hypothesis, concerning ex post risk, tests whether the most inefficient banks have a higher number of customers in bankruptcy. Table 6 reports the results of estimating equation (7) and, as in Table 5, presents seven different models to analyze the relationship between banks’ inefficiency and firms’ (clients’) bankruptcy.
In Model M2.1 (first column of Table 6) the independent variable is B_INEF_ROA. The results show that this variable is statistically significant, and has a positive sign. Therefore, Hypothesis 1b, according to which the most inefficient banks have a higher number of borrowing firms in bankruptcy, is corroborated.
Model M2.2 (second column in Table 6) includes the variables specific to banks, B_LOANTA, B_EQTA and B_DEPTA. The results show that B_LOANTA, B_EQTA and B_INEF_ROA variables are statistically significant. The sign, or B_EQTA, is negative, whereas in the other two cases it is positive. Therefore, we can reiterate that the most inefficient banks have more customers in bankruptcy. In contrast, banks with a higher proportion of loans with lower solvency levels also have more bankruptcies among their borrowers. However, the fact that banks have a higher proportion of deposits does not affect the number of bankruptcies among their borrowing firms, since the B_DEPTA variable is not significant.
Model M2.3 (third column in Table 6) also includes variables relative to borrowing firms—F_REGIS and F_BANK_REL. The three variables (F_REGIS, F_BANK_REL and also B_INEF_ROA) are statistically significant, with a positive sign, implying that the higher the inefficiency of the lending bank (B_INEF_ROA), the higher the age of the borrowing firm (F REGIS), and the higher the number of banking relationships (F_BANK_REL) the borrowing firm has, the greater the probability of bankruptcy. This finding might not be a priori in line with some literature (Jiménez & Saurina, 2004) which has indicated that when firms have relationships with more banks, then it is more difficult for any of them to monopolize the information on the borrower’s quality, so that the incentives to finance higher-risk borrowers decrease. However, some links might be intricate, as interactions (for instance, between the number of bank relationships and bank inefficiency) might also be playing a role.
Model M2.4 (fourth column in Table 6) takes into account both types of variables—that is, related to banks and to non-financial firms. The results show that all the variables are statistically significant, although B_EQTA is significant only at the 10% level. The signs are positive for all variables except for B_EQTA and B_DEPTA. Therefore, we can claim that the higher the number of banking relationships (F_BANK_REL), the more years of experience firms have (F_REGIS), the higher the proportion of loans of the lending bank (B_LOANTA), the lower the capital ratio (B_EQTA), the lower the volume of deposits as a share of total assets (B_DEPTA), and the more inefficient the lending bank is (B_INEF_ROA), the higher the probability of bankruptcy of the borrowing firm (BANKRUPT).
Models M2.5 and M2.6 (fifth and sixth columns in Table 6) consider different measures of bank inefficiency. Model M5 considers the variable B_INEF_ROA_CS, whereas Model M6 considers B_INEF_ROA_TS. However, the results are virtually identical to those corresponding to Model 4, and the interpretation should be the same as well.
Model M2.7 (column seven of Table 6) includes two additional variables: first, a dummy (CB) indicating whether the lender is a commercial bank or not; second, the variable CB_INEF (result of multiplying B_INEF_ROA and COMM_BANK). These two variables are intended to determine whether there is any connection with the fact that the lender is a commercial bank or otherwise. The main difference with Model 4 is that B_EQTA, which represents the capital ratio corresponding to the lending bank, increases its level of significance, and the impact of the variable representing lender inefficiency (B_INEF_ROA) is now lower (from 6.0942 to 4.8671). The two new variables added, CB and CB_INEF, are not statistically significant.
The results of the first hypothesis are in line with the “bad management” hypothesis (Berger & DeYoung, 1997; Williams, 2004), although these studies consider only ex post measure of risk, which is related to loans (not to the profitability levels of the borrowing firms). However, in the case of Spanish savings banks and commercial banks, we have also found empirical evidence that the most inefficient banks are also those that take more risks.
Hypothesis 2. The interest rates charged by the most inefficient banks are higher due to their risk-taking behavior
The second hypothesis tests, first, whether because they are more risky, the most inefficient banks charge higher interest rates, and, second, whether they lend to companies with less collateral. Table 7 presents the results of estimating equations (7) and (8).
To test this hypothesis eight different models are used. The dependent variable in the first model (Model M1, Column 1 in Table 7) is F_INT (interest rate firms pay), and the independent variables are F_BANKREL, F_REGIS, B_LOANTA, B_EQTA, B_DEPTA and B_INEF_ROA. The results are statistically significant for variables F_BANKREL, F_REGIS and B_LOANTA, with a negative sign for the first two. This would imply that the interest rate firms pay is determined by fewer banking relationships, fewer years of existence, and a higher loans ratio from the lending bank.
Regarding the number of banking relationships, some firms have less access to credit and, following Stiglitz and Weiss (1981) and Petersen and Rajan (1994), it may be considered that these are riskier firms which are willing to pay higher interest rates. Concerning firm age (F REGIS), Boot and Thakor (1994) show that during their initial years, firms must pay higher interest rates. However, as time passes and they become economically viable, they are charged lower interest rates. Furthermore, Demirgüç-Kunt and Huizinga (1999) find empirical evidence that the share of loans to total assets for banks is one of the main determinants of net margins from interest rates.
Model M3.2 (Column 2 in Table 7) differs from Model M1 in the dependent variable, which is now F INV COLLAT (i.e., the ratio of total bank debt to non-current assets). As Berger and Udell (1995) note, most of the empirical literature on the subject considers collateral to be related to riskier borrowers and riskier loans. However, our proposal differs from others in how to estimate the variable related to the collateral. In this study we use an inverse measure of the firms’ ability to pledge collateral. The results are statistically significant for F_BANKREL, F_REGIS and B_EQTA, with a positive sign for the first two variables and negative for the third. These results would imply that the borrowing firms can pledge less collateral (and, therefore, bear more risk) have more bank relationships, are older, and the bank lender has a lower capital ratio. In this case, again, the inefficiency of the lending bank is not related to the collateral of the borrowing firms.
Model M3.2 (Column 3 in Table 7) considers F_INT as the dependent variable, and B_INEF_ROA_CS as the bank inefficiency measure. In this case, similar to the first model, F_BANKREL, F_REGIS and F_LOANTA are statistically significant, and with the same sign as in the first model. However, the measure of inefficiency, B_INEF_ROA_CS is also statistically significant, albeit with a significance of only 10%, and with a positive sign. Therefore, it can be argued that the interest rate firms pay is conditioned by the inefficiency of the lending bank—the higher the banks’ inefficiency, the higher the interest rates they charge.
Model M3.4 (Column 4 in Table 7) considers as the dependent variable F_INV_COLLAT, and the results do not differ from those yielded by Model M3.2.
Model M3.5 (Column 5 in Table 7) uses F_INT as the dependent variable, and the measure of inefficiency is B_INEF_ROA_TS. The results are similar to those yielded by Model M3.3, since inefficiency is statistically significant, although only at the 10% level.
In Model M3.6 (Column 6 in Table 7) the dependent variable is F_INV_COLLAT, and the measure of inefficiency is B_INEF_ROA_TS. The results are similar to those from Models M3.4 and M3.2.
The last two models (Models M3.7 and M3.8, corresponding to Columns 7 and 8 in Table 7), used the B INEF ROA variable as a measure of inefficiency, also adding the CB and CB_INEF_ROA variables. The results for Model M7 show that F_BANKREL, F_REGIS, B_LOANTA and CB_INEF_ROA variables are statistically significant, although the last one has a low significance level. The sign is negative for the first two variables, and positive for the second two. Therefore, we may tentatively conclude that the interest rate a firm pays is determined by fewer banking relationships (F_BANKREL), fewer years of experience (F_REGIS), and a higher share of loans in the lending bank (B_LOANTA). These results are the same as those obtained with Model M3.1 but, in addition, they are conditioned by the inefficiency of commercial banks.
Model M3.8 differs from Model M3.7 in the dependent variable, which in this model is F_INV_COLLAT. The results are similar to those corresponding to Model M3.2, that is, they are statistically significant for F_BANKREL, F_REGIS, and B_EQTA. In addition, in this case the B_INEF_ROA variable is statistically significant and negative, whereas B_INEF_ROA is statistically significant and with a positive sign. Therefore, it may be considered that the firms’ ability to pledge collateral is conditioned by a higher number of bank relationships (F_BANKREL), more years of experience (F_REGIS), lower capital ratio (as a share of the lending bank’s total assets, B_EQTA), and especially, higher lending bank efficiency (B_INEF_ROA), particularly if the lender is a savings bank (CB_INEF_ROA).
A positive relationship of inefficiency with F_INV_COLLAT indicates that the most inefficient banks lend to firms with relatively less ability to pledge collateral, which contributes to increase credit risk. Jiménez and Saurina (2004) find empirical evidence for the Spanish case that loans with higher levels of collateral are more likely to default.
Hypothesis 3. Savings bank inefficiency will affect the type of borrowers depending on whether they are located in the savings bank’s home or new markets
The third and last of the hypotheses considers whether Spanish savings banks behave differently depending on whether they operate in their home markets or new markets. Table 8 reports the results of estimating equations (9) and (10). The results for equation (9), which considers whether bank inefficiency influences the probability of borrowing firms’ bankruptcy, taking into account lenders’ location, are presented in Columns 1 and 2 (Models M1 and M2) of Table 8.
Model M4.1 (Column 1 in Table 8) considers the F_ZSCORE as the dependent variable, and focuses on firms located in the same region of origin as the savings banks’ lenders. The results are statistically significant for F_BANKREL, F_REGIS and F_DEPTA, the first two with negative signs. Therefore, it could be argued that for firms located in the same region as the lending savings bank, the probability of bankruptcy depends on having more bank relationships (F_BANKREL), being older (F_REGIS), and the lending savings bank having a lower ratio of deposits (B_DEPTA). However, savings bank inefficiency is not significant in the home markets (B_INEF_ROA).
Model M4.2 (Column 2 in Table 8) also considered F_ZSCORE as the dependent variable, but in this case referring to borrowing firms that savings banks classify as located in new markets, that is, they are outside their home markets. The results indicate that the variables influencing the probability of bankruptcy for these firms are F_BANKREL, F_REGIS, B_EQTA and B_INEF_ROA; of these, only B_EQTA has a positive sign. Therefore, we may consider that the probability of bankruptcy for these firms is determined by having more bank relationships (F_BANKREL), being older (F_REGIS), and by lending savings banks having a lower capital ratio (B_EQTA) and being more inefficient (B_INEF_ROA). These results corroborate Hypothesis 3a, since the probability of a firm going bankrupt depends on the inefficiency of lending savings banks when they are located in new markets.
Estimating equation (10) verifies whether savings banks’ inefficiency will influence the interest rates borrowing firms pay according to their location; these results are reported in Columns 3 and 4 of Table 8.
The results for Model M4.3 (Column 3 in Table 8) suggest that for borrowing firms located in savings banks’ home markets, the interest rates paid (as a share of total bank debt) depend on savings banks’ ratio of loans on total assets (B_LOANTA), their capital ratio (on total assets, B_EQTA), and their inefficiency (B_INEF_ROA). Inefficient savings banks, therefore, might be increasing the interest rates they charge because of their market power in home markets.
The results on borrowing firms in new markets differ considerably. Those for Model M4.4 (Column 4 of Table 8) show that the interest firms pay depends positively on their number of banking relationships (F_BANK_REL) and their age(F_REGIS), and negatively on the ratio of capital (on total assets, BEQTA) of the lending savings bank and its inefficiency level (B_INEF_ROA). In conclusion, the efficiency of the lending savings banks will influence the interest rates their borrowers pay.
The results of estimating equation (10) confirm Hypothesis 3b, and are in line with other studies that have found empirical evidence on the differing behavior of savings banks according to the markets in which they are operating (Illueca et al., 2014).
Conclusion
The attention given to credit risk from both theoretical and empirical points of view is extensive. However, despite the number of contributions now being high, most of this research has focused on particular topics such as how to evaluate ex ante risks of individual loan operations and/or borrowers, and how lenders (bank) react to the evaluations (Salas & Saurina, 2002). We adopt here a different perspective, by examining the links between bank performance and risk-taking behavior, that is, how several (non-financial) firm characteristics, especially regarding credit worthiness, are related to different measures of bank performance. Our study differs from previous contributions that have emphasized the importance of the relationship between banks and their borrowing (non-financial) firms in that we attempt to model explicitly the links between the financial situation of the borrowing firms and the risk banks take, and how banks’ performance affects this link.
We established three hypotheses for the analysis: (a) whether the most inefficient banks take higher risks when selecting their borrowers (which we further decompose into two additional hypotheses: whether the most inefficient banks lend to less profitable or more inefficient firms, and whether firms that obtain loans from inefficient banks are more likely to go bankrupt); (b) whether the interest rates charged by the most inefficient banks are higher, due to their risk-taking behavior; and (c) whether savings bank inefficiency affects the type of borrowers depending on whether they are located in the savings bank’s home markets or new markets. Testing these hypotheses requires extending the database on Spanish banks to include data on their borrowing firms and some of their characteristics, such as the year when the firm was created, the number of bank relationships it has, its ability to pledge collateral, the probability of bankruptcy, the interest rates it is charged, and whether it actually went bankrupt. These hypotheses, however, are not evaluated directly since our point is that there are some indirect effects that the literature has generally avoided such as, for instance, poor senior practices that do not have a direct impact on borrowers’ risk but rather an indirect impact via bank inefficiency.
In addition, we also considered innovative measures of profit efficiency which take into account different ways of defining banks’ profits. Following contributions in the field of earnings quality and earnings management, we considered a model in which bank managers can “manipulate” the results, as well as two others in which LLPs are estimated in the first stage and then plugged-in into the profit model in the second stage. This is also particularly relevant as it provides an alternative method for evaluating the effects of the Bank of Spain’s dynamic provisioning (Jiménez et al., 2017).
The results suggest that there is actually a relationship between bank profit inefficiency and the risk banks take when lending to firms. Specifically, we find that more inefficient banks lent to the worst performing firms. Moreover, this high risk-taking behavior is not offset by higher interest rates. When considering collateral, there is no evidence for a relationship between bank inefficiency and firms able to pledge less collateral, but this link exists when commercial banks and savings banks are analyzed separately.
The last hypothesis applies to savings banks only and tests whether their behavior is different in home markets than in new markets. The results show that the most efficient savings banks have an ex ante risk in the new markets, and charge higher interest rates. In contrast, most inefficient savings banks charge higher interest rates in their home markets. These results could constitute evidence of the savings banks’ market power in their home markets, especially during the years prior to the financial crisis.
Our results are relevant for several reasons. Among them, we should highlight that the usefulness of efficiency measures to identify the likely existence of NPLs (i.e., ex post risk) or greater probability of default. It opens a promising area of research, since the analysis can be improved in several directions and, consequently, the economic policy recommendations are sharper and more accurate. For instance, although our study was also innovative due to the efficiency measures proposed, other measures can also be used, making the analysis more robust. However, we consider relevant to adopt an approach like ours, in which the definition of efficiency takes into account the likely manipulation of LLPs, an issue often disregarded when considering these measures. In addition, we can also contemplate different lags, to evaluate how bank inefficiency and their borrowers’ risk characteristics interact over time. Finally, although the analysis was focused on the Spanish banking system, it would be worth corroborating whether our findings hold across financial systems, particularly in countries where the 2007/2008 crisis was harsher.
Footnotes
Acknowledgements
The authors thank José Manuel Pastor, Gonzalo Rubio, and Jos van Bommel for their helpful comments. They thank particularly two anonymous reviewers whose suggestions have contributed to improve the overall quality of the article.
Declaration of conflicting interests
The author(s) declared no potential conflicts of interest with respect to the research, authorship, and/or publication of this article.
Funding
The author(s) disclosed receipt of the following financial support for the research, authorship, and/or publication of this article: D.P. and E.T.-A. acknowledge the financial support of the Ministerio de Economía y Competitividad (Grant Nos ECO2017-88241-R and ECO2017-85746P). E.T.-A also acknowledges the financial support of Generalitat Valenciana (Grant No. PROMETEO/2018/102) and Universitat Jaume I (Grant No. UJI-B2017-33). The usual disclaimer applies.