
Abstract
Based on the optimal board independence theory, we analyze how Spanish listed firms determine the presence of genuine and gray independent directors. We classify independents as gray whenever they do not satisfy formal independence requirements. Given the findings in previous literature, this type of gray independent does not promote poor corporate governance practices. Our results suggest that the presence of gray and genuine independent directors is related to the optimal board independence determinants as if both provided real board independence. Results are not affected by the number and the type of unsatisfied independence criteria, nor by the firm’s achievement of regulators’ recommended level of board independence. Therefore, we conclude that firms pay little attention to formal independence requirements to reach their optimal board structure.
Keywords
Introduction
Board independence is recommended by regulators to properly monitor and minimize the potential opportunism of managers (large controlling shareholders) in a principal agent (principal principal) context. Codes and recommendations for corporate governance best practices worldwide advocate for board independence (Aguilera & Cuervo-Cazurra, 2009; Cuomo et al., 2016). However, there is empirical evidence showing that firms often appoint independent directors who, according to the standard criteria, would barely be classified as independent. These gray independent directors are determined in different ways in the literature. Hwang and Kim (2009) and Fracassi and Tate (2012) examine the connections between the CEO and outside directors to detect gray independent directors in the United States. Cohen et al. (2012) identify these directors as former analysts overly sympathetic to management. Core et al. (1999) and Coles et al. (2014) consider any director appointed after the CEO as gray independent. These papers relate gray independence to poor corporate governance practices, as a consequence of an uncontrolled agency problem. Other research focuses on formal requirements of independence to detect gray independent directors. For a sample of Italian firms, Santella et al. (2006, 2007) find that the information disclosed is not sufficient to prove compliance with formal independence requirements. Crespí-Cladera and Pascual-Fuster (2014) check a set of eight formal independence requirements in Spanish listed firms to reveal gray independent directors. They analyze the effect of these directors on several monitoring outputs of the board of directors, such as CEO turnover decisions, finding no effect. These results mitigate the usefulness of formal independence requirements.
The objective of this article is to provide further evidence on the relevance of these formal independence requirements by analyzing firms’ decisions. We want to understand whether firms make board composition decisions as though these gray independent directors (not meeting formal independence requirements) were genuinely independent directors. Indeed, we obtain evidence supporting this conjecture, further mitigating the usefulness of formal independence requirements. We conduct our analysis using a Spanish sample, as Spain is the only country where these directors have been found in previous literature.
To understand firms’ decisions on board composition, we consider theoretical advances that address the endogenous nature of board composition, known in the literature as the optimal board independence theory. This literature suggests that different firms can have a different optimal level of board independence, claiming that, under certain circumstances, less board independence might be better for shareholder value (e.g., Adams & Ferreira, 2007; Harris & Raviv, 2008; Hermalin & Weisbach, 1998; Kumar & Sivaramakrishnan, 2008; Raheja, 2005). This theory is supported by empirical research such as Boone et al. (2007), Markarian and Parbonetti (2007), Linck et al. (2008), Coles et al. (2008), Lehn et al. (2009), Ahn and Shrestha (2013), and Farag and Mallin (2019). Boards of directors, particularly independent directors, provide two main services to the firm: supervision (agency theory, Jensen & Meckling, 1976) and advice (resource dependence theory, Pfeffer & Salancik, 1978). The optimal board independence generates the combination of both services, which maximizes shareholders’ value. Information from managers, especially the CEO, is relevant to properly perform both functions. This generates a trade-off between directors’ functions, since managers are reluctant to share information with directors who provide strong monitoring (Adams & Ferreira, 2007; Westphal, 1999). Thus, if gray independent directors are close to the managers, we could expect them to avoid strong monitoring and consequently obtain more information from managers to provide advice (Cavaco et al., 2016; Hsu & Wu, 2014; Joh & Jung, 2018). However, the previous empirical evidence (Crespí-Cladera & Pascual-Fuster, 2014) suggests that there are no differences in the monitoring performance of the genuine and gray independent directors we analyze. Therefore, we may expect both types of independent directors to be able to provide similar advising services (with similar access to information from managers). In consequence, we may expect firms to determine the presence of gray independents on the board as if they provided real board independence.
Our research method is to study whether the effect of the determinants of optimal board independence on gray independent directors is different from the effect on other independent directors. We find that optimal board independence determinants affect the proportion of gray independent directors as expected if provided real board independence, as though firms considered them to be genuinely independent directors. This finding depends neither on the type or number of independence criteria a gray independent director does not meet, nor on the firm’s achievement of the recommended level of board independence by regulators. 1
The Spanish sample is especially appropriate to our analysis because previous research (Crespí-Cladera & Pascual-Fuster, 2014) shows that gray independents, in terms of formal independence requirements, are not the consequence of an uncontrolled agency problem. Other types of gray independent directors hurt shareholder interests (e.g., Fracassi & Tate, 2012). The analyzed period is also relevant since it includes the transition to internationally accepted corporate governance practices. This probably explains why regulators allowed the existence of these gray independent directors. Indeed, the number of gray independents is decreasing over time. In addition, the sample is representative of European continental countries, with high ownership concentration and low levels of board independence (Kim et al., 2007). This characteristic differs from related literature focused on the US market (Boone et al., 2007; Coles et al., 2008; Lehn et al., 2009; Linck et al., 2008; Markarian & Parbonetti, 2007; Wintoki et al., 2012).
We contribute to the literature, first by empirically checking how firms adjust their level of independence when there are both genuine and gray independent members (with different degrees of grayness and of unsatisfied independence criteria). To our knowledge, this study is the first that relates the determinants of the optimal board independence theory to gray independent directors. Articles such as Hwang and Kim (2009), Fracassi and Tate (2012), Cohen et al. (2012), Crespí-Cladera and Pascual-Fuster (2014), and Hsu and Wu (2014) detect the presence of gray independent directors and analyze their effect on corporate governance practices and firm performance. However, these articles neither analyze whether firms determine the presence of these directors according to the optimal independence theory, nor analyze different groups of gray independent directors. Only Hsu and Wu (2014) study different groups of gray directors. Other articles, such as Boone et al. (2007), Linck et al. (2008), and Farag and Mallin (2019), analyze whether the determinants of the optimal board independence theory affect board independence, not gray independence. Second, we show that in the continental European context, with high ownership concentration, ownership incentives become the most relevant determinants of board independence, different from the evidence found in the US market (e.g., Boone et al., 2007; Linck et al., 2008). Third, we contribute to the literature studying the usefulness of formal independence requirements (e.g., Zattoni & Cuomo, 2010), providing empirical evidence that mitigates its usefulness from firms’ point of view.
The next section introduces the optimal board independence theory and the hypothesis development. The third section presents the institutional background, the fourth section presents the data and the methodology, the fifth section shows the empirical results, the sixth section offers the results of additional robustness checks, the seventh section discusses the results, and the final section presents the conclusions.
Optimal board independence and hypothesis development
Theoretical contributions on board structure suggest the existence of a firm-specific optimal level of board independence, based on different dimensions (e.g., Adams & Ferreira, 2007; Harris & Raviv, 2008; Hermalin & Weisbach, 1998; Kumar & Sivaramakrishnan, 2008; Raheja, 2005). For example, Harris and Raviv (2008) show that firm value is maximized with less board independence when the cost of monitoring by outsiders is high, such as in growth firms. Hermalin and Weisbach (1998) find a similar effect in well-performing firms, when the CEO has proved to be a rare commodity with special decision-making abilities. Raheja (2005) reveals that, under circumstances in which managers face relevant potential private benefits, independent boards help to optimize shareholder value. There is also a trade-off between the advising (Pfeffer & Salancik, 1978) and monitoring (Jensen & Meckling, 1976) functions of the board of directors. Although the advising role of the board of directors is less studied in the literature, it is probably highly relevant for firms (e.g., Adams, 2017; Baysinger & Butler, 1985; Hsu & Wu, 2014). In a recent article, Adams et al. (2018) find the combination of directors’ skills is a relevant determinant of firm performance. The monitoring and advising functions may depend on the information provided by management, and managers may be reluctant to share information with board members to avoid tough monitoring. Therefore, less independent boards are optimal for shareholder interest when the advising function of the board is especially relevant and depends on managers’ information (Adams & Ferreira, 2007; Westphal, 1999).
Our empirical approach is based on the empirical model by Linck et al. (2008), which analyzes the determinants of optimal board structure, particularly board independence, provided by the mentioned theoretical contributions. We adapt the implications on the board structure to the characteristics of our institutional context. These determinants are firm complexity, advising and monitoring costs, private benefits of control, ownership structure, and CEO characteristics.
Firm complexity
A wide range of business and complex operating and financial structures should benefit from independent directors who provide the firm with valuable expertise and connections. This factor is related to the advising role of the board of directors and generates a higher need for advising by outsiders based on their own information. Harris and Raviv (2008) predict that, in some circumstances, an increase in the relevance of outsider information also increases the optimal number of outsiders. Thus, more complexity is expected to result in larger and more independent boards.
Monitoring and advising costs
Theoretical models suggest a negative relationship of these costs to optimal board size and independence (Adams & Ferreira, 2007; Harris & Raviv, 2008; Raheja, 2005). The negative relationship is stronger whenever outsiders’ advising needs information provided by managers, given their natural tendency to avoid tough monitoring based on this information (Adams & Ferreira, 2007; Westphal, 1999). These costs are assumed to be positively related to growth opportunities and information asymmetry between insiders and outsiders.
In firms in which the private benefits available for managers are larger, the gains from the monitoring of independent boards are larger. The models of Harris and Raviv (2008), Adams and Ferreira (2007), and Raheja (2005) predict that board independence should be higher as the private benefits become larger.
Ownership incentives
This determinant is related to the monitoring role of the board of directors. Raheja (2005) predicts that boards will be smaller when shareholder incentives are aligned with those of insiders. This alignment also reduces the need for outsiders to prevent insiders from taking on inferior projects. Consequently, the ownership of the firm by insiders should be negatively related to board size and the proportion of independent directors. Raheja (2005) also notes that outsider ownership reduces monitoring costs (generating monitoring benefits) and that a positive relationship is therefore expected with the size of the board and the proportion of outsiders. Furthermore, in a context with large controlling shareholders, the larger the ownership stakes of these shareholders is, the stronger the control over managers will be, thereby aligning interests. Indeed, controlling shareholders can be analyzed as insiders. In consequence, the optimal board size and the proportion of independent directors are lower. This prediction is consistent with the findings in Linck et al. (2008), Lehn et al. (2009), Duchin et al. (2010), and Kim et al. (2007).
CEO characteristics affect the need for monitoring by the board of directors. CEOs with higher perceived abilities are optimally allowed to have less board independence in Hermalin and Weisbach (1998), who also argue that firms add insiders to the board as part of the CEO succession process. However, Raheja (2005) argues that the stronger the CEO is, the larger is the need for independent directors to prevent harmful decisions for the firm. Therefore, proxies of CEO ability and of the succession process are expected to be negatively related to optimal board independence, whereas proxies of CEO power will be positively related.
Our article analyzes an empirical context with two types of independent directors: genuine independent directors, who provide real board independence to the firm and whose presence we therefore expect to be determined by firms according to the abovementioned determinants of optimal board independence, and gray independent directors. Related articles, such as Hwang and Kim (2009) find evidence of gray independent directors deteriorating corporate governance, not providing board independence. However, the type of gray independents we study (not meeting formal independence requirements) do not deteriorate the monitoring function of the board of directors (Crespí-Cladera & Pascual-Fuster, 2014). Therefore, we expect firms to consider these directors as genuine independents for monitoring purposes. Borokhovich et al. (2014) also find evidence of the involvement of gray independent directors on monitoring activities in some circumstances. Consequently, we expect the trade-off between monitoring and advising functions of corporate directors to similarly affect genuine and gray independent directors. If these directors perform their monitoring duties as genuinely independent directors, managers will have the same reluctance to share relevant information with them as they do with genuinely independent directors (Adams & Ferreira, 2007). Thus, we expect firms to determine their presence on the board as if they provide board independence, according to the determinants of optimal board independence, for monitoring (agency theory, Jensen & Meckling, 1976) and advising purposes (resource dependence theory, Pfeffer & Salancik, 1978). Therefore, we formulate our hypothesis as follows:
Hypothesis. The presence of gray independent directors is related to optimal board independence determinants as expected if they provided monitoring and advising services as genuinely independent directors do.
Institutional background
The Spanish institutional context differs from that of the Anglo-American in two main aspects: the high level of ownership concentration and the typology of outside directors in place. The average listed Spanish firm has several large controlling shareholders, and floating stock is less than 50% for many firms. Regulators, consistently, distinguish the outside directors representing the interests of significant large shareholders (proprietary directors) from independent directors, representing minority shareholders. This precision is relevant because articles such as Nguyen and Nielsen (2010), and Luan and Tang (2007) prove that independence is valuable and that not all outside directors provide the same independence, and therefore the same value, to the firm.
In Spain, corporate governance is regulated with “comply or explain” soft legislation. The 2015 Unified Code of Good Governance for listed companies recommends that one-half of the directors should be independents in large and widely held firms, and one-third in other firms. Previous versions of the Spanish code recommended one-third of independents for all firms, the versions that cover our analysis period. In addition, since 2006 the Spanish code of corporate governance has included a definition of independent director. This definition compels formal independence requirements, such as being appointed by the nomination committee of the board of directors, or not having other relationships with the firm, its managers, or its significant shareholders (see the legislation section in www.cnmv.es or the online supplemental material to this article). Firms are free to decide the level of board independence, although directors declared as independent directors are expected to meet this definition. This definition is similar to the NYSE Listed Company Manual, the UK Corporate Governance Code, and the European Union Commission Recommendation of 15 February 2005 (Crespí-Cladera & Pascual-Fuster, 2014).
Since 2004, firms listed on the Spanish Stock Exchange must disclose a standardized Annual Report on Corporate Governance (ARCG), publicly available at the website of the Comisión Nacional del Mercado de Valores (CNMV—the Spanish Securities and Exchange Commission). These reports allow a homogeneous comparison of corporate governance practices among firms.
Data and methodology
Data sources and sample selection
Our sample includes all firms registered on the main trading platform of the Spanish Stock Exchange that disclose the standardized ARCG, from 2005 to 2012. In our analysis, we use one period lagged determinants of optimal board independence. Therefore, although there are standardized data on corporate governance since 2004 in Spain, our first year of analysis must be 2005. This sample generates an initial non-balanced panel data set with 989 observations, ranging from 116 to 135 firms per year, representing 165 unique firms (see Table 1, Column 1). After applying several filters, however, our final sample is based on 811 observations belonging to 137 different firms (Table 1, Column 2). The drop in observations is due to the lack of necessary lagged stock market (new listings) and accounting information (new firms), a bank in crisis managed by the regulator, and firms having at least 1 year with a negative book value of shares, which are not advisable for use in analyzing optimal board independence predictions. Our final sample is highly representative of the Spanish listed firms. It includes most of them and represents more than 90% of the total market capitalization. Only a few foreign companies do not release the standardized ARCG (e.g., Bayer) and are not included in Table 1.
Sample of firms.
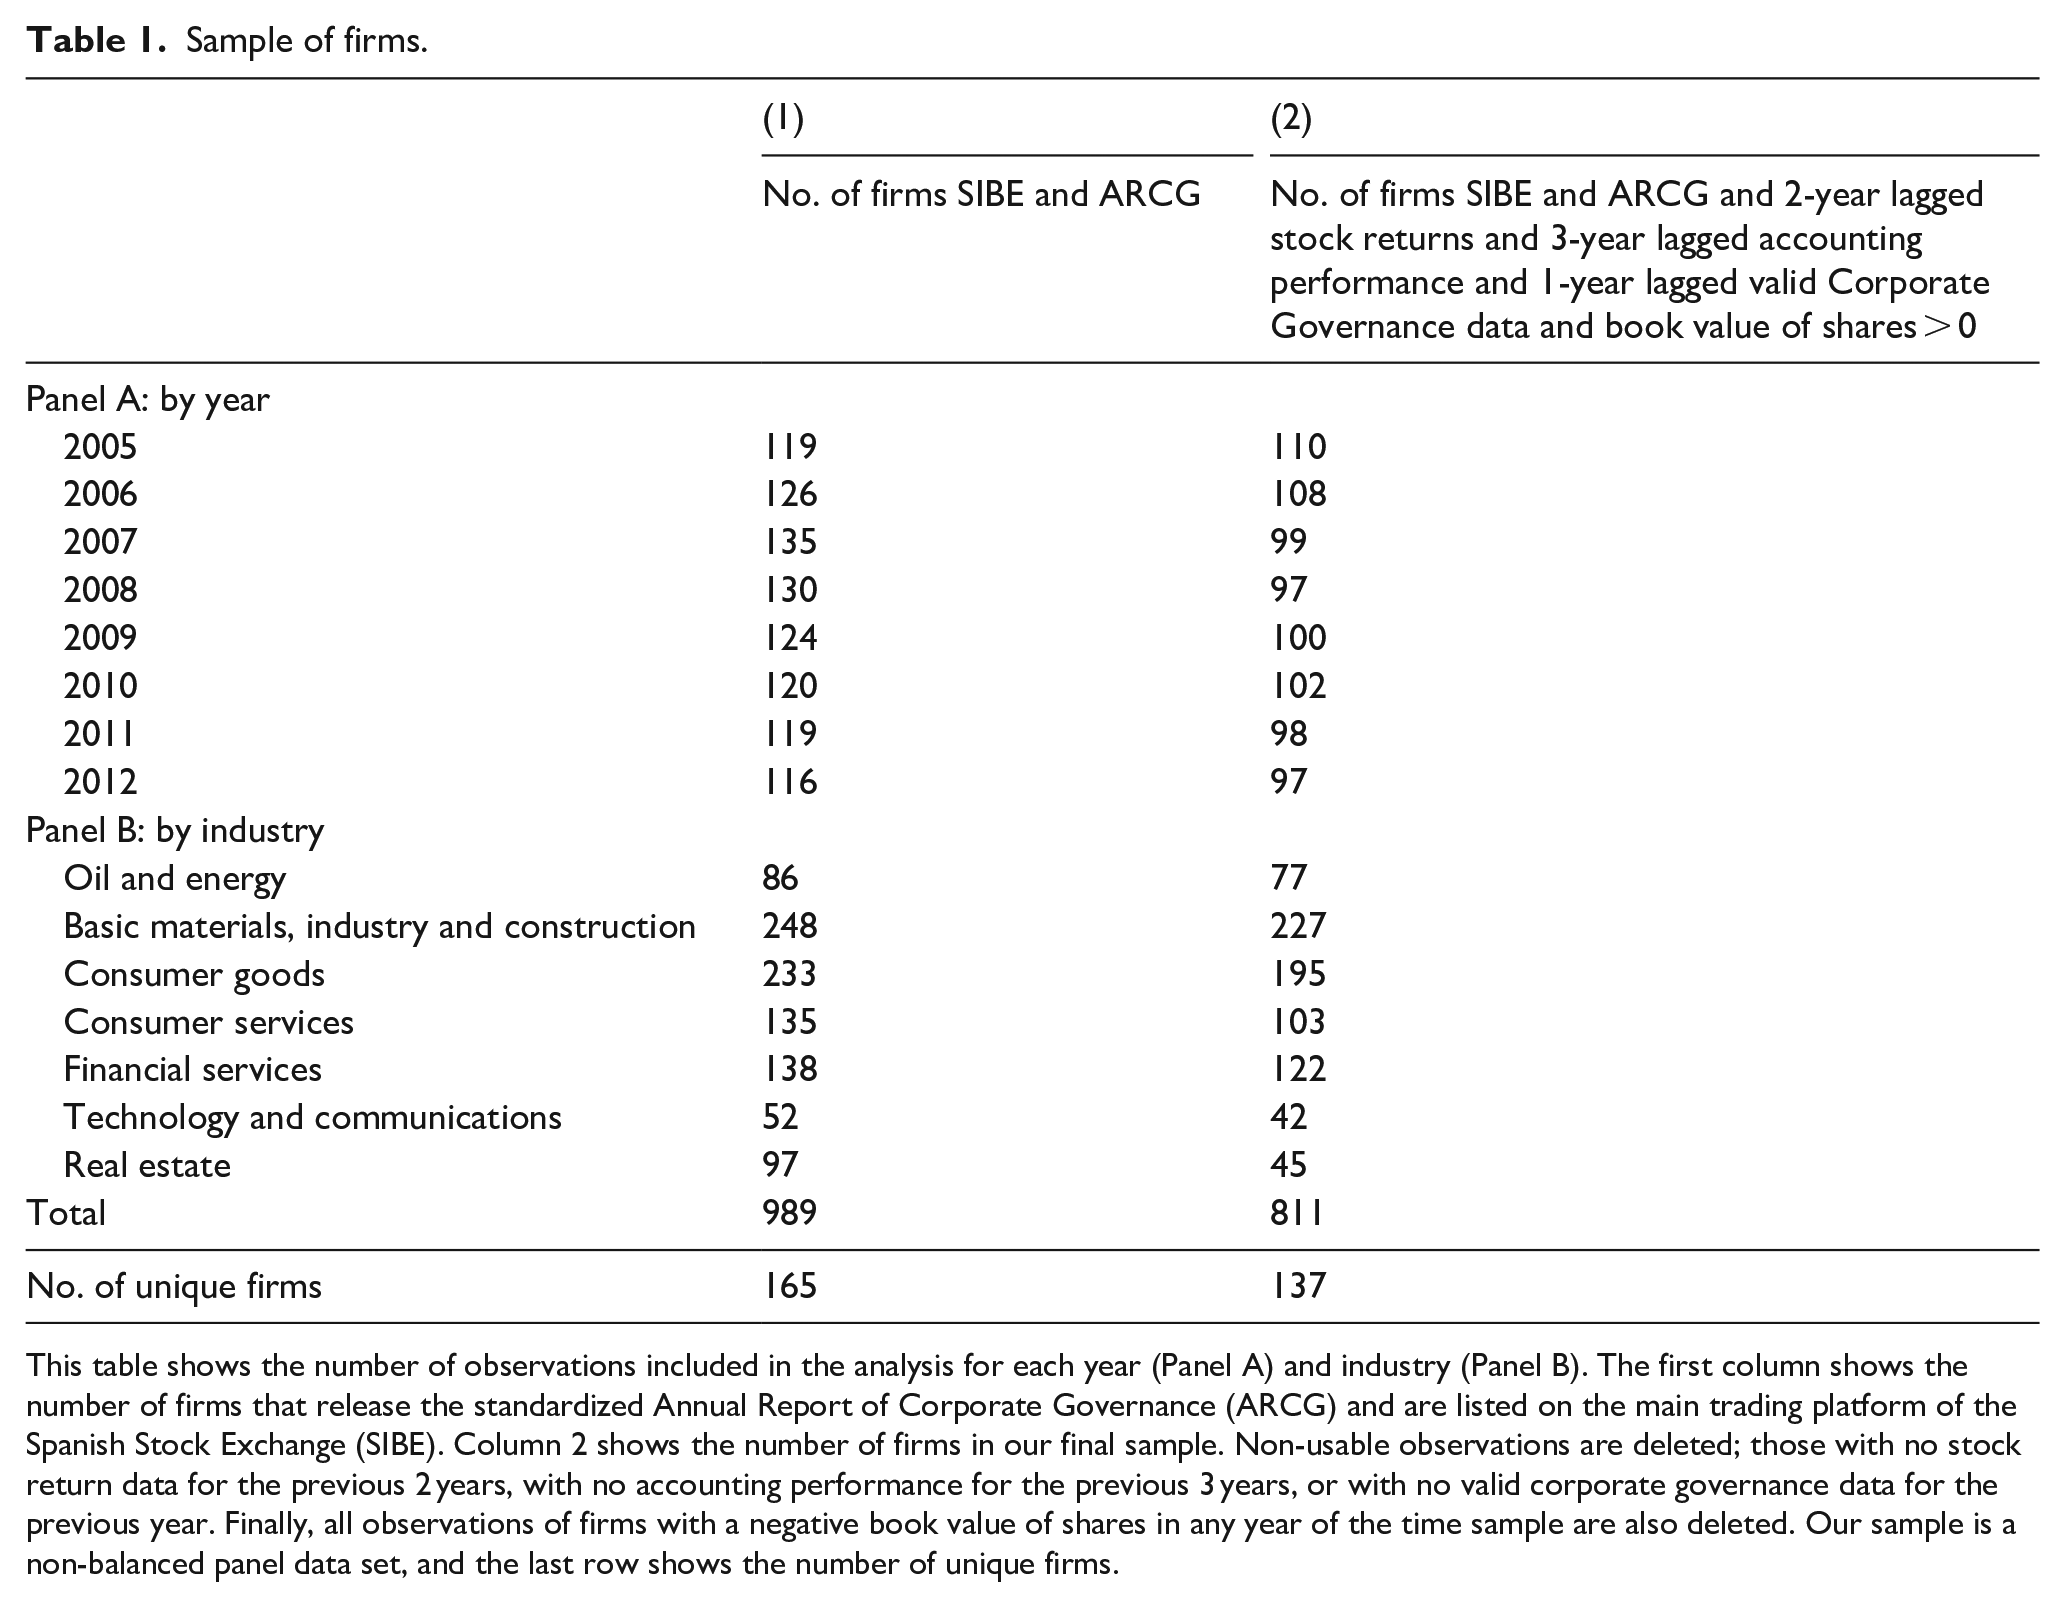
This table shows the number of observations included in the analysis for each year (Panel A) and industry (Panel B). The first column shows the number of firms that release the standardized Annual Report of Corporate Governance (ARCG) and are listed on the main trading platform of the Spanish Stock Exchange (SIBE). Column 2 shows the number of firms in our final sample. Non-usable observations are deleted; those with no stock return data for the previous 2 years, with no accounting performance for the previous 3 years, or with no valid corporate governance data for the previous year. Finally, all observations of firms with a negative book value of shares in any year of the time sample are also deleted. Our sample is a non-balanced panel data set, and the last row shows the number of unique firms.
Stock market data and accounting information comes from the Thomson Financial Database. The industrial sector classification is from the Spanish Stock Exchange ( www.bolsamadrid.es ).
Structure of the board and gray independent directors
In our final sample of 811 firm-year observations, we apply the eight formal independence criteria used by Crespí-Cladera and Pascual-Fuster (2014) to classify the declared independent directors as genuine independent and gray independent directors (Table 2, Panel D). This type of gray independent director is not related to poor board monitoring by previous literature. An independent director achieving all eight criteria is classified as a genuine independent director; an independent director achieving fewer than all eight criteria is classified as a gray independent director. These criteria are set based on the data available in the ARCG and are based on the definition of an independent director in several codes and recommendations of corporate governance. 2 Firms declare for each director whether he or she is executive, proprietary or independent. The first criterion is whether a director has been appointed by the nomination committee of the board of directors. Shivdasani and Yermack (1999) show evidence of the involvement of the CEO when no nomination committee exists. The second criterion, explicitly included in the UK Corporate Governance Code, is whether a director’s tenure is too long. We assume a threshold of 12 years, assuming that longer tenures generate relationships that are too close with managers and controlling shareholders. 3 The third criterion checks whether a director has significant business relationships with the company, and the fourth and fifth check for professional or other relationships with significant shareholders, respectively. The sixth criterion classifies as gray independents those independent directors holding directorships or executive positions in subsidiaries or associated firms. In Spain, a firm can also be a corporate director through a representative on the board of directors. Corporations declared as independent directors by firms in their ARCG are also classified as gray independent directors (seventh criterion). Finally, we check whether all independent directors were classified by the firm as executive directors in their ARCG of the previous 4 years (eighth criterion).
Board structure.
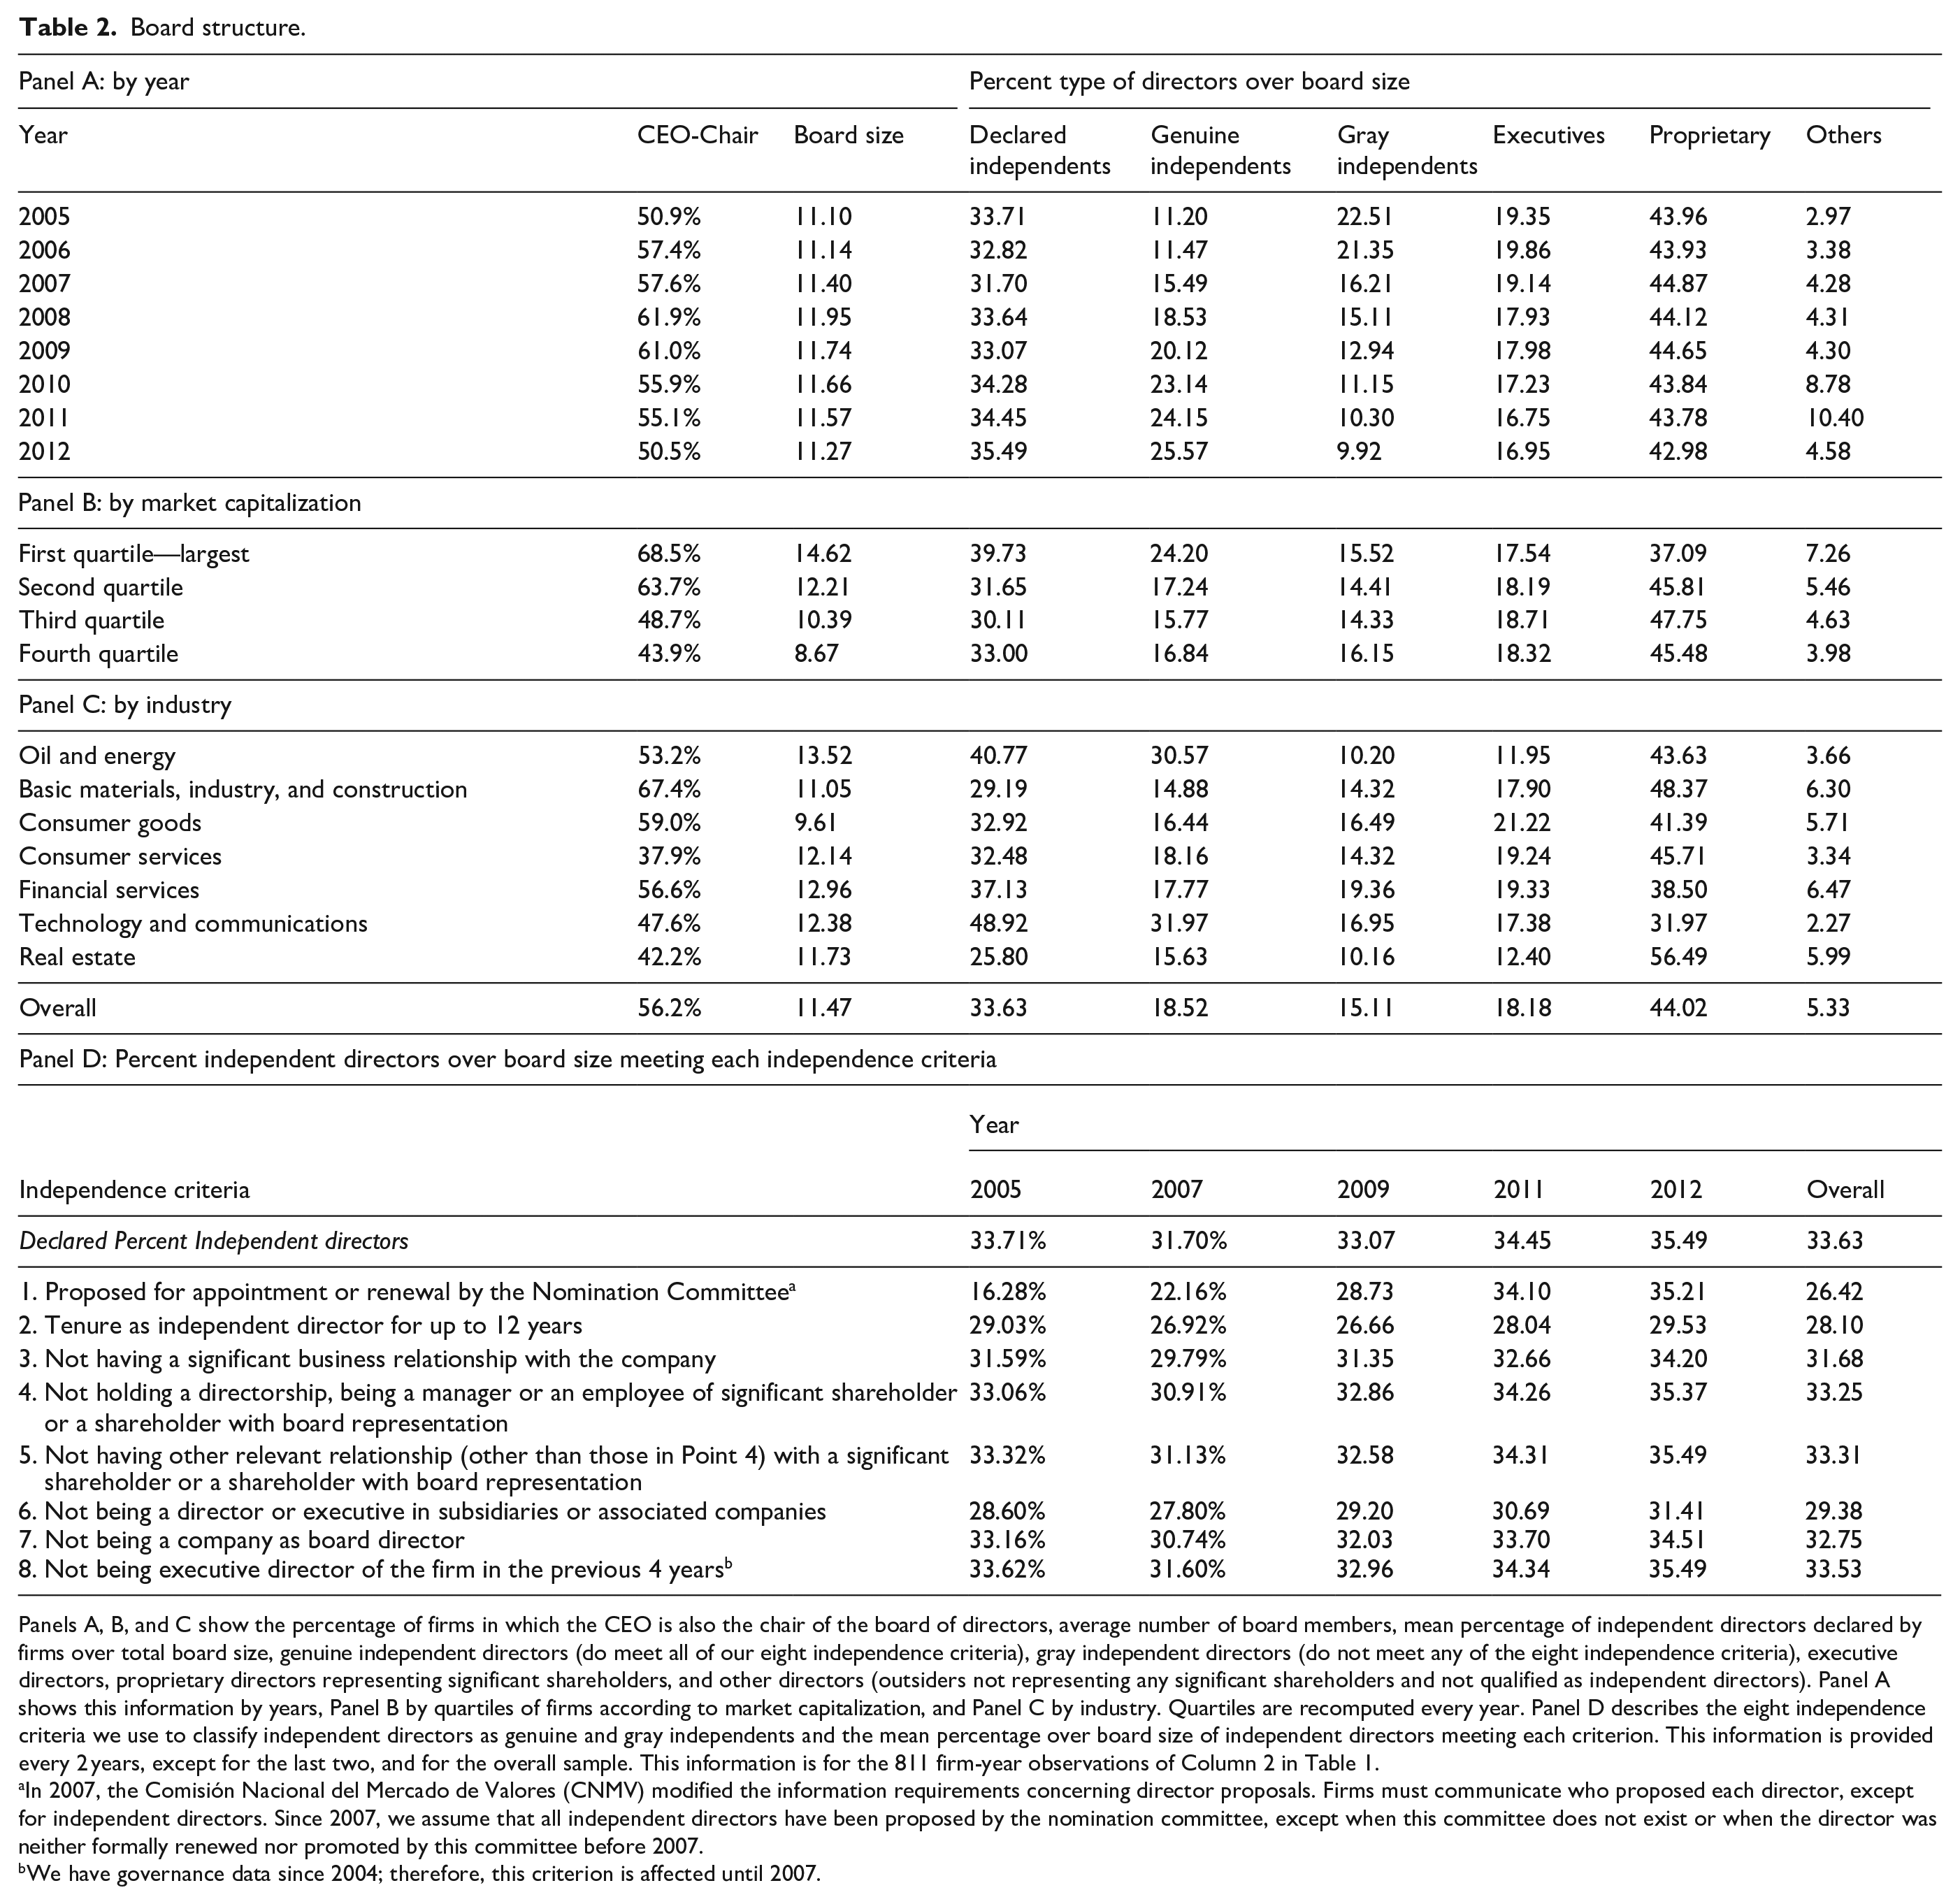
Panels A, B, and C show the percentage of firms in which the CEO is also the chair of the board of directors, average number of board members, mean percentage of independent directors declared by firms over total board size, genuine independent directors (do meet all of our eight independence criteria), gray independent directors (do not meet any of the eight independence criteria), executive directors, proprietary directors representing significant shareholders, and other directors (outsiders not representing any significant shareholders and not qualified as independent directors). Panel A shows this information by years, Panel B by quartiles of firms according to market capitalization, and Panel C by industry. Quartiles are recomputed every year. Panel D describes the eight independence criteria we use to classify independent directors as genuine and gray independents and the mean percentage over board size of independent directors meeting each criterion. This information is provided every 2 years, except for the last two, and for the overall sample. This information is for the 811 firm-year observations of Column 2 in Table 1.
In 2007, the Comisión Nacional del Mercado de Valores (CNMV) modified the information requirements concerning director proposals. Firms must communicate who proposed each director, except for independent directors. Since 2007, we assume that all independent directors have been proposed by the nomination committee, except when this committee does not exist or when the director was neither formally renewed nor promoted by this committee before 2007.
We have governance data since 2004; therefore, this criterion is affected until 2007.
Our sample uncovers three more years than Crespí-Cladera and Pascual-Fuster (2014) and shows a decreasing proportion of gray independent directors over time (Table 2, Panel A). The reported board composition concerning executives, independents, proprietary, and other directors is stable over time. 4 However, firms tend to replace gray independent directors with genuine independent directors. This behavior is most likely due to tighter supervision by the CNMV because several of our independence criteria are included in the Spanish code definition of independent directors, mandatory since 2007. However, after controlling this overall tendency (e.g., with year fixed effects in regression models), it remains interesting to investigate how the firms react to variations in the determinants of optimal board independence. In all analyzed years, there are firms increasing the number of gray independents, ranging from 13.5% of firms in 2007 to 17.9% in 2008. This percentage is 17.3% in 2012. New gray independent directors are primarily directors with some tenure in the firm, either former non-independent directors or former genuine independent directors, many of them holding relevant positions in subsidiaries.
Firms of all sizes and industries have gray independent directors; however, the proportion is slightly higher in large and in small firms, and in financial services. Concerning the eight independence criteria used to classify independent directors as genuine and gray independent directors, Criterion 1, which checks whether the director has been proposed by the Nomination Committee, was the most relevant to generate gray independent directors in 2005, but it is among the least relevant in 2012 (Table 2, Panel D). These data show that firms do care about compliance with this criterion, stated in the Spanish code definition of independents. However, the excess of tenure of independent directors is almost as relevant in 2012 as it was in 2005. There was no explicit reference to tenure in the Spanish code definition of an independent director during our period of analysis, although the same code recommends limited tenure for independent directors. Criterion 6, holding relevant positions in subsidiaries, is among the ones that contribute most to classifying independent directors as gray. This criterion is only partially reflected in the Spanish code definition of an independent director. The overall combined effect of these eight criteria is that firms declare 33.63% of independent directors when only 18.52% of directors meet all eight criteria for the whole period. Around 70% of gray independent directors do not meet one of the independence criteria, around 25% do not meet two, 4.5% do not meet three and less than 1% do not meet four (the maximum).
Empirical model of optimal board structure
We use different proxies for the determinants of the optimal board structure models (Linck et al., 2008). For firm complexity, we use firm size, the relevance of debt in the capital structure, the number of business segments, and firm age. To proxy the costs of monitoring and advising, we use the market-to-book value of equity, and spending on research and development to account for growth opportunities. We use stock return volatility for information asymmetry between insiders and outsiders. The proxy for potential private benefits is the free cash flow (Jensen, 1986). Concerning the ownership incentives, we measure the directors’ ownership, and we proxy ownership concentration through ownership by the three largest shareholders, which is highly correlated (above 0.91) with ownership by the largest shareholder and the five largest shareholders. CEO ability is measured by the firm’s past performance, and by tenure, because successful CEOs remain longer. The succession process is approached with a dummy variable identifying when CEO tenure is greater than 30 years. We are able to obtain measures of CEO tenure and of the succession process only for firms with executives on the board, which reduces the sample by 54 observations when we consider these variables. We also estimate models without these measures and with larger samples (811 observations). Following Linck et al. (2008), we use a dummy variable identifying CEOs that also chair the board as a proxy of CEO power, which is a measure of power that is not related to her or his abilities, or at least not directly so.
Because there are two types of outside directors (independent directors and proprietary directors representing large shareholders) in our sample of Spanish firms, the expected relationship between outsider ownership and optimal board independence due to the monitoring benefits of ownership must be revised. We conjecture that board independence is positively related to ownership by independent directors and negatively related to ownership by proprietary directors. Ownership by proprietary directors generates an advising and monitoring benefit only to proprietary directors. Furthermore, we also consider the type of independent directors; consequently, we conjecture that the presence of genuine (gray) independent directors is related to ownership by genuine (gray) independent directors, not to ownership by gray (genuine) independents.
Finally, we also correct by year and firm fixed effects, and all the determinants of optimal board independence are lagged one period to mitigate the endogeneity concerns. 5 Board independence (Independencei,t) is measured alternatively as the percentage of declared independent directors, genuine independent directors, or gray independent directors expressed as a percentage of the total number of directors. The empirical model explaining board independence is as follows
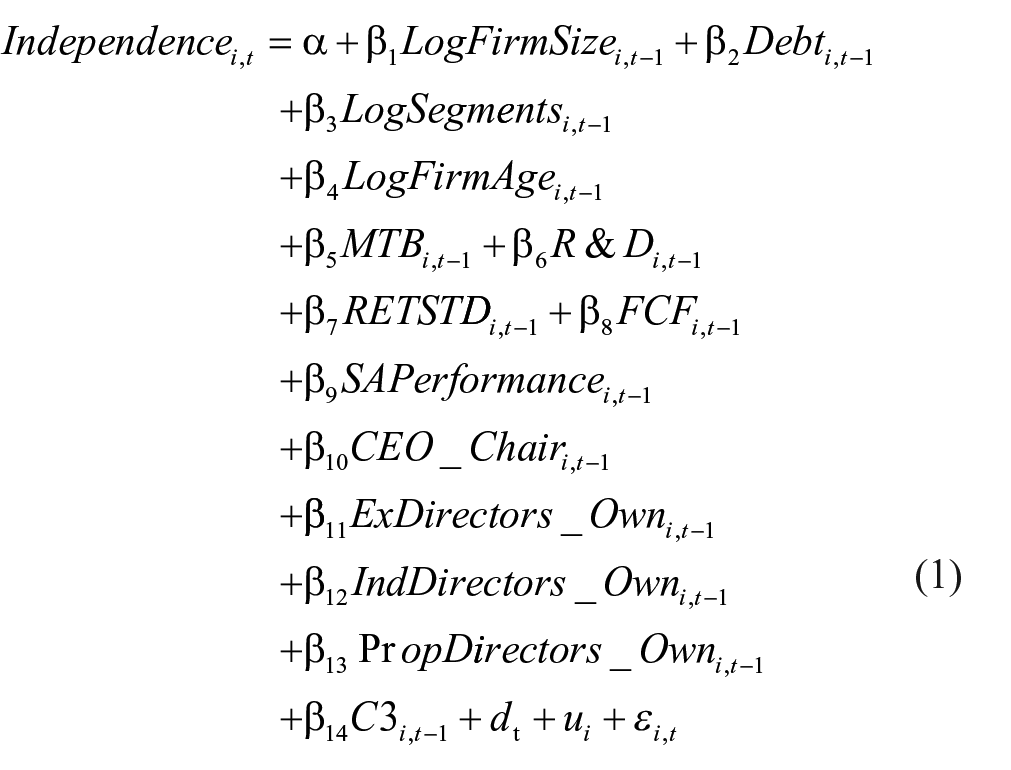
where dt is the year fixed effect of year t, ui is the firm fixed effect of firm i, and ei,t is the error term of firm i in year t, LogFirmSize is the log of stock market capitalization, Debt is the long-term debt divided by total assets, LogSegments is the log of the number of geographical segments, LogFirmAge is the log of the number of years since incorporation into the Thomson Financial Database, MTB is the market value of equity divided by the book value of equity, R&D is R&D expenditures divided by total assets, and RETSTD is the standard deviation of monthly stock return over 12 months in the preceding year. ExDirectors_Own, IndDirector_Own, and PropDirector_Own are the percentage of firm shares held by executive directors, independent directors, and proprietary directors, respectively. The ownership of independent directors is computed with only the ownership of genuine (gray) independent directors, GenuIndDirector_Own (GrayIndDirector_Own), when the dependent variable is the percentage of genuine (gray) independent directors. It is the ownership of all independent directors when the dependent variable is the declared proportion of independents. C3 is the percentage of firm shares held by the three largest shareholders. FCF is the free cash flow, computed as operating income before depreciation minus total income taxes, interest expense, preferred dividends, and dividends on common stock, all divided by total assets (see Jensen, 1986; Lehn & Poulsen, 1989). SAPerformance is the average annual industry-adjusted return on assets over the two preceding years. Return on assets is net income plus interest payments, net of tax effects, over the previous year’s total Assets. CEO_Chair is a dummy variable for CEOs chairing the board of directors.
In the subsample of firms with executive directors, we also estimate the independence model (equation (1)) by adding the log of CEO tenure (LogCEOTenure) and a dummy variable identifying whenever CEO tenure is greater than 30 years (Retirement).
Table 3 summarizes the statistics of the variables by quartiles of market capitalization and over different years. The mean of the market capitalization is considerably greater than that reported in the sample of Linck et al. (2008), which includes approximately 7,000 firms in the United States from 1990 to 2004. Firms in the second quartile by market capitalization do have a similar mean size to the average firm in Linck et al. (2008). Comparing the ownership structure, even with larger firms, the mean ownership of all block holders in our sample is 57%, whereas it is 40% in the US sample of Linck et al. (2008). Ownership by board directors is also greater in our sample; its mean is 8.2% for executives, 0.32% for independent directors, and 13.5% for proprietary directors. Linck et al. (2008) report 1.7% aggregated ownership by non-executive directors and 6% ownership by the CEO. García-Meca and Palacio (2018) found similar data on ownership concentration analyzing a sample of 34 Spanish listed firms, showing high ownership concentration (45% of shares in the hands of block holders) and high ownership by directors (19%). Indeed, these are relevant characteristics of our sample. Concerning the remaining characteristics of firms, Panel C in Table 3 shows the effect of the crisis; return on assets decreases over time, as does the market-to-book ratio. Our measure of free cash flow is approximately 3% of total assets, less than the median (6%) in the sample of Linck et al. (2008) but greater than their average (−1.4%).
Descriptive statistics.
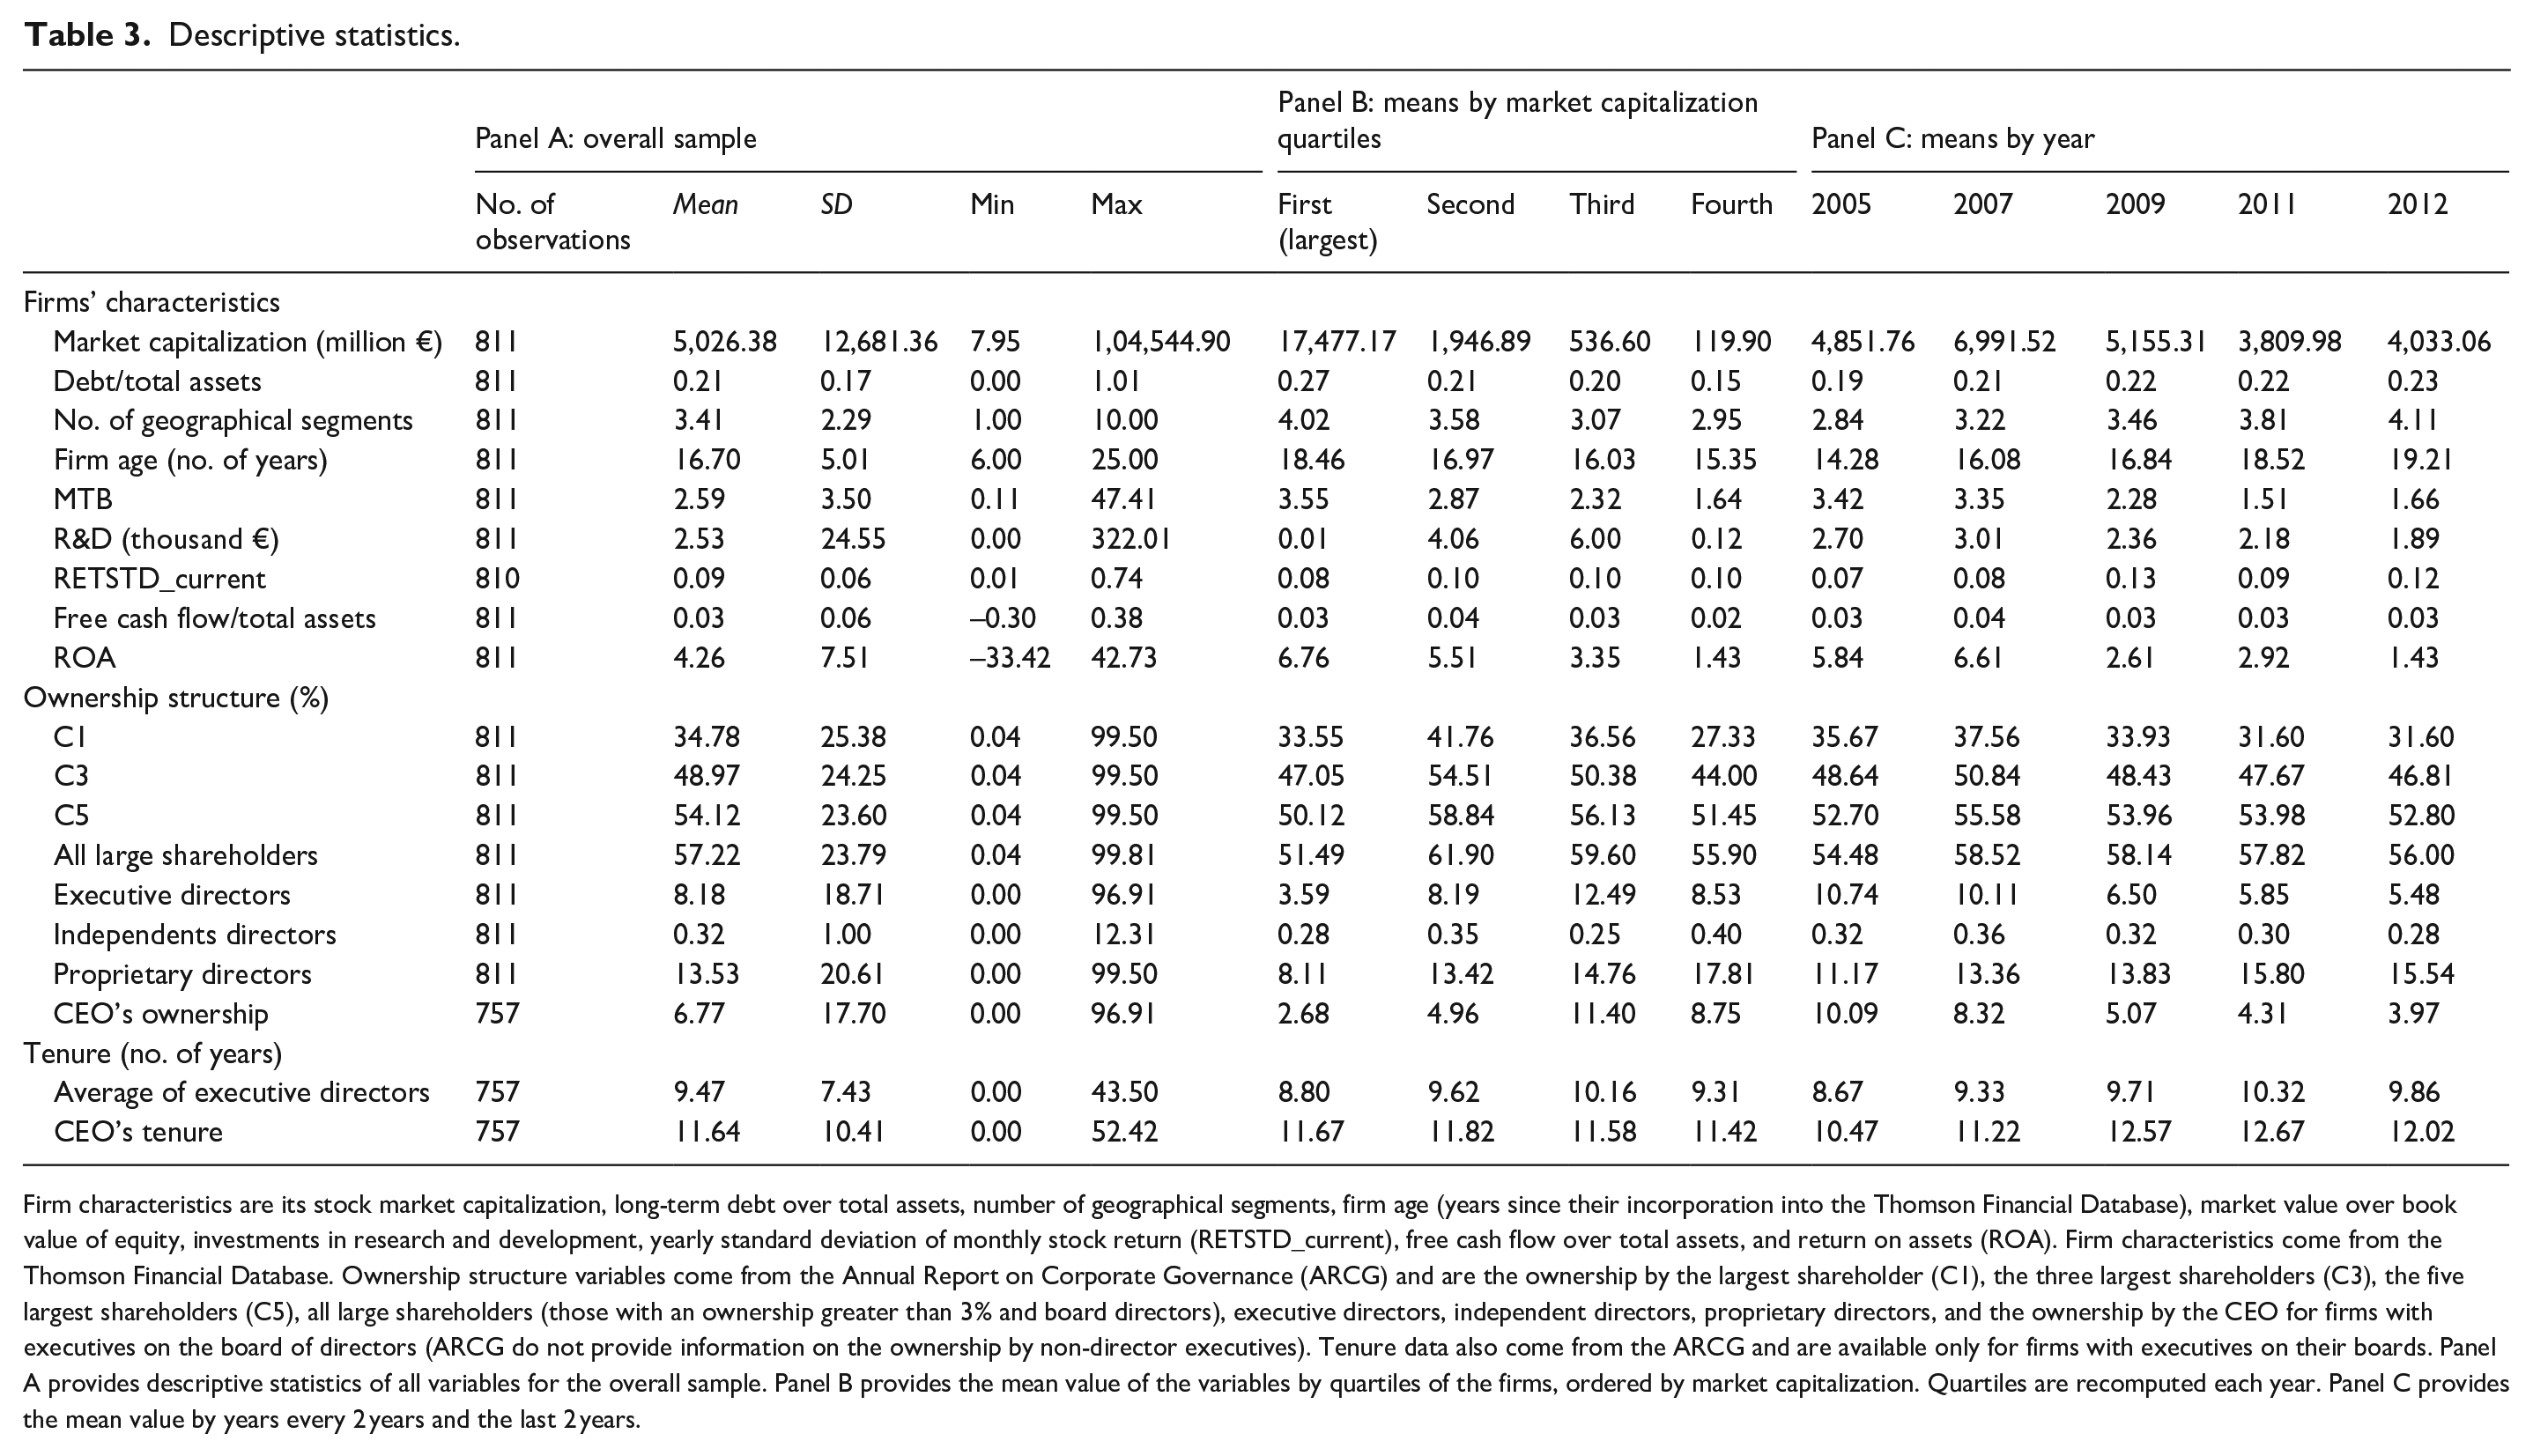
Firm characteristics are its stock market capitalization, long-term debt over total assets, number of geographical segments, firm age (years since their incorporation into the Thomson Financial Database), market value over book value of equity, investments in research and development, yearly standard deviation of monthly stock return (RETSTD_current), free cash flow over total assets, and return on assets (ROA). Firm characteristics come from the Thomson Financial Database. Ownership structure variables come from the Annual Report on Corporate Governance (ARCG) and are the ownership by the largest shareholder (C1), the three largest shareholders (C3), the five largest shareholders (C5), all large shareholders (those with an ownership greater than 3% and board directors), executive directors, independent directors, proprietary directors, and the ownership by the CEO for firms with executives on the board of directors (ARCG do not provide information on the ownership by non-director executives). Tenure data also come from the ARCG and are available only for firms with executives on their boards. Panel A provides descriptive statistics of all variables for the overall sample. Panel B provides the mean value of the variables by quartiles of the firms, ordered by market capitalization. Quartiles are recomputed each year. Panel C provides the mean value by years every 2 years and the last 2 years.
Empirical results
The empirical models of board independence (equation (1)) are estimated with robust standard errors clustered by firm (Huber, 1967; Petersen, 2009; White, 1980, 1982). The correlation matrix and the analysis of the variance inflation factors show no relevant multicollinearity concerns (values below 2, results omitted to save space).
We predict that we will find the determinants of optimal board independence being statistically significant and with the expected signs even when the dependent variable is the proportion of gray independent directors. Columns 1–6 of Table 4 present the estimation of the empirical models of board independence when the dependent variable is the percentage of declared independent (Columns 1 and 4), genuine independent (Columns 2 and 5), and gray independent directors (Columns 3 and 6). The model shows the expected sign according to the optimal board independence theory for all statistically significant explanatory variables, except firm age (with low statistical significance), when the dependent variable is the percentage of gray independent directors, and only in the model of Column 3. This coefficient may reflect the substitution of gray independent directors by genuine independents, which occurs during our period of analysis (Table 2), not captured by the year fixed effects. This substitution is probably due to the tighter supervision by the CNMV. In the model of Column 3, the remaining four statistically significant explanatory variables show the expected sign. Therefore, we interpret that the overall evidence supports our hypothesis. Firms behave as if gray independent directors provided monitoring and advising services as expected from independent directors. Consistently, we should expect the presence of declared independents (genuine plus gray) to be determined by the explanatory variables with the expected sign, and this is what we find—even when the dependent variable is only the percentage of genuine independents. 6 Results remain robust when we reestimate these models excluding each variable one by one (omitted to save space).
Board structure determinants.
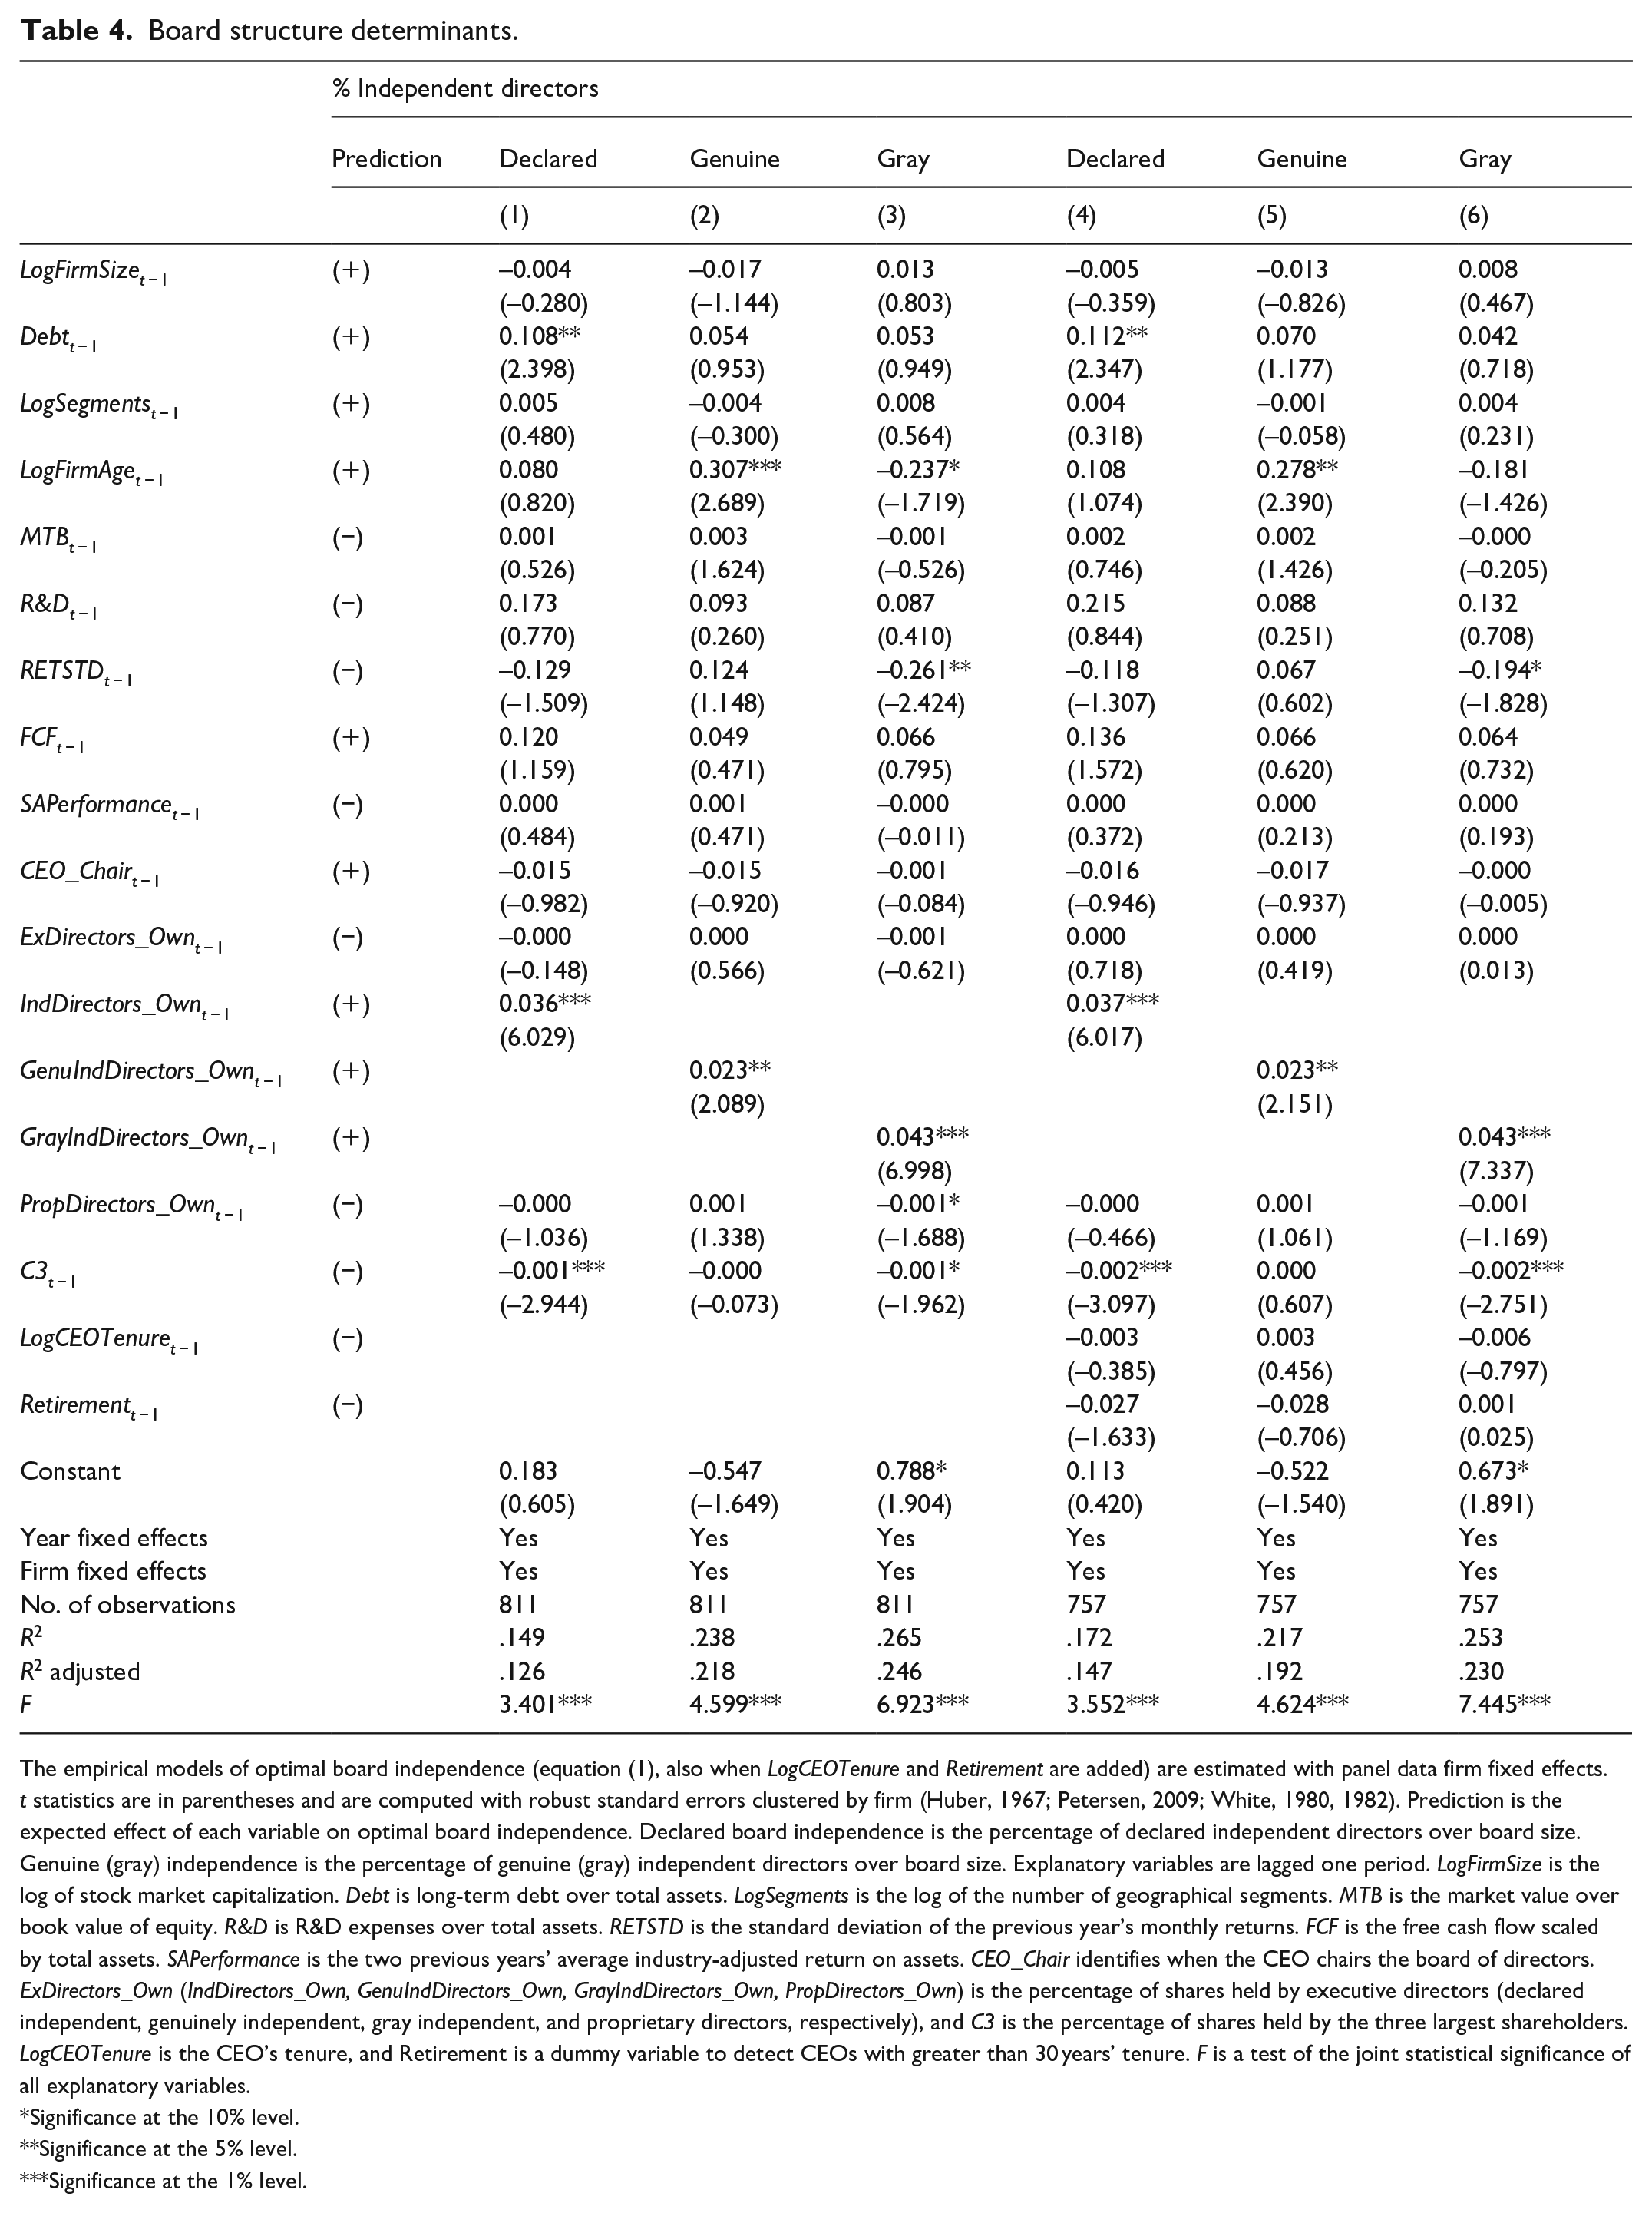
The empirical models of optimal board independence (equation (1), also when LogCEOTenure and Retirement are added) are estimated with panel data firm fixed effects. t statistics are in parentheses and are computed with robust standard errors clustered by firm (Huber, 1967; Petersen, 2009; White, 1980, 1982). Prediction is the expected effect of each variable on optimal board independence. Declared board independence is the percentage of declared independent directors over board size. Genuine (gray) independence is the percentage of genuine (gray) independent directors over board size. Explanatory variables are lagged one period. LogFirmSize is the log of stock market capitalization. Debt is long-term debt over total assets. LogSegments is the log of the number of geographical segments. MTB is the market value over book value of equity. R&D is R&D expenses over total assets. RETSTD is the standard deviation of the previous year’s monthly returns. FCF is the free cash flow scaled by total assets. SAPerformance is the two previous years’ average industry-adjusted return on assets. CEO_Chair identifies when the CEO chairs the board of directors. ExDirectors_Own (IndDirectors_Own, GenuIndDirectors_Own, GrayIndDirectors_Own, PropDirectors_Own) is the percentage of shares held by executive directors (declared independent, genuinely independent, gray independent, and proprietary directors, respectively), and C3 is the percentage of shares held by the three largest shareholders. LogCEOTenure is the CEO’s tenure, and Retirement is a dummy variable to detect CEOs with greater than 30 years’ tenure. F is a test of the joint statistical significance of all explanatory variables.
Significance at the 10% level.
Significance at the 5% level.
Significance at the 1% level.
In comparison with Linck et al. (2008), our results show fewer statistically significant determinants of board structure. This difference might be due to the much larger sample they analyze. In addition, they consider unobservable constant variables related to the industry (industry fixed effects) instead of unobservable constant variables related to each firm (firm fixed effects). When we replace firm fixed effects by industry fixed effects, we obtain a larger number of statistically significant determinants, and reach the same conclusion regarding genuine and gray independent directors. Results remain robust if we use contemporary explanatory variables, as in Linck et al. (2008), and therefore we consider also observations from the year 2004. All these results are omitted to save space.
In Table 5, we focus the analysis on gray independent directors. We estimate the empirical model of gray independent directors (equation (1)) when considering different groups of gray independent directors, depending on the number of failed independence criteria (Columns 1–3), and depending on the independence criteria not satisfied. Since the trade-off between the monitoring and advising functions of board directors depends mainly on their relationship with managers, not with significant shareholders (Adams & Ferreira, 2007), we identify gray independents when Criteria 4 and 5 (relationship with significant shareholders, see Table 2) are not considered (Table 5, Column 4), therefore detecting only gray independents potentially related to management. We also identify gray independents using only Criterion 1 (proposition by the nomination committee), which is the most relevant independence criterion to generate grays in our overall sample (Table 5, Column 5). We find similar results than in Table 4, Column 3 (considering all gray independent directors). Only one explanatory variable shows statistical significance (weak) with the unexpected sign. The rest of the statistically significant coefficients confirm our previous results, supporting our hypothesis. We detect no relevant differences among gray independents depending on the number of unsatisfied independence criteria, nor the type of unsatisfied independence criteria. It is relevant that even the presence of gray directors related to management behave like the rest of grays. However, due to data limitations, we cannot discard any differences related to the type of independence criteria. For example, we do not have sufficient observations with gray independents who do not satisfy only Criteria 4 and 5.
Board structure and gray independent directors.
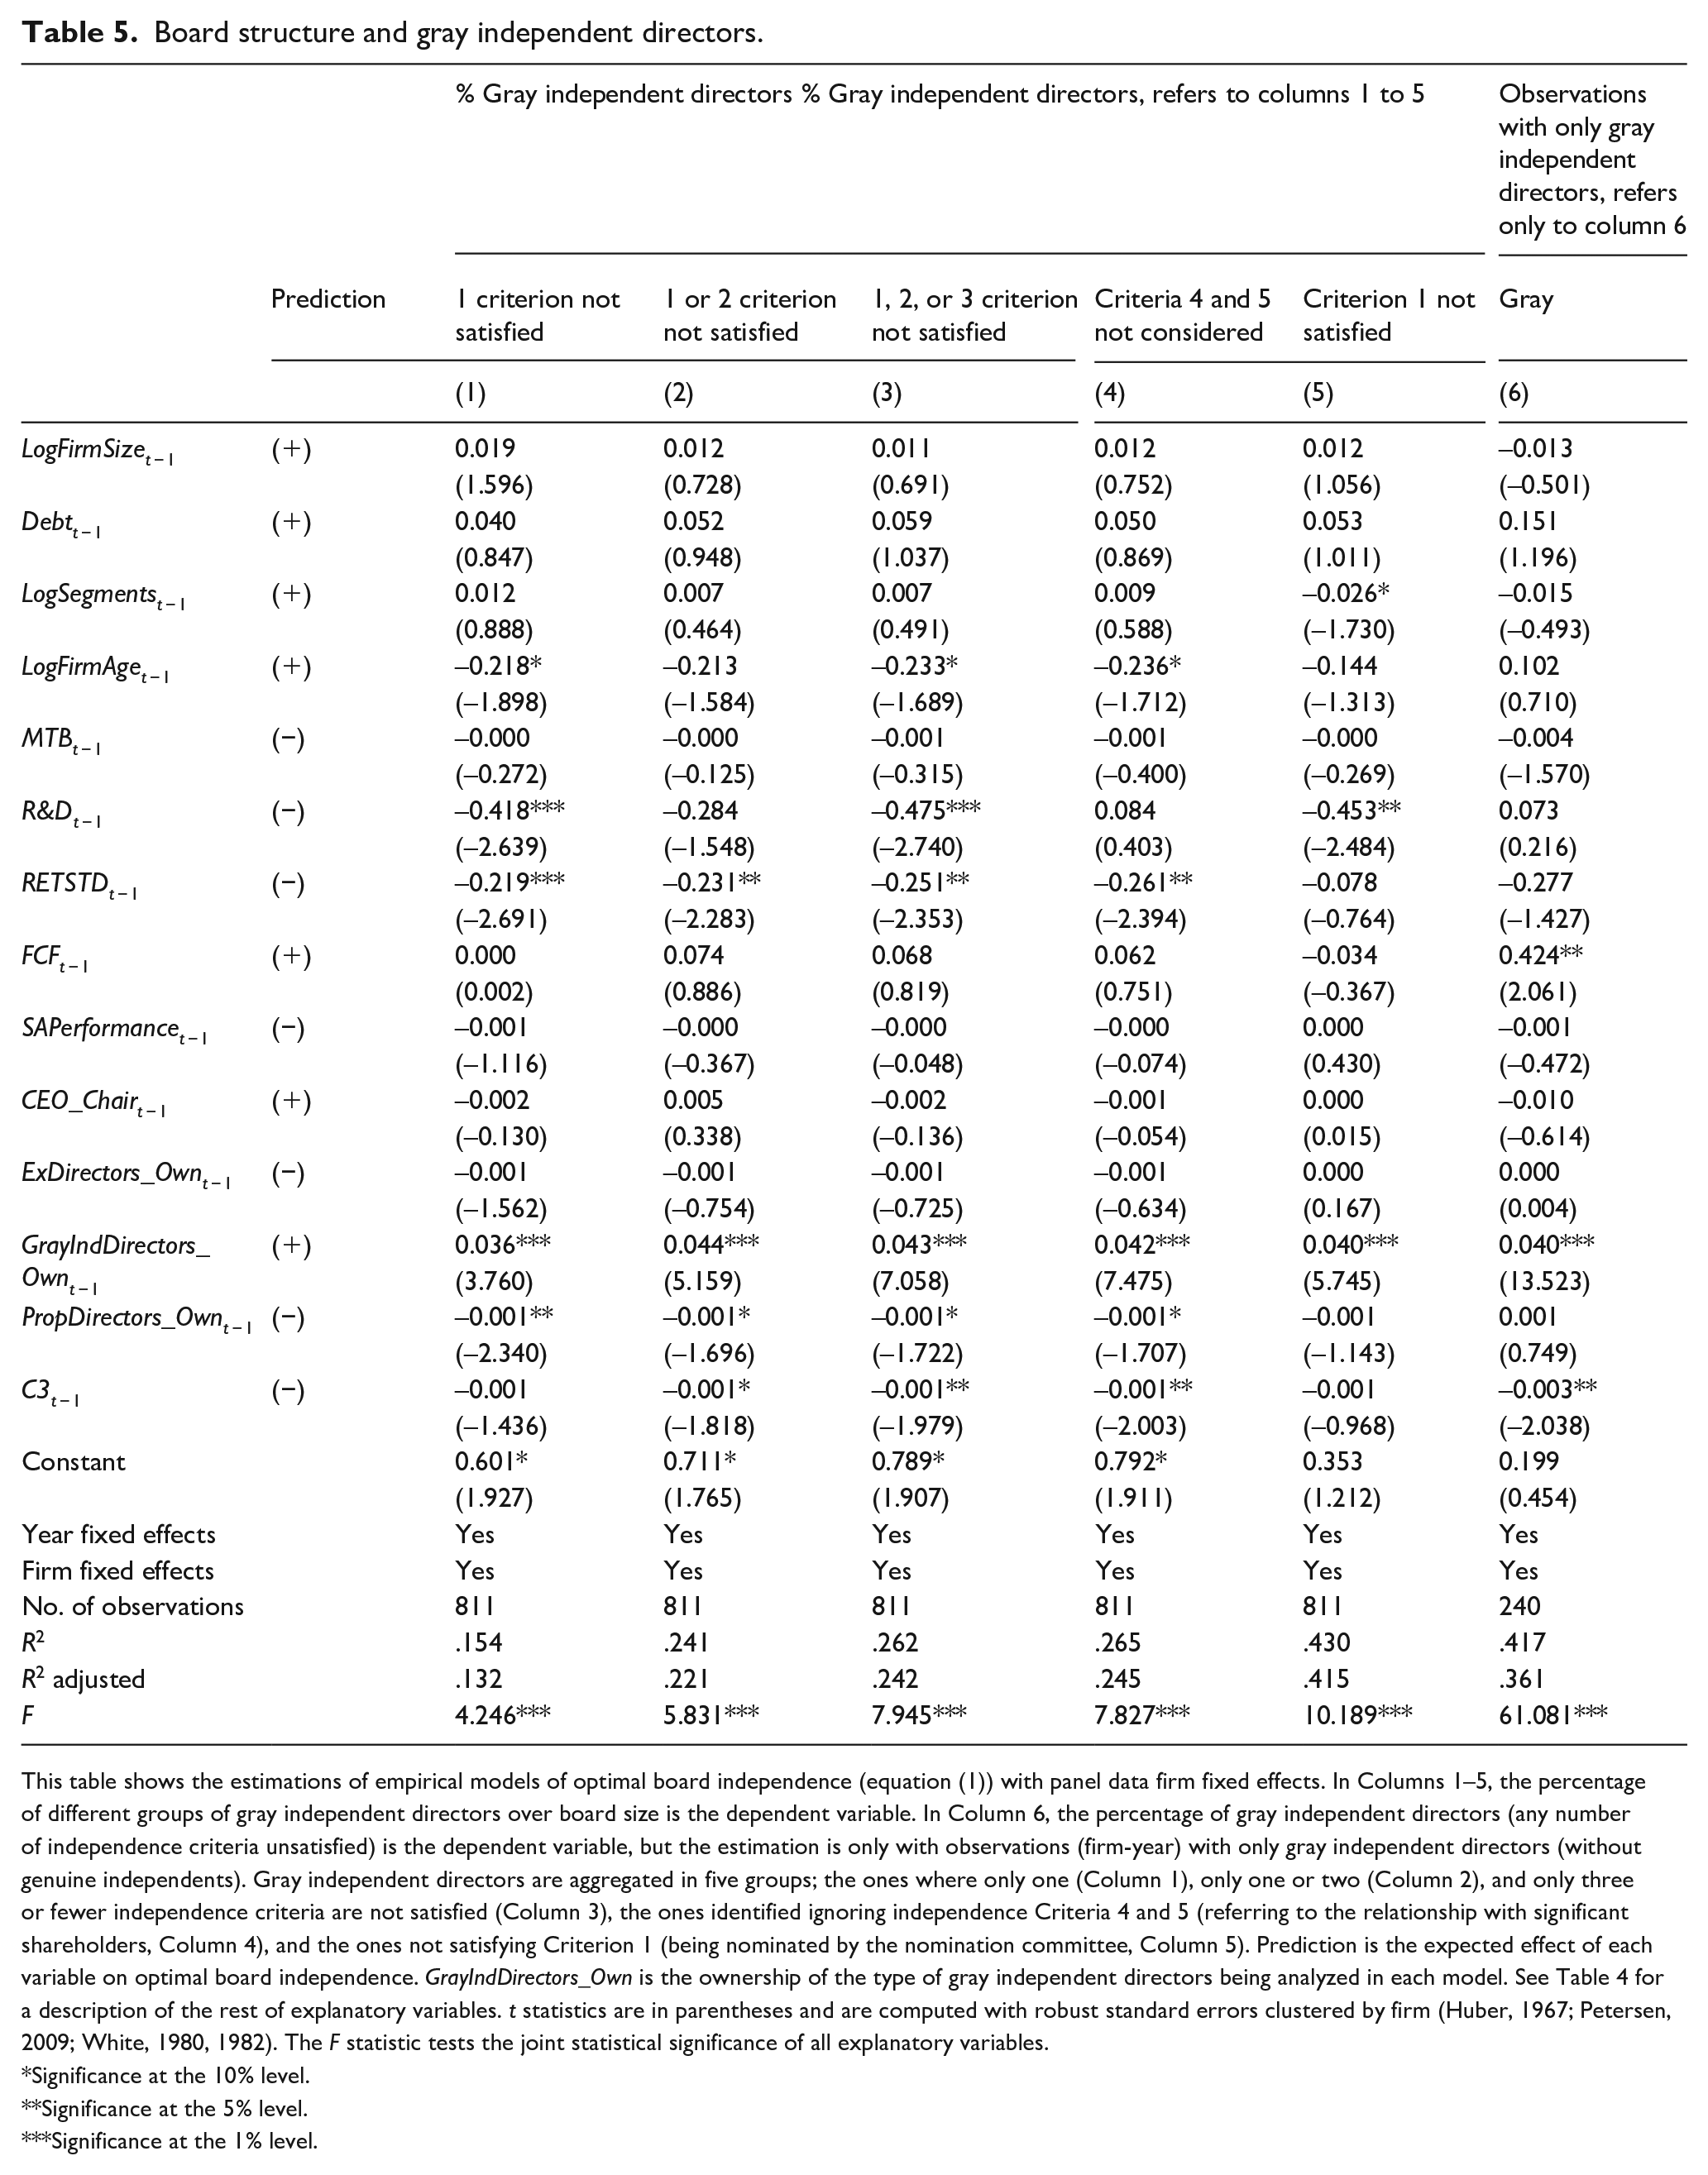
This table shows the estimations of empirical models of optimal board independence (equation (1)) with panel data firm fixed effects. In Columns 1–5, the percentage of different groups of gray independent directors over board size is the dependent variable. In Column 6, the percentage of gray independent directors (any number of independence criteria unsatisfied) is the dependent variable, but the estimation is only with observations (firm-year) with only gray independent directors (without genuine independents). Gray independent directors are aggregated in five groups; the ones where only one (Column 1), only one or two (Column 2), and only three or fewer independence criteria are not satisfied (Column 3), the ones identified ignoring independence Criteria 4 and 5 (referring to the relationship with significant shareholders, Column 4), and the ones not satisfying Criterion 1 (being nominated by the nomination committee, Column 5). Prediction is the expected effect of each variable on optimal board independence. GrayIndDirectors_Own is the ownership of the type of gray independent directors being analyzed in each model. See Table 4 for a description of the rest of explanatory variables. t statistics are in parentheses and are computed with robust standard errors clustered by firm (Huber, 1967; Petersen, 2009; White, 1980, 1982). The F statistic tests the joint statistical significance of all explanatory variables.
Significance at the 10% level.
Significance at the 5% level.
Significance at the 1% level.
To disentangle any relationship between the proportion of genuine and gray independent directors in the same firm, we estimate the empirical model of gray independent directors considering only observations of firms where all independent directors are gray (Table 5, Column 6). Even with this smaller sample (only 240 observations), all statistically significant coefficients are as expected if these directors provided real board independence. Results remain robust if the smaller sample of firms with only gray independents during the whole sample period are considered.
In summary, our results suggest that firms behave as though gray independent directors provided real board independence, thus accepting our hypothesis and suggesting that firms use gray independent directors to reach their optimal level of board independence.
Robustness checks
We replicate the analysis of gray independents on different subsamples of firms, depending on whether firms intend to comply with the recommended level of board independence by regulators. Firms intending to comply might use gray independent directors only to reach the recommended level of board independence, not to provide real board independence. Therefore, these firms might ignore the determinants of optimal board independence to make decisions on the presence of gray independents. We identify them as those firms for which the average board independence across years reaches 1/3. Overall results, in Columns 1 and 2 of Table 6, show that the relationship with the determinants of the optimal board independence theory does not depend upon whether firms comply with the recommended proportion of independent directors. Only in the model of complying firms (Column 2), is there a statistically significant (weakly) explanatory variable with the unexpected sign.
Robustness checks.
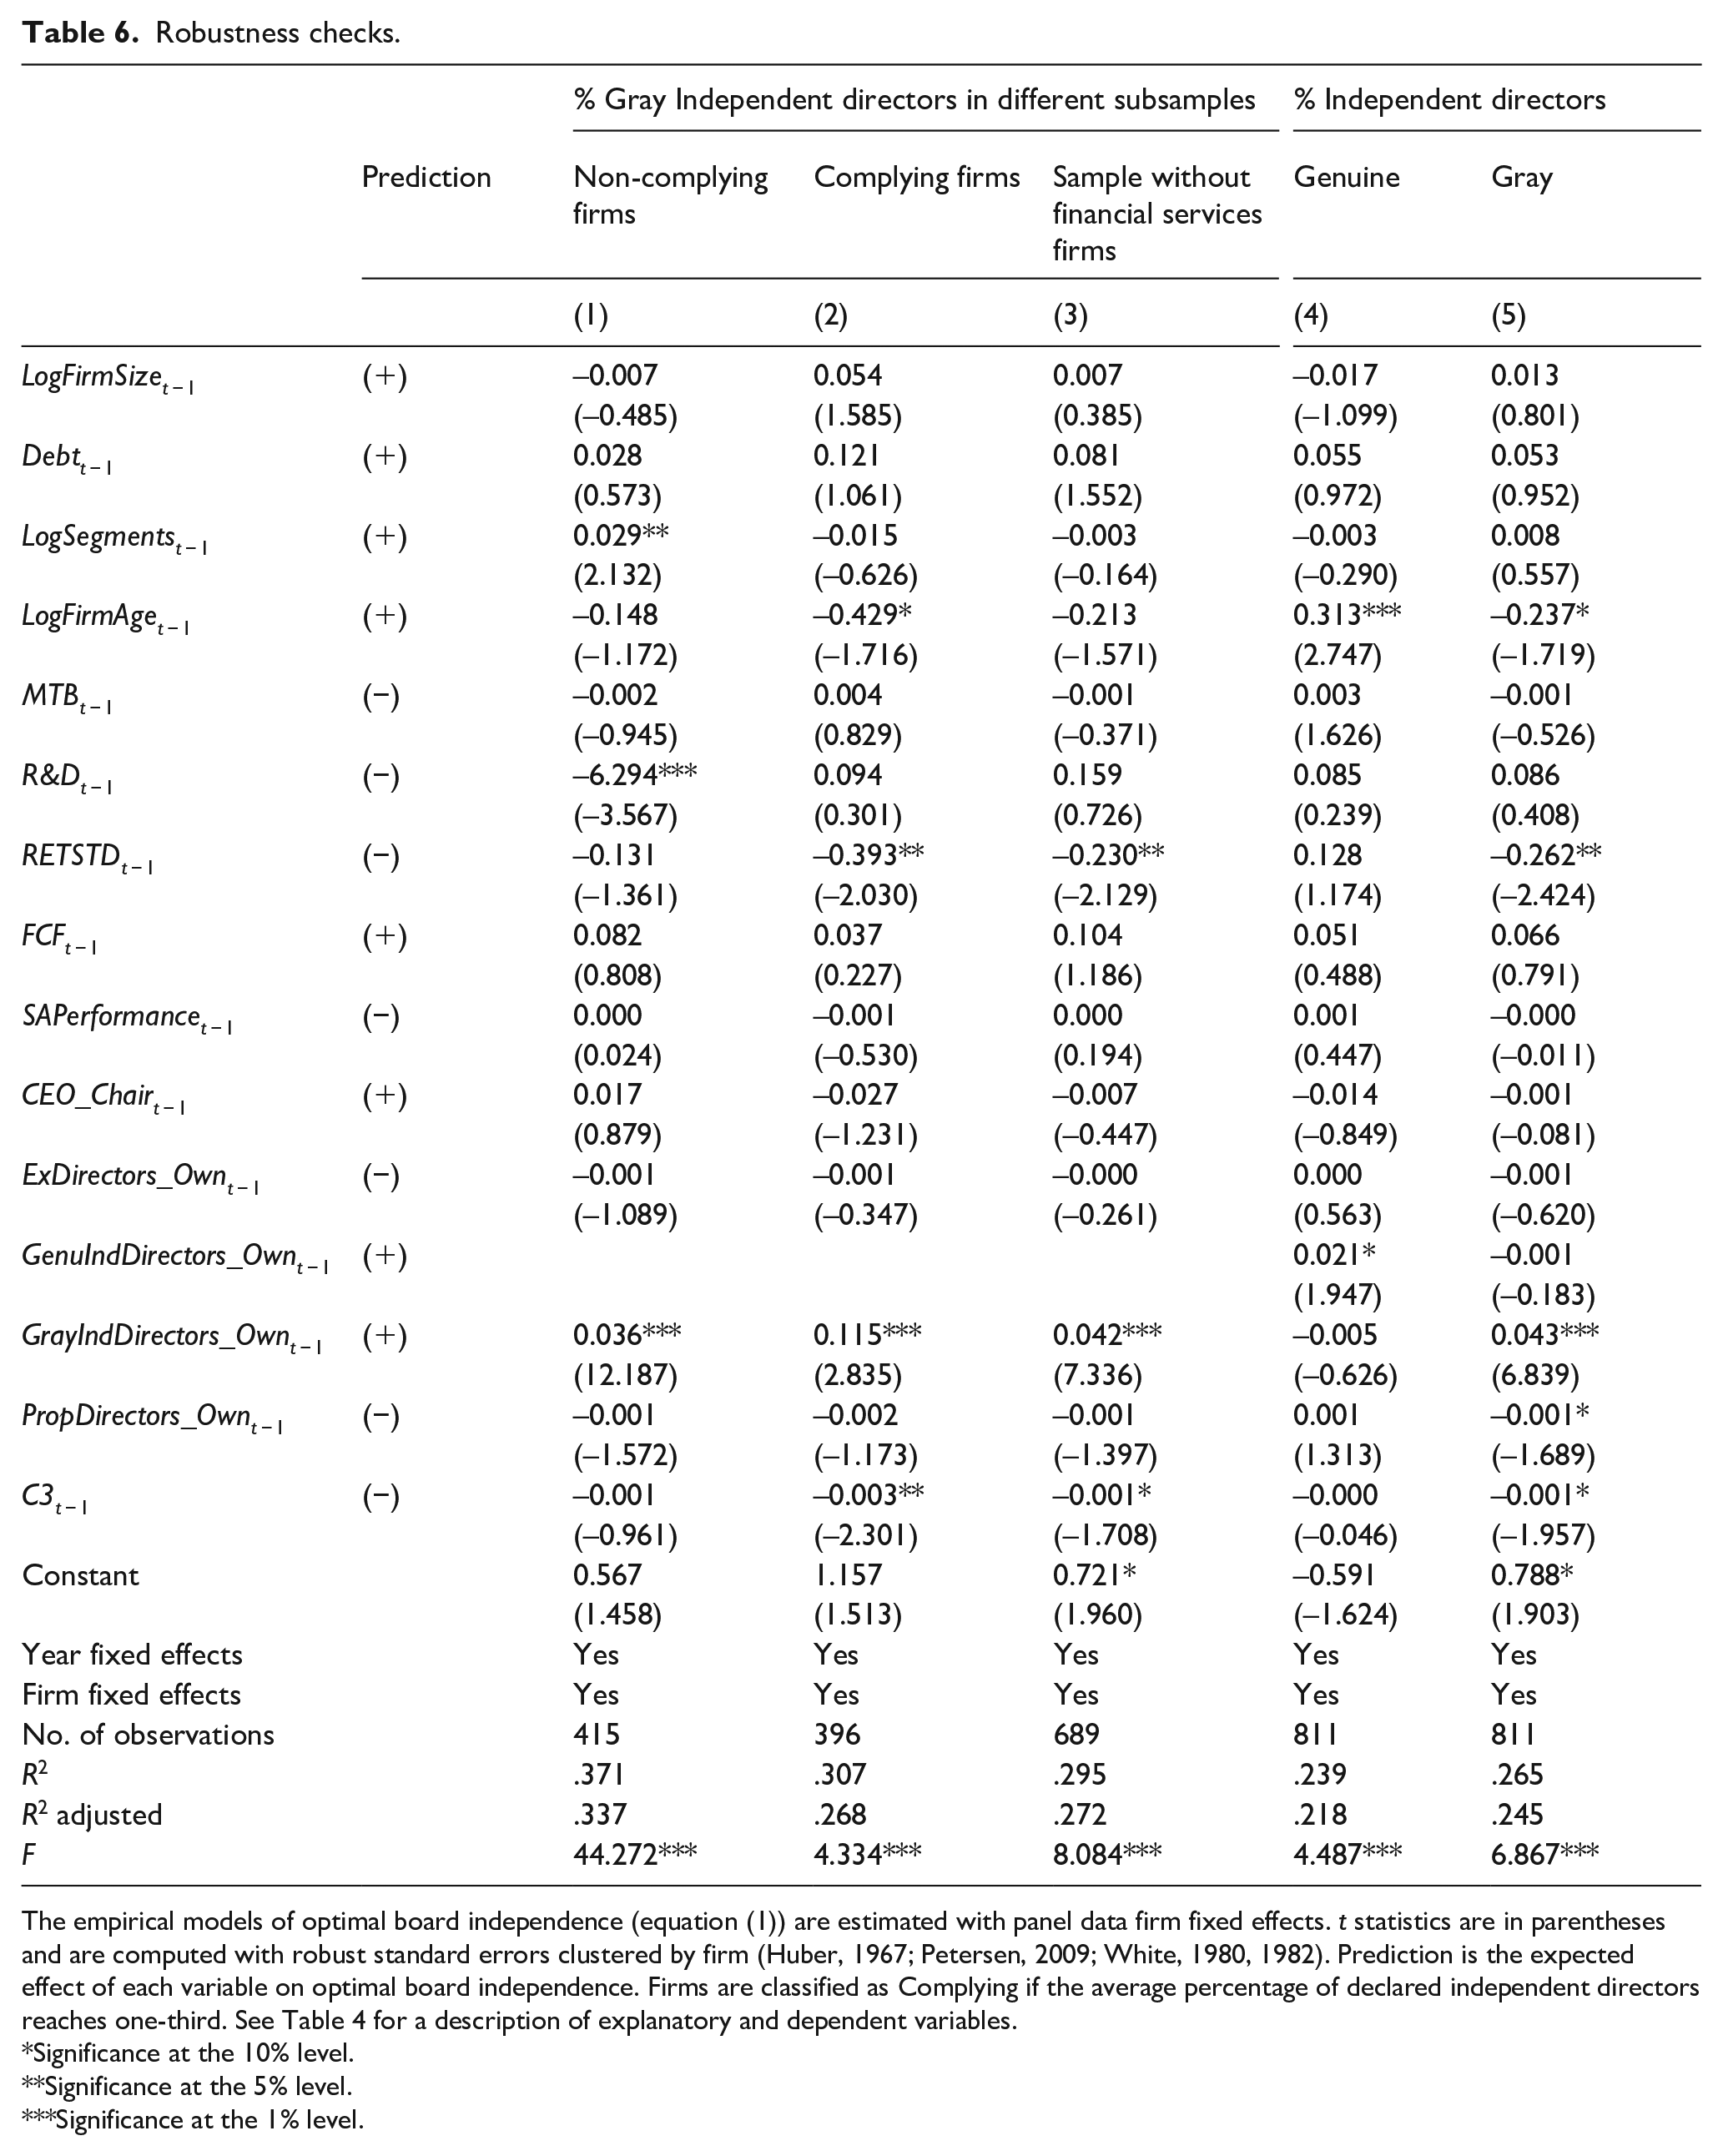
The empirical models of optimal board independence (equation (1)) are estimated with panel data firm fixed effects. t statistics are in parentheses and are computed with robust standard errors clustered by firm (Huber, 1967; Petersen, 2009; White, 1980, 1982). Prediction is the expected effect of each variable on optimal board independence. Firms are classified as Complying if the average percentage of declared independent directors reaches one-third. See Table 4 for a description of explanatory and dependent variables.
Significance at the 10% level.
Significance at the 5% level.
Significance at the 1% level.
We also perform the estimations excluding financial services firms (banks and insurance companies) due to their specific regulation and supervision. Furthermore, these firms show a larger presence of gray independent directors than other firms (see Panel C of Table 2). However, all statistically significant coefficients show the expected sign, also in line with our hypothesis (Column 3 of Table 6).
Our results suggest that in our sample, ownership by independent directors is a relevant determinant of optimal board independence. However, we assumed that ownership by each type of independent director is relevant to explain only the same type of independent directors (e.g., ownership by gray independents to explain the presence of gray independents). Models in Columns 4 and 5 of Table 6 include the ownership of both types of independent directors (genuine and gray, respectively) as explanatory variables. Results are consistent with our assumption: when the dependent variable is the proportion of gray (genuine) independents only, the ownership by gray (genuine) independents is statistically significant. Furthermore, these results show the robustness of our analysis even with the inclusion of both measures of ownership by independent directors simultaneously.
Finally, we check the robustness of our results when we introduce changes in the estimation techniques to address any remaining endogeneity concerns. We estimate our board independence models with the Dynamic System panel GMM estimator developed by Holtz-Eakin et al. (1988), Arellano and Bond (1991), Arellano and Bover (1995), and Blundell and Bond (1998) and contemporary explanatory variables. With this econometric technique, we address endogeneity in several ways: fixed unobserved heterogeneity, simultaneity, and any potential effect of past board independence on current values of the determinants of board independence. Although Wintoki et al. (2012) find this estimation technique to be necessary only when firm performance is the dependent variable. Our overall conclusions remain the same with this alternative methodology. In addition, as in Boone et al. (2007) and Farag and Mallin (2019), with contemporary explanatory variables, we also include the lagged value of the log of board size as an additional determinant in the independence models, to control for the possibility of both board structure measures being endogenously determined by a set of shared exogenous determinants. We estimate these models with firm fixed effects and with instrumental variables two-stage least square firm fixed effects models where lagged board size is the instrument of board size. Our results remain robust and are omitted to save space, although they are available on request.
Discussion
We find that the most relevant determinants of optimal board independence are related to the ownership structure, consistently with the strong ownership concentration in our sample of Spanish firms. Advising and monitoring costs are also relevant to explain the presence of gray independent directors—especially those costs related to asymmetric information between insiders and outsiders captured by stock return volatility, and in some cases, those arising with growth opportunities, captured by spending on research and development.
A critical point concerning our estimation of the empirical models of board independence is worth discussing at this point. The optimal board independence theory predicts a negative effect of large shareholders’, proprietary directors’ and of executives’ ownership on optimal board independence. An alternative interpretation is that the negative effect reflects the abuse of power by large shareholders (managers) against the interests of minority shareholders (shareholders). CEO tenure could also be interpreted as evidence of the CEO’s entrenchment instead of the CEO’s ability, although it is not statistically significant in our results. Our empirical evidence concerning board independence models, as in Linck et al. (2008), does not allow discarding the interpretation of abuse of power, particularly by large shareholders. However, the negative effect of these ownership variables also on the presence of gray independent directors (who might be related to large shareholders and managers) is consistent with our interpretation of results in terms of the optimal board independence theory.
Our empirical evidence suggests that firms behave as though independents classified as gray, according to formal criteria, provided real board independence. Consequently, the question that remains is why do Spanish firms have gray independent directors? The presence of gray independent directors is especially relevant at the beginning of our sample period and decreases over time (in 2005, on average, 66.7% of declared independent directors were gray). However, new gray independent directors are identified every year, primarily directors with some tenure whom the firm wants to retain. We interpret this evidence as the consequence of traditional corporate governance practices, lack of enforcement of the new corporate governance practices in Spain, and a low value attributed to formal independence requirements. If firms consider other director characteristics, probably related to their advising function, more valuable than formal independence requirements (and those characteristics are scarce), the replacement costs can be greater than the benefits of this formal independence. For example, Chen et al. (2009) and García-Meca and Palacio (2018) suggest characteristics related to knowledge and expertise as especially relevant. Consistently, Cavaco et al. (2017) find evidence of the relevance of individual abilities of outside directors for firm performance. A higher pressure on firms to comply with formal independence criteria imposed by regulators since 2007, with the inclusion of the definition of independent directors in the Spanish code of corporate governance, is consistent with the overall replacement of gray independent directors by genuine independent ones over the years, as found in Table 2. A nonsystematic inspection of the data reveals particular cases consistent with our conjecture. We find the presence of many members of the Spanish aristocracy as independent directors classified as gray in our analysis (e.g., Carlos de Borbón-Dos Sicilias, cousin of the former king of Spain, who served on the board of several firms such as Compañía Española de Petróleos, S.A. [CEPSA], an oil company). Most likely, the most valuable characteristic of these directors is related to their economic and political connections, as argued in the Spanish press (El Mundo, 10 September 2015). In addition, in 2014, after the end of our sample time period, the Spanish parliament incorporated the definition of an independent director into a law, increasing substantially its enforceability. There were several replacements of independent directors made explicitly to comply with this law, supporting our conjecture on low enforcement during our sample period. For example, Victor Urrutia, also classified as gray independent in our analysis, abandoned his position as independent director in Iberdrola in 2013 due to the plans of the government to approve this law (El Confidencial, 23 April 2013).
Conclusion
Boards of directors are supposed to provide monitoring (agency theory, Jensen & Meckling, 1976) and advising services (resource dependence theory, Pfeffer & Salancik, 1978) to the firm. The optimal board independence generates a combination of both services that maximize shareholders’ value. There is a trade-off between the combination of advising and monitoring that each director may provide to the board of directors (Adams & Ferreira, 2007). Managers are reluctant to share information with strong monitors and this may deteriorate the capacity of these directors to provide advice (e.g., Cavaco et al., 2016; Joh & Jung, 2018). In our sample, although gray independent directors are close to managers, at least formally, Crespí-Cladera and Pascual-Fuster (2014) found empirical evidence of them not deteriorating the monitoring performance of the board of directors. This result suggests that managers should be as reluctant to share information with them as with genuine independent directors. Therefore, we may expect them to provide their advising and monitoring services as expected of independent directors.
Our results indicate that in Spain, both genuine and gray independent directors, in terms of formal independence requirements, appear to be used by firms to achieve the optimal level of independence. No matter the type or the number of unsatisfied independence criteria, nor firms’ achievement of the regulators’ recommended level of board independence, our empirical evidence shows that both genuine and gray independent directors react to the determinants of optimal board independence with the expected sign, as though both provided the outcomes of real independence.
In the “Discussion” section, we propose an explanation for the presence of the formally gray independent directors in Spain during our sample period. Our overall results appear to suggest that characteristics other than the formal independence requirements, probably related to their advising functions, are the main source of value provided by some independent directors. This result is especially relevant given the focus of the codes of corporate governance on formal independence rather than on directors’ competencies and incentives (Zattoni & Cuomo, 2010).
Related articles, such as Boone et al. (2007), Markarian and Parbonetti (2007), Linck et al. (2008), Coles et al. (2008), Lehn et al. (2009), Wintoki et al. (2012) and Farag and Mallin (2019) study how firms determine the presence of independent directors. We expand this literature by analyzing how firms determine the presence of gray independent directors, and by analyzing different groups of gray independent directors in terms of degrees of grayness (number of unsatisfied independence criteria) and types of unsatisfied independence criteria. We also expand this literature with the analysis of board independence in a continental European institutional setting, characterized by ownership concentration. Interestingly, in this context, ownership determinants of board structure are the most relevant, as opposed to the findings in the US dispersed ownership setting (e.g., Boone et al., 2007; Linck et al., 2008). The literature on gray independent directors (e.g., Cohen et al., 2012; Crespí-Cladera & Pascual-Fuster, 2014 ; Fracassi & Tate, 2012; Hsu & Wu, 2014; Hwang & Kim, 2009) identifies specific types of gray independent directors and the consequences of their presence in terms of board monitoring or advising. We expand this literature studying how firms determine their presence and whether there are differences related to the degree of grayness or the type of unsatisfied independence criteria, using arguments of the optimal board independence theory.
Given our results, regulators of corporate governance practices should pay more attention to directors’ competencies, especially those related to their advising functions, rather than only to formal independence requirements. Firms should consider that gray independent directors, in terms of formal requirements, could also generate board independence, providing monitoring and advising services as expected from independent directors.
Supplemental Material
Online_Appendix – Supplemental material for Optimal board independence with gray independent directors
Supplemental material, Online_Appendix for Optimal board independence with gray independent directors by Bartolomé Pascual-Fuster and Rafel Crespí-Cladera in Business Research Quarterly
Footnotes
Declaration of conflicting interests
The author(s) declared no potential conflicts of interest with respect to the research, authorship, and/or publication of this article.
Funding
This research was funded by Ministerio de Ciencia, Innovación y Universidades (Spain), Grant/Award Numbers: ECO2017-86305-C4-1-R and ECO2017-86903-P; (MINECO/AEI/FEDER, UE).
Supplemental material
Supplemental material for this article is available online.
Notes
References
Supplementary Material
Please find the following supplemental material available below.
For Open Access articles published under a Creative Commons License, all supplemental material carries the same license as the article it is associated with.
For non-Open Access articles published, all supplemental material carries a non-exclusive license, and permission requests for re-use of supplemental material or any part of supplemental material shall be sent directly to the copyright owner as specified in the copyright notice associated with the article.