
Abstract
We analyze the weaknesses of meta-analyses (MAs) in management research using as benchmark a scientific field where this technique shows a longer tradition: clinical research. We suggest four areas in which management research MA practices should improve: (1) availability of information and replicability of primary research, (2) correct application of statistical support, (3) execution of heterogeneity analyses, and (4) standardization of result reporting. Using a representative MA on an operations management topic, we identify qualitatively the aspects to be improved at each stage. We show the different results that could have been achieved by following standard procedures in clinical research, incorporating different “good practices” from this research field. Overall, these recommendations aim at improving the transparency and replicability of MAs, which can not only facilitate the accumulation of scientific knowledge but also intensify the dialogue between academia and practitioners.
Introduction
Meta-analyses (MAs) began to spread in the mid-20th century to integrate and synthesize the results of an increasing number of studies in areas such as psychology and epidemiology (Aguinis et al., 2011c; Geyskens et al., 2009). Essentially, MAs aim at synthesizing the effect of interest by aggregating the estimations of a number of primary studies to estimate a global effect size (Cooper & Hedges, 1994a; Hunter & Schmidt, 1990). This effect size can be correlations (linear associations between pairs of variables), mean differences (between groups), or ratios (hazard ratios, risk ratios, or odds ratios of an event occurrence in a number of groups).
Its subsequent development in other areas, such as management, was the result of the gradual deployment of scientifically mature research practices; however, the very same development of MAs in these fields ran parallel to an increasing number of contradictory results that often hampered scientific progress (Carlson & Ji, 2011). Thus, while the growth of MAs in clinical research has been spectacular, their dissemination in the field of management has not progressed to the same extent (Aguinis et al., 2011a; Grand et al., 2018). In fact, predictions based on a review of the main management journals, which forecasted more than 1,000 MA studies in 2015, have been overly optimistic (Aguinis et al., 2011c): whereas the authors identified 196 studies in their 1982–2009 literature review, only 186 studies were published from 2010 to 2017 (10% of the initial forecast). A number of voices have raised the issue of how management scholars can benefit from the advances in areas such as clinical science, and there are open calls to adapt and adopt those good practices (e.g., Croucher, 2019; Kepes et al., 2012).
The reasons for the underutilization of this methodology in management research have barely been addressed. Indeed, some academics have analyzed the statistical limitations of certain approaches to MAs and have also demonstrated how the results can differ radically depending on the method (Aguinis et al., 2008) or the effect size metrics (e.g., Hedge’s g vs. Cohen’s q for mean differences). The frequency of use of two of the main statistical approaches—namely, Hunter and Schmidt (H&S; 1990, 2004) and Cooper and Hedges (C&H; 1994a and its subsequent updates, such as Cooper et al., 2009)—is one of the most striking aspects of the comparison between clinical research and management research MAs. While both methods (H&S and C&H) should not be seen as a dichotomous choice, the H&S approach has become the standard in management (Aguinis et al., 2011a), even if it should not always be applied in every MA. Divergences in statistical methods alone cannot explain the different levels of MA development in these two fields, nevertheless. These methods are readily available to both, and, in fact, they inspire various methodological recommendations of the most recent management-related MA updates (Aguinis et al., 2011b; Geyskens et al., 2009). By contrast, compared to the one single roadmap that most MAs in management follow, there are various normative guidelines in clinical research depending on the type of primary studies they synthesize. The reasons for the underutilization of MAs in management could consequently go beyond simple statistical issues.
Our thesis is that the slower adoption of meta-analytic practices in management has to do with the diverse perspectives shown by the analysis and even the way data are presented. We can synthesize the origins of the gap between the two scientific fields into four major areas: (1) limited replicability of MAs in management, mainly due to the difficulty in obtaining information from primary research, (2) the emphasis authors give to the selection and reporting of the statistical method, (3) scarce use of heterogeneity analysis and methods for triangulating results, and (4) a lack of norms in meta-analytical procedures and subsequent reporting in management. All these factors hinder the review processes, slow down the accrual of knowledge, and reduce its usefulness for several groups of business stakeholders (entrepreneurs, managers, labor unions, government, and so on).
Section “Background: meta-analytic procedures in clinical research and management” summarizes the literature to introduce the comparison between meta-analytic procedures in management and those used in clinical research. Once we identified the main differences, we chose what we consider a high-quality and highly cited management research MA (Mackelprang & Nair, 2010), representative of what can be generally observed in the area, easy to understand for a non-specialist and published in a top outlet such as the Journal of Operations Management. We use this MA to exemplify our initial diagnosis and delve qualitatively into the different results authors could have obtained if they had followed the standards of clinical research. The study by Mackelprang and Nair (2010) addresses the relation between just-in-time (JIT) and firm performance (Forza & Di Nuzzo, 1998; Thomé et al., 2016). Thus, using the normative guidelines of clinical research as a benchmark, we illustrate in section “A case study” the areas of improvement with a holistic view of the entire meta-analytical process. Then, section “Results and discussion: reviewing and completing the H&S approach” synthesizes the main lessons to offer a proposal for meta-analytic standards in management (MASM). This proposal includes the entire analytical process—beyond the mere statistical analysis—from the systematic literature review and the information gathering to the final reporting of results. Our recommendations target not only MA authors, nevertheless, but also the authors of primary research studies and the editors who publish them.
Background: meta-analytic procedures in clinical research and management
There are several methods to synthesize a body of knowledge on a certain phenomenon related to bibliometric techniques (see Zupic & Čater, 2015 for a list), such as mapping the intellectual structure of research (e.g., Dabic et al., 2014), bibliographic coupling, network analysis of references or co-citations (e.g., Martín-de Castro et al., 2019), or even discursive reviews (e.g., Martínez-Noya and Narula, 2018). Each of them is appropriate to answer different questions, such as delving into the main theoretical approaches, who the experts in a topic are, or what emergent topics are being addressed. Their ultimate goal is to provide the state of the art and, frequently, a discussion on a future research agenda. However, all these bibliometric techniques mainly provide qualitative rather than quantitative responses.
By contrast, MA is a type of quantitative literature review that essentially seeks two goals (Miller & Pollock, 1994): (1) the integration of primary research results by contrasting hypotheses and (2) the presentation of new hypotheses not included in primary research. Thus, in addition to the integration of results or the refutation of established hypotheses, heterogeneity analysis of primary studies opens up new avenues of inquiry (Carlson & Ji, 2011).
Regarding the first goal, meta-analytic integration offers aggregated results about a particular phenomenon—by estimating the target effect size and additional statistics—that are more accurate than those included in each individual study. Very often, management research MAs focus on evaluating the association between some independent and certain dependent variables, so the effect size of interest is a correlation. Clinical research MAs, nevertheless, usually involve the comparison between control and treatment groups, so the effect size of interest is typically the difference of means or a binary variable, and therefore, the effect size is a risk or an odds ratio. In any case, one must keep in mind that to aggregate the findings of multiple, independent studies, researchers need to deal with various measurement methods or sample sizes, among other issues. These “methodological imperfections,” which are not attributable to the facts being studied, are called artifacts. Hunter and Schmidt (1990) identify up to 11 artifacts that inflate artificially the estimate of effect size with regard to the real correlation in, primarily, psychometric studies. If the distorting effects of the artifacts are not offset, then the effect size variability between different studies could be mistakenly attributed to moderating variables. In cases where there is high heterogeneity in primary research, MAs help to identify potentially moderating variables that may uncover new hypotheses initially neglected. Hence, the second purpose of MAs stated above.
The process of MAs in the field of clinical research
We posit that the field of clinical research provides an insightful benchmark for good MA practices in management. This statement is based on two major observations: on one hand, we can highlight the maturity of this field in terms of frequency of MA use to produce cumulative knowledge. On the other hand, it is worth noting that MAs in the clinical setting have undergone a significant explicit normative development in recent years (Geyskens et al., 2009). Thus, depending on the type of MA addressed, clinical researchers use different guides such as Preferred Reporting Items for Systematic Reviews and Meta-Analyses (PRISMA; Moher et al., 2015), Quality of Reporting of Meta-analyses standards–QUORUM and Meta-analyses Of Observational Studies in Epidemiology–MOOSE (Stroup et al., 2000), STrengthening the Reporting of OBservational studies in Epidemiology–STROBE (Vandenbroucke et al., 2007), or the Cochrane Handbook (Higgins & Green, 2011). With regard strictly to the statistics, clinical research also follows the guidelines proposed by Cooper and Hedges (1994a; 80.2% of MAs as shown by Table 1). Overall, the implemented standards reflect an MA process of execution and reporting that follows five stages:
(1) Problem statement, variables at stake, and formulation of hypotheses. At this stage, researchers pose the problem statement and identify the studies to be incorporated, as well as the type of information that will be collected. The variables and the research hypotheses must be defined clearly and precisely.
(2) Literature review and data collection. This second stage involves a systematic literature review and the collection of data. It is advisable for this stage to be conducted by two or more reviewers. There must also be a clear and explicit definition of the search strategy and the inclusion (and exclusion) criteria. In clinical research, studies not yet published that address the variables of interest are included, along with those published in scientific journals.
(3) Evaluation of the studies. This is a key phase because of its influence on the validity of the MA. Beyond clear descriptions of the methodology—in the PRISMA methodology, for example, an informative flowchart is usually included—scholars should codify and include certain parameters from primary studies, such as the measurement of effect, or the information to obtain it; the sample size; and any information about the sample characteristics that may lead to the posterior detection of heterogeneity across studies.
(4) Analysis of results. This stage includes the statistical analysis, as well as its interpretation and quality assessment. Once the combined effect measure and its corresponding confidence interval have been obtained, heterogeneity analysis follows. This is crucial for the MA to determine whether the effect is universal or whether it depends on some contextual variable or classification of the subjects.
(5) Presentation of results. In this last stage, researchers must present two main outputs: on one hand, they should report the main results (e.g., combined effect measure, corrections for systematic attenuating artifacts, and correction for interdependent effect sizes). On the other hand, they must also present MA quality assurance measures such as publication bias, outliers, influential studies, and heterogeneity—moderation analyses (Geyskens et al., 2009). Cooper (1990) showed, in fact, that MA reviewers draw heavily on their ability to interpret results, so the organization of content and clarity are key to achieving what Cooper and Hedges (1994b) call wisdom in integrative reviews. Although all this information is common in clinical research, MAs in the management field still show a large space for improvement (Schild & Voracek, 2013).
Breakdown of frequencies of hits citing C&H and H&S, by research domain.
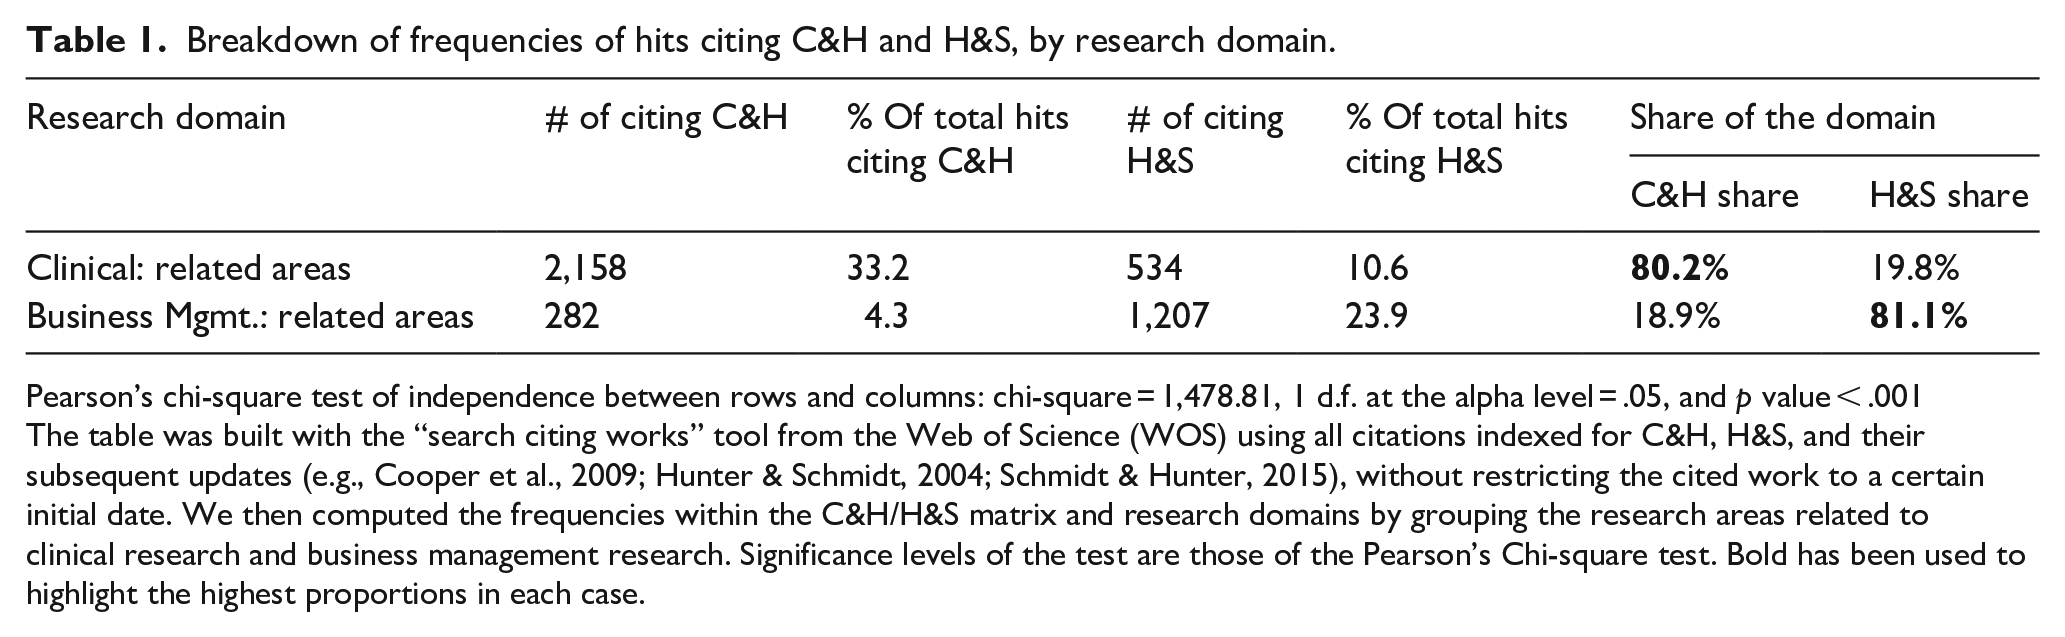
Pearson’s chi-square test of independence between rows and columns: chi-square = 1,478.81, 1 d.f. at the alpha level = .05, and p value < .001
The table was built with the “search citing works” tool from the Web of Science (WOS) using all citations indexed for C&H, H&S, and their subsequent updates (e.g., Cooper et al., 2009; Hunter & Schmidt, 2004; Schmidt & Hunter, 2015), without restricting the cited work to a certain initial date. We then computed the frequencies within the C&H/H&S matrix and research domains by grouping the research areas related to clinical research and business management research. Significance levels of the test are those of the Pearson’s Chi-square test. Bold has been used to highlight the highest proportions in each case.
MA in management: main differences with clinical research
The main elements of discussion in management research MAs have converged so far around statistical choices. A non-exhaustive list of papers reflecting these concerns include Cortina (2003), Aguinis et al. (2005), Kisamore and Brannick (2008), Aguinis et al. (2008), Geyskens et al. (2009), Aguinis et al. (2009, 2011), Aytug et al. (2012), and Kepes et al. (2012). Nevertheless, whereas 80.2% of MA studies in the clinical field follow the C&H approach, as recommended by the above-mentioned guides, the share of H&S is 81% in business management MAs (Table 1). This is consistent with the 83% found by Aguinis et al. (2011a) and the 80.8% found by Aytug et al. (2012). Accordingly, given the lack of normative development in management research MAs, this raises the question of whether the implementation of H&S reflects editors’ and reviewers’ requirements, or whether it is mainly due to a continuous mimicry in the application of MA procedures even when they are not pertinent to the problem and/or data being addressed.
While the emphasis on statistics was probably needed at a time when measurement and analytical diversity generated much confusion, it is necessary now to expand the focus. Following the stages described above, we present a discussion below of the main challenges and how they could be resolved following clinical research.
Hypothesis formulation and data collection: replicability issues
Several authors have identified these first two stages as being the most problematic and associated with the relatively low adoption of MAs in the management field (e.g., Aguinis et al., 2005; Bosco et al., 2017; Geyskens et al., 2009; Kepes et al., 2013). We have decided to merge them because the associated flaws we identify in both of them are inextricable linked.
The main problem is that primary research on management topics does not always report the necessary information, nor does it use transparent practices. The elaboration and contrast of new hypotheses require the availability of sufficient information in primary research to obtain the appropriate measurement of effect size for each subsample. While the primary clinical research studies often include this information due to the required reporting standards, the less frequent use of these normative standards in management results in insufficient relevant information. For instance, Cao and Lumineau’s (2015) MAs on the interplay between contractual and relational governance in supply chains had to exclude 402 of the 545 empirical studies because they did not include the required correlations. The exclusion of certain studies from MAs may, therefore, be a cause of publication bias. Another example is the MA on lean production and firm’s performance performed by Abreu-Ledón et al. (2018). These authors reported they tried to contact with authors of those primary studies that reported incomplete information, but none of them answered.
Furthermore, there are numerous primary research studies in management that lack sufficient power (sample size) to achieve statistically significant results, which makes management research MAs with adequate sample sizes lack the precision needed to estimate effect size (Dalton & Dalton, 2008). This is the case of the MA performed by Chen et al. (2010) on the antecedents of new product development speed. Their MA presents the adequate sample size, but 11 of the 70 articles were based in sample sizes below 40 cases and some included as low as 24–30 observations in the sample.
Evaluation of studies: conceptualization problem
There is also a problem of semantic confusion in management that prevents MAs from being applied more extensively (Cortina, 2003). While each concept in clinical research is unique and precisely defined, we find conceptual definitions in management that appear to be different, either in the name of the variable or due to definition nuances. In addition, the same concept may be imbued sometimes with different meanings (Mackelprang & Nair, 2010).
This may have been the reason for the enormous propagation of what is currently the most common MA approach in management: Hunter and Schmidt (1990). This type of analysis—called psychometric MAs—comes from the field of operational psychology, and perhaps due to certain similarities with research practices in management (e.g., use of questionnaires, different nomenclatures and metrics for the same concept, and so on), its dissemination has been even identified by some authors as a source of weakness in management research MAs (Aguinis et al., 2011a). Le et al. (2009) ponder the necessary consolidation of the various conceptual vs. operational definitions and argue that conceptualizing is different from operationalizing its measurement, hence their claim on the need to introduce an attenuation of that artifact. Be as it may, the problem of conceptualization is still pervasive among management research MAs (Cortina, 2003). Rosenzweig and Easton (2010), for instance, present an MA on the tradeoffs that designing a manufacturing strategy entails. They introduce the evolution of the concept tradeoff in manufacturing in their background and specifically discuss the problem raised by the different approaches to the conceptualization of these tradeoffs. A critical issue follows: the extent to what the papers reviewed may have used the same operationalization while holding on the same conceptualization. In the clinical area, by contrast, there are particular guidelines to transform some measurements into others coherently with the idea expressed by Le et al. (2009).
Analysis of results: the problem of the psychometric approach and evaluation of heterogeneity
Although literature is always evolving in any scientific field, there is a higher consensus in clinical research than in management regarding the meta-analytical procedure or the best statistical technique for a given objective (Kepes et al., 2013). Aguinis et al. (2011a) found 21 different methodological choices that could alter results (e.g., from how to weight the measure of effect size or how to aggregate these measures, to whether fixed or random effects should be used and many others).
A crucial decision that researchers must make is whether to use fixed or random effects to estimate effect size. The fixed-effects model is appropriate when assuming that a large part of the difference in effect size between the primary research studies is due to sample variability (Cooper & Hedges, 1994b; Hunter & Schmidt, 2000). It is, therefore, a conditional inference only for the meta-analyzed k studies (Hedges & Vevea, 1998). The random-effects model maintains that part of the sample variance is actually due to variations in the effect size, while another part may be due to sampling variance (Overton, 1998). This second option is usually the suggested method for the management field (Kisamore & Brannick, 2008). Nevertheless, authors such as Hedges and Vevea (1998) and Overton (1998) stress that the choice between fixed and random effects should be based on the extent to which the observed variance adjusts to what would be expected if it were distributed exactly as predicted by the fixed-effects model (i.e., the same in all the studies) or by the random-effects model (i.e., one part is common and the other is a random variation across the studies). Furthermore, the results of a fixed-effects model can only be valid for the meta-analyzed studies (the sample studies are the population), while random-effects estimations can be extrapolated beyond those studies (the sample studies are only a portion of the total population). In management, this choice is not frequently reported. For instance, the MA by Rosenzweig and Easton (2010) analyzed primary studies that essentially included self-reported measures of tradeoffs in manufacturing, but they did not report whether they used a fixed- or a random-effects model. Both approaches, H&S and C&H, acknowledge this issue.
The other critical decision in this stage is to define the necessary corrections to be made in the effect measurements. The Hunter and Schmidt handbooks provide a detailed technical explanation of the correction of artifacts in the MA of correlations. Hunter and Schmidt (1990) identified up to 11 artifacts in Chapter 2 (e.g., measurement error, dichotomization of variables, or sampling error) that may cause a study’s correlation to differ from the actual “true” correlation between independent and dependent variables. Since management research MAs often incorporate psychometric measures, it is advisable to correct for artifacts following the H&S method. The ultimate objective of the study should always be considered, anyway, so researchers should not simply correct the effect measurements systematically neglecting the approach that was used. For example, there is a striking lack of correction for range restriction artifacts in management, for both dependent and independent variables, which Aguinis et al. (2011a) identified in almost 90% of the cases. The C&H approach also advocates for these corrections, although through different computations. Whereas H&S use each study’s sample size (ni) and the artifact attenuation factor (A) as an approximation to the optimal weights, clinical research follows essentially the C&H approach, which weights by an estimation of the inverse variance of each effect size.
Once the estimation of effect size is complete, for those cases with high heterogeneity among the primary research studies, the MA helps to identify possible moderating variables and serves as a source of new hypotheses. This is where a very significant problem emerges when scholars follow the H&S approach (Geyskens et al., 2009) because it recommends the use of the well-known Ratio2 1 estimator. This ratio aims at detecting heterogeneity caused by the aggregation of studies that contain different groups based on a certain moderator variable. It has been subject to criticisms due to the purely informative, non-probative nature of this test (Borenstein et al., 2009; Schulze, 2004). Accordingly, this literature has proposed additional tests, such as I2 and H2—which are widely used in the clinical field—to detect possible moderators. Whereas the I2 index describes the percentage of variability that is due to heterogeneity rather than to sampling error, the H2 index is calculated as the ratio of the unaccounted-for variability in effect size to the level of sampling variability (Borenstein et al., 2009). Some authors even recommend using several different methods to triangulate heterogeneity analyses to detect the presence of moderating effects (Kepes et al., 2012, 2013) The difficulties to perform any of these heterogeneity analyses can be found for instance in the MA Kolev (2016) performed on the relationship between several variables and divestitures. He only tested heterogeneity by means of overlapping in confidence intervals to subgroups and he followed the H&S approach. Another example is the meta-analytic structural equation modeling that Horstmeier et al. (2017) developed in the study of the differential effects of transformational leadership on multiple identifications at work. They only relied on the Hedges and Olkin (1985) Q statistic for the heterogeneity analysis and they performed no other triangulation despite the low power of these statistics.
Presentation of results: lack of normative guidance
The lack of normative standards for reporting results is not only a question of aesthetic clarity. It prevents the replicability of MAs, adds complexity for scholars in evaluating their quality, and makes it harder for practitioners to assess their usefulness (Aytug et al., 2012; Grand et al., 2018).
Schild and Voracek (2013) compared the use of graphs across and within the disciplines of medicine, psychology, and business. In the 55 articles analyzed from business, they found that only two had reported a forest plot, a funnel plot, or a flowchart. Meanwhile, among the 523 articles analyzed from medicine, they found 1,037 forest plots (an average of nearly two per paper), 39 funnel plots, and 178 flowcharts. Similarly, Geyskens et al. (2009) found that only 3.5% of the sample analyzed (196 MAs) had incorporated complete information on reliability to ensure the replicability of the studies. The same study by Geyskens et al. (2009) identified other elements that not often appear in the presentation of results, such as analyses of publication bias (only 15% of MAs analyzed), of sensitivity, or of outliers (barely 16%).
The development and dissemination of standardized reporting guidelines are, therefore, essential, not only to provide clarity and transparency to studies but also to allow subsequent updates that support the cumulative build-up of knowledge. In fact, several authors have taken some tentative steps in this direction. Kepes et al. (2013) offer models to summarize the primary research data: the contour-enhanced funnel plot, the funnel plot with trim, or the forest plot of the moderator effects, among others. The recommendations of Kepes et al. (2013), however, have not been implemented in the management research MA literature (this study received a meager average of 13 citations per year in 2016 and 2017). Anzures-Cabrera and Higgins (2010), on the other hand, have offered a guide on how to produce graphic illustrations in MAs with a very similar outcome.
A case study
Selected case and methodology
We use Mackelprang and Nair (2010) as a case study to delve into the strengths and weaknesses of MAs in management research and subsequently develop holistically a proposal for meta-analytic standards beyond statistical considerations. The choice of this article was not random.
To begin with, the article addresses the relationship between JIT manufacturing practices and performance outcomes, which represents an easily comprehensible problem statement even for colleagues working on marketing, finance, international business, strategy, and so on. Furthermore, the article is also a very cited article in its field. A more recent paper would not meet this requirement, but more importantly, it reflects a very relevant issue: we keep basing our analyses on papers that could have altered results if performed differently. Third, the article is of unquestionable quality and has been validated by the reviewers and editors of a prestigious journal, so it is also a good case study to illustrate areas of improvement. To put it bluntly, it would not be very surprising for BRQ readers if we posited areas for improvement using a paper published in a Q4 operations management journal (regardless of its citations), particularly those upon which the replicability of a scientific study depends. Finally, the authors followed Hunter and Schmidt (1990, 2004), the most widespread approach in management as shown in Table 1 and other studies (Aguinis et al., 2011a). This is important because its wide dissemination in management research MA advises to build our proposal upon established strengths, addressing nevertheless its weaknesses by resorting to clinical research common standards.
Together with the insights from section “Background: meta-analytic procedures in clinical research and management,” which mainly address areas for improvement in primary studies, replicating Mackelprang and Nair (2010) will allow us to offer a meta-analytical procedure and, specifically, to provide recommendations on how and what information should be included. The result of this effort is an eclectic approach that somehow unifies H&S and C&H as a reflection of current practices in management and potential benefits from imitating clinical MAs.
Data collection
In this stage, we observed two potential areas of improvement that would ensure the replicability of the MA. First, as proposed in clinical research MAs, the first stage should consist of a systematic literature review using different sources to identify all the primary research studies addressing the question at hand. However, similar to many MAs in management, Mackelprang and Nair (2010) limited their search to only certain scientific journals: “the journals in the areas of operations management, management, marketing, and logistics” (Mackelprang and Nair, 2010, p. 286). It is very possible that numerous articles on the subject (published in other journals in the field or related fields) have been overlooked when one considers that criterion. Second, once the global correlation was estimated, it would have been necessary to evaluate the goodness of fit by analyzing publication bias (which does not appear in the original MA), thus allowing the validity of the MA to be determined.
Furthermore, we could verify the difficulty in replicating management-related MAs because of the limited information contained in the vast majority of the primary studies addressed by Mackelprang and Nair (2010). Following the example of Aguinis et al. (2005), a personal email was sent to all correspondence authors of the 25 primary research studies (listed in Table 2). When emails were returned as undeliverable, they were sent to the other authors. We sent two rounds of emails, but only one author replied. This proves the difficulty in obtaining the necessary information from primary studies, as Mackelprang and Nair (2010) acknowledge in their own paper. They remark not only (p. 296) that seven of the 60 relationships examined did not have sufficient data available but also that when they tried to contact the primary authors, only 13 of the 23 studies that lacked that information replied. We should emphasize the total number of studies they meta-analyzed was 25. This led the authors to substitute reliability measures of JIT practices and performance by the average of those studies reporting them. Coherently, their work stresses the need for journals’ editors to demand the complete presentation of results in primary studies (descriptive data, correlations, and confidence measures), as well as the creation of specific forums where authors include supplementary materials or requests for information (e.g., MetaBUS, as reported by Bosco et al., 2017). We should furthermore note that our literature review was not expanded over theirs: we work directly with the set of articles used by Mackelprang and Nair (2010) to avoid possible differences due to a different sample of primary studies.
Information for each study of JIT practices–performance to perform the meta-analysis (H&S and C&H methods).
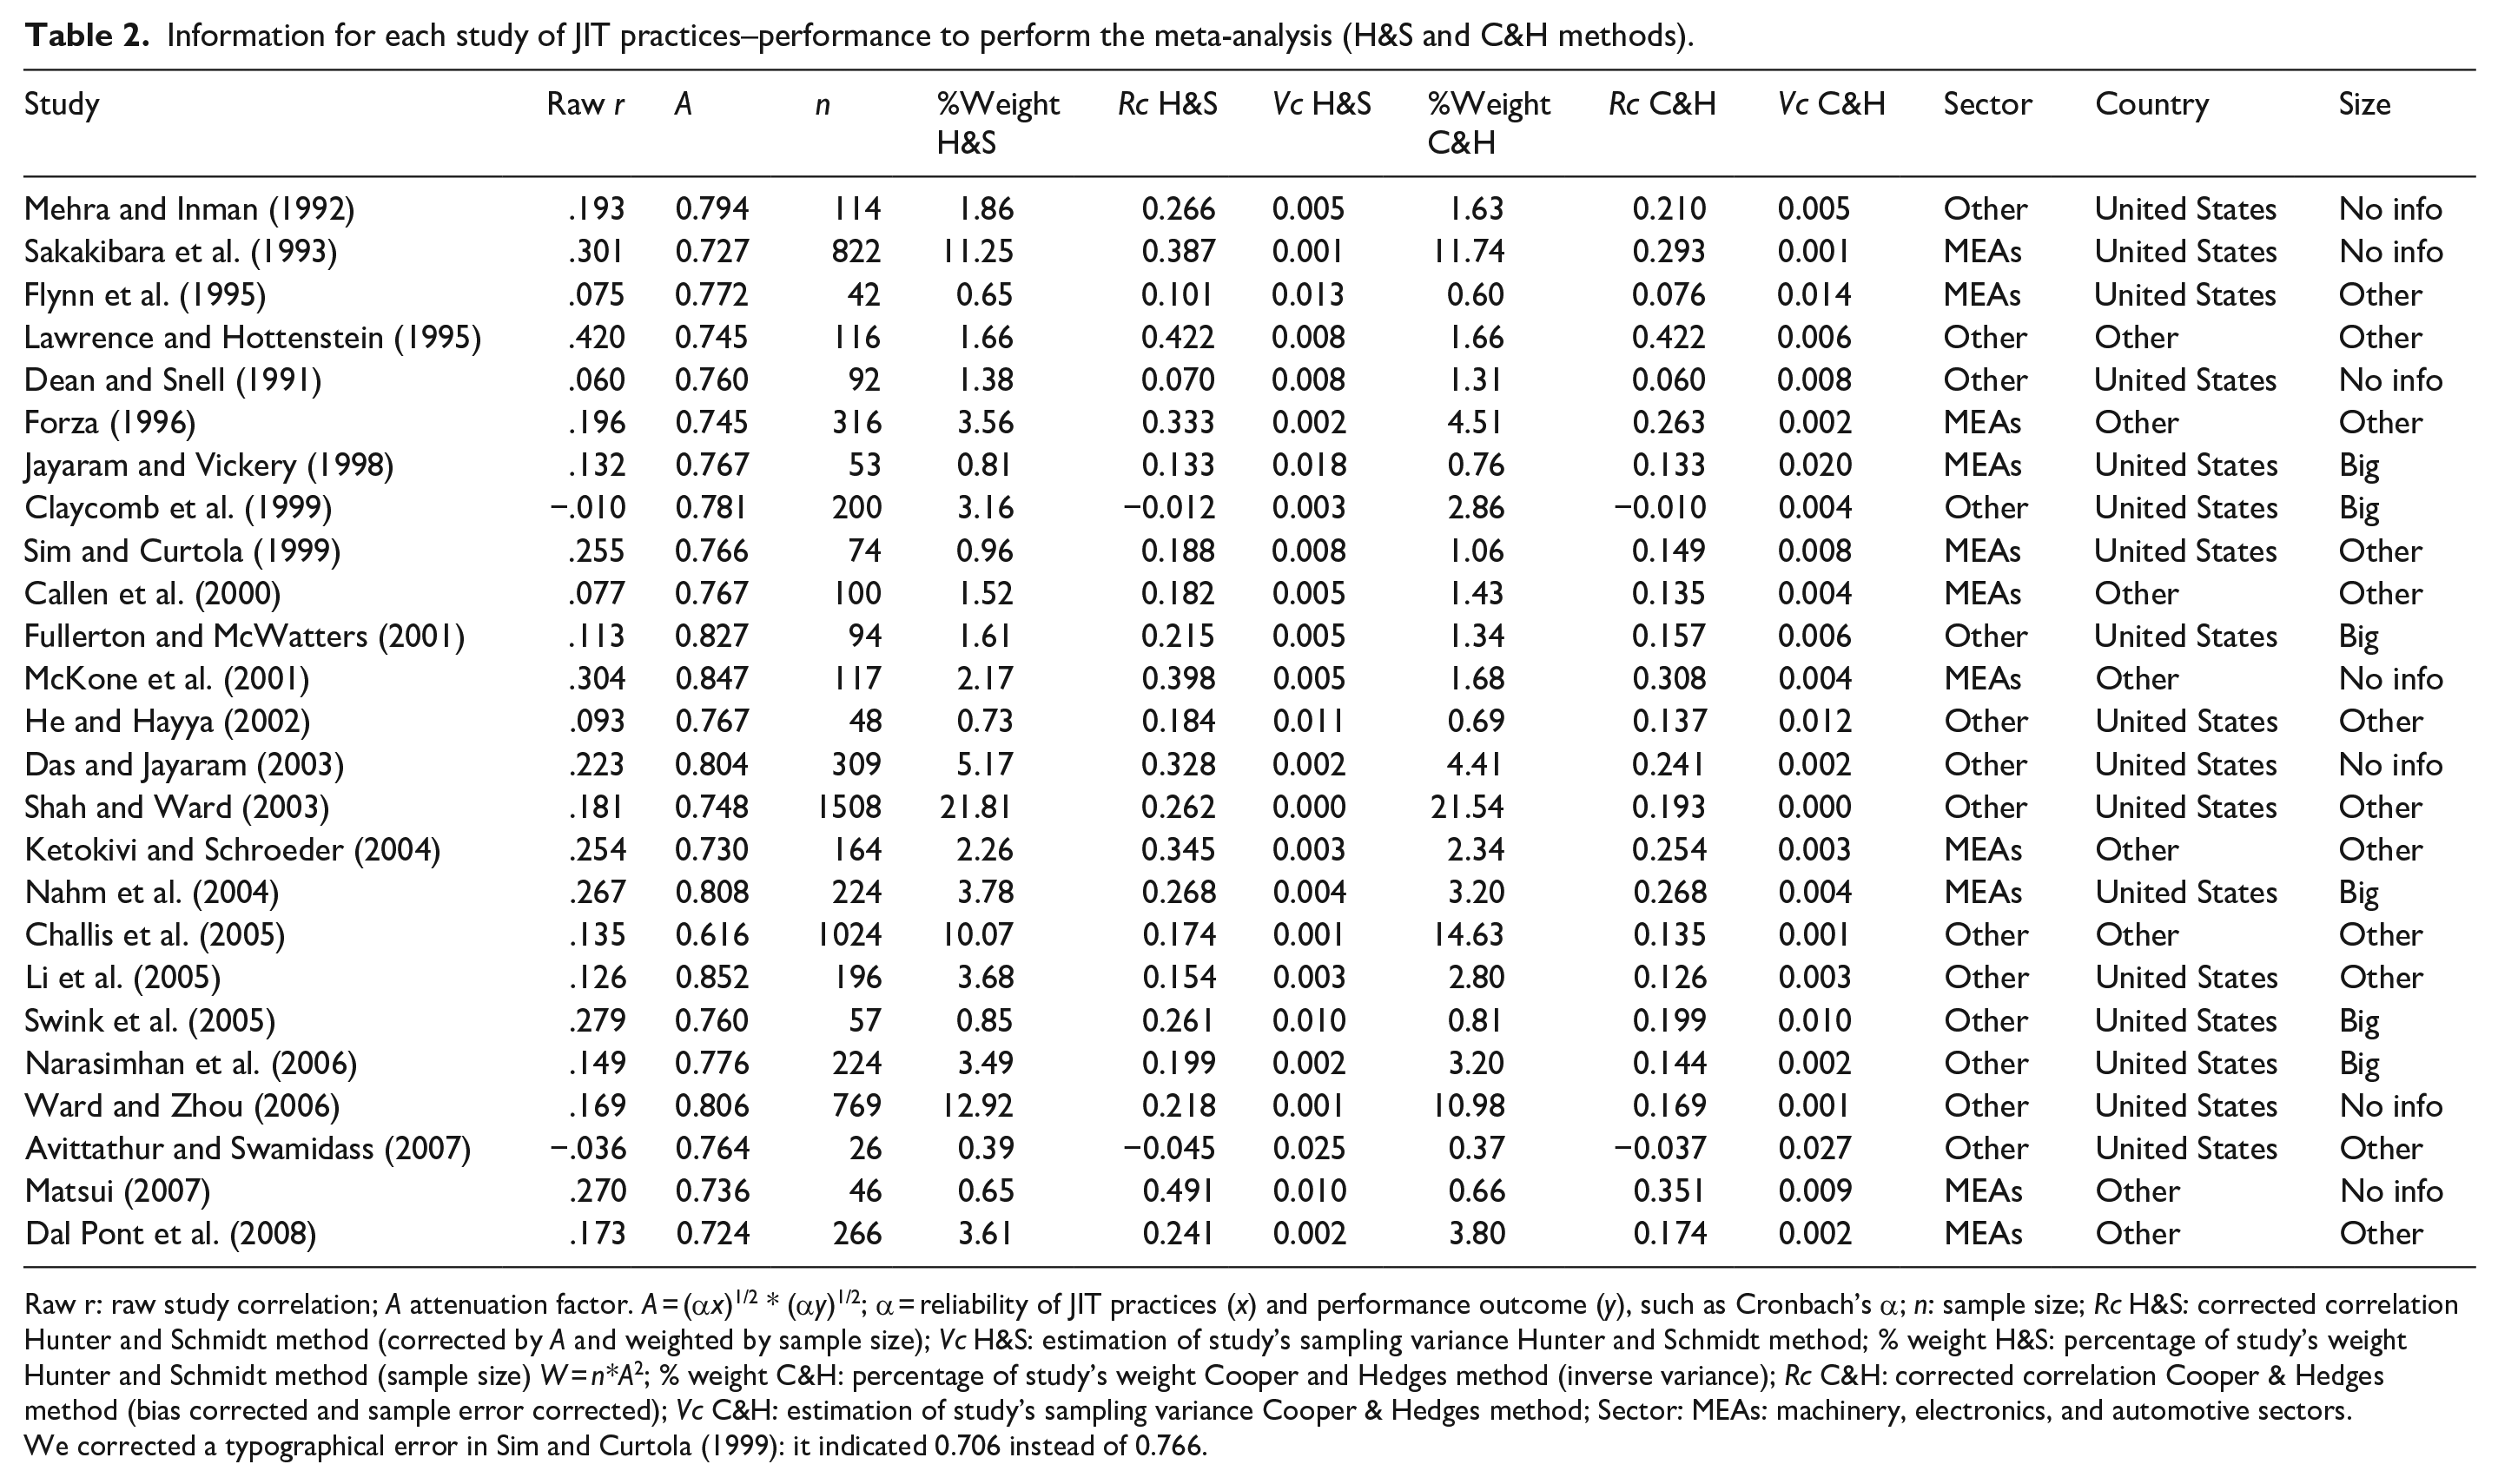
Raw r: raw study correlation; A attenuation factor. A = (α x )1/2 * (α y )1/2; α = reliability of JIT practices (x) and performance outcome (y), such as Cronbach’s α; n: sample size; Rc H&S: corrected correlation Hunter and Schmidt method (corrected by A and weighted by sample size); Vc H&S: estimation of study’s sampling variance Hunter and Schmidt method; % weight H&S: percentage of study’s weight Hunter and Schmidt method (sample size) W = n*A2; % weight C&H: percentage of study’s weight Cooper and Hedges method (inverse variance); Rc C&H: corrected correlation Cooper & Hedges method (bias corrected and sample error corrected); Vc C&H: estimation of study’s sampling variance Cooper & Hedges method; Sector: MEAs: machinery, electronics, and automotive sectors.
We corrected a typographical error in Sim and Curtola (1999): it indicated 0.706 instead of 0.766.
Regarding statistics, Hunter and Schmidt (2004) was chosen for the first stage. Since management researchers usually incorporate psychometric measures, it is advisable to correct for artifacts (measurement error, dichotomization of variables, or sampling error) that may cause the study of the correlation to differ from the current “true” correlation between independent and dependent variables. In the second stage, we evaluate the combined correlation. Although it is most appropriate from the clinical perspective to employ empirical Bayes or the method of restricted maximum likelihood (REML; Sidik & Jonkman, 2007), we chose the H&S estimator—as Mackelprang and Nair (2010)—to start with the same values. Nevertheless, for comparative purposes, we included the results of both H&S and REML methods. We used the software package R v.3.4.0 (R Core Team, 2017) and the packages metafor 2.0 (Viechtbauer, 2010) and MAc 1.1.0 (Del Re & Hoyt, 2010).
Results and discussion: reviewing and completing the H&S approach
The primary studies to be included in our replication of Mackelprang and Nair (2010) were exactly the same they used. The rationale is comparing the difference in results that merely depends on the approaches themselves. We do include an Appendix 1, however, with the complete search strategy and the criteria for inclusion. The conditions described by Mackelprang and Nair (“journals in operations management, management, marketing, and logistics”) could reduce the sample to high-impact journals, which could lead to publication bias.
The overall statistical method can be summarized in four steps: (1) obtaining corrected correlations and variances using both H&S and C&H approaches, (2) aggregating the two families of correlations and variances obtained in the previous step in those cases that reported more than one pair of JIT practices and performance indicators (H&S for correlations, and Borenstein et al. (2009) and Hedges (1989) for variance), (3) estimating tau through REML with variance estimates and compare it to the original H&S approximation with corrections for sampling and measurement errors, including goodness-of-fit indicators (e.g., funnel plot), and (4) evaluating heterogeneity and analyzing moderators following the two methods: H&S and C&H. The main differences lie in how to average independent effect sizes (through sample size for H&S, and from the inverse variance of each effect size for C&H), as well as in the use of more than a single estimator for heterogeneity (Ratio2 for H&S and, in addition to that, I2 and H2 for C&H).
Following these steps, we first computed the intra-study correlations—attenuating the necessary artifacts—and then we evaluated the combined correlation between studies. In those cases where the same publication indicates several correlations, we aggregated them into a single measure of effect for each study. It should be noted that we have corrected one mistake (Table 2) in the case of Sim and Curtola (1999). This table also shows the aggregate correlations (r) and those corrected for artifacts (rcorrected) as computed by Mackelprang and Nair (2010). The main artifacts related to reliability measures of the latent variables were obtained directly from the primary studies (Cronbach’s α, composite reliability indicator . . .) and sampling error. With these antecedents, the main differences between the H&S original estimation of Mackelprang and Nair (2010) and our C&H estimation are the following:
We did not include any attenuation for variables’ reliability. Most of the primary studies did not report them, we could not get them from emails to authors, and their substitution with the average reliability of studies that reported them is not a reliable approximation.
We corrected the study correlation to obtain an unbiased estimation of the slight negative correlations, Yi = ri + (1 − ri2)/(2*[ni − 3]) where ri = unattenuated correlation of study i. This follows equation 2.7 in Olkin and Pratt (1958), using UCOR in R.
We used Hedges (1989) to obtain an approximately unbiased estimate of sampling variance.
These figures allow to assess the global effect measure (global correlation or combined correlation) obtained by the H&S model (0.251, p value < .001) under random effects. Our estimate under random effects is the same estimation as that of Mackelprang and Nair (2010) obtained under the assumption of fixed effects and the correction by artifacts (attenuation factor A in Table 2 including the reliability of both the JIT practices and the performance constructs). However, the credibility interval is 1.4 times wider in random than in fixed effects under the same H&S approach (see Table 3). According to Kisamore and Brannick (2008), this wider interval means that uncertainty about the true magnitude of the effect size is higher under random effects than in fixed effects.
Global correlation according to fixed vs. random effects and H&S vs. REML approaches.
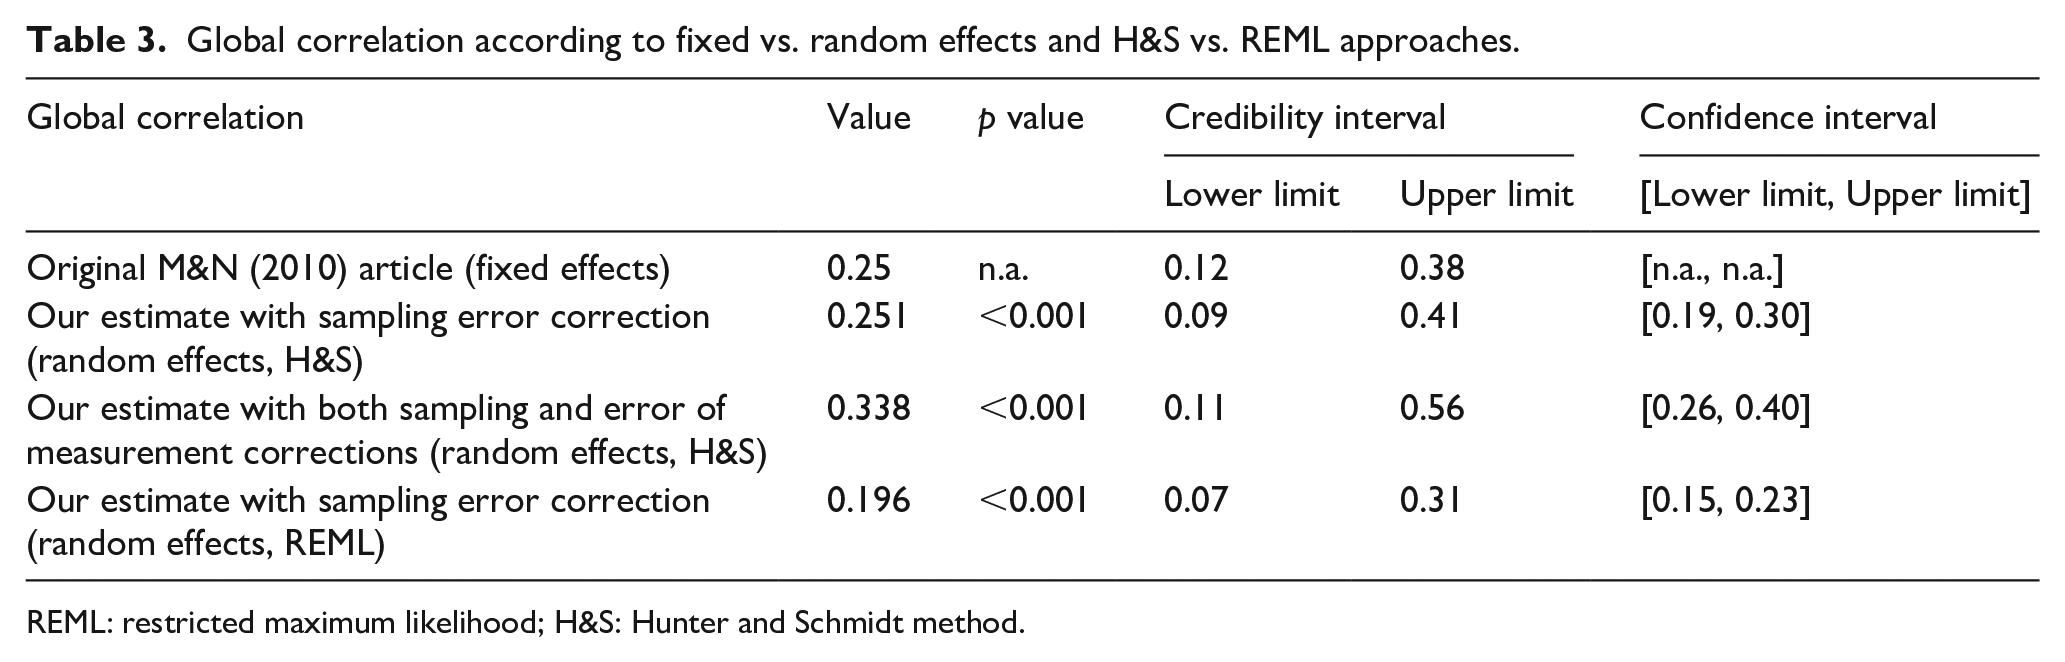
REML: restricted maximum likelihood; H&S: Hunter and Schmidt method.
A second issue is the approach used to estimate the credibility intervals and, consequently, the estimation of tau, the measurement of between-study variance. Veroniki et al. (2016) provided guidance on which estimation should be used based on the number of studies k, the total number of cases N, how much N varies across studies, and how big tau is. Their overall purpose was to choose the least biased estimator among the usual approaches available (e.g., DerSimonian-Laird, REML, H&S, Hedges, Empirical Bayes, among others). In particular, Veroniki et al. (2016), Novianti et al. (2014), and Viechtbauer (2005) advocate for the use of an REML estimation when the outcomes are continuous, as it is the current case. An additional issue refers to when meta-analysts should use confidence and credibility intervals (Whitener, 1990). Essentially, credibility intervals should be used to address the question of whether moderators are present. A different question is the accuracy of estimations within homogeneous (sub)populations, which should be addressed by confidence intervals. However, confidence intervals should not be used when there are serious doubts on the homogeneity of the population in terms of sampled studies. In heterogeneous samples, a correction for heterogeneity should be introduced (tau2) in the interval computation and this is introduced in the credibility interval.
As Mackelprang and Nair (2010) explained, researchers should use the standard error (SE) in mean correlation for homogeneous studies (SE = [1 − ȓ2]/[N − K]1/2; ȓ = corrected correlation; N = total sample size; K = number of studies). If moderators were operating, then the SE formula changes slightly to accommodate the residual variance (SDres in the observed correlations after the variance for sampling error has been removed). SDres should not be corrected, nevertheless, for other artifacts such as measurement error or range restriction because this SE only applies to sample-size-weighted mean correlations, not to the corrected correlations. Whitener (1990) strongly recommends to use credibility intervals to evaluate the potential existence of moderators, while confidence intervals should evaluate the accuracy of estimations within homogeneous (sub)populations. 2
The estimation under random-effects REML corrected by the same artifacts as the H&S approach is 0.194 (p value < .001). This REML approach under a random-effect assumption—inverse variance weighted instead of H&S sample size weighted—is currently preferred in clinical research (Sidik & Jonkman, 2007). In past decades, DerSimonian-Laird was the most common choice just because it was implemented in the main computer programs (Veroniki et al., 2016). Virtually, all the family of moments estimation methods are non-iterative, however, with the exclusion of Paule and Mandel’s (1982). By contrast, the family of maximum-likelihood estimators are iterative, which increases the accuracy of the estimation. Consequently, the suitability of using artifact correction and REML to improve estimation accuracy is evident. We should note that the 95% credible interval (0.07, 0.31) is higher than that obtained (0.12, 0.38) by Mackelprang and Nair (2010). Our credibility interval is reached with the metafor package of R (Viechtbauer, 2010), whose algorithm is a modification of the method suggested by Higgins et al. (2009) to calculate the prediction interval. The difference observed between both intervals may be due to our choice of random effects instead of fixed effects, and also to the different weighting methods both approaches use. The use of fixed effects assumes that the effect is distributed in the same way in all the studies or, to put it simply, that the population is the same across samples. This represents a controversial assumption given our later results on moderating variables (Figure 1). The choice of random effects, however, does not presume this assumption, so it probably reflects reality better. Despite this higher interval, the fact that it does not contain the 0 value reinforces the positive relationship between JIT and business performance, although the 0.19 estimate of effect size is lower than the 0.25 original estimate in Mackelprang and Nair (2010). These choices affected how heterogeneity was evaluated, since the estimation of tau differs in both approaches.
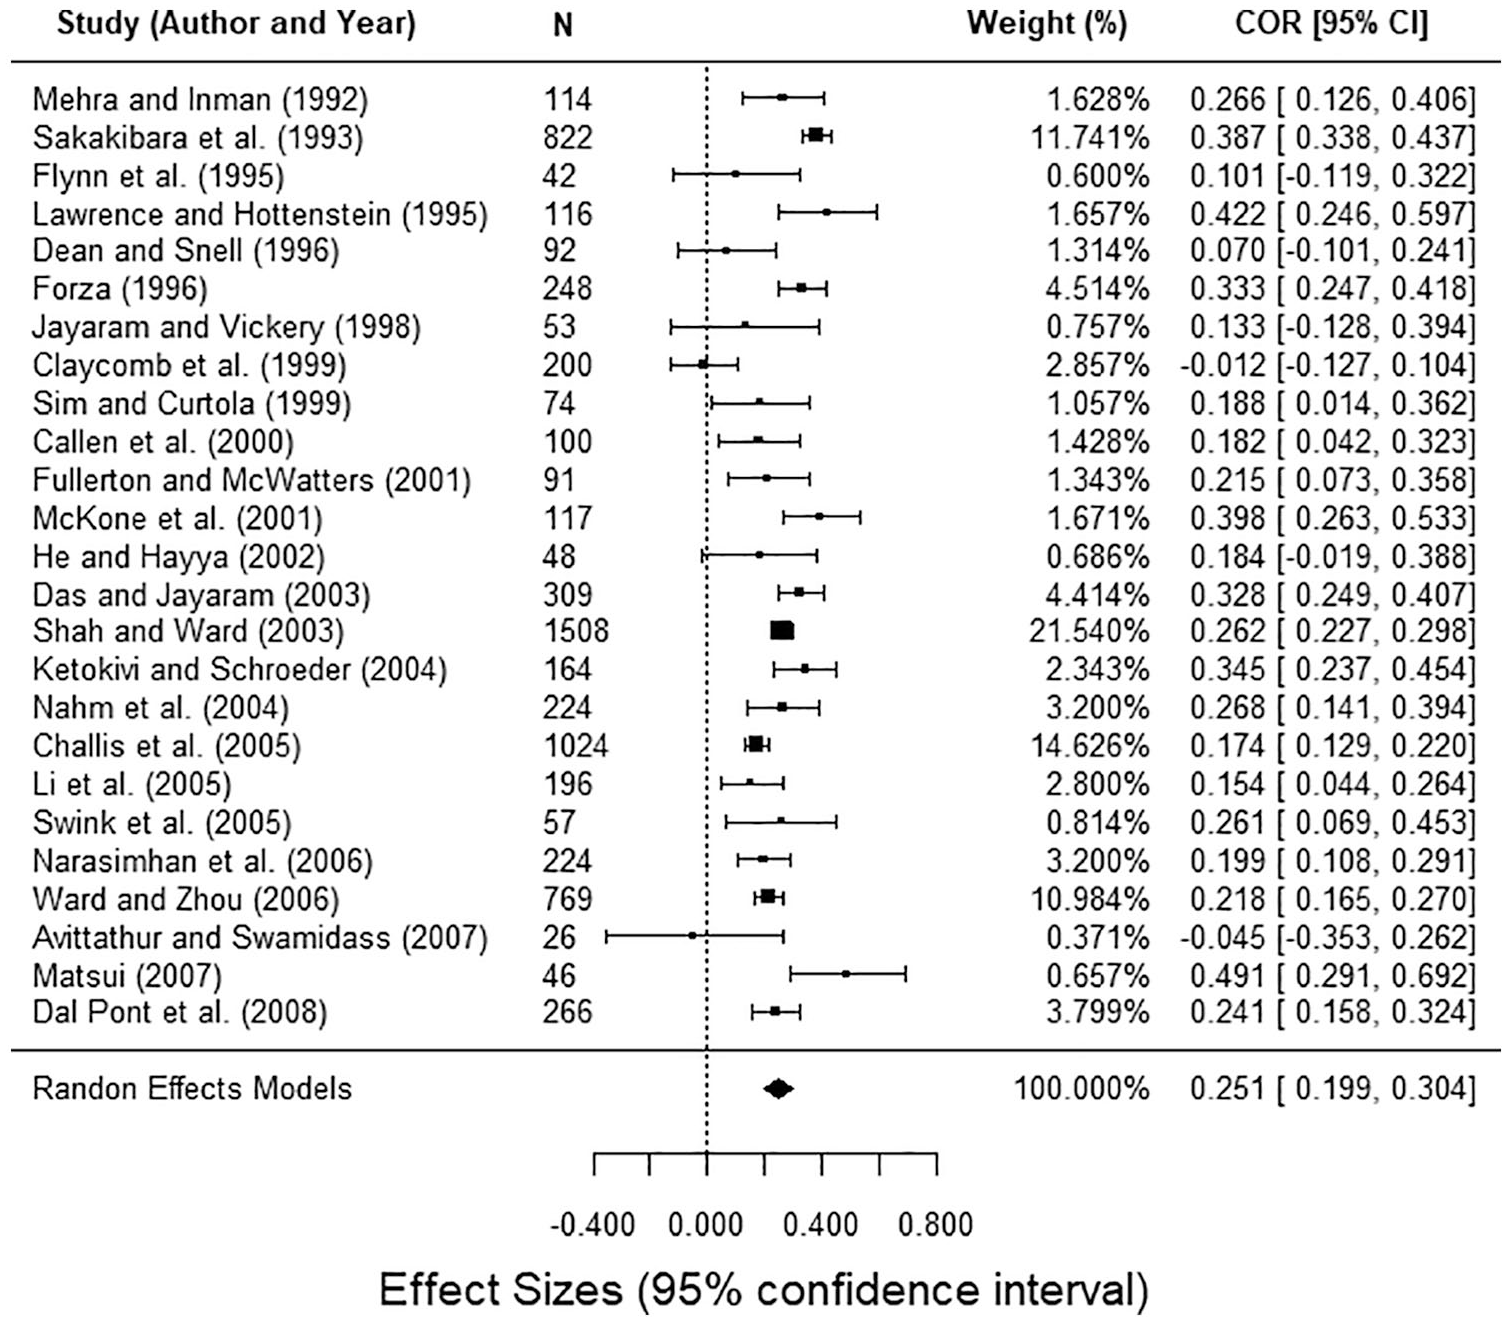
Forest Plot under random-effects model and H&S approach with sampling error correction.
Finally, it is worth acknowledging that the variety of statistical software to perform MAs could also become a source of differences. In the H&S approach, the size of each study is the weight to synthesize the results, whereas in the C&H approach, it is the inverse variance. This approach of inverse variance is directly implemented for instance in the meta-essentials package for spreadsheets (Suurmond et al., 2017). It is applied with an additive between-studies variance component based on the DerSimonian and Laird (1986) estimator in the random-effects model. These types of choices may lead to different estimations that, occasionally, may entail different conclusions in terms of heterogeneity and the potential presence of moderators. Anyway, there is a risk in using non-iterative approaches such as the meta-essentials implementation, since spreadsheets are not meant to conduct estimations iteratively. Therefore, researchers cannot choose among the variety of methods to estimate the residual heterogeneity, a feature that is implemented in open-source software R in the metafor package. Similarly, the estimation of heterogeneity is another source of differences between C&H and H&S. The lack of normative standards in business management is one of the major differences when compared to clinical research. Scholars and reviewers do not, therefore, know exactly what approach should be chosen for each case, despite the great number of reviews published in methodological journals. We simply replicated the study of Mackelprang and Nair (2010) and chose to evaluate heterogeneity further; our goal was to show the extent to which results could differ, while acknowledging simultaneously that the potential routes a scholar may follow could be very varied.
Reporting of results
In this stage, one of the main contributions of clinical research to the field of management is the use of forest plots (see Figure 1) instead of tables. They allow to see both the amplitude and the variability of the effect measures (of each study and the global effect) in a single diagram, and also spark the possibility of moderating effects when many articles have a 0 in the confidence interval. In addition, organizing the articles ascending by year facilitates the detection of possible temporal patterns. Thus, in Figure 1, all studies are listed by year, N indicates the study’s sample size, the bar width is the 95% confidence interval of each study’s correlation, and the studies’ weights follow the H&S approach (in this case, only corrected by sampling error, since the lack of information in primary studies does not allow for any correction for error of measurement).
In the original study, Mackelprang and Nair (2010) include several tables, being very profuse in the detailed MA of the impact of various operative variables on performance (e.g., daily schedule adherence, use of a “pull” system, preventive maintenance, Kanban . . .). Since their goal was an MA of the impact of all those JIT practices on performance, the usual restrictions on paper length probably constrained their capacity to use many graphics. On the other hand, Figure 1 (created with the same data) allows observing the effect that the small sample size has on the accuracy of the estimates, without indicating any particular temporal pattern.
Goodness of fit: analysis of publication bias, heterogeneity, and sensitivity
Once the global correlation is estimated, the next step is to evaluate the goodness of fit to determine the validity of the MA. This evaluation, essential in any quantitative study, is usually ignored in management research MAs. The goodness of fit of the measurements is determined by analyses of publication bias, sensitivity, and heterogeneity.
Publication bias
This analysis determines the validity of the literature review and, consequently, its replicability. We assess the existence of publication bias using a funnel plot (Figure 2). It evaluates whether journals mainly publish papers that contained a significant effect while rejecting to publish non-significant effects. In figure 2, we included the expected triangle under a normal distribution and, with slashed lines, we showed the triangle resulting from the contour-enhanced funnel plot, depicted alone on the right. The right one distinguishes the publication bias from other causes of asymmetry (Peters et al., 2008). The internal white area includes studies with correlation significance above .05 and up to 1.00; it is above .01 and below or equal to .05 in the dark gray area, and equal or below .001 in the clear gray area. Since the graph on the left is not totally symmetrical, it could indicate a certain publication bias; however, the asymmetry regression test does not yield a significant result (t = −0.915, df = 23, p = .370). Furthermore, the contour-enhanced funnel plot on the right shows that most of studies are dropped in the white area. Therefore, we cannot confirm that publication bias exists. To put it simply, there is no evidence that the articles published in this topic were only including studies that have detected significant correlations. The result in itself should not be surprising since Mackelprang and Nair (2010) did include studies that had found both significant and insignificant correlations, as recommended by Kepes et al. (2012, 2013).
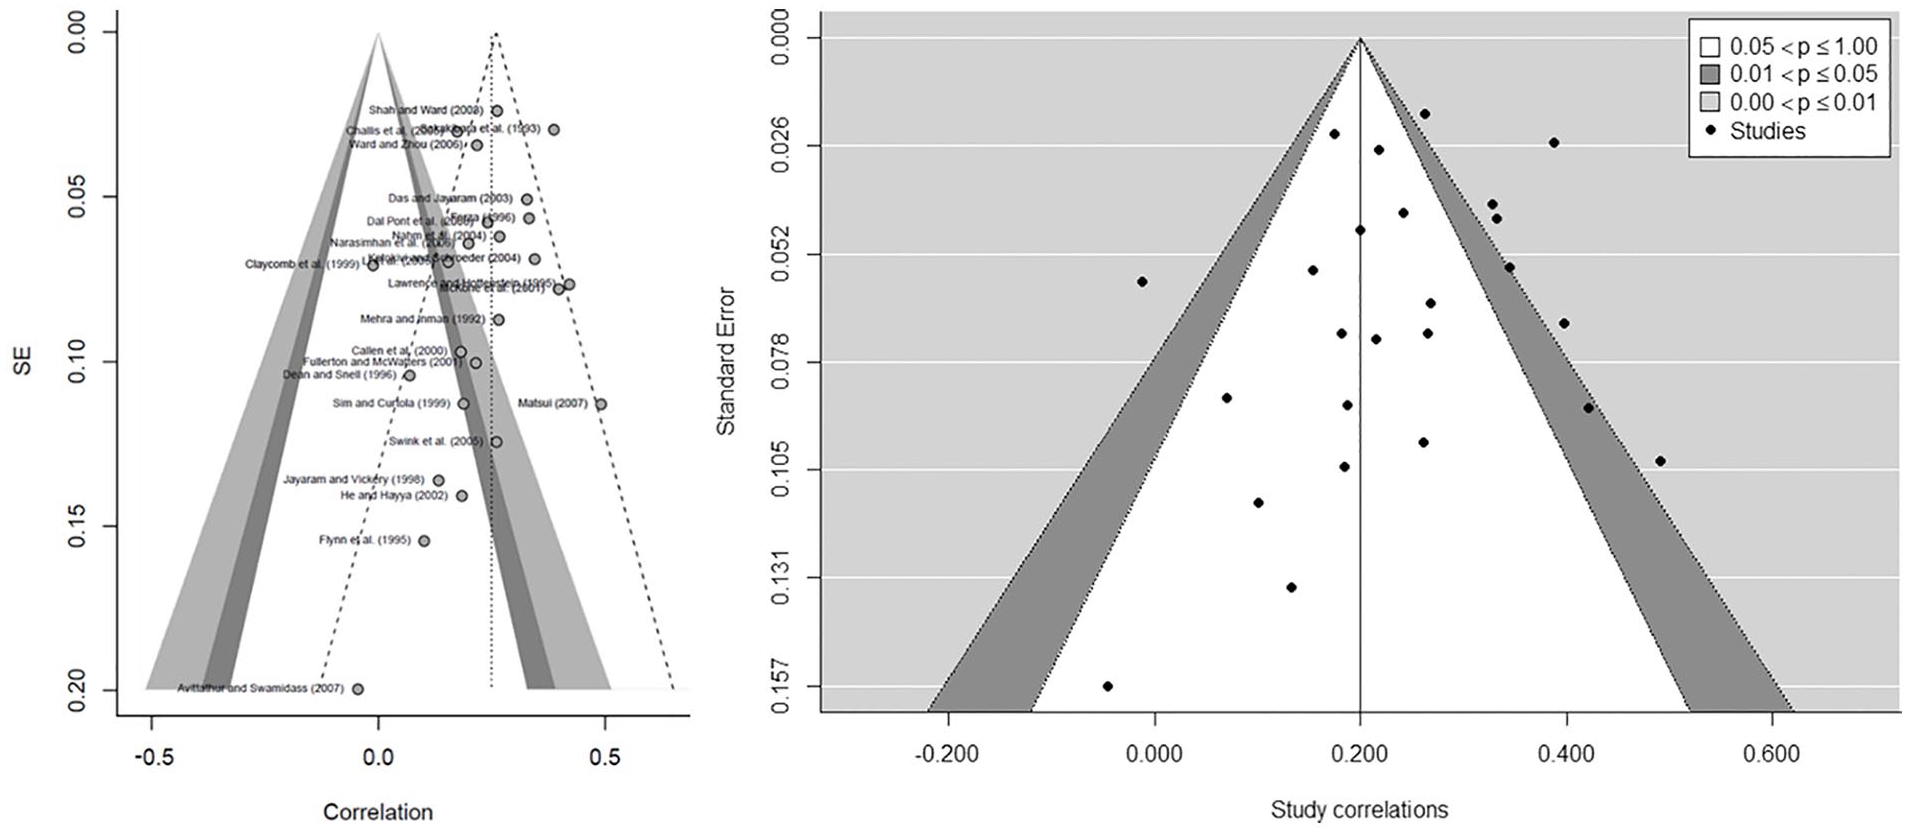
Assessing the existence of publication bias: funnel plot (left) and contour-enhanced funnel plot (right).
Sensitivity analysis
Aguinis et al. (2011a) reported that only 16% of management research MAs performed a sensitivity analysis. Mackelprang and Nair (2010) did not perform one. Viechtbauer and Cheung (2010) suggested up to eight plots to assess the potential influence of each study on the overall results. These plots are implemented in R metafor package, which includes externally studentized residuals (rstudent), difference in fits (DFFITS), Cook’s distances, covariance ratios, leave-one-out estimates of the amount of heterogeneity, leave-one-out values for the test statistics for heterogeneity, hat values, and weights (Figure 3). Thresholds are depicted with dotted lines, whereas slashed ones are used for the average of the metric. The cases identified as potential influencers in any graph are depicted in red in all of them. To evaluate the impact of this influence, we compared the results using leave-one-out analysis. Since we found that none of them influenced the results significantly, they remained in the MA. However, it was possible that the results could have been affected, and their interpretation could have, therefore, changed. It would be useful for the MAs, accordingly, to indicate whether this particular verification has been done.
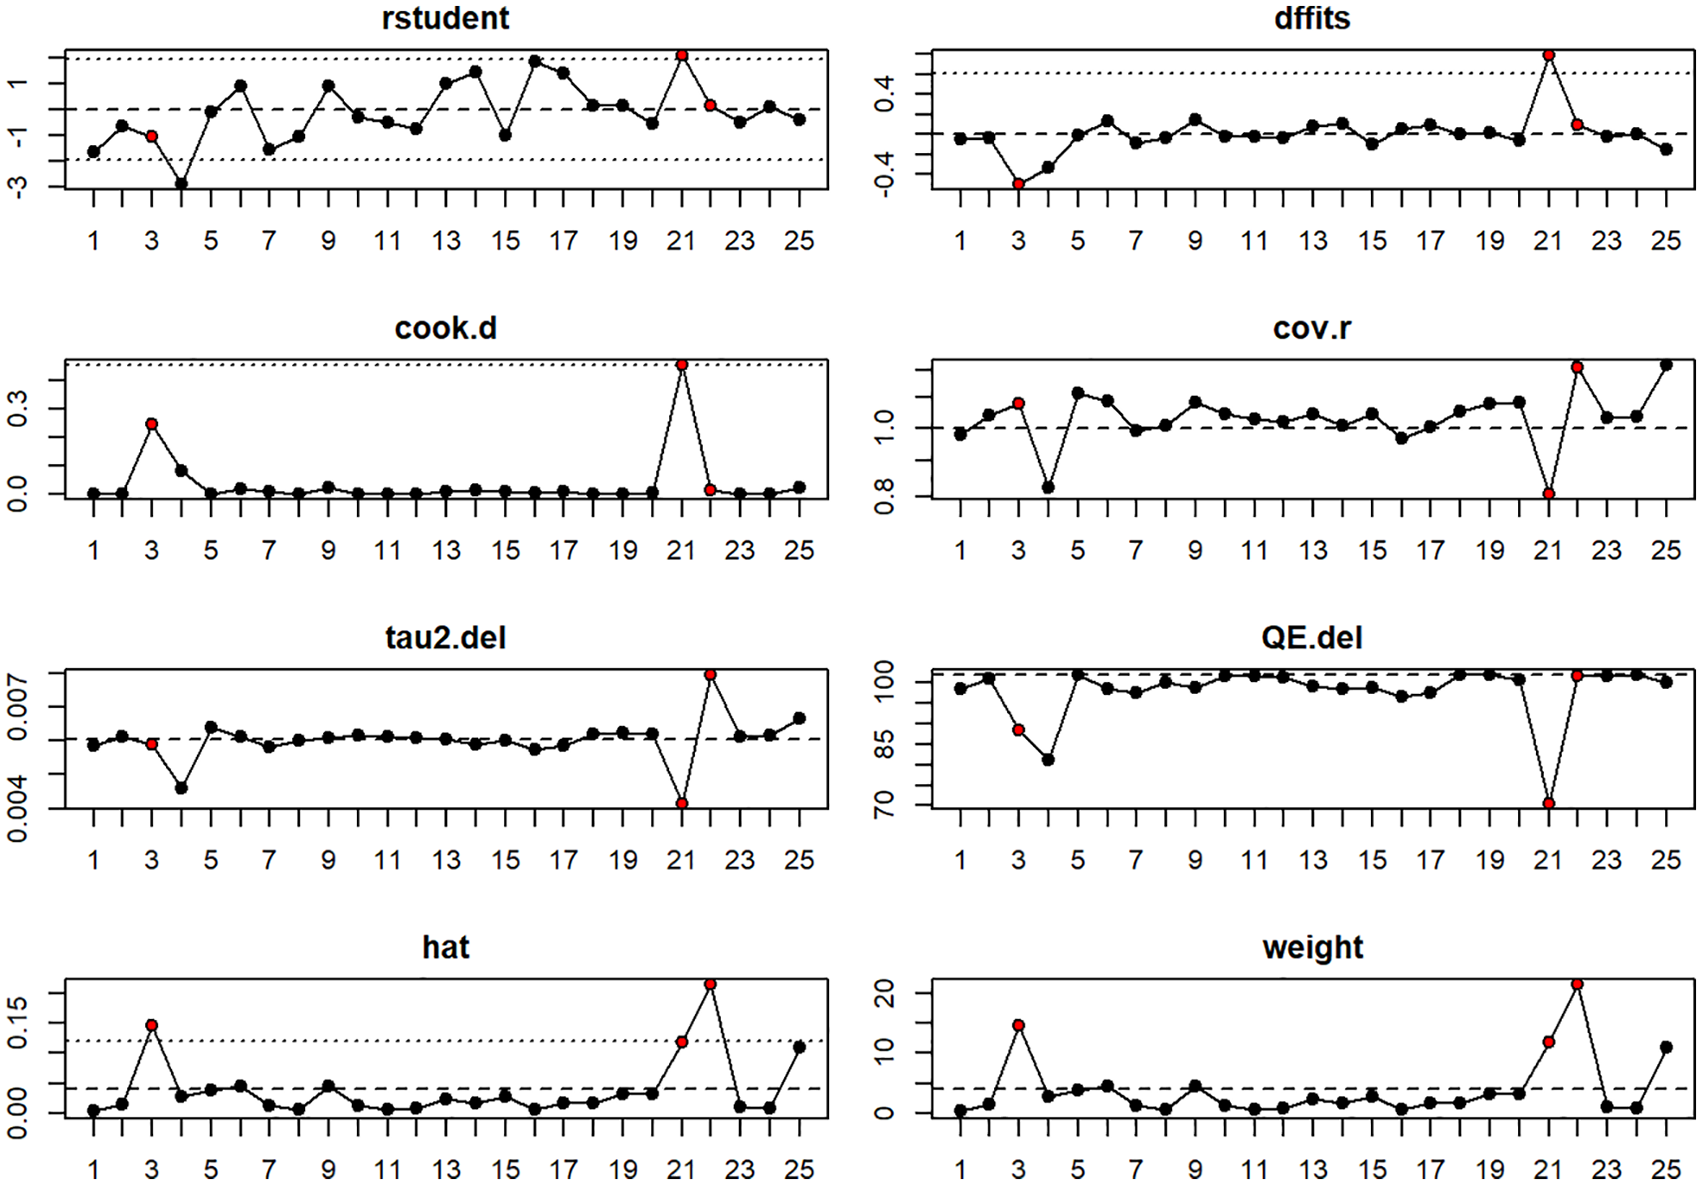
Example of plots for sensitivity analysis.
Heterogeneity analysis
Finally, we performed a heterogeneity analysis. Along with the H&S method’s usual Ratio2, we incorporated two additional parameters typical of clinical research: I2 (total variability due to heterogeneity) and H2 (total variability/sampling variability; Table 4), as Higgins and Thompson (2002) have defined them. The main weakness of the H&S method is found in the detection of heterogeneity. In fact, even Hunter and Schmidt (1994, p. 335) argue “against excessive confidence in the chi-square significance tests.” In that paragraph, they also stated that “The 75 percent rule has been widely misinterpreted. [ . . . ] If the number of studies in the meta-analysis is small, there is sampling error in the observed variance of sample correlations, that is, second-order sampling error (Hunter & Schmidt, 1990, Chapter 9). Thus, by change, the observed value of Var(r0i)–i.e. the variance of uncorrected correlation– may be larger than that predicted by the sampling error variance formula.”
Heterogeneity test.
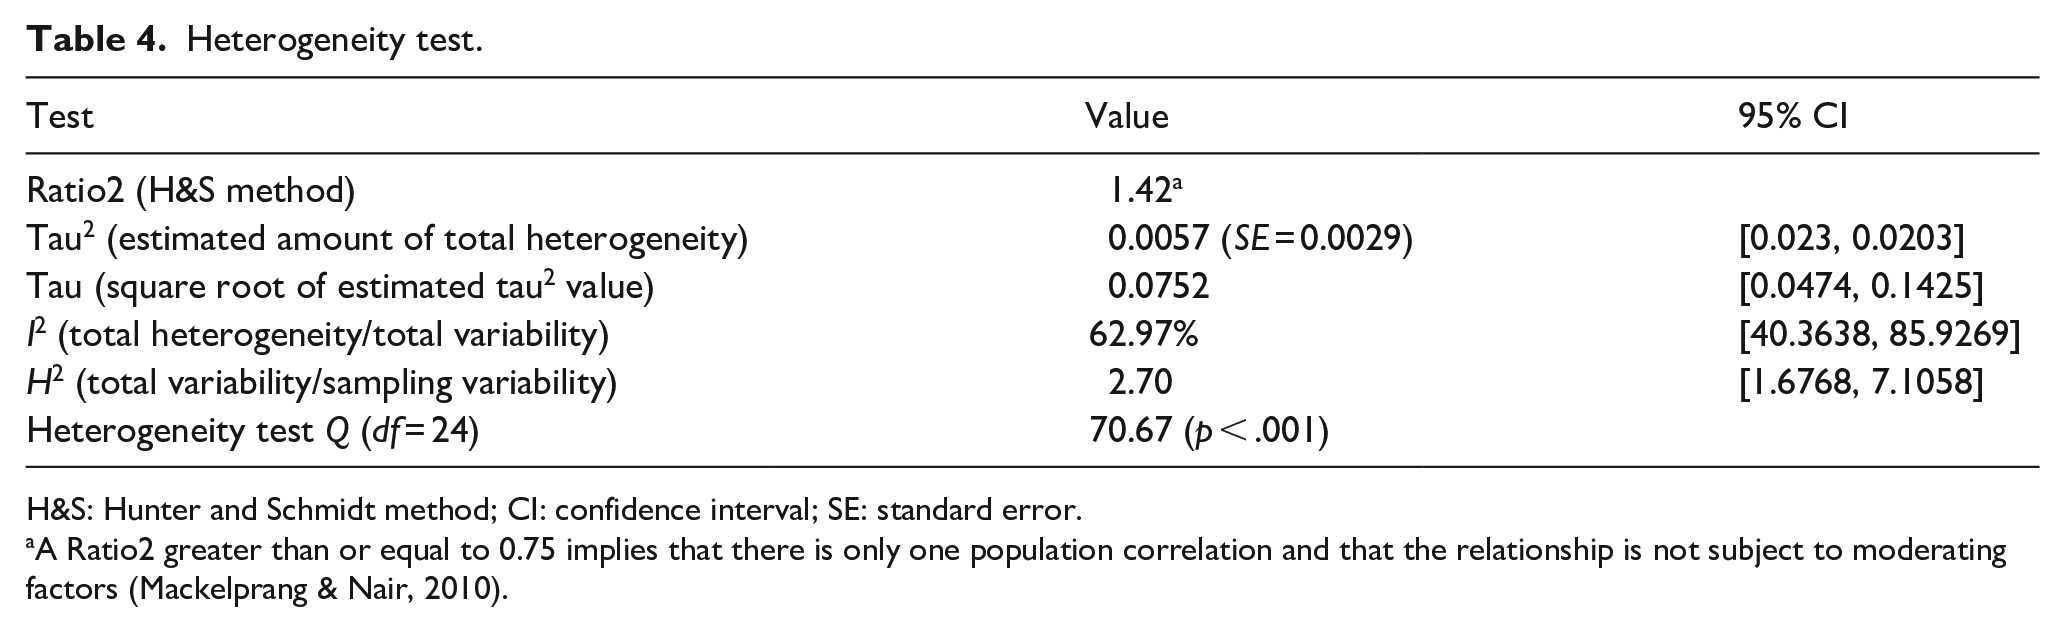
H&S: Hunter and Schmidt method; CI: confidence interval; SE: standard error.
A Ratio2 greater than or equal to 0.75 implies that there is only one population correlation and that the relationship is not subject to moderating factors (Mackelprang & Nair, 2010).
We confirmed this in the following case: if we had only considered the Ratio2 value (1.42), we would conclude, as Mackelprang and Nair (2010) did, that there is no heterogeneity between studies (i.e., all variability is explained by sampling error) and it would not be necessary to assess the influence of possible moderators. In this case, the difficulty faced by the authors was that they followed the widespread practice in the management field of using chi-square-based tests (Geyskens et al., 2009), the result of which indicates the absence of heterogeneity. Abreu-Ledón et al. (2018) triangulated this possibility in their MAs on the impact of lean production on firm’s performance, and, in fact, after using the Ratio2, they performed partial meta-regressions by using sector, time, and the country’s level of economic development as potential moderators. Thus, triangulation will yield a more holistic perspective of potential heterogeneity.
By contrast, the I2 index shows that the percentage of unexplained variance in the global effect measure is 62.97% and the H2 is greater than 1.5 (2.7). Heterogeneity is consequently high (Higgins & Thompson, 2002). In addition, the upper limit of the confidence interval is very high, indicating that a large part of the heterogeneity is due to actual differences in the studies, rather than to sampling error. The possible moderators are tested next.
Post hoc analysis: identification of potential moderators
Geyskens et al. (2009) recommend the evaluation of potential moderators even if some of the heterogeneity ratios seem to preclude their existence. Because Mackelprang and Nair (2010) followed the H&S method, they could not have done anything further, and consistent with the Ratio2 result, they did not evaluate possible moderators. This highlights again the problem arising from the fact that H&S is the most widespread method in management. In this regard, the authors were consistent with their initial objective of evaluating the impact of JIT management variables on performance. In addition, their approach was also consistent with the results of the heterogeneity test. Therefore, their results guided their decisions and there was no reason to choose another path, despite the low power of this test and the fact that they used a single test (Chowdhry et al., 2016; Sangnawakij et al., 2017). It is worth noting that there are additional tests of moderating effects and there is a general recommendation to evaluate potential moderators even when an initial test such as Ratio2 may point to homogeneity across studies (Aguinis et al., 2011a, 2011b; Geyskens et al., 2009).
To illustrate some potential moderators, we decided to evaluate some of the most common control variables in the lean manufacturing literature: firm size (large vs. others), sector (machinery, electronics, and automotive [MEA] vs. others), and country (United States vs. others), which is consistent with the variables tested by Abreu-Ledón et al. (2018). The results allow us to determine whether any of these factors influence the relationships (Table 5). To conduct this analysis, Mackelprang and Nair (2010) would have needed to codify additional characteristics of the primary study samples, which are aspects that do not always appear as control variables in the statistical analyses of these studies. As explained above, seven studies had no information about the firms’ size, and we were unsuccessful in obtaining the missing information from our effort to contact authors.
Meta-regression analysis with potential moderators.
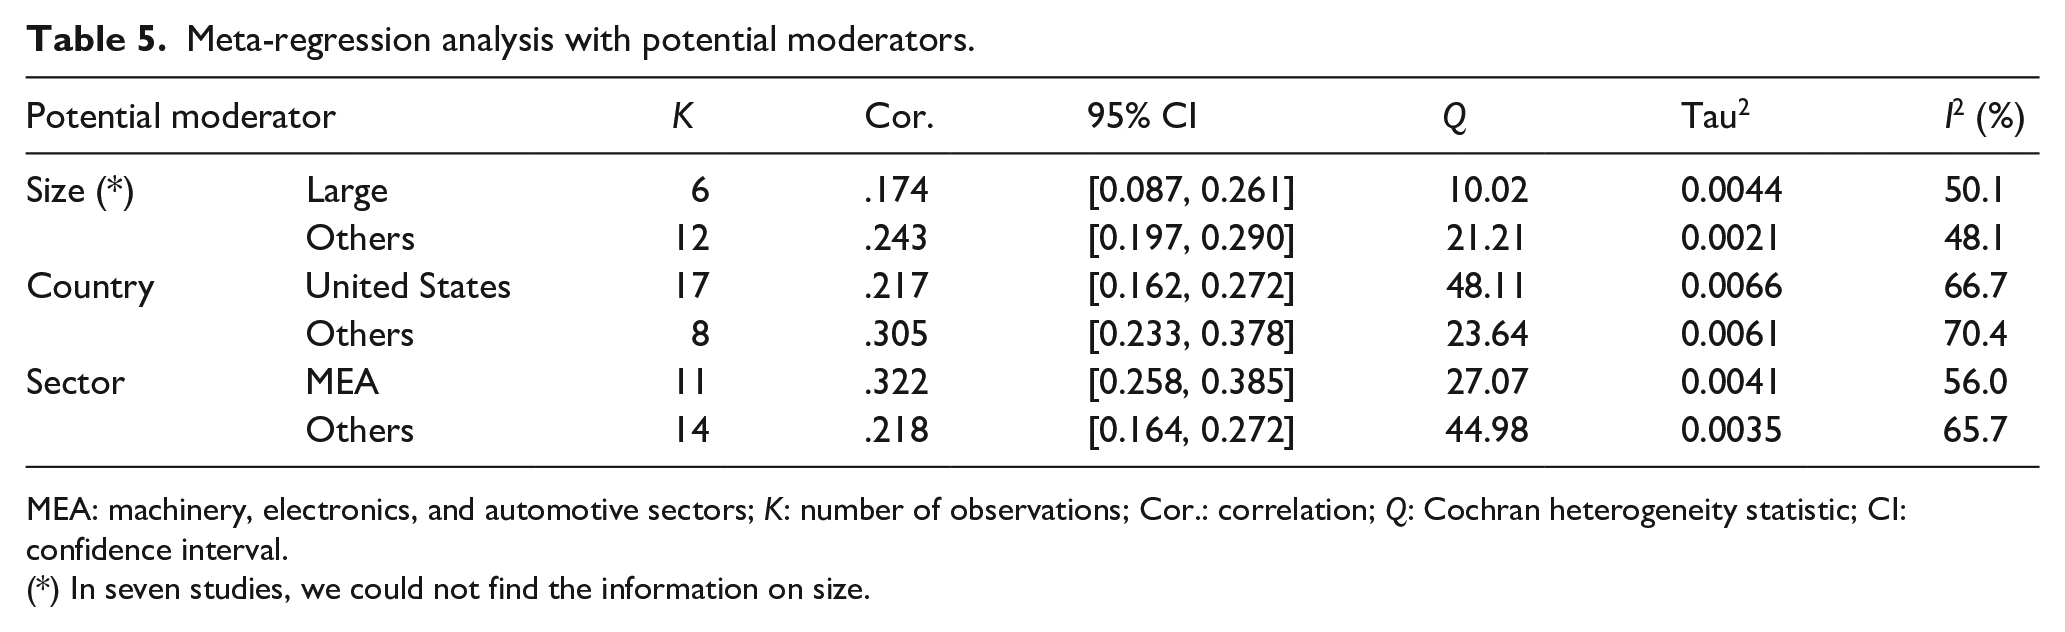
MEA: machinery, electronics, and automotive sectors; K: number of observations; Cor.: correlation; Q: Cochran heterogeneity statistic; CI: confidence interval.
(*) In seven studies, we could not find the information on size.
We verified that the sector is the only moderator with an effect on the relationship between JIT and performance, QM (df = 1) = 6.09, p < .05, according to the Raudenbush’s (1994) method. The QM stands for the Q statistic of model sum of squares (Lipsey & Wilson, 2001), which follows a chi-square distribution with p − 1 degrees of freedom, p being the number of predictors in the model. It tests whether at least one of the regression coefficients (not including the intercept) is different from 0. In fact, heterogeneity (I2) decreases from the global 62.9% (see Table 4) to 56.0% (Table 5) in the MEA sector, when sector is introduced as a potential moderator. However, the “others” sector continues to maintain a relatively high degree of heterogeneity (I2 = 65.7%). Thus, the effect is higher in MEA than in other sectors. Neither size nor country was detected as moderators, however. The correlation between JIT and performance in the MEA sector (0.32) is 28% higher than the global average previously obtained (0.25), while that correlation value falls to .21 in the “others” sector. The impact of JIT in the MEA sector is, therefore, 46% higher than that in other sectors, which corroborates the previous results. This could be due to a wider use and tradition of lean tools in these sectors. Regarding firm size and country, they do not have a significant moderating effect on the relationship between JIT and performance (pvalsize = 0.056 and pvalCountry = 0.057). This could mean that the relative improvement on performance that can be attributed to JIT practices does not depend on the firm or where (country) its facilities are located. Figure 4 presents further detail, as it displays a forest plot by sector (MEA vs. other sectors).
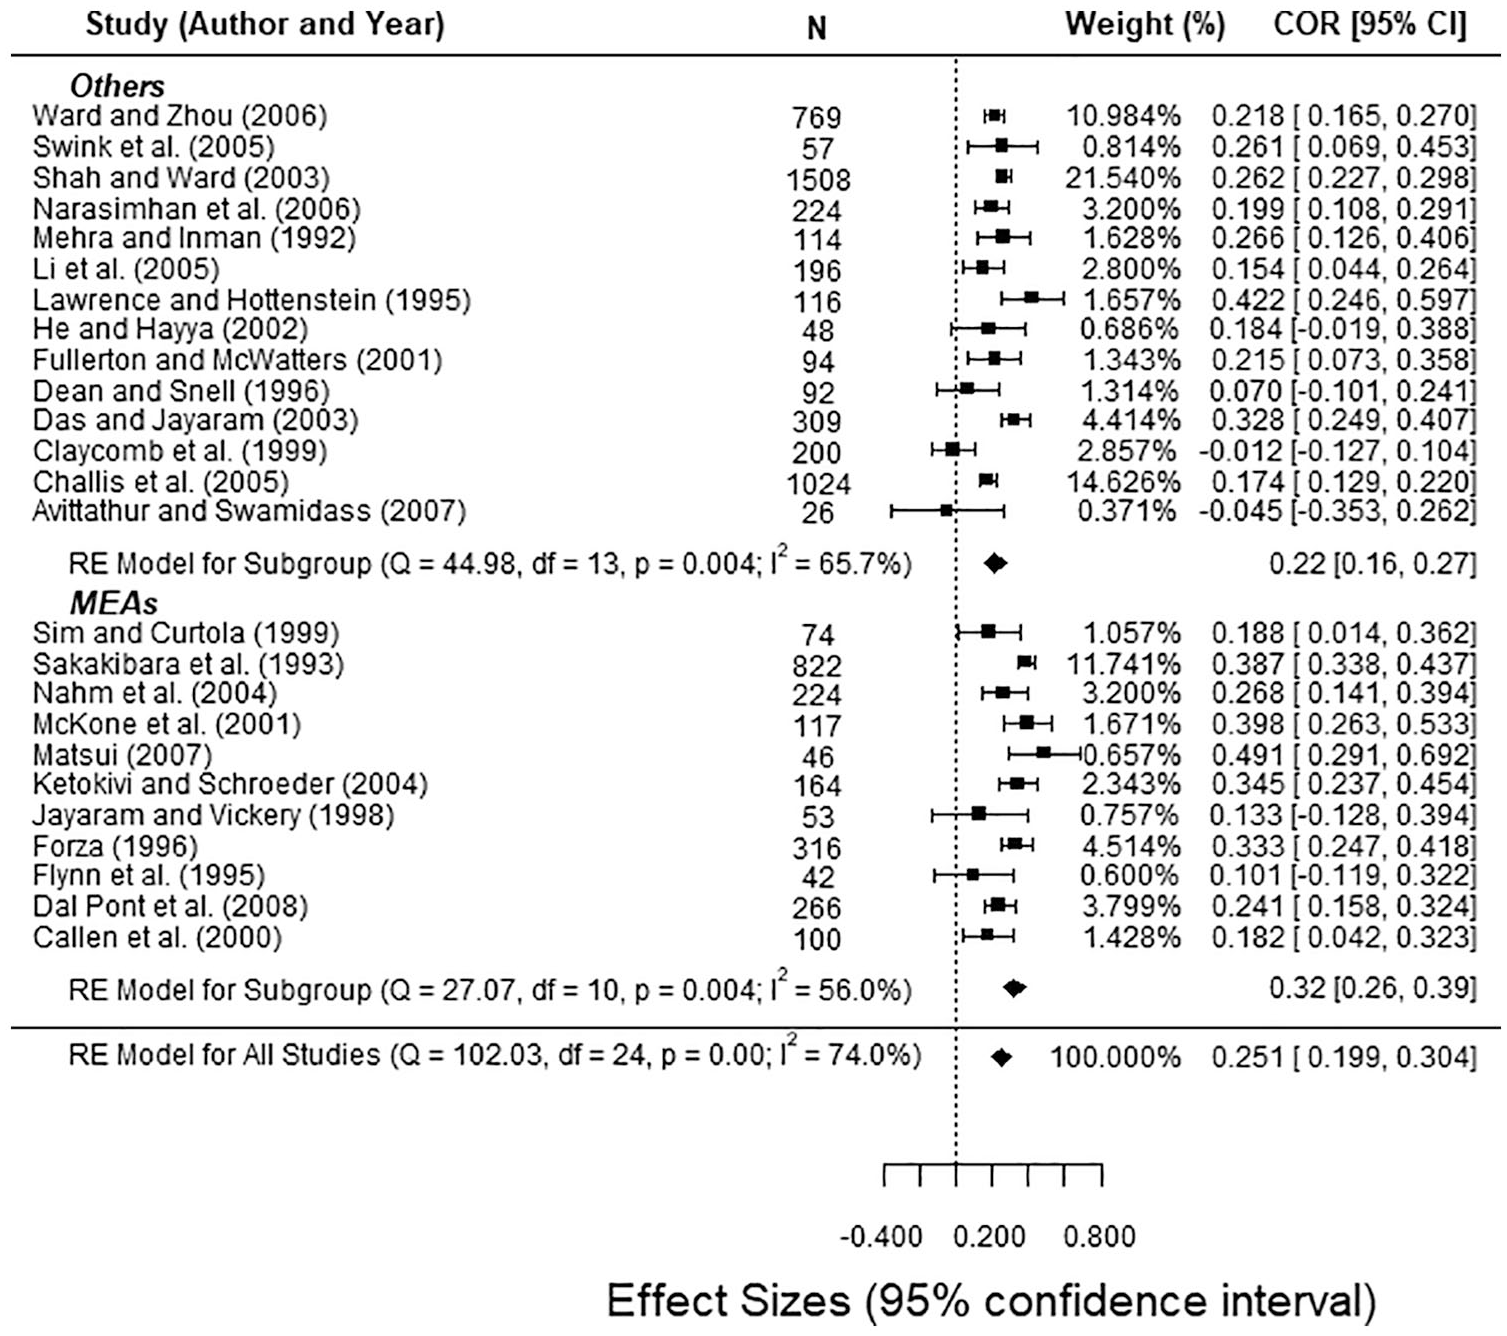
Forest plot with combined correlations for MEAs vs. other sectors.
It is worth citing the research of Abreu-Ledón et al. (2018) to illustrate, and to warn, about how the stratification of the data can affect the findings. Contrary to our results, they found a significant moderating effect with country but not with the sector. This could happen because they compared manufacturing vs. services sectors, causing mixed effects in the case of the aggregation of manufacturing in a single sector. Similarly, these authors used the country’s economic development as a moderator, while we decided to classify countries into two groups (United States and others). Be as it may, when there is evidence in other studies, this reflection recommends to perform a moderator analysis even in those cases where a statistic is signaling in the opposite direction.
Conclusion: recommendations and “good practices” for MAs in management
Our “background” section has identified different weaknesses in management MAs compared to MAs in clinical research (or H&S vs. C&H) in two ways: some are related to primary studies, due mainly to a lack of information needed, and others are due to non-correct MA execution. The case study, in turn, shows how the analysis of a relevant management MA could change if clinical research procedures were followed. There is, therefore, a wide space for several improvements in management research MA that goes beyond statistical considerations: from data collection to information reporting, including the use of MAs as a means of generating new hypotheses. Particularly, we verified the lack of data in primary studies, as well as the fact that there are no normative standards to collect information or for the subsequent assessment of MA quality. Furthermore, the lack of reporting standards diminishes the credibility of these studies among scholars and their usefulness for managers, workers, or policy makers. In fact, our analysis has showed the simplicity of detecting moderating effects that can lead to new working hypotheses.
These arguments call for the need to avoid ambiguity in management research MAs. Authors, reviewers, and specially editors need to develop a set of good practices for the correct execution and reporting. Figure 5 illustrates a summary of the five-step process that should inspire this path. The first stages are fundamental for any study with a systematic literature review, as any aggregating study will only be as good as the primary studies on which it is based. Similarly, an MA tends to be more useful the better authors can communicate results. From this point of view, scholars should avoid an excessive use of tables and rely more on illustrative graphics, as in clinical research (e.g., a forest plot organized by the publication year or a funnel plot to evaluate publication bias).
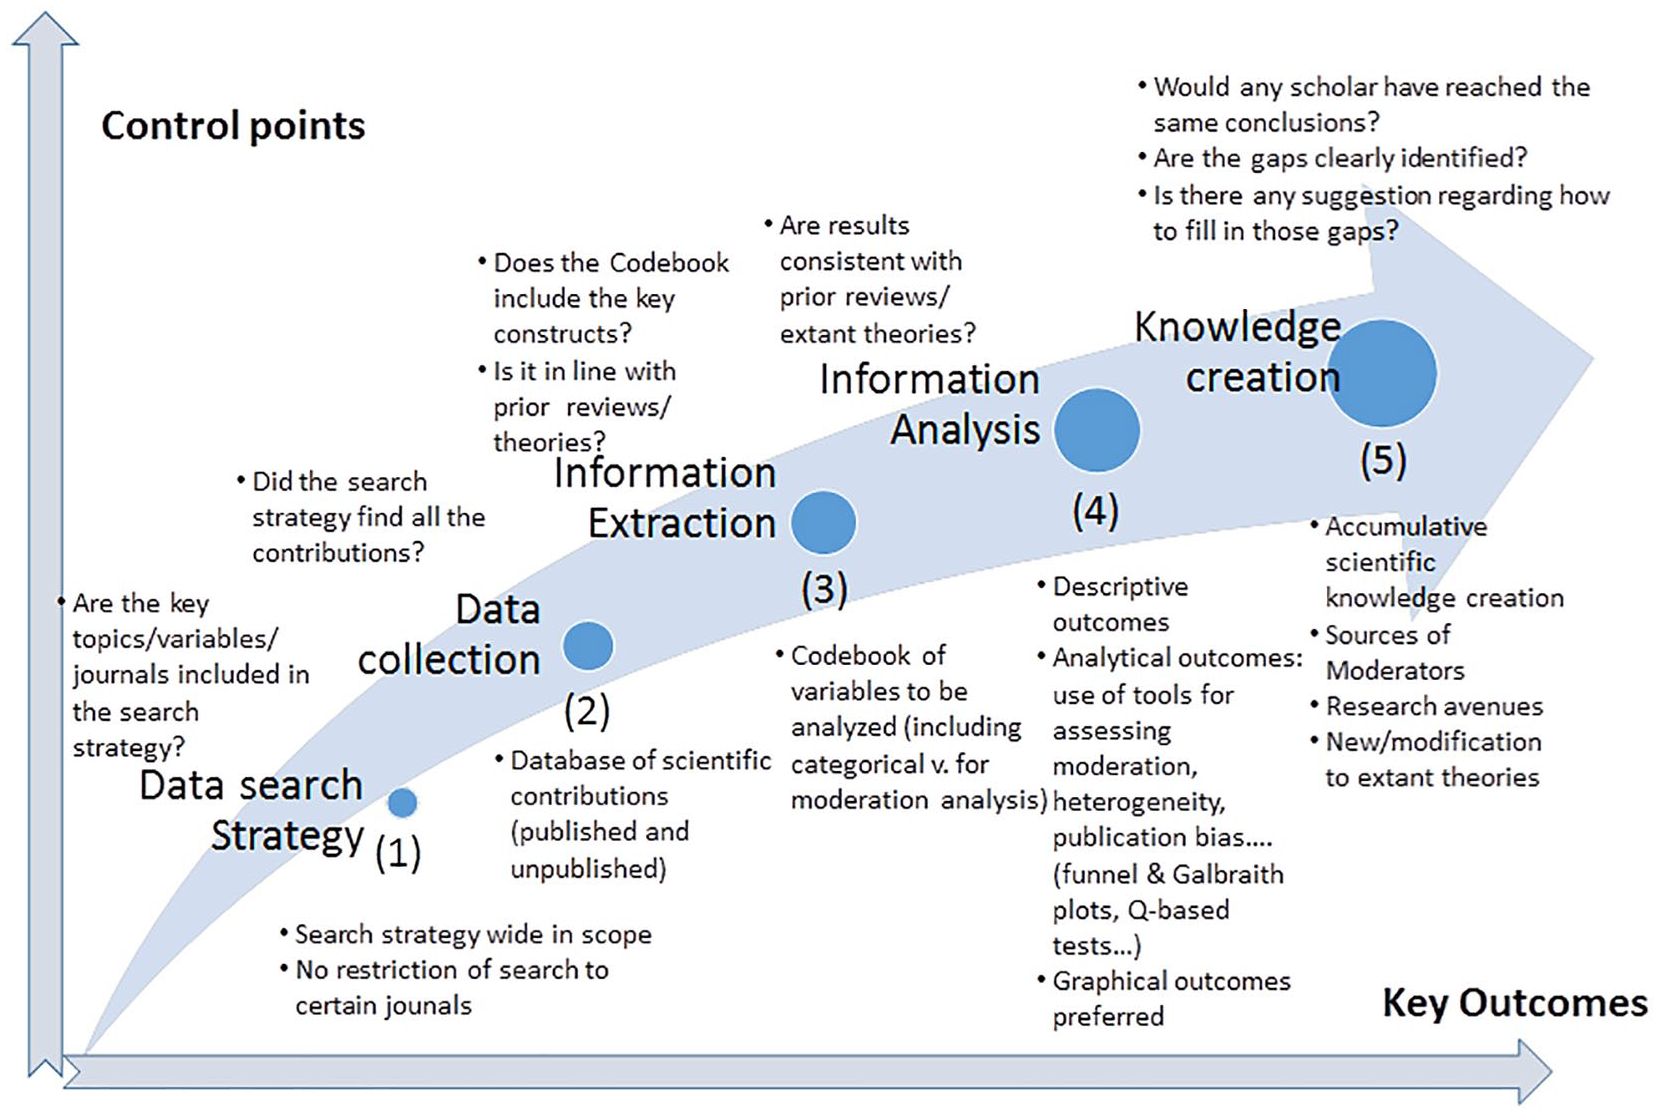
Roadmap for conducting MAs in management based on lessons learned from the clinical research field.
Table 6 summarizes the main challenges (areas of improvement) in conducting a management research MA for each step in the process illustrated in Figure 5. It provides a comparison with the current status in clinical research analysis and ends with a series of recommendations aligned with previous studies (e.g., Aguinis et al., 2011a; Marin-Garcia, 2015).
Areas of improvement for MAs in management and recommendations from clinical research MAs.
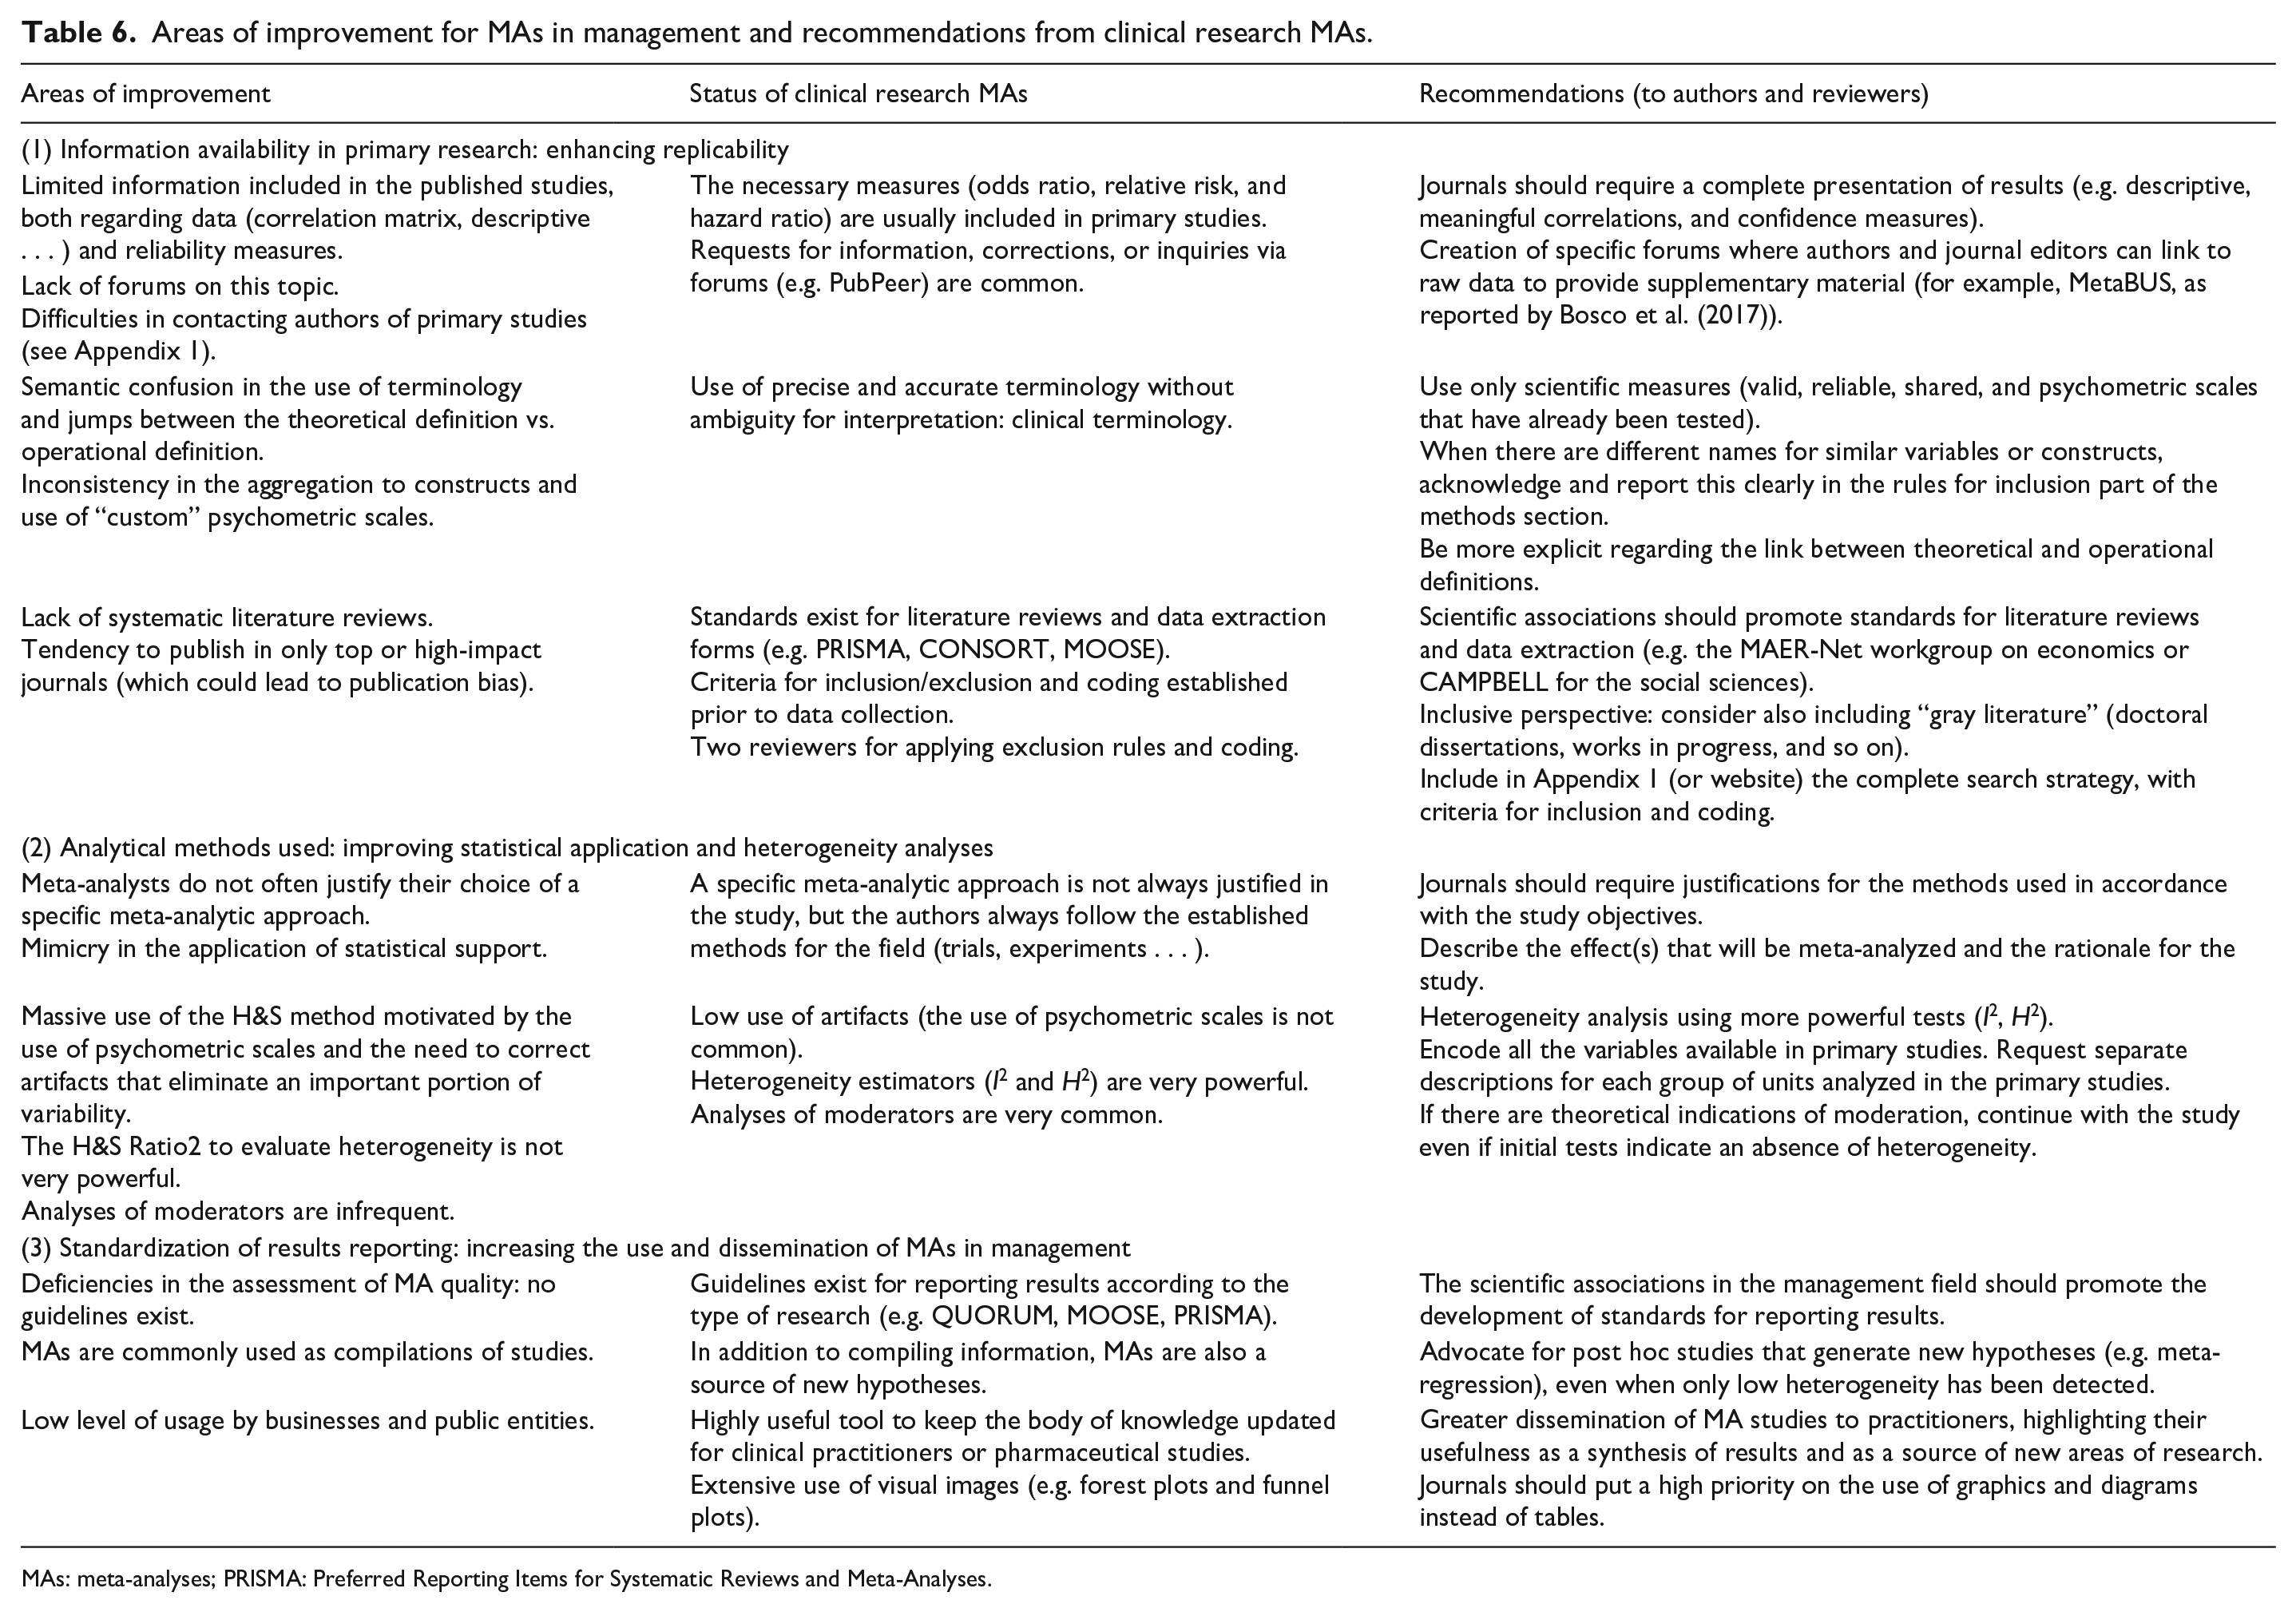
MAs: meta-analyses; PRISMA: Preferred Reporting Items for Systematic Reviews and Meta-Analyses.
The adoption of these practices can help other agents out of academia to use the results of management research MAs more frequently. The estimation under REML rather than H&S will yield more accurate estimations of effect size, while the reporting of figures and the triangulation of heterogeneity with additional estimators will offer additional insights on potential moderators. This will enable firms and public policy makers to apply more fine-grained strategies and policies. On one hand, these good practices allow a more efficient analysis since they synthesize (and weigh) all the previous analyses on a certain topic. On the other hand, they allow considering certain key moderating factors, with a large number of studies, which perhaps the previous studies did not address.
With this background, implicitly, our article not only offers several arguments to explain why the use of MAs is not as widespread in management as in other scientific areas but also provides direct evidence of the consequences that current flaws in their execution and reporting cause. All agents involved in the publication process should, therefore, put more effort into adhering to certain work standards and bring transparency and credibility to the studies we carry out and publish.
Footnotes
Appendix 1
Declaration of conflicting interests
The author(s) declared no potential conflicts of interest with respect to the research, authorship, and/or publication of this article.
Funding
Our work has received financial support from the Spanish and the Galician Governments through grants ECO2016-76625-R and ED431C 2018/46, respectively. Miguel González-Loureiro acknowledges support of Portuguese national funds from FCT – Fundação para a Ciência e Tecnologia through project UIDB/04728/2020.