
Abstract
Introduction. The burden of severe acute malnutrition (SAM) remains unacceptably high worldwide. The burden of Tuberculosis (TB) co-occurring with SAM in under 5 children is a significant focus for the improvement of child health. The co-existence of these diseases are significantly enhancing the associated morbidity, mortality, and hospitalization costs among this population. Objective. To determine survival status and predictors of TB development in under 5 children with SAM in Asella Referral and Teaching Hospital, Ethiopia. Methods. A retrospective cohort study was done in 247 under 5 children with SAM between January 01/2018 and December 31/2022. Systematic sampling technique was used to select the study participants. Data extraction format was used to collect data from the patient’s medical chart. EpiData version 4.6.0.6 was used for data entry and exported to STATA version 14.2 for statistical analysis. Result. This study includes 247 under 5 children with SAM with a response rate of 100%. Regarding to the survival status; 24(17%) of under 5 children with SAM have developed the events (TB) and the rest of them, 205(83%) were censored. The incidence density rate (IDR) of TB in under 5 children with SAM was 45.51 per 100 (95% CI: 33.63, 61.58) children-months observation. The cumulative incidence of TB was 17% (95% CI: 12.79, 22.25). Multivariable Cox proportional hazard analysis revealed that: having a history of TB contact (AHR = 5.56, 95% CI: 2.77, 11.15, P-value = .000), having a history of bottle feeding (AHR = 4.95, 95%CI: 1.08, 22.77, P-value = .040), did not take F100 (AHR = 1.71, 95% CI: 1.12, 7.25, P-value = .00) were statistically significant predictors of TB development. Conclusion. This study shows that the IDR of TB was high. Having a history of TB contact, history of bottle feeding, and not taking F100 were significant predictors of TB development. It is vital to address these predictors to prevent the development of TB in this population. Moreover, early screening of TB in these children should get high emphasize.
Introduction
Tuberculosis is a chronic infection caused by bacteria. It is mainly affects the lung, but it also affects brain, spine, or kidneys. 1 World Health Organization 2 defines SAM as low weight for height (below −3z score), visible severe wasting, and presence of edema. Tuberculosis is a risk factor for mortality among children who are diagnosed with SAM. 3
The prevalence of TB in children diagnosed with SAM was 4.67% from the study done in Nepal, 4 22% from the study done in Rewa, 5 20% from the study done in Ola, 6 and 56% from the study done in Arua Regional Referral Hospital. 7 The prevalence of TB in under 5 years old children’s diagnosed with SAM was 10.39% in a study done in Ethiopia. 8
Globally, TB is now the leading cause of death from infectious diseases in children of all age groups. 9 Under 5 years, children without adequate treatment for TB are at high risk of death. 10 TB is a major cause of death among under 5 years children worldwide. In the study done in 2015, 80% of under 5 children died because of TB globally. 11 In Somalia, a study done in 2018 shows that under 5 years child mortality is estimated to be 200 deaths per 1000 births. 12
Globally, severe malnutrition has affected 45 million children each year. 13 SAM has resulted 42% deaths in children as per the study report of Malawi. 14 Besides, SAM has resulted 25.9% of deaths in under 5 children from a study done in South Africa. 15 Mortality rate due to SAM was 4.4% in children from a study done in Kenya. 16 The mortality rate was 14.5% in under 5 children from the study done in Uganda. 17 The mortality rate was 2.4% in under 5 children as per a study done in Sudan. 18 A study done in Zambia in 2017 reports that TB contributes for child 0 to 59 months old mortality who are diagnosed with SAM in high TB prevalence settings. 19
In Ethiopia, more than 25 000 children with SAM are admitted to hospitals every month. 20 The mortality rate of SAM in under 5 children’s was 11.34% from a study done in Ethiopia, 21 9.5% in study done in Ethiopia, 22 10% from the study done in Addis Ababa, Ethiopia, 23 9% in the study done in Dilchora hospital, Ethiopia, 24 and 12.52% children from a study done in Gondar, northwest Ethiopia. 25
Despite the considerable burden of TB co-occurrence with SAM, there were no studies that have addressed the survival status and predictors of TB development in under 5 children with SAM in the study setting. This serious problem is not well investigated worldwide. Thus, this study was done to determine the survival status and predictors of TB development in under 5 children with SAM in Asella Referral and Teaching Hospital in Ethiopia to address this gap.
Methods
Study Area and Periods
This study was conducted in Asella Referral and Teaching hospital, which is located in Asella Town, Oromia Regional State, Ethiopia. It is 126 km far from Addis Ababa, the capital city of Ethiopia. Asella Referral and Teaching hospital was founded in 1964 and recently it is part of Arsi University. It serves as a referral hospital for the Arsi Zone and its surroundings, providing healthcare for more than 3.5 million population. This study was conducted from January 22 to 27/2023.
Study Design
A retrospective cohort study was conducted.
Source Population
All under 5 children who were admitted with SAM to Asella Referral and Teaching hospital.
Study Population
All under 5 children who were admitted with SAM to Asella Referral and Teaching hospital between January 01/2018 and December 31/2022.
Inclusion Criteria and Exclusion Criteria
All under 5 children who were admitted with SAM were included in to the study. Whereas, children who have developed TB at the beginning of the study were diagnosed with TB were excluded from the study.
Sampling Size Determination
Sample size for predictors of TB development in under 5 children with SAM was determined by using a double population proportion formula. Predictors, which is a history of TB contact were taken from the former study done North Shoa, Amhara Region, and Ethiopia.
26
Epi Info version 7.2.2.6 StatCalc was used to calculate the sample size for the predictor history of TB contact.
Sampling Technique and Procedure
The eligibility of a study participant was checked by using their medical chart records. Then, all under 5 children with SAM who were admitted to Asella Referral and Teaching hospital between January 01/2018 and December 31/2022 were included in to this study. Systematic sampling technique was used to select the study participants. The regular interval Kth was calculated and found to be 5. The number of the first patient’s medical chart to be included in the sample was chosen randomly by picking one out of the first 5 pieces of paper. Randomly, number 3 was picked and the selection of the sample was performed by this regular interval.
Study Variables
Operational Definitions
Data Collection Tool, Procedure, and Quality Assurance
A data extraction format was used to extract the required information from the under 5 children medical chart. The data extraction format was adapted from relevant literature. 26 It was prepared in English language. The data was collected by 2 BSc nurses. They were supervised by one MSc qualified nurse.
A pretest was conducted on 5% of sample size to check for the consistency the data extraction format. Then, modification was made to data extraction format accordingly before the commencement of data collection. Moreover, half day training was provided to the data collectors concerning the data extraction means from the patients’ medical charts and on its procedure. The supervisor has checked the completeness of the extracted information each day of the data collection period.
Statistical Analysis
EpiData version 4.6.0.6 was used for data entry and exported to STATA version 14.2 for statistical analysis. Multi-Collinearity test was done to check the correlation between predictors and there was no sign of multi-Collinearity. Descriptive statistics was done. IDR and cumulative incidence proportion were calculated. Kaplan-Meier survival estimation was performed to determine the probability of survival function. To test for equality of survival functions in different categorical predictors, Kaplan-Meier survival curve and log-rank test were performed. Schoenfeld and scaled Schoenfeld residuals were used to check and test the Cox proportional hazards assumption. The predictors having the global test of P-value > .05 were considered as fulfilling the Cox proportional hazard model assumption. Whereas, Cox–Snell residual was used to determine the overall model fit.
Bivariable and multivariable Cox proportional hazard regression analysis was performed. Predictors with a P-value < .25 in bivariable Cox proportional hazard regression analysis were considered for multivariable Cox proportional hazard regression analysis. Crude hazard ratio (CHR), and adjusted hazard ratio (AHR) with 95% confidence intervals (CI) were used to explain the results. The statistical significance was declared at a P-value < .05. Finally, tables, figures, and narration were used to present the results of this study.
Ethics Approval and Informed Consent
The study was approved by the Ethical Review and Research Committee of the Nursing Department, College of Health Sciences, Arsi University, and permission to conduct the study was received from the Asella Referral and Teaching Hospital concerned body prior to study commencement. The requirement for informed consent was waived because of the nature of the study design; retrospective study design and as the study depended on secondary data collected from patients’ medical charts. All methods were performed in accordance with the ethical standards as laid down in the Declaration of Helsinki and its later amendments or comparable ethical standards.
Result
Demographic Characteristics of Under 5 Children With SAM
Data was extracted from 247 under 5 children medical charts admitted with SAM. The response rate was 100%. The majority 211 (85.43%) of them were aged less than 24 months. The mean age of the children was 11.94 months. About 190 (76.92%) of them were rural residents (Table 1).
Demographic Characteristics of Under 5 Children With SAM Between January 01/2018 and December 31/2022 at Asella Referral and Teaching Hospital, Ethiopia, 2023. [n = 247].

Admission Characteristics of Under 5 Children With SAM
The majority 154 (62.35%) of under 5 children were not immunized. Only 31 (12.55%) of them had a history of TB contact. The majority 205 (83%) of them had exclusively breast feeding (Table 2).
Admission Characteristics of Under 5 Children With SAM Between January 01/2018 and December 31/2022 at Asella Referral and Teaching Hospital, Ethiopia, 2023. [n = 247].

Treatment Given for Under 5 Children With SAM
Only 43 (17.41%) of under 5 children had taken PO antibiotics. Whereas, the majority 238 (96.36%) of under 5 children had taken IV antibiotics. About 195 (78.95) of under 5 children had taken F75. While only 86 (34.82) of under 5 children had taken F100 (Table 3).
Treatment Given for Under 5 Children With SAM Between January 01/2018 and December 31/2022 at Asella Referral and Teaching Hospital, Ethiopia, 2023. [n = 247].

Presence of Comorbidities in Under 5 Children With SAM
From 247 under 5 children admitted with SAM, 209 (84.62%) of them had comorbidity. Whereas, the rest 38 (15.38%) had not. From 209 children who had comorbidity, 91 (46.43%) were diagnosed with anemia, 18 (9.33%) were diagnosed with heart failure and 94 (48.70%) were diagnosed with pneumonia.
Survival Status of Under 5 Children With SAM
IDR of TB in under 5 children with SAM was 45.51 per 100 (95% CI: 33.63, 61.58) children-months observation. The cumulative incidence of TB in under 5 children with SAM was 17% (n = 42, 95% CI: 12.79, 22.25). From 247 under 5 children with SAM, 205 (83%) were censored. Out of this, 21 (10.24%) of them were lost to follow up, 4 (1.95%) of them were withdrawn, 165 (80.49%) of them were did not develop TB, 7 (3.41%) of them were transferred, and 8 (3.9%) of them were died without developing TB.
IDR in Different Predictors
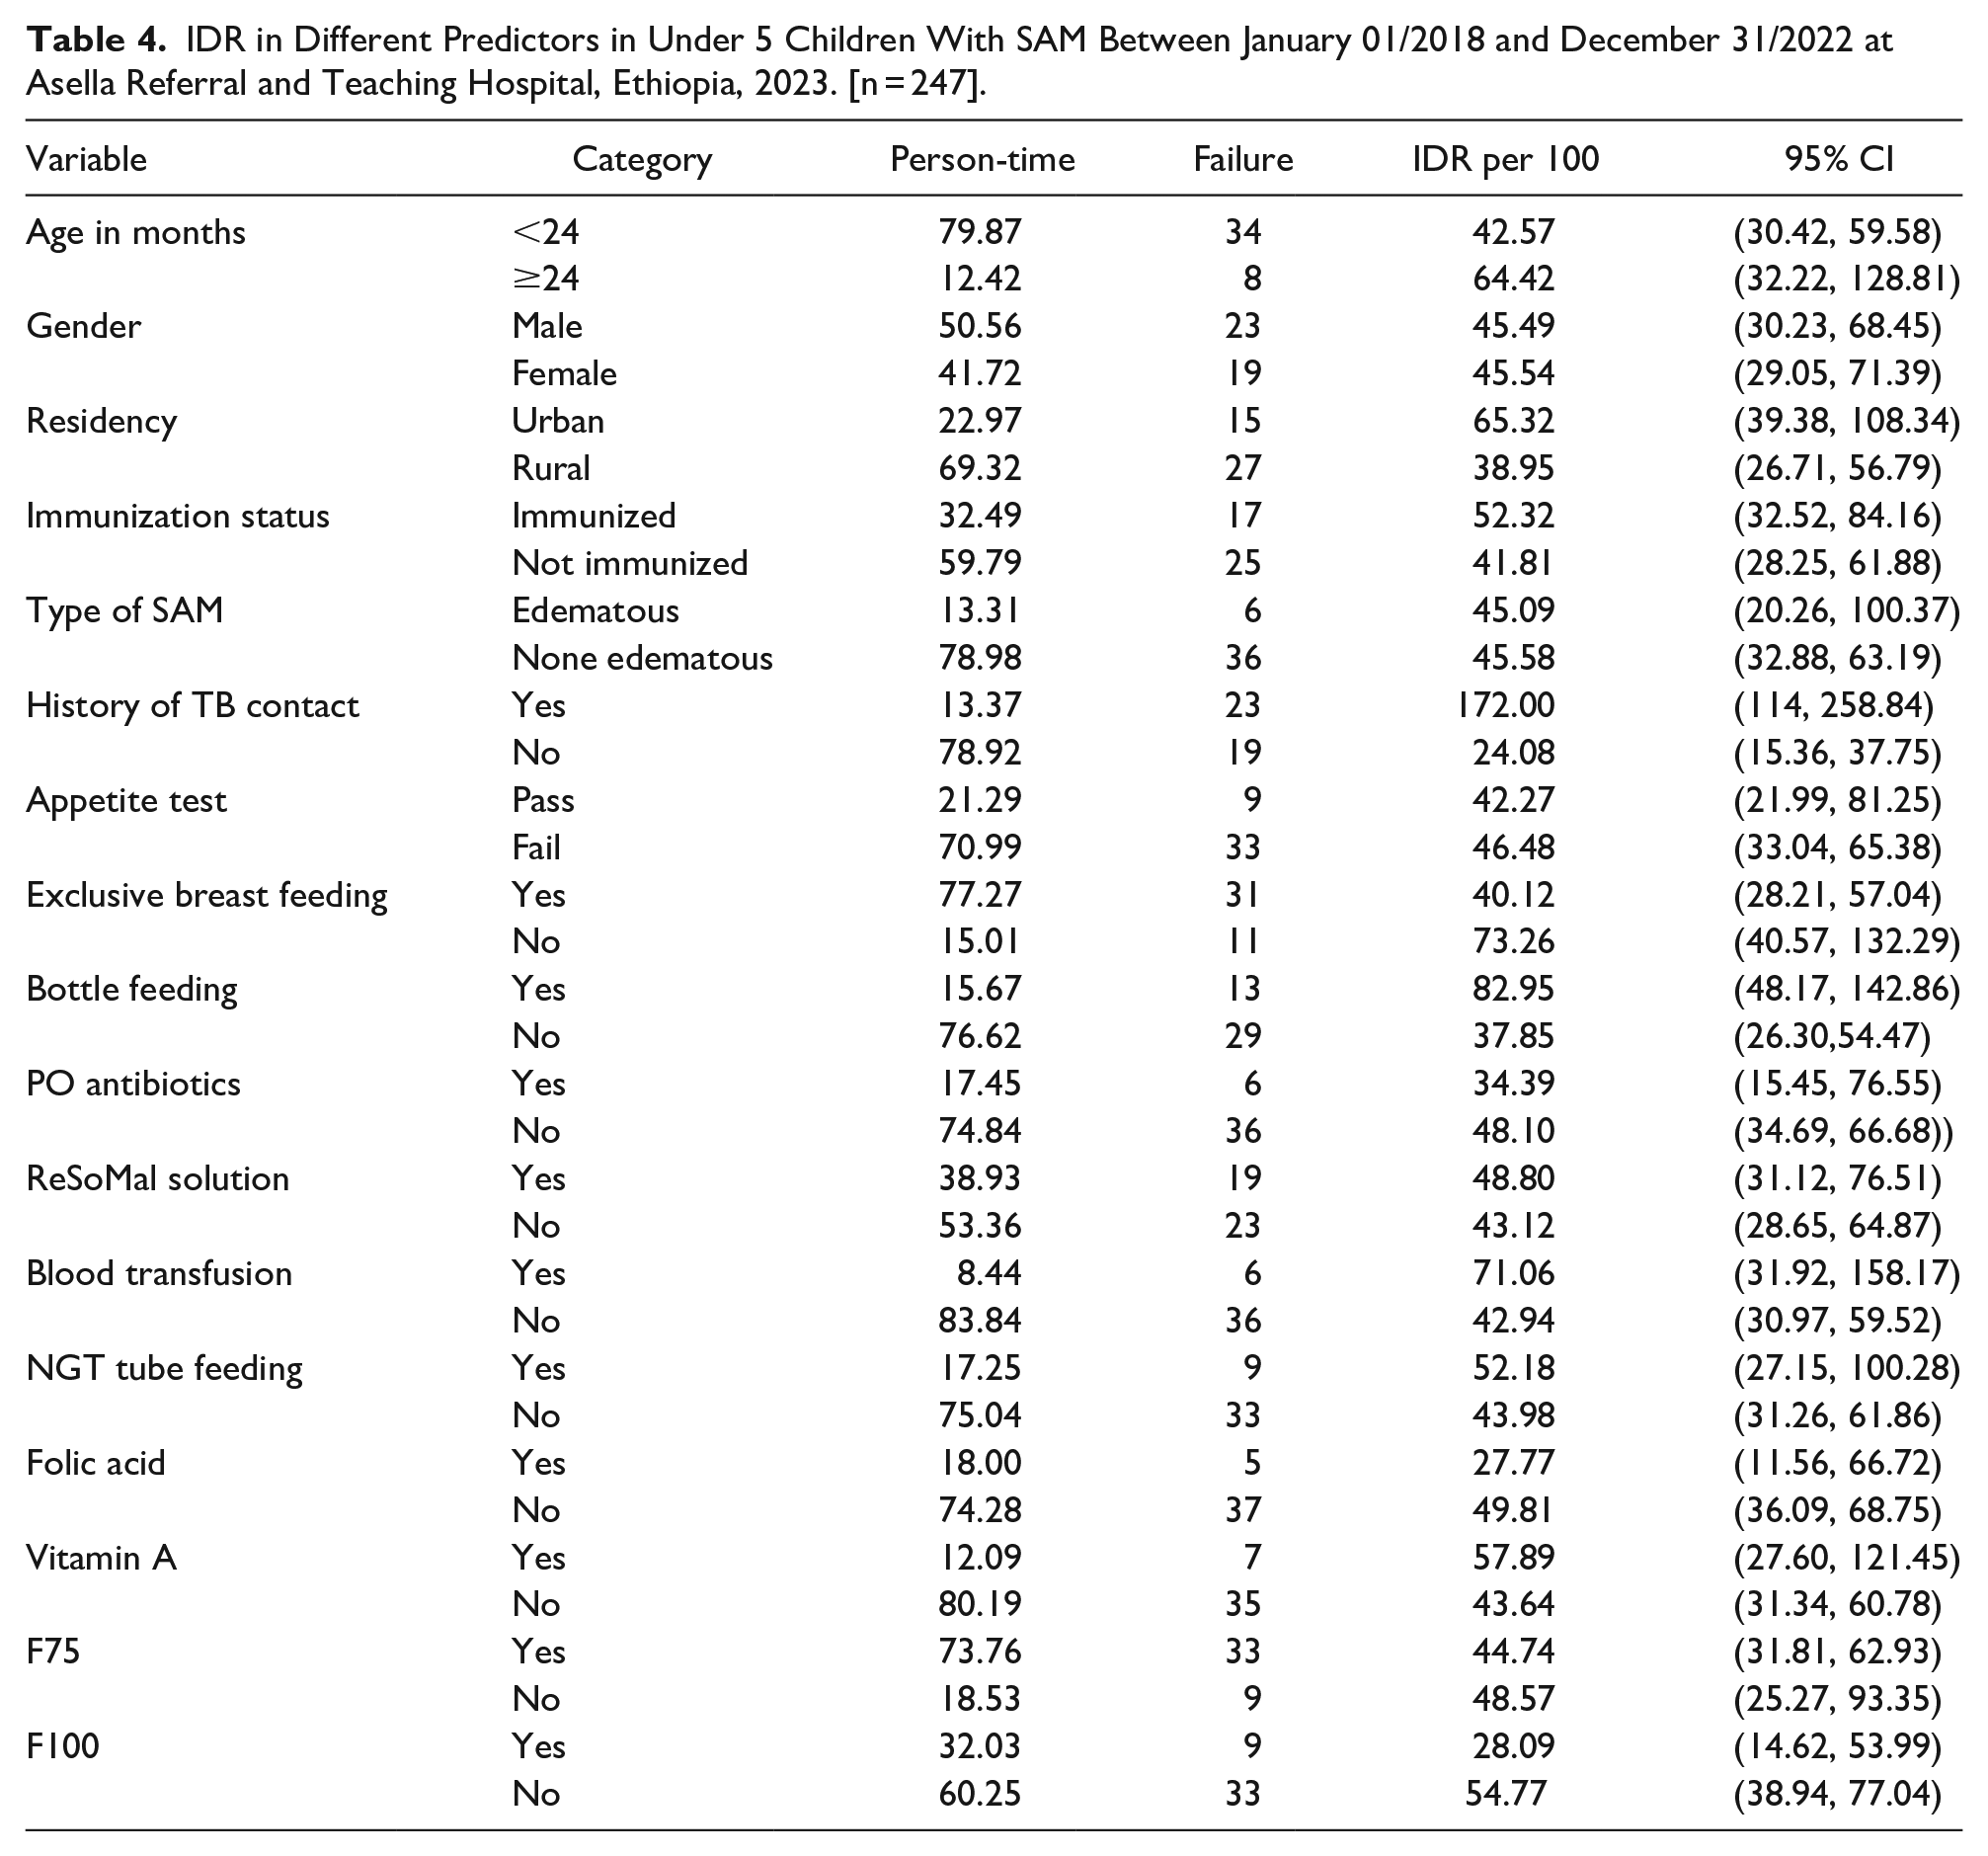
IDR was higher in under 5 children aged ≥24 months than those who were <24 months (64.42 vs 42.57 per 100 children-months-observations). IDR was higher in under 5 children urban residents than that of rural residents (65.32 vs 38.95 per 100 children-months-observations). IDR was higher in under 5 children among children who were Bottle fed than that of their contraries (82.95 vs 37.85 per children-months-observation) (Table 4).
IDR in Different Predictors in Under 5 Children With SAM Between January 01/2018 and December 31/2022 at Asella Referral and Teaching Hospital, Ethiopia, 2023. [n = 247].
Time to TB Development in Under 5 Children With SAM
The mean follow-up period was 0.37 months. The median follow-up period was 0.296 months. The maximum follow up period was 1.32 months. The 25th percentile survival time for the under 5 children with SAM to develop TB were 0.53 months (95% CI: 0.43, 0.72).
Overall Survival Function of Under 5 Children With SAM
The Kaplan-Meier survival estimation showed that the overall estimated survival function for the development of TB in under 5 children with SAM was 51.84% (95% CI: 35.63, 65.81) at 1.3 months of follow-up. The estimated cumulative survival function for the development of TB in under 5 children with SAM was 77.02% (95% CI: 68.19, 83.69), 51.84% (95% CI: 35.63, 65.81) at 0.5 months and 1.3 months of follow-up, respectively (Figure 1).

Kaplan Meier survival function in under 5 children with SAM between January 01/2018 and December 31/2022 at Asella Referral and Teaching hospital, Oromia Regional State, Ethiopia, 2023. [n = 247].
Survival Function in Different Predictors
The log-rank test was performed to check for equality of the survival function in groups. This test was done to investigate the presence of statistically significant differences in survival time in different predictors. The log-rank test results for age group; X2 = 1.79, df = 1, and P-value = .1808. There is no statistically significant difference in survival time between age groups <24 months and ≥24 months children (Figure 2A). The log-rank test results for gender; X2 = 0.08, df (1), P-value = .7830. There is no statistically significant difference in survival time between male and female children (Figure 2B).

Kaplan Meier survival function for age (A), gender (B), residency (C), immunization status (D), type of SAM (E), history of TB contact (F), appetite test (G), EBF (H), bottle feeding (I), PO antibiotics (J), ReSoMal solution (K), blood transfusion (L), NGT feeding (M), folic acid (N), vitamin A (O), F75 (P) and F100 (Q) in under 5 children with SAM between January 01/2018 and December 31/2022 at Asella Referral and Teaching hospital, Oromia Regional State, Ethiopia, 2023. [n = 247].
The log-rank test results for residency; X2 = 2.26, df (1), P-value = .1330. There is no a statistically significant difference in survival time in urban and rural children (Figure 2C). The log-rank test results for immunization status; X2 = 0.83, df (1), P-value = .3620. There is no a statistically significant difference in survival time in immunized and not immunized children (Figure 2D). The log-rank test results for type of SAM; X2 = 0.01, df (1), P-value = .9314. There is no statistically significant difference in survival time between edematous and none edematous children (Figure 2E).
The log-rank test results for history of TB contact; X2 = 44.80, df (1), P-value = .000. There is statistically significant difference in survival time between children who had history of TB contact and who had not (Figure 2F). The log-rank test results for appetite test; X2 = 0.04, df (1), P-value = .8484. There is no statistically significant difference in survival time between children who passed and failed on appetite test (Figure 2G). The log-rank test results for exclusive breast feeding; X2 = 3.63, df (1), P-value = .0568. There is no statistically significant difference in survival time between children who had exclusive breast feeding and who had not (Figure 2H).
The log-rank test results for bottle feeding; X2 = 7.27, df (1), P-value = .0070. There is statistically significant difference in survival time between children who used bottle feeding and who had not (Figure 2I). The log-rank test results for PO antibiotics; X2 = 0.63, df (1), P-value = .4257. There is no statistically significant difference in survival time between children who had taken PO antibiotics and who had not (Figure 2J). The log-rank test results for ReSoMal solution; X2 = 0.10, df (1), P-value = .7518. There is no statistically significant difference in survival time between children who had taken ReSoMal solution and who had not (Figure 2K).
The log-rank test results for blood transfusion; X2 = 1.50, df (1), P-value = .2209. There is no statistically significant difference in survival time between children who had blood transfusion and who had not (Figure 2L). The log-rank test results for NGT feeding; X2 = 0.07, df (1), P-value = .7922. There is no statistically significant difference in survival time between children who had NGT feeding and who had not (Figure 2M). The log-rank test results for folic acid; X2 = 1.06, df (1), P-value = .3029. There is no statistically significant difference in survival time between children who had used folic acid and who had not (Figure 2N).
The log-rank test results for vitamin A; X2 = 0.65, df (1), P-value = .4209. There is no statistically significant difference in survival time between children who had used vitamin A and who had not (Figure 2O). The log-rank test results for F75; X2 = 0.02, df (1), P-value = .8843. There is no statistically significant difference in survival time between children who had used F75 and who had not (Figure 2P). The log-rank test results for F100; X2 = 3.38, df (1), P-value = .0660. There is no statistically significant difference in survival time between children who had used F100 and who had not (Figure 2Q).
Testing Overall Model Fit
The model’s fitness was determined by the Nelson–Aalen estimator by using the Cox–Snell residuals. The test reveals that overall model fitness with Cox–Snell residuals (Figure 3).

Cox-Snell residual Nelson-Aalen cumulative hazard graph on under 5 children with SAM between January 01/2018 and December 31/2022 at Asella Referral and Teaching hospital, Oromia Regional State, Ethiopia, 2023. [n = 247].
Predictors of TB Development in Under 5 Children
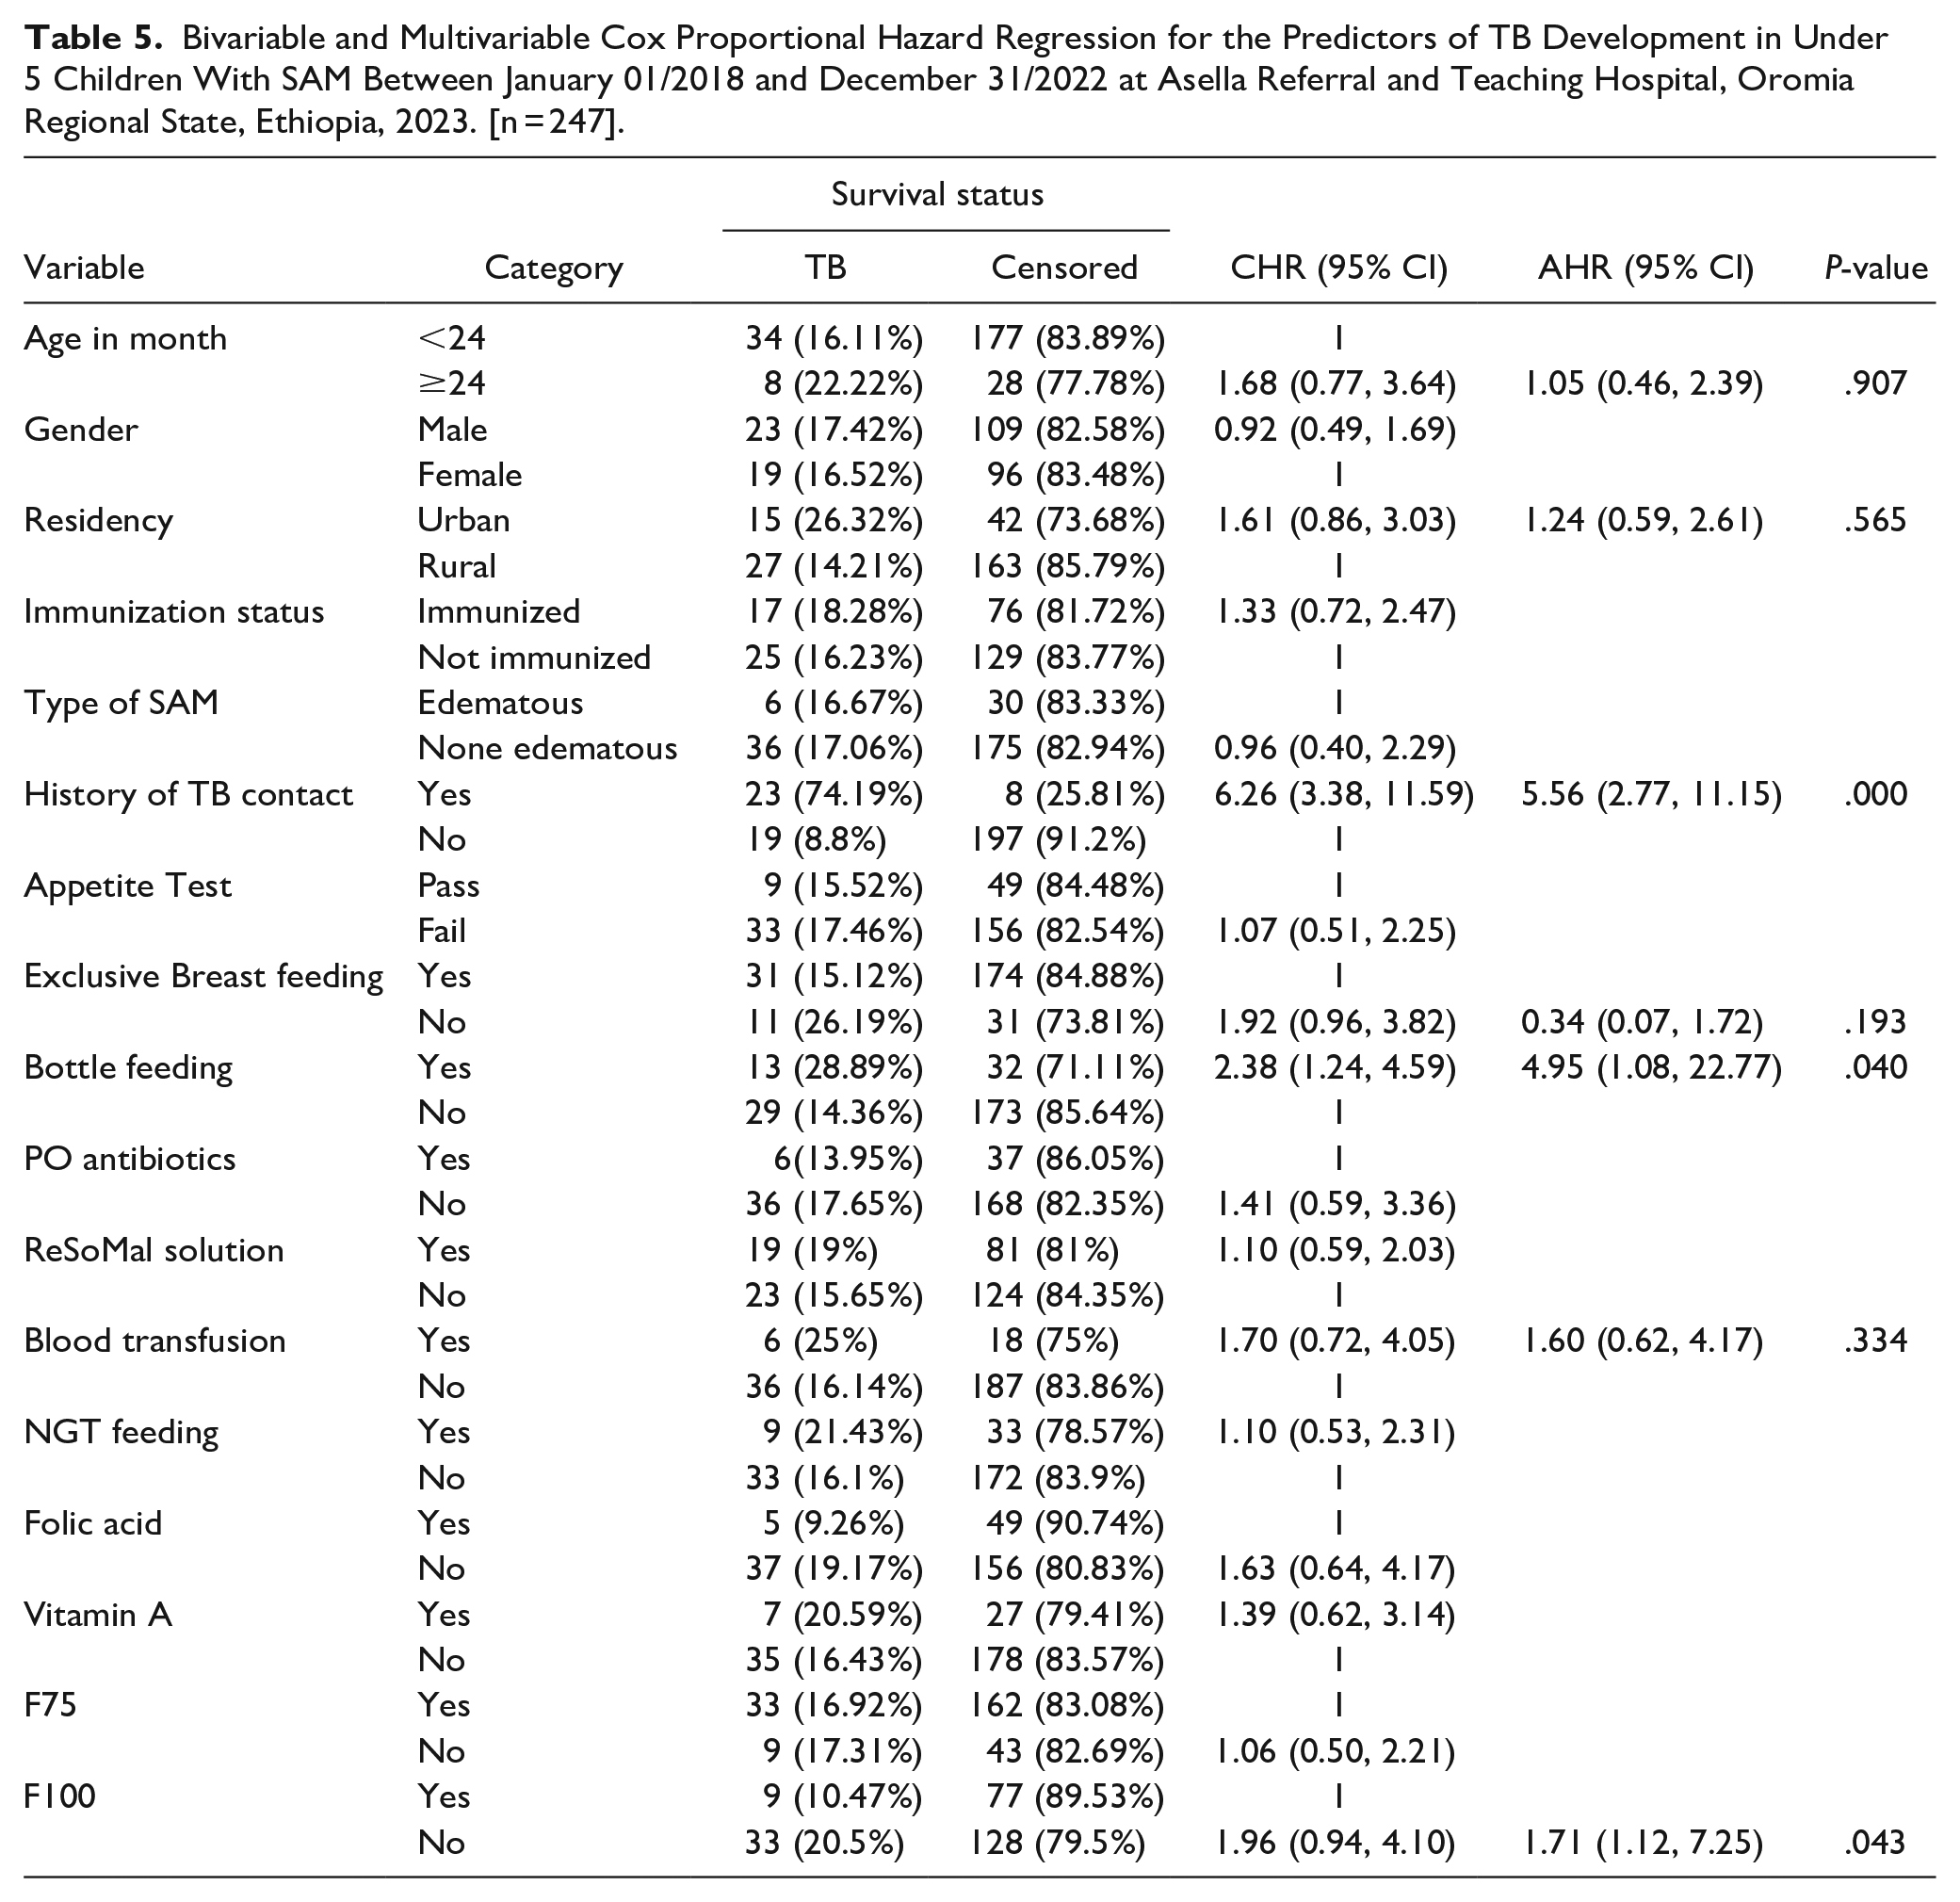
Predictors such as Age, gender, residency, immunization status, type of SAM, history of TB contact, appetite test, EBF, bottle feeding, PO antibiotics, ReSoMal solution, blood transfusion, NGT feeding, folic acid, vitamin A, F75, and F100 were entered in to Bivariable Cox proportional hazard regression to check for its association with the time to occurrence of TB in under 5 children with SAM. From this gender, immunization status, type of SAM, appetite test, PO antibiotics, ReSoMal solution, NGT feeding, folic acid, Vitamin A, F75, and F100 were omitted from the multivariable Cox proportional hazard regression due their p-value was > 0.25.
From the predictors tested in the final model only history of TB contact, bottle feeding, and F100 were significantly associated with the development of TB. The hazard ratio of developing TB in under 5 children with SAM who had history of TB contact was 5.56 hazard (AHR = 5.56, 95% CI: 2.77, 11.15, P-value = .000) more likely than their contraries.
Furthermore, the hazard ratio of developing TB in under 5 children with SAM who had history of bottle feeding was 4.95 hazard (AHR = 4.95, 95% CI: 1.08, 22.77, P-value = .040) more likely than under 5 children who had no history of bottle feeding. The hazard ratio of developing TB in under 5 children with SAM who did not take F100 was 1.71 hazard (AHR = 1.71, 95% CI: 1.12, 7.25, P-value = .00) more likely than their opposite (Table 5).
Bivariable and Multivariable Cox Proportional Hazard Regression for the Predictors of TB Development in Under 5 Children With SAM Between January 01/2018 and December 31/2022 at Asella Referral and Teaching Hospital, Oromia Regional State, Ethiopia, 2023. [n = 247].
Goodness of Fit Test
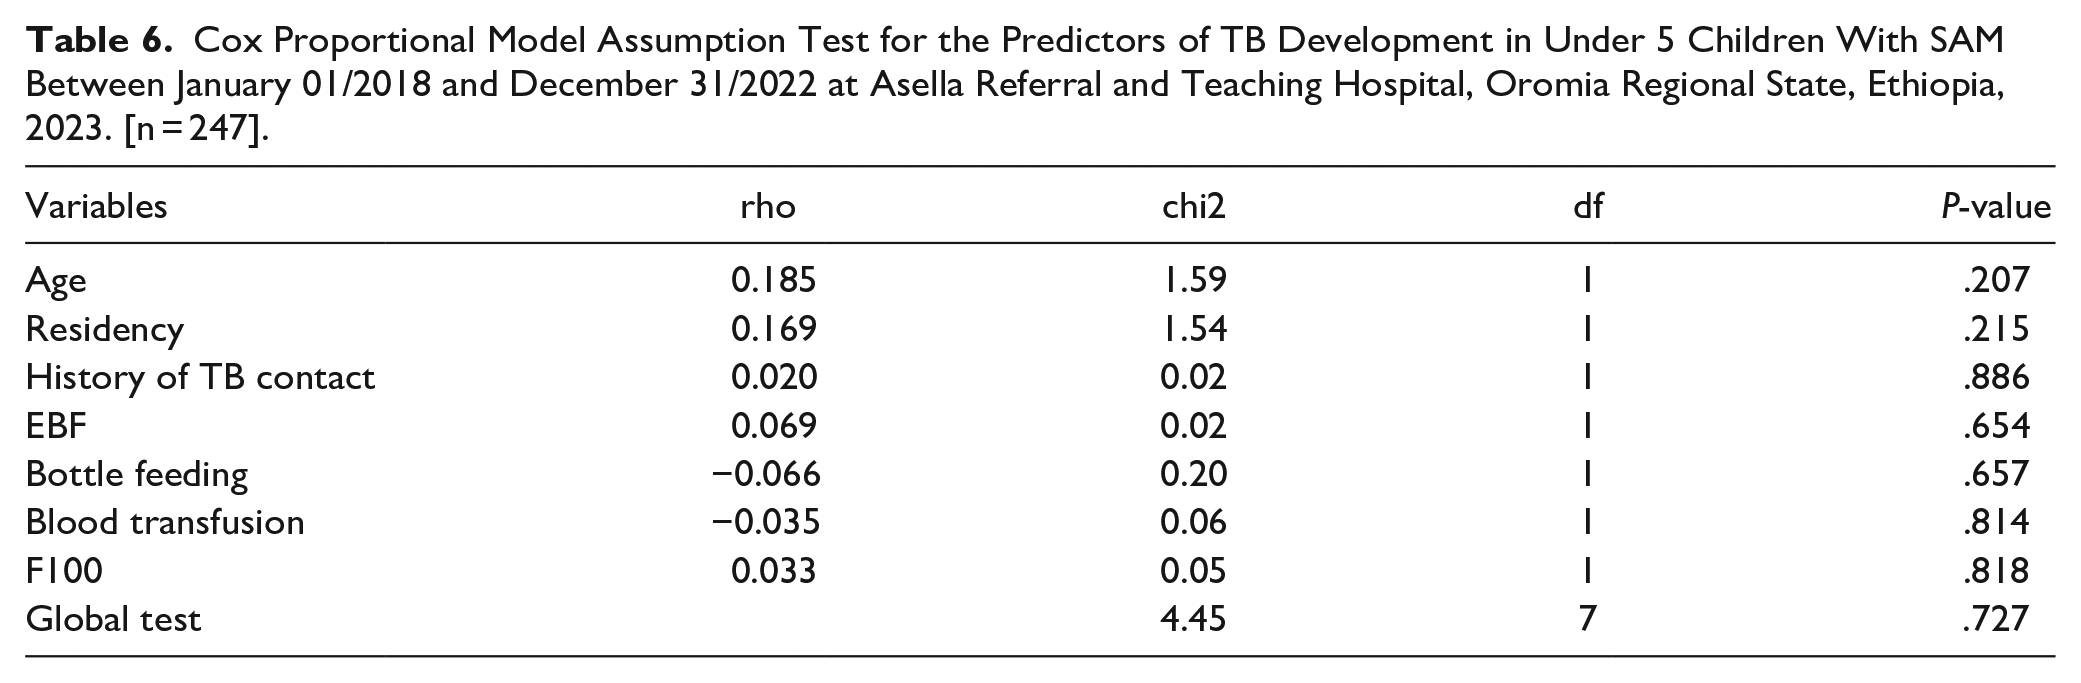
A goodness-of-fit test was performed to determine the proportional hazard assumptions of the Cox proportional hazard regression model for the included predictors. From the findings shown below, since Global test: P-value > .05 for all included predictors, it is considered as the model was satisfied Cox proportional hazard assumptions (Table 6).
Cox Proportional Model Assumption Test for the Predictors of TB Development in Under 5 Children With SAM Between January 01/2018 and December 31/2022 at Asella Referral and Teaching Hospital, Oromia Regional State, Ethiopia, 2023. [n = 247].
Discussion
Malnutrition, by itself is recognized as the significant risk factor of TB development in under 5 children.27,28 The evidence revealed that, malnutrition may account for a greater population attributable risk of TB than HIV infection, and certainly a much more correctable one. 29 The burden of SAM remaining unacceptably high worldwide. TB is common in children with SAM. Whereas, the mortality rise when these 2 diseases co-exist. The diagnosis of TB in children with SAM has unique considerations. The burden of TB co-occurring with SAM in under 5 children is the significant focus for the improvement of child health. 30
Keeping in mind malnutrition as the risk factor of TB in under 5 children, predicting the synergism effect of SAM and another’s predictors of TB development in under 5 children is too easy. The burden of TB in under 5 children diagnosed with SAM is high. The investigation of such information is essential to provide the insight for the concerned bodies. This study was intended to determine the survival status and predictors of TB development in under 5 children with SAM in Asella Referral and Teaching Hospital, Ethiopia.
This study shows that the IDR of TB in under 5 children with SAM was 45.51 per 100 (95% CI: 33.63, 61.58) children-months observation. This study finding was higher than the study conducted in Ethiopia, which is at preprint stage reported the IDR as 4.6 per 100. 26 This study reveals that the cumulative incidence of TB in under 5 children with SAM was 17% (95% CI: 12.79, 22.25). This study finding was higher than the study conducted in Ethiopia, which is at preprint stage reported the cumulative incidence of TB as 7%. 26
This study shows that out of 247 under 5 children with SAM, 205(83%) were censored. Out of this, 21 (10.24%) of them were lost to follow up, 4 (1.95%) of them were withdrawn, 165(80.49%) of them were did not develop TB, 7(3.41%) of them were transferred, and 8 (3.9%) of them were died without developing TB. This study shows that reveals that the hazard ratio of developing TB in under 5 children with SAM who had history of TB contact was 5.56 hazard more likely than their contraries. This finding was supported by the study done in the Gambia and India.31-33 This finding is also supported by evidence of centers for disease control and prevention report which states that close contacts of a person with infectious TB disease is a high risk for TB development. 34
The hazard ratio of developing TB in under 5 children with SAM who had history of bottle feeding was 4.95 hazard more likely than under 5 children who had no history of bottle feeding. The hazard ratio of developing TB in under 5 children with SAM who did not take was 1.71 hazard more likely than their opposite. Generally, according to the World Health Organization, 35 access to TB prevention and care is severely lacking when it comes to children. Furthermore, only one-third of eligible child household contacts of patients with TB receive TB preventive treatment. 35
Limitation of the Study
This study is a retrospective cohort study addressing a very critical topic. However, this problem is not well investigated elsewhere. This leads to comparison of predictors a challengeable in discussion. Moreover, since this is a retrospective study design done by medical record extraction, there was a challenge of including other essential predictors of TB development among under 5 children.
Conclusion
This study shows that the IDR of TB in under 5 children with SAM was high. Having history of TB contact, history of bottle feeding, and not taking F100 were significant predictors of TB development in under 5 children with SAM.
It is vital to address these predictors to avoid the development of TB in this population. Healthcare professionals, the government, local and national policy implementers and makers, TB associations, pediatricians, nutritionist, and any stakeholders should be effectively participate on this critical issues since the co-existence of TB with SAM in under 5 children is a huge burden for community and also for the countries. Moreover, early screening of TB among under 5 children with SAM should get high emphasize.
Footnotes
Acknowledgements
The author would like to thank Asella Referral and Teaching Hospital, Arsi University, and data collectors.
Author Contributions
The author has contributed to the conception of the study, data analysis, drafting or revising the article, gave final approval of the version to be published, and agreed to be accountable for all aspects of the work.
Availability of Data and Materials
The datasets used and analysed during the present study are available from the corresponding author on reasonable request.
Declaration of Conflicting Interests
The author(s) declared no potential conflicts of interest with respect to the research, authorship, and/or publication of this article.
Funding
The author(s) received no financial support for the research, authorship, and/or publication of this article.
Consent for Publication
Not applicable.