
Abstract
Background: Large disparities exist in congenital musculoskeletal disease burden worldwide. The purpose of this study is to examine and quantify the health and economic disparities of congenital musculoskeletal disease by country income level from 1992 to 2017. Methods: The Global Burden of Disease database was queried for information on disease burden attributed to “congenital musculoskeletal and limb anomalies” from 1992 to 2017. Gross national income per capita was extracted from the World Bank website. Nonparametric Kruskal–Wallis tests were used to compare morbidity and mortality across years and income levels. The number of avertable DALYs was converted to an economic disparity using the human-capital and value of a statistical life approach. Results: From 1992 to 2017, a significant decrease in deaths/100 000 was observed only in upper-middle and high income countries. Northern Africa, the Middle East, and Eastern Europe were disproportionately affected. If the burden of disease in low- and middle- income countries (LMICs) was equivalent to that in high income countries (HICs), 10% of all DALYs and 70% of all deaths attributable to congenital musculoskeletal disease in LMICs could be averted. This equates to an economic disparity of about $2 billion to $3 billion (in 2020 $USD). Conclusion: Considerable inequity exists in the burden of congenital musculoskeletal disease worldwide and there has been no change over the last 25 years in total disease burden and geographical distribution. By reducing the disease burden in LMICs to rates found in HICs, a large proportion of the health and economic consequences could be averted.
Keywords
Highlights
What do we already know about this topic?
Large disparities exist in congenital musculoskeletal disease burden worldwide.
How does your research contribute to the field?
Our manuscript adds to the current body of literature by introducing a unique way of quantifying health and economic burden of disease, quantifying the burden of congenital musculoskeletal disease worldwide, and commenting on trends in disease burden over the last 25 years.
What are your research’s implications towards theory, practice, or policy?
By quantifying the burden of disease attributable to congenital musculoskeletal disorders and identifying the regions which are most affected, physicians can better direct their global health efforts and make the greatest impact in their international work.
Introduction
Congenital anomalies account for about 2.1% of the total disease burden 1 and 6% of infant deaths worldwide. 2 These include anomalies most commonly treated by pediatric orthopedic surgeons, such as clubfoot, hip dysplasia, and congenital spinal deformities, which can have satisfactory outcomes when treated in a timely fashion. However, large disparities exist in disease burden between high-income countries (HICs) and low- and middle- income countries (LMICs). Vulnerable populations, such as children and pregnant women, are especially affected by this inequality. 3 In fact, according to World Health Organization, about 94% of congenital anomalies occur in low income countries and lower-middle income countries.4,5 This is compounded with the fact that congenital disorders, which are regularly treated in HICs, frequently go untreated in LMICs contributing to significant disease burden.6-8
Numerous studies of congenital anomalies in LMICs have shown that a high proportion of congenital disease involves the musculoskeletal system.9-17 This may include various complex disorders such as developmental dysplasia of the hip (DDH), talipes equinovarus, congenital scoliosis, pectus excavatum, syndactyly, chondrodysplasia punctata, and osteogenesis imperfecta, among others.18-20 One study in India demonstrated that congenital musculoskeletal disease accounts for about one-third (33.2%) of all congenital anomalies. 21 Another study in Iran showed that about one-third (27.5%) of congenital disease involved the musculoskeletal system. 22 A third study from Iraq demonstrated that congenital musculoskeletal disorders account for over one-fifth (23.1%) of all congenital anomalies and combined with central nervous system disorders, such as spina bifida, they account for over one-half (60.8%) of all congenital anomalies. 17
Ultimately, those with untreated musculoskeletal conditions often have lifelong deficits and challenges, psychologically, educationally, financially, and functionally. 22 In fact, one previous study, which advocated for psychotherapist counseling as part of clubfoot management, stated that fewer than 2% of children with disabilities attend school in developing countries. 23 This can impose significant health and economic burdens on both the affected children and their families.
Previous studies have examined the burden of disease attributable to cleft lip and palate, congenital heart defects, and neural tube defects. 2 The purpose of this study is to examine and quantify the health and economic disparities of congenital musculoskeletal disease by country income level from 1992 to 2017.
Methods
Global Burden of Disease Database
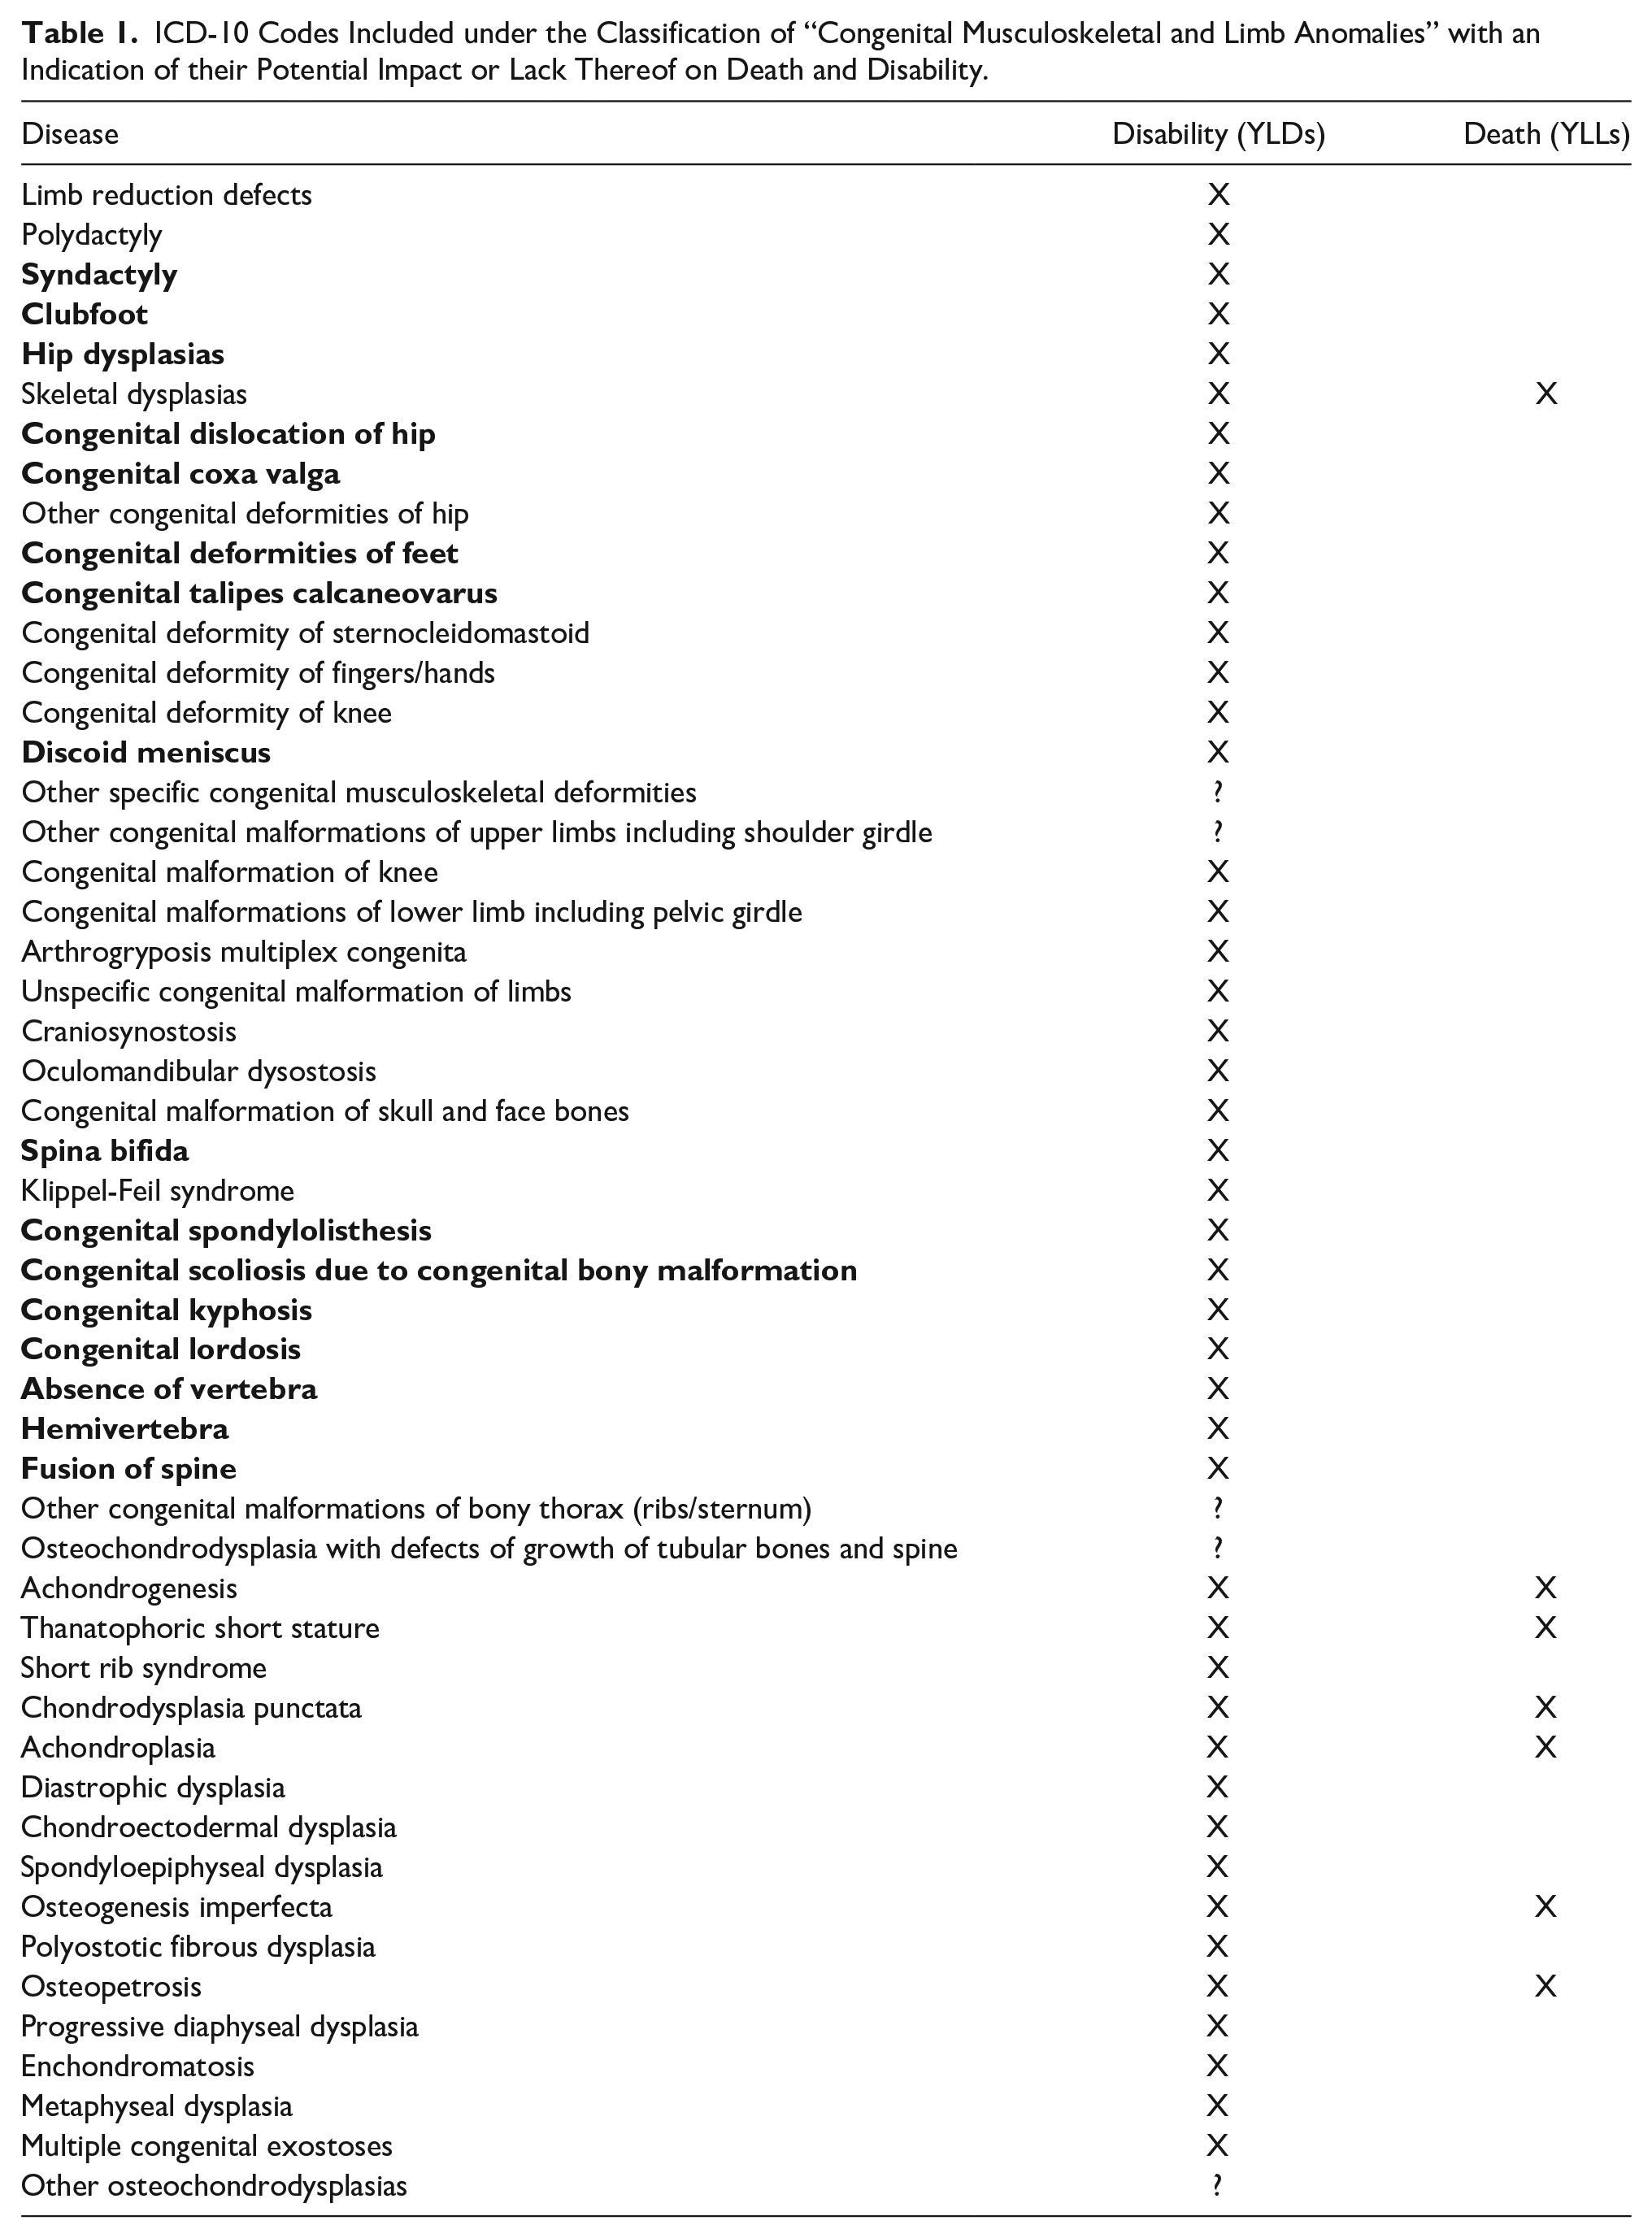
The Global Burden of Disease (GBD) database, created by the Institute for Health Metrics and Evaluation, was queried for information on the country-specific burden of disease attributed to “congenital musculoskeletal and limb anomalies” from 1992 to 2017 in 5-year increments (1992, 1997, 2002, 2007, 2012, 2017). 24 While this database is by no means exhaustive, it includes some of the most common congenital musculoskeletal anomalies and is the most comprehensive source of data that exists currently. The ICD-10 codes included in the classification group of “congenital musculoskeletal and limb anomalies” can be found in Table 1.
ICD-10 Codes Included under the Classification of “Congenital Musculoskeletal and Limb Anomalies” with an Indication of their Potential Impact or Lack Thereof on Death and Disability.
World Bank Data
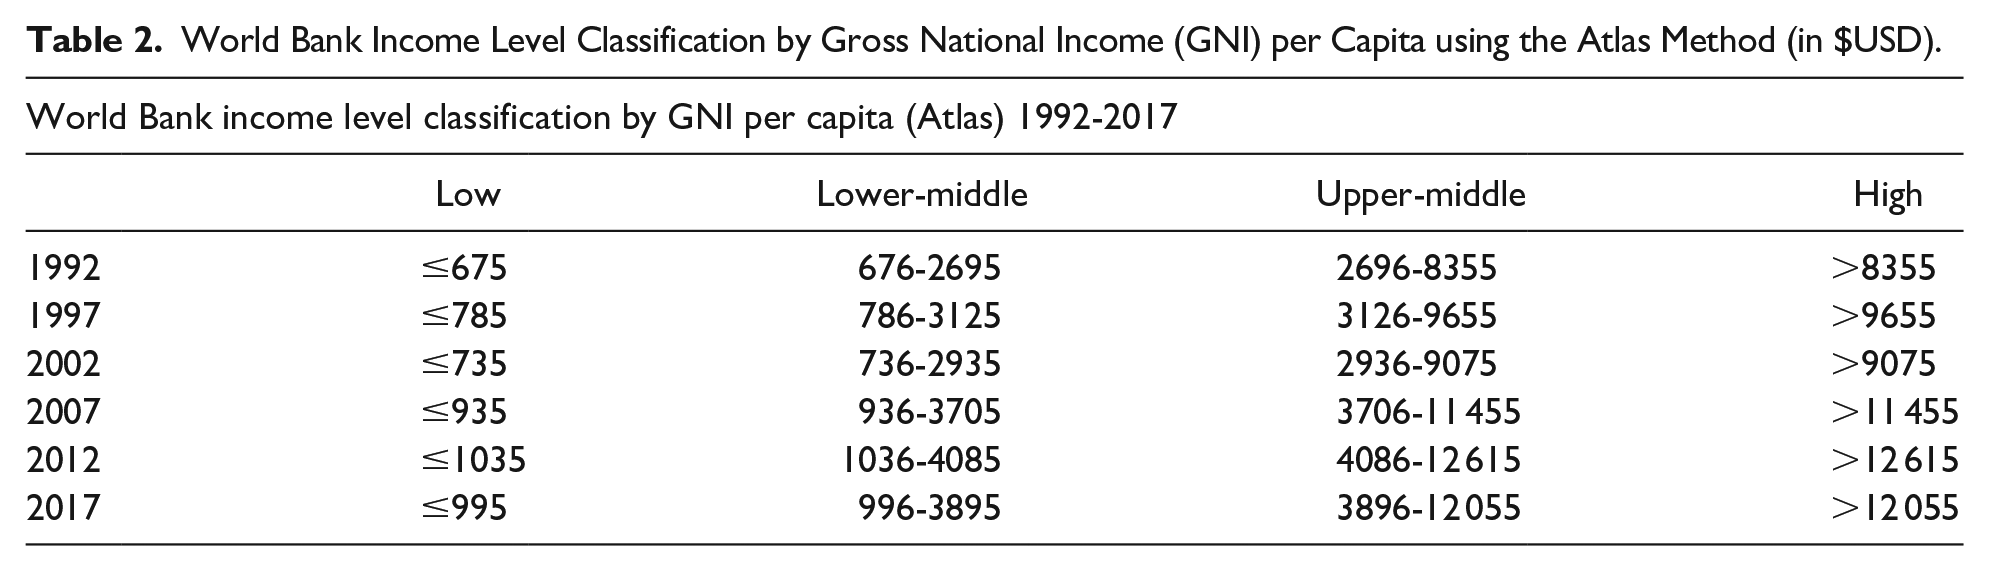
Information on country gross national income (GNI) per capita using the Atlas method was extracted from the World Bank website. This data was used to classify countries as either low income, low-middle income, upper-middle income, or high income as per the World Bank classification system in that particular year (Table 2). Information was also collected on GNI per capita using the purchasing power parity (PPP) method. This data was used in the economic analyses because it better accounts for global variations in price of common goods and has been shown to be superior to the Atlas method in previous studies.25-29 All countries with incomplete information were removed from the study (Table 3). Due to violation of parametric assumptions of normal distribution and homogeneity of variances, averages were reported in this study as medians. Thus, median GNI per capita as per the Atlas method and PPP method were tabulated (Table 4).
World Bank Income Level Classification by Gross National Income (GNI) per Capita using the Atlas Method (in $USD).
Number of Countries Included in the Study by Year from 1992 to 2017.

Economic and Population Data by Income Level from 1992 to 2017.

Examining Trends in Disease Burden
To quantify the burden of disease, information was collected on population, disability-adjusted life years (DALYs), years lived with disability (YLDs), years of life lost (YLLs), and deaths by country both as total amounts and rates per 100 000 people. All rates were age-standardized to account for differences in age between different populations. Disability weights, which are assigned by a panel of experts from the Institute of Health Metrics and Evaluation, were utilized to quantify different levels of disability caused by specific diseases. For example, while severe motor impairment due to spina bifida was assigned a disability weight of 0.402 (0.268-0.545), disfigurement due to polydactyly or syndactyly was assigned a disability weight of 0.011 (0.005-0.021). 24 For reference, a disability weight of 1.00 is assigned to death. These metrics, which are commonly used to quantify the burden of disease, demonstrate disease-specific effects on morbidity and mortality of a population. They were calculated as follows:

YLDs = Years lived with disability
I = Number of incident cases
DW = Disability weight
L = Average duration of the case until remission or death (years) 30

YLLs = Years of life lost
N = Number of deaths
L = Standard life expectancy at age of death in years 30

DALYs = Disability-adjusted life years
YLDs = Years lived with disability
YLLs = Years of life lost 30
Median rates for DALYs/100 000 and deaths/100 000 were then calculated for countries in each income level across 1992 to 2017 at 5-year intervals. Data was analyzed using a nonparametric Kruskal-Wallis test for change in median DALYs/100 000 and deaths/100 000 over the defined time range and for each income level classification. Also, a Kruskal–Wallis test was used to analyze differences in disease burden between 2 different income levels for each of the years studied. Post-hoc comparisons were adjusted using a Bonferroni correction for multiple tests. An alpha of P < .05 was used for statistical significance. Statistical tests were carried out using SPSS (IBM Corp., Armonk, N.Y., USA).
Quantifying Disparities in Disease Burden
To better understand and quantify the disparities in the burden of disease between the different income level classification groups, median rates for DALYs/100 000 and deaths/100 000 from high income countries were applied to low income, low-middle income, and upper-middle income countries. This allowed for calculation of the number of DALYs and deaths averted if the burden of disease in low- and middle- income countries (LMICs) was equal to that in high income countries (HICs).

TDHIC = Median total DALYs with HIC rates
DHIC = Median DALYs/100 000 rate in HIC
P = Population

DAHIC = Median number of DALYs averted with HIC rates
TDHIC = Median total DALYs with HIC rates
TDActual = Median total DALYs with actual rates
Economic Analyses
Two different methodologies were utilized to convert the number of DALYs averted to a monetary value (in $USD) and estimate of the economic benefit of decreasing the burden of congenital musculoskeletal disease in LMICs to that in HICs. This includes the human capital (HC) approach and the value of a statistical life (VSL) approach, as demonstrated in previous studies.29,31 The human capital approach measures economic benefit in terms of how much an individual contributes to the country’s economy. The VSL approach estimates economic benefit based on an individual’s willingness to pay to avoid an unwanted outcome, such as a disability-adjusted life year. For the VSL approach, a value of statistical life year was calculated by dividing the value of a statistical life by the average life expectancy in the country of interest.

HC = Economic disparity as per the human capital approach
DAHIC = DALYs averted with HIC rates
GNIpc = GNI per capita as per the PPP method

VSLCountry = Economic disparity as per the value of a statistical life approach
VSLUSA = Value of a statistical life in the USA according to the US EPA = $9.7 million
GNIpc = GNI per capita as per the PPP
We utilized an income elasticity of 1.5 as per previous studies26,29 and VSLUSA of $9.7 million as per the US EPA. 29

VSLYCountry = Value of statistical life year for the country
LCountry = Average life expectancy in the country of interest
Ethical Approval and Informed Consent
Ethical approval and informed consent were not needed for this study since it utilized a publicly available database of deidentified epidemiological data.
Results
Trends in Overall Disease Burden
Overall, there was no significant change in disease burden in all countries from 1992 to 2017 as measured by both median DALYs/100 000 and median deaths/100 000. When examining each income level separately, no significant change was observed in median DALYs/100 000 for all income levels (Figure 1). There was a significant decrease in deaths/100 000 in high income countries (P < .001) and upper-middle income countries (P = .028). No significant change was observed in deaths/100,000 in lower-middle income and low income countries (Figure 2).
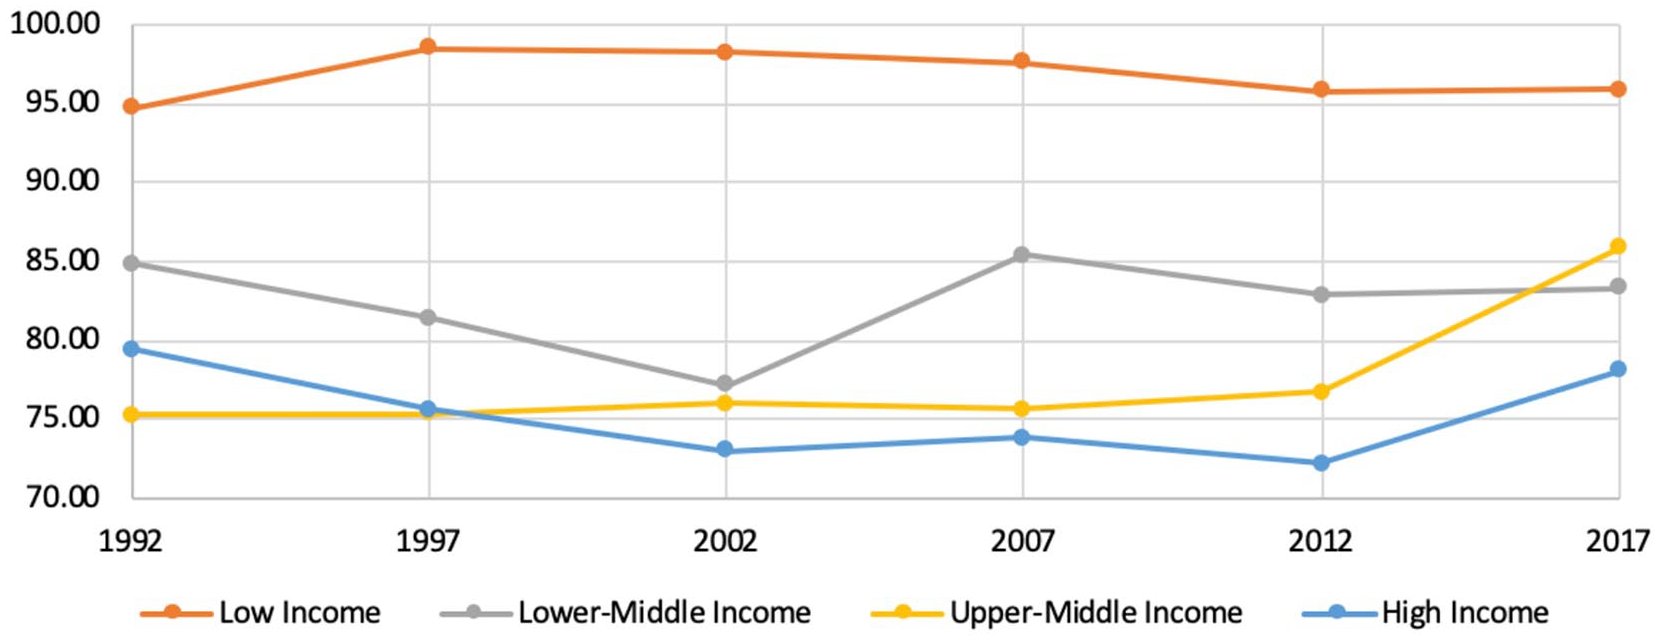
DALYs/100 000 by income level from 1992 to 2017.

Deaths/100 000 by income level from 1992 to 2017.
The geographical distribution of disease remained fairly consistent throughout this time period with certain regions being disproportionately affected. This predominantly included parts of northern Africa, the Middle East, and Eastern Europe (Figure 3).

DALYs/100 000 by Country from 1992 to 2017 (from GBD Data Visualization Tool). 24
Health Disparities in Disease Burden
A significant difference was observed across different income levels in the distribution of median DALYs/100 000 (P < .005) at each 5-year time interval. In all of the years examined, a significant difference was observed across different income levels in the distribution of median deaths/100 000 (P < .001). In all of the years examined, the median DALYs/100 000 in high income countries was significantly lower than that in low income countries. In 4 out of the 6 years studied, there was also a significant difference in median DALYs/100 000 between upper-middle income countries and low income countries. In 2017, the median DALYs/100 000 in low income countries was significantly greater than in all other income level groups.
For all of the years examined, a median deaths/100 000 were observed to be significantly lower in those in high income countries and upper-middle income countries. In 4 of the 6 years examined, median deaths/100 000 were significantly greater in lower-middle income countries compared to high income countries. In 2012 and 2017, there was a significant difference between each of the income level classification groups.
All of the results from this analysis with their associated significance values can be found in Tables 5 and 6.
Comparisons of Median DALYs/100 000 between Different Income Level Groups from 1992 to 2017.

Comparisons of Median Deaths/100 000 between Different Income Level Groups from 1992 to 2017.

DALYs & Deaths Averted
For each year studied, the largest proportion of DALYs and more than half of all deaths related to congenital musculoskeletal disease occurred in the low income countries. In 2017, if the burden of disease in LMICs was decreased to that in HICs, a considerable amount of death and disability due to congenital musculoskeletal disease could be prevented. This includes about 10% of all DALYs and 70% of all deaths attributable to congenital musculoskeletal disease in LMICs (Table 7).
Percent of LMIC DALYs and Deaths Attributable to Congenital Musculoskeletal Disease that could be Averted if DALYs/100 000 and Deaths/100 000 from HICs were Applied to LMICs.

Economic Disparities in Disease Burden
Using the human-capital approach, the economic disparities in congenital musculoskeletal disease burden between LMICs and HICs in 2017 was found to be $3.71 billion (in 2020 $USD) (Table 8). Using the VSL approach, the economic burden in 2017 was calculated to be $1.75 billion (in 2020 $USD) (Table 9).
Economic Disparities (in 2020 $USD) in Congenital Musculoskeletal Disease by Income Level and Year from 1992 to 2017 Using the Human-Capital Approach and GNI per Capita as per Purchasing Power Parity (PPP) Calculation.

Economic Disparities (in 2020 $USD) in Congenital Musculoskeletal Disease by Income Level and Year from 1992 to 2017 Using the Value of Statistical Life (VSL) Approach and GNI per Capita as per Purchasing Power Parity (PPP) Calculation.

Discussion
From 1992 to 2017, neither the overall median DALYs/100 000 nor deaths/100 000 changed significantly overall. Significant decreases were observed in only median deaths/100 000 in upper-middle income and high income countries. This suggests a growing disparity in mortality attributable to congenital musculoskeletal disease between income level groups during this time period. The geographical distribution of the burden of disease remained fairly constant, with the most affected regions being in northern Africa, the Middle East, and Eastern Europe.
In all of the years studied, a significant difference was observed between the different income level groups in both median DALYs/100 000 and deaths/100 000. This included a significant difference in median DALYs/100 000 between high income and low income countries in each of the years examined. This also included a significant difference between upper-middle income countries and low income countries in 4 of the 6 years studied. In 2017, the median DALYs/100 000 was significantly greater in low income countries than those in every other income level group. This demonstrates a growing disparity in low income countries compared to countries in all other income level groups. It is also likely that the disparity represented by the difference in DALYs is an underestimate of the true disparity, because it does not control for the lower life expectancies in low income countries. If the burden of disease was equivalent across all income levels, YLLs, YLDs, and DALYs would actually be higher in HICs solely due to the higher life expectancies. However, this is not the case and further demonstrates the considerable disparity that exists between income level groups.
Also, median deaths/100 000 were observed to be significantly higher in low income countries compared to each of the other income level classifications for each of the years examined. This demonstrates a burden of disease in low income countries that is considerably greater than all other countries. This is consistent with previous studies that have demonstrated an inverse relationship between Socio-demographic Index (SDI) and mortality attributable to congenital disorders.4,5,32,33
If the burden of disease in LMICs was equal to that in HICs in 2017, about 70% of the total deaths and 10% of the total DALYs in these countries could be averted. This demonstrates how improved access to care in LMICs could affect morbidity and mortality attributable to congenital musculoskeletal and limb anomalies.
When just considering the avertable DALYs, this amounts to an economic disparity between $1.75 billion and $3.71 billon (in 2020 $USD). However, it is likely that these numbers actually underestimate the true disparity, because both the human capital approach and VSL approach are based on relative GNI per capita. As a result, they assign lower economic value to morbidity in LMICs compared to HICs. Consequently, less weight is given to economic costs in LMICs and the disparity is reported as lower than the otherwise might be. For example, in 2017, the GNI per capita in Luxembourg was more than 96 times higher than that in Burundi. Therefore, even if both countries had the same true burden of disease, as measured by DALYs, the economic cost of the total DALYs incurred in Luxembourg would be more than 96 times those incurred in Burundi. Therefore, the true economic disparity between LMICs and HICs attributable to congenital musculoskeletal disease is likely much higher than that which was calculated in this study using the human capital approach and VSL approach.
Large disparities exist in access to healthcare worldwide, with previous studies demonstrating an association between socioeconomic status and poor health outcomes.34-36 Vulnerable populations, such as pregnant women and neonates, are at an increased risk given their dependence on others. 37 Numerous previous studies have demonstrated that a high proportion of congenital disease in developing countries includes musculoskeletal system anomalies.9-17 These diseases can be especially debilitating to affected children and have lifelong psychological, educational, financial, and functional consequences. 22 While numerous non-profit organizations have attempted to address some of these challenges in developing countries, overall disparities in disease burden attributable to congenital musculoskeletal disease have remained largely unchanged over the last 25 years. In fact, significant decreases were only observed in upper-middle income and high income countries. By quantifying the burden of disease attributable to congenital musculoskeletal disorders and identifying the regions which are most affected, pediatric orthopedic surgeons can better direct their global surgery efforts and make the greatest impact in their international work.
Limitations
This study has numerous limitations. First, we could not comment on disease-specific morbidity and mortality, because this data is currently unavailable. The Institute for Health Metrics and Evaluation was contacted regarding this specific data and future plans for incorporation into databases. Also, this study does not comment on country-specific trends in disease burden. Countries’ income level classifications may have changed throughout the period studied, so the comparison between years does not accurately represent any particular country, but rather the overall change of the income level group. Our study also does not account for the wide range of socioeconomic demographics within each country, but rather uses GNI per capita to measure the average socioeconomic status of the entire population in each country. Another limitation of this study is that it does not comment on prevalence of disease, but rather the disease burden, as measured by disability and death.
Conclusion
In the 25 years analyzed in this study, neither the overall morbidity nor mortality attributable to congenital musculoskeletal disease changed significantly. Significant decreases in mortality were only observed in upper-middle income and high income countries. Morbidity and mortality rates in low income countries were significantly higher than those in high income countries for all of the years examined. In 2017, a significant difference in mortality rates was observed between all income level groups. If the burden of disease in LMICs was equal to that in HICs, 10% of all DALYs and 70% of all deaths attributable to congenital musculoskeletal disease in LMICs would be averted. This equates to an economic disparity between $1.75 billion and $3.71 billon (in 2020 $USD).
Footnotes
Author Contributions
All authors contributed to study design, completion, and analysis, including manuscript writing and review.
Declaration of Conflicting Interests
The author(s) declared no potential conflicts of interest with respect to the research, authorship, and/or publication of this article.
Funding
The author(s) received no financial support for the research, authorship, and/or publication of this article.