
Abstract
Type 1 diabetes (T1D) is mainly a disease of children and young adults. Diabetic nephropathy (DN) is a common finding in diabetic patients. Microalbuminuria is the earliest clinical evidence of DN. Aim of the study was analysis of clinical, laboratory, instrumental, anamnestic examinations data in pediatric patients with T1D and early stage of DN in order to evaluate possible factors associated with early stage of DN and predictors of DN development and progression. A survey of 105 children (62 males, 43 females) with T1D and DN aged 5 to 17 years in Endocrinology unit on Clinical Pediatric Hospital №6 (Kyiv, Ukraine) done. Following clinical and biochemical characteristics found associated with an early DN: inflammatory phenotype (increased ESR, decreased albumin/globulin ratio), functional cardiovascular disorders (increased systolic blood pressure, “minor” ECG changes), signs of secondary metabolic disorders (high HbA1c, increased serum cholesterol level, increase ALAT and ASAT levels). Kidney function impairment at early stage of DN shows: higher MAU grade, GFR decline, rise in serum creatinine level as compared to T1D group. Presence of concomitant kidney and endocrine disease; positive family history found in a bigger number of patients with DN. DKA episodes number found as a factor associated with higher levels of MAU in children with DN. Patients who had microalbuminuria and more than 5 episodes of DKA/year (poorly controlled T1D) have higher progression rate to macroalbuminuria as compared to those who have less than 5 episodes of DKA/year after a 6-year follow-up study.
Introduction
Diabetes mellitus (DM) is a leading epidemic of the present world. 1 It is considered the leading cause of death among end-stage renal disease (ESRD) patients. According to the International Diabetes Federation, there were 366 million people with diabetes in 2011 and this figure is expected to increase to 500 million by 2030.1,2 The complications associated with diabetes mellitus have boosted the number of deaths in the last years. These complications are the result of long lasting effects of diabetes mellitus on the glomerular microvasculature of the kidney. Diabetic nephropathy (DN) develops in patients withing several years since the T1D oncet. Renal failure is the leading cause of mortality among diabetic patients.3,4
DN is characterized by increased urinary albumin excretion in the absence of other renal diseases.5,6 Microalbuminuria (MALB) is the appearance of albumin in urine ≥30 mg/day or 20 μg/minute and has been documented to be the earliest clinical evidence of DN in DM patients. Without specific intervention, patients with MALB have their urinary albumin excretions increased and eventually end up with endstage renal disease.7,8
Assessment of MALB is not a routine test. Usually, the clinic requests for the traditional serum renal biomarkers (serum uric acid, urea, and creatinine levels). Although these tests are requested for by the attending physicians, they are not based on evidence to benefit the diabetic patients directly. Microalbuminuria is an early component in a continuum of progressive increases in albumin excretion rates (AERs) that usually characterizes DN. 9
Early prediction of DN based on microalbuminuria detection in complex with clinical, laboratory, instrumental, anamnestic examinations data specifically for T1D patients is important for risk stratification and T1D management. Common predictors across studies as well as across types of microvascular complications included age, gender, diabetes duration, BMI, blood pressure, lipid level, and mean or a single HbA1C value.10-15 Beside clinical parameters different molecular markers studied in terms of DN prediction. However, complex analysis of the clinical, basic laboratory, instrumental tests data, anamnestic data in not done in pediatric patients with T1D and early stage of DM as yet.
Here is this study we analyzed clinical, laboratory, instrumental, anamnestic data in pediatric patients with T1D and early stage of DN in order to evaluate possible predictors of DN development and progression.
Material and Methods
A survey of 105 children (62 males, 43 females) with T1D and DN aged 5 to 17 years in Endocrinology unit of Clinical Pediatric Hospital №6 (Kyiv, Ukraine) done. Informed consent taken from all patients and their families. The study was approved by the hospital local ethics committee. All informed consents were signed by children (≥12 years old) themselves and/or by their parents and kept in medical records. Study conducted in Clinical Pediatric Hospital №6 where the Clinical Base of the Department of Pediatrics №4 of Bogomolets National Medical University located. Records data including anamnesis analyzed in all patients. Complex examination including conventional methods (physical examination, blood pressure measurement, blood tests, study of urinary sediment, renal ultrasound, ECG, etc.) done to all patients. Urinary microalbumin excretion measured in 24-hour urine collection samples using basic conventional technique established in Clinical Pediatric Hospital №6.
Glomerular filtration rate (GFR) used to assess kidney function. Schwartz formula for children and adolescents 1 to 17 years old used 16 :

The data expressed as means ± SEM and as frequencies and percentages when appropriate. ANOVA followed by the post hoc test and nonparametric test (Mann-Whitney U test) were used to test significance of differences. Baseline demographic and clinical characteristics of T1D group and DN group compared using Pearson chi-squared test. Pearson correlation used to study the correlation between factors. The fraction developing macroalbuminuria at different times for different subgroups assessed with Kaplan–Meier plots and compared by Gehan-Breslow-Wilcoxon test. Data processed using GraphPad Prism 9.0 Software for Windows (USA, San Diego, CA). P values <.05 considered statistically significant.
Results
Clinical Characteristics of Patients
The study designed as an analysis covered data from 2018 to 2021 including children with T1DM and early stage of DN followed-up in the Endocrinology unit of Clinical Pediatric Hospital №6 (Kyiv, Ukraine). All patients were seen every 3 months and all were on multiple flexible dosing intervals of insulin treatment. Chronological age, diabetes duration, weight, height, body mass index (BMI), blood pressure, Hb1Ac, serum cholesterol, complete blood count, urinalysis, kidney function markers recorded at each visit to hospital.
The demographic and clinical variables features of the studied population are described in Table 1. Group entitled T1D (n = 57) were patients with the average disease duration 4.9 ± 0.5 years. DN group (n = 48) were children with DN observed during 1 year after the first documented episode of albuminuria. The average T1D duration in this group is 6.0 ± 0.51 years (P > .05). Gender distribution of patients in T1D—29 boys and 28 girls, in DN group—33 boys and 15 girls. Average age of children from T1D group—13.96 ± 1.09 years, in DN group—13.96 ± 1.09 years (P > .05). Average boys age in T1D group—14.07 ± 1.71 years, average girls age—13.85 ± 1.33 years (P > .05). Average boys age in DN group—12.82 ± 0.76 years, average girls age—14.2 ± 0.66 years (P > .05).
Clinical Characteristics of Patients.
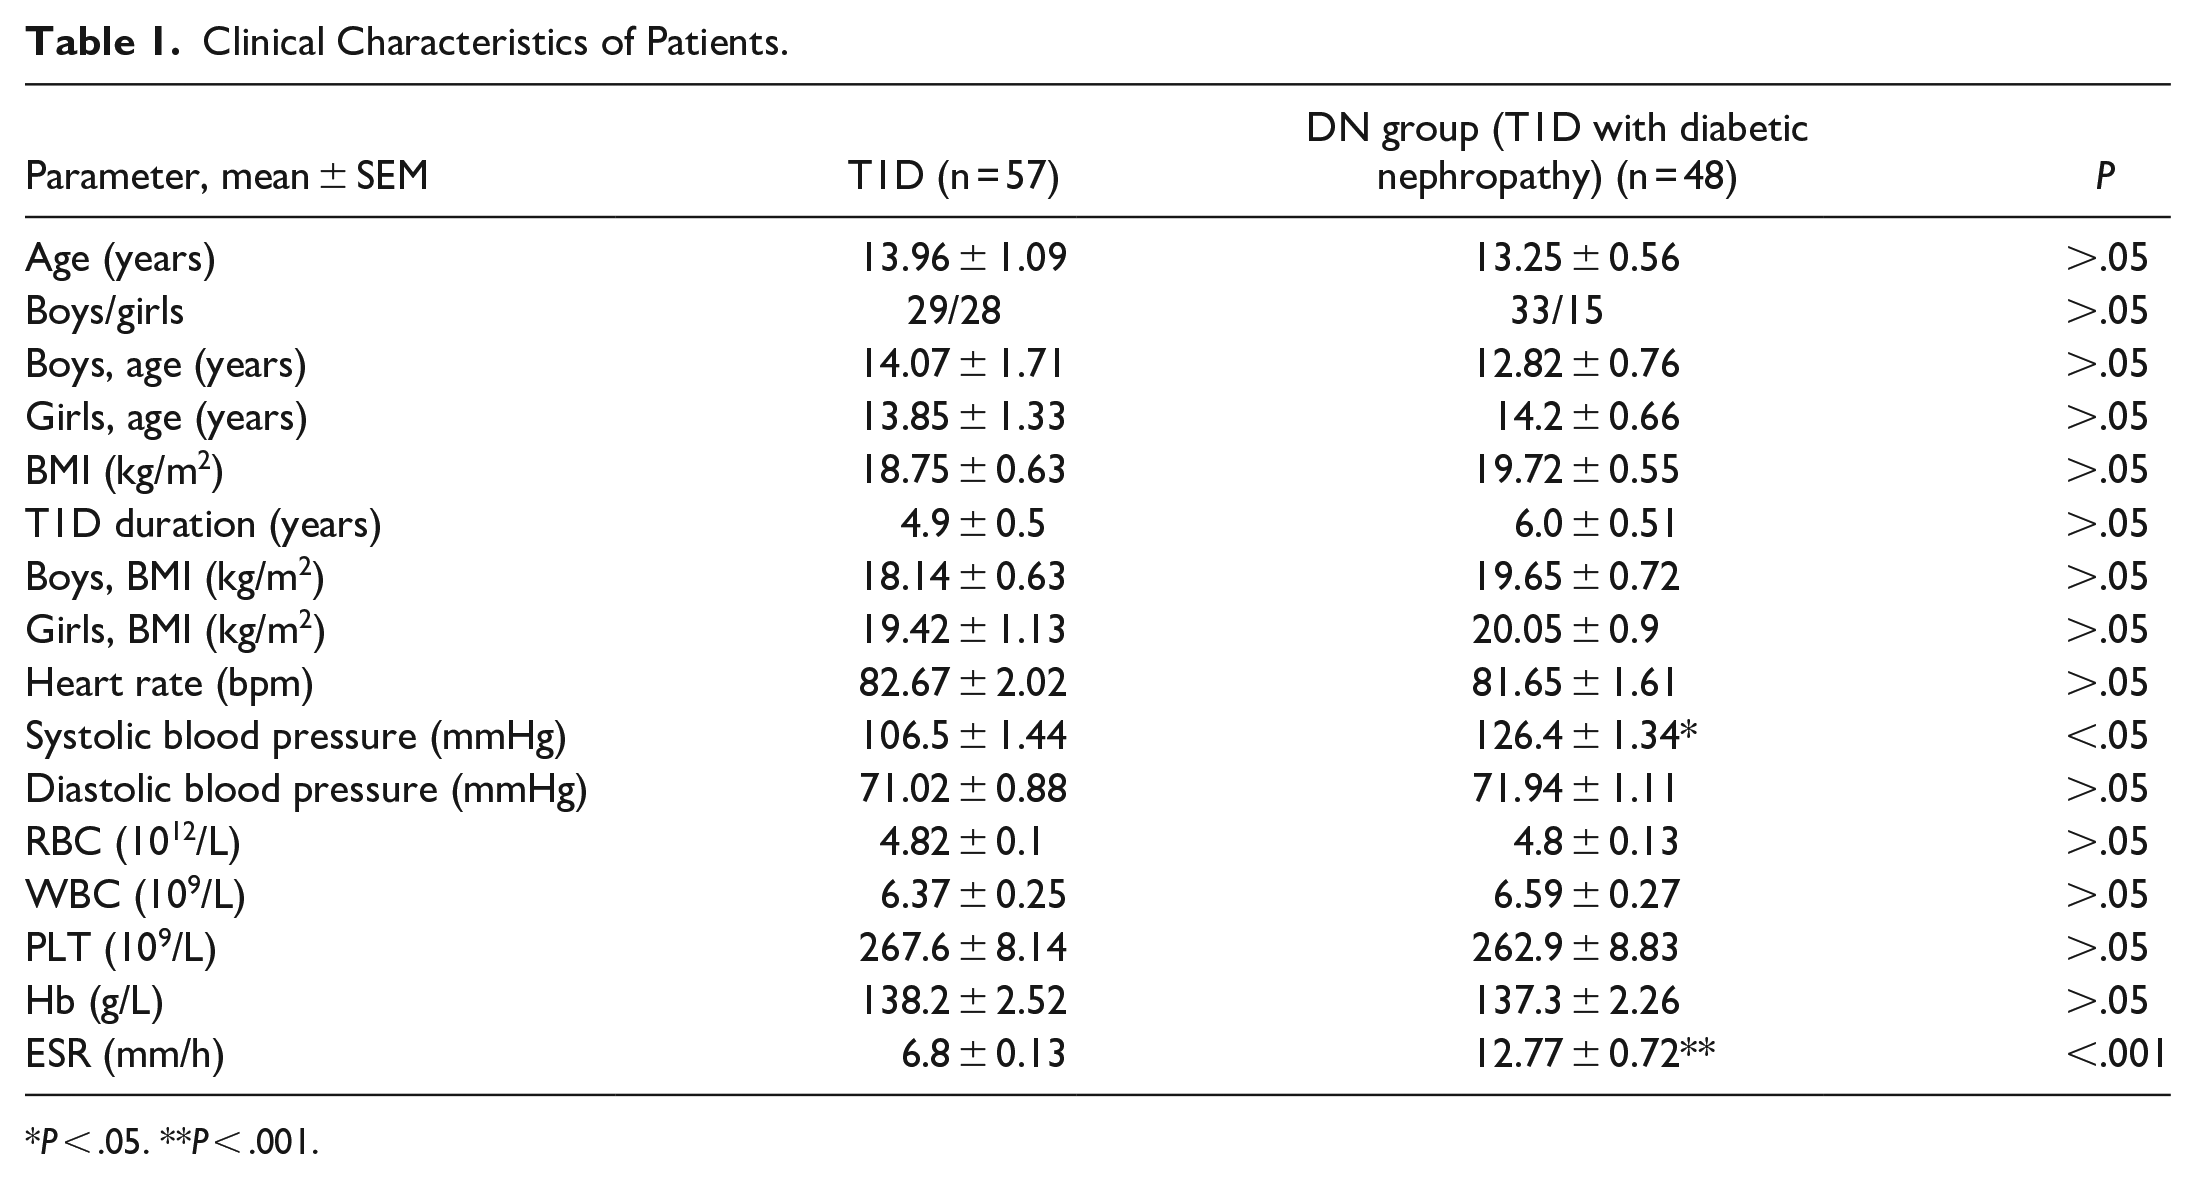
P < .05. **P < .001.
Body mass index (BMI) analyzed in all children included into the study. Average value in T1D group was 18.75 ± 0.63 kg/m2, in DN group—19.72 ± 0.55 (P > .05). Average BMI in boys from T1D group—18.14 ± 0.63 kg/m2, from DN group—19.65 ± 0.72 kg/m2 (P > .05). BMI values in girls from T1D group—19.42 ± 1.13 kg/m2, in DN group—20.05 ± 0.9 kg/m2 (P > .05).
Heart rate values and blood BP measured at appointment prior to inclusion to the study. Heart rate value in T1D group—82.67 ± 2.02 bpm, in DN group—81.65 ± 1.61 bpm (P > .05). T1D systolic BP—106.5 ± 1.44 is significantly lower as compared to DN group value—126.4 ± 1.34 (P < .05). Diastolic BP values were not different in T1D and DN group—71.02 ± 0.88 and 71.94 ± 1.11 mmHg, respectively (P > .05).
Complete blood count analyzed in all patients. RTC, WBC, PLT, Hb, ESR data analyzed and compared. RBC values in T1D group and DN group did not show any difference—4.82 ± 0.1 1012 and 4.8 ± 0.13 1012/L, respectively (P > .05). No difference in WBC count found in examined groups. T1D group value was 6.37 ± 0.25 109/L, DN group value—6.59 ± 0.27 109/L (P > .05). PLT count was 267.6 ± 8.14 109/L in T1D group and 262.9 ± 8.83 109/L in DN group (P > .05). No differences found between T1D and DN group values in Hb level—138.2 ± 2.52 and 137.3 ± 2.26 g/L, respectively (P > .05). ESR level was higher in DN group as compared to T1D group—12.77 ± 0.72 and 6.8 ± 0.13 mm/hour, respectively (P < .01).
Biochemical Parameters in Children With T1D and DN
Glucose metabolism parameters, that is, blood glucose level, level of Hb1Ac measured before inclusion into the study, analyzed in all patients. Blood glucose level obtained from all patients at the regular follow-up visit prior to the inclusion to study in T1D group and in DN group did not show any differences (9.9 ± 0.33 vs 9.77 ± 0.49, P > .05) (Figure 1A). Hb1Ac level as a marker of D1T compensation was significantly higher in DN group as compared to T1D group (10.21 ± 0.33 vs 8.41 ± 0.3, P < .05) (Figure 1B).
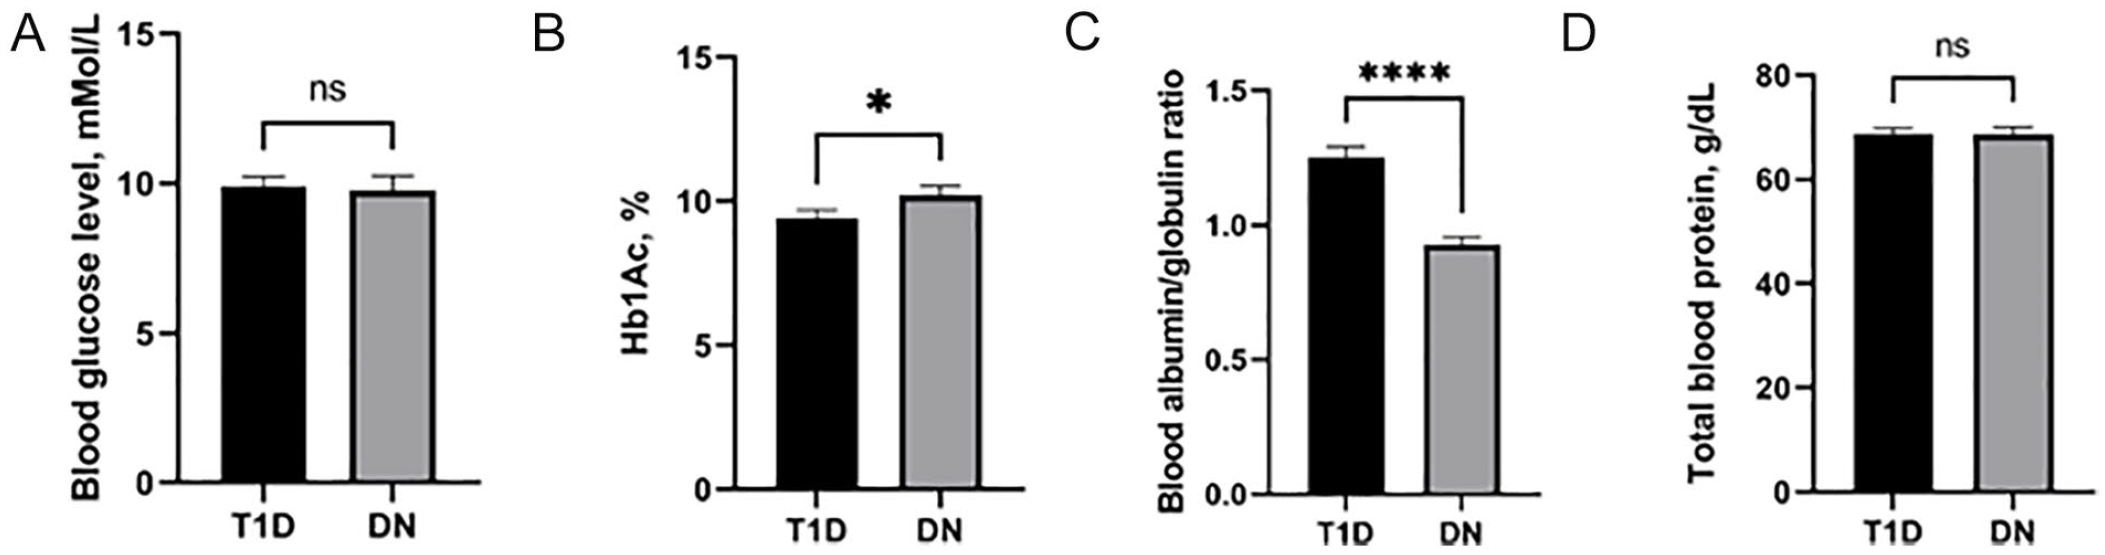
Glucose and albumin metabolism markers in T1D and early stage DN patients. Blood glucose level (A). Hb1Ac level (B). Blood albumin/globulin ratio (C). Total blood protein level (D).
Albumin/globulin ratio evaluated at higher level in T1D group as compared to DN group—1.26 ± 0.04 and 0.93 ± 0.03 (P < .0001) (Figure 1C). Total blood protein level did not show any differences in T1D and DN group—68.8 ± 1.03 and 68.73 ± 1.3 g/L, respectively (P > .05) (Figure 1D).
We analyzed levels of blood cholesterol in all patients included into the study. Our results show that children from T1D group have lower value as compared to DN value—4.58 ± 0.15 mmol/L in T1D versus and 4.94 ± 0.14 mmol/L (P < .05) (Figure 2A). Markers of liver cells function ALAT and ASAT analyzed. Results show higher level of ASAT in DN group as compared to T1D group—28.72 ± 7.18 and 18.11 ± 1.03 IU/L, respectively. However, difference was not statistically significant (P > .05). The same trend observed with ASAT levels—28.92 ± 4.36 IU/L in DN group versus 23.9 ± 1.12 IU/L in T1D group (P > .05) (Figure 2B and C).

Lipids metabolism and liver function markers in T1D and early stage DN patients. Serum cholesterol level (A).ALAT level (B). ASAT level (C).
Serum creatinine level, serum urea level, GFR, MAU excretion, urine sediment analysis done in order to evaluate a kidney function in all children. No differences in blood urea level found in T1D and DN groups—4.54 ± 0.21 and 4.44 ± 0.26 mmol/L, respectively (P > .05) (Figure 3A). Serum creatinine level was 65.8 ± 2.02 mcmol/L in DN group versus 57.62 ± 2.22 mcmol/L in T1D group (P < .001) (Figure 3B).

Kidney functions markers in T1D and early stage DN patients. Blood urea level (A). Serum creatinine level (B). GFR (C). MAU (D). Urine sediment (E).
In children with T1D GFR documented at level 106.9 ± 2.11 mL/minute/1.73 m2 which is statistically different as compared to DN group value—85.87 ± 2.19 mL/minute/1.73 m2 (P < .0001) (Figure 3C). MAU excretion in T1D group—6.14 ± 0.64 mg/24 hours in DN group—61.4 ± 9.11 mg/24 hours (P < .0001) (Figure 3D). Routine urine sediment analysis done in all patients included into the study. Number of RBC/HPF analyzed. Number of RBC/HPF in T1D group was significantly lower in T1D group in comparison to DN group—0.37 ± 0.22 RBC/HPF versus 3.46 ± 0.56 RBC/HPF (P < .0001) (Figure 3E).
Basic Instrumental Examinations Data, Anamnestic Data in Children With T1D and Early Stage of DN
We analyzed electrocardiogram records of all children from T1D and DN groups. All participants shown only minor ECG abnormalities. Minor ECG abnormalities included: minor isolated Q/-QS waves; minor isolated ST/-T abnormalities; high R waves; low ST segment; incomplete (left and right) bundle branch block; minor QT prolongation; short PR interval; frequent ventricular premature beats; and other minor arrhythmias. Percentage of patients with minor ECG abnormalities was lower in T1D as compared to DN groups—72.7% versus 84.6% (P < .05) (Figure 4A). Ultrasound findings of liver damage (a hyperechogenic liver and/or hepatomegaly on ultrasound) found in 33.3% of children in T1D group and in 25.5% in DN group (P < .05) (Figure 4B). Long-term diabetes complications, that is, diabetic neuropathy documented in 22.8% of patients with T1D and in 17% of patients with DN (P < .05) (Figure 4C).

Basic instrumental examinations data, anamnestic data in children with T1D and early stage of DN. ECG changes (A). Sonography signs of liver damage (B). Diabetic neuropathy (C). Concomitant kidney diseases (D). Concomitant endocrine diseases (E). Allergies (F). T1D in relatives (G).
Concomitant diseases incidence, that is, kidney disorders, endocrine disorders, allergies analyzed in all study participants. Concomitant kidney disorders show 5.26% of patients with T1D and 19.1% children from DN group (P < .01) (Figure 4D); endocrine disorders (ie, autoimmune thyroiditis) found in 12.2% of patients with T1D and in 19.1% with DN (P < .05) (Figure 4E). Allergies incidence did not show statistical difference between groups—5.5% in T1D group versus 8.5% in DN group (P > .05) (Figure 4F). History analysis shows that first-degree relatives of 17.5% patients from T1D group and 23.4% of patients from DN group have T1D (P < .05) (Figure 4G).
Number of DKA episodes in all children included into the study analyzed. Average number of DKA during the last year was higher in DN group as compared to T1D group—1.81 ± 0.14 versus 4.29 ± 0.19 episodes/year (P < .0001) (Figure 5A). Correlation analysis shown positive relation between number of DKA/year and MAU value in DN group (r = .53, 95% CI 0.2886-0.7071, P < .001) (Figure 5B). Subsequently, we calculated Kaplan–Meier estimated the fraction developing macroalbuminuria at different times for each subgroup and used a Gehan-Breslow-Wilcoxon test to measure statistical significance among the 2 groups. The statistical results showed that patients who had microalbuminuria and more than 5 episodes of DKA/year (poorly controlled T1D) have higher progression rate to macroalbuminuria as compared to those who have less than 5 episodes of DKA/year after a 6-year follow-up study (P = .01) (Figure 5C).

DKA incidence in T1D and early stage DN patients (A). Correlation analysis between DKA episodes/year and MAU level in children with DN (B). ****P < .0001. Time to estimate the progression to macroalbuminuria in children with T1D and microalbuminuria (C).
Discussion
Diabetic nephropathy is the leading cause of end-stage renal disease. Patients with diabetic nephropathy have a high cardiovascular risk, comparable to patients with coronary heart disease. Identification and management of risk factors for diabetic nephropathy as well as timely diagnosis and prompt management of the condition are of great importance for effective prevention and treatment. A variety of risk factors promotes the development and progression of diabetic nephropathy, including elevated glucose levels, long duration of diabetes, high blood pressure, obesity, and dyslipidemia. Most of these risk factors are modifiable by antidiabetic, antihypertensive, or lipid-lowering treatment and lifestyle changes. 17
Recent advances have produced an explosion of “novel” assay-based risk markers for DN, though clinical use remains restricted. Although many patients with progressive DN follow a classical albuminuria-based pathway. Non-albuminuric way of DN progression is now well-recognized, however not well studied in children with T1D and DN. 18
The development of multifactorial “renal risk equations” for type 2 diabetes has the potential to simplify the task of DN prognosis; however, there are currently none for type 1 diabetes-specific populations. Here in this study we focused our attention on complex approach in studying the clinical, anamnestic, basic laboratory, and instrumental tests results in children with T1D and early stage of DN.
Here in this study we used approach of an early detection of microalbuminuria in complex with analysis of clinical, laboratory, instrumental, anamnestic examination data in children with T1D and DN. Analysis of basic clinical parameters—age/gender distribution have not found differences between T1D and DN groups. T1D duration was somewhat higher in DN group in comparison to T1D group. However, difference was not statistically significant.
In our study we analyzed basic parameters of CBC analysis—RBC, WBC, PLT, ESR. Our results show statistically significant difference in ESR level while comparing T1D and DN group with higher value in DN children. Elevated ESR in line with decreased albumin/globulin ratio in DN patients with an early stage of disease might assumed as a presence of inflammatory phenotype in this group of children.
Functional tests of cardiovascular system, that is, BP, HR, shown significantly higher difference in systolic blood pressure in DN group as compared to T1D group. That is a sigh of the early cardiovascular disorders in children with DN at its early stage during the first year since MAU episode documented.
Glucose metabolism parameters, that is, blood glucose level at admission, level of Hb1Ac, analyzed in all patients included into the study. Among those markers only Hb1Ac level found statistically higher in DN children in comparison to T1D group.
Serum cholesterol level evaluated at higher level in DN patients as compared to T1D group. Previously shown that in addition to hypertension, glycemic control and genetic influence, diabetic dyslipidemia seems to play an important role in the pathogenesis and progression of vascular disease in the diabetic patient and it is under discussion if it plays a role in the evolution of DN. 19
Interestingly, all patients with early stage of DN have increased levels of kidney function markers—ALAT, ASAT as compared to T1D patients. However, difference between T1D group and DN group was not significant. The serum levels of the liver enzymes ALAT, ASAT are markers of aggression against hepatocytes. Liver disorder is known to be a risk factor for Diabetes Mellitus (DM) and diabetic patients are at risk of developing liver disorders. We show that even early stage of DN is associated with signs of liver dysfunction. 20
Serum creatinine level, serum urea level, GFR, MAU excretion, urine sediment analysis done in order to evaluate a kidney function in all children. Early signs of kidney function impairment in children with DN associated with increased level of serum creatinine but now urea, moderate decrease of GFR, increased MAU excretion and urinalysis changes (erythrocyturia).
Instrumental examination data analyzed in all patients included into the study. ECG results shown that children with DN have higher level of minor ECG changes. We speculate that latter is a result of functional changes in myocardium due to metabolic disorders associated with DN. Ultrasound evaluations shown that higher number of patients with sigh of liver damage present in T1D group but not in DN group. At the same time level of liver cells damage markers, that is, ALAT, ASAT documented at higher level in DN group patients. This might be a sign of primary structural tissue changes in liver in early DN with subsequent cellular damage leading to ALAT and ASAT rise.
Beside clinical, laboratory, and instrumental examinations we analyzed anamnestic data, presence of concomitant kidney and endocrine diseases, allergies in all patients with T1D and DN. Results show that long-term diabetes complications, that is, diabetic neuropathy documented in higher number T1D patients as compared to DN group. Reason of the latter might be a genetic polymorphism predisposing a neuropathy development. 21 Concomitant kidney disorders, endocrine disorders found in significantly higher children from DN group. Allergies incidence did not show statistical difference between groups. History analysis shows that first-degree relatives have T1D in bigger number of DN patients as compared to T1D group patients.
Our data show that number of DKA episodes/year in DN children is significantly higher as compared to T1D children. DKA affects long-term kidney function in diabetic patients. Severe control of T1D in children is a necessary measure in prevention of further kidney damage. Moreover, correlation analysis shown positive direct relation between number of DKA/year and MAU value in DN group. Moreover, patients who had microalbuminuria and more than 5 episodes of DKA/year (poorly controlled T1D) have higher progression rate to macroalbuminuria as compared to those who have less than 5 episodes of DKA/year after a 6-year follow-up study (P = .01)
To summarize, following clinical and biochemical characteristics have been associated with kidney damage and early DN: inflammatory phenotype (increased ESR, decreased albumin/globulin ratio), functional cardiovascular disorders (increased systolic blood pressure, “minor” ECG changes), signs of secondary metabolic disorders (high HbA1c, increased serum cholesterol level, increase ALAT and ASAT levels). Kidney function impairment at early stage of DN shows: higher MAU grade, GFR decline, rise in serum creatinine level as compared to T1D group. Presence of concomitant kidney and endocrine disease; positive family history found in a bigger number of patients with DN. DKA episodes number found as a factor associated with higher levels of MAU in children with DN. Patients who had microalbuminuria and more than 5 episodes of DKA/year (poorly controlled T1D) have higher progression rate to macroalbuminuria as compared to those who have less than 5 episodes of DKA/year after a 6-year follow-up study.
Further progress should be made in the prediction of DN in children with T1D using clinical, laboratory, instrumental data, history in order to elicit the role of several variables, and to consolidate data to facilitate clinical implementation.
Potential limitations of this study is that study did not take into account evaluation of specific markers of kidney injury—kidney injury molecule (KIM-1), gelatinase-associated lipocalin (NGAL) in patients with DN other factors that can potentially have an effect of DN formation. Another disadvantage of this study involves limited number of patients included into the study.
Footnotes
Author Contributions
Ievgeniia A. Burlaka – conceptualization, study desing, review of literature, data analysis, manuscript preparation, manuscript submission.
Inga O. Mityuryayeva – conceptualization, study desing, data analysis, manuscript writing.
Tetiana A. Shevchenko – review of literature, data analysis.
Anastasiia D. Holoborodko – data collection, review of literature.
Ihor V. Kovalchuk, Lilia O. Lantukh – data collection.
Declaration of Conflicting Interests
The author(s) declared no potential conflicts of interest with respect to the research, authorship, and/or publication of this article.
Funding
The author(s) received no financial support for the research, authorship, and/or publication of this article.