
Abstract
Objective:
To determine the anamnestic, clinical, laboratory, instrumental, and functional features in children with type 1 diabetes mellitus (T1D) and subclinical diabetic nephropathy (DN); to assess the diagnostic value of urinary KIM-1 levels.
Methodology:
The study involved 80 children aged 3 to 18 years with type 1 diabetes and/or diabetic nephropathy in compliance with ethical standards. All patients underwent a comprehensive clinical examination, and measurement of KIM-1 levels in urine.
Results:
In DN group the level of KIM-1 was significantly higher than inT1D group. In T1D group KIM-1 strongly correlated with T1D duration, number of DKA episodes/year. In DN group KIM-1 is strongly correlated with T1D duration, MAU and number of DKA episodes/year. T1D duration, MAU and disease status (T1D vs DN) were independent predictors of urinary KIM-1 levels.
Conclusions:
Urinary KIM-1 can be an early biomarker of kidney injury in pediatric patients with T1D, before overt clinical signs of DN.
Introduction
Despite substantial progress in the understanding and prevention of diabetes over the past 2 decades, the global burden of the disease—often termed the “other pandemic”—has continued to escalate rather than decline. 1 Estimates from 2010 indicated that approximately 285 million adults worldwide were living with diabetes mellitus, and projections suggest that this number could rise by as much as 54% to reach about 439 million individuals by 2030. 1 This alarming trend underlines the need for more effective preventive strategies and early diagnostic tools.
Diabetic nephropathy (DN), one of the most common and serious complications of diabetes, develops alongside widespread microvascular damage and frequently occurs in conjunction with macrovascular diseases such as cardiovascular, cerebrovascular, and peripheral arterial disease.2,3 Notably, diabetic patients who develop DN a significantly increased risk of mortality, predominantly driven by cardiovascular complications, compared to diabetic individuals without nephropathy. As such, DN not only diminishes quality of life but also substantially worsens overall prognosis.
Currently, the detection and monitoring of DN is dependent on conventional clinical measures, including blood urea nitrogen levels, serum creatinine concentrations, estimations of glomerular filtration rate (eGFR) using various formulas, and the presence of proteinuria and albuminuria. These tools are widely used in clinical practice, they are relatively imprecise and lack the ability to directly measure structural injury to renal tissues. Moreover, these markers often become abnormal only after significant loss of kidney function has already occurred, limiting their utility for early detection and timely intervention. 4
Emerging evidence suggests that tubular injury, rather than glomerular damage alone, plays a central role in the early pathogenesis of DN. Tubular injury markers detected in the urine have been shown to rise even before the appearance of microalbuminuria, positioning them as potential early indicators of renal dysfunction. This is particularly significant because albuminuria, while a well-recognized marker of glomerular involvement, is not always sensitive enough to capture the initial stages of diabetic nephropathy.
In fact, certain tubular injury markers have been found to be elevated in diabetic individuals who still exhibit normoalbuminuria and maintain a normal estimated glomerular filtration rate (eGFR). 5 These findings point to a previously underappreciated phase of DN—often termed normoalbuminuric DN where traditional markers may fail to reveal ongoing damage. Consequently, there is an urgent need to identify and validate more sensitive, specific, and reliable biomarkers capable of detecting renal injury early, thereby allowing for better risk stratification, timely therapeutic interventions, and ultimately improved clinical outcomes. 6
Kidney injury molecule 1 (KIM-1) is a membrane-bound glycoprotein mainly expressed by proximal tubular cells in the kidney.7,8 In the acute phase, KIM-1 contributes to tissue protection by promoting an anti-inflammatory response, helping epithelial cells engulf apoptotic bodies. However, when KIM-1 remains overexpressed over time, it can drive pathological processes such as persistent inflammation and interstitial fibrosis.9,10
The discovery and implementation of such novel biomarkers could revolutionize the management of DN. Ideal markers would not only be able to detect kidney injury at a subclinical stage but also provide prognostic information regarding disease progression and response to treatment. 11
Thus, availability of novel biomarkers that are sensitive, specific, and precise as well as able to detect kidney injury and predict clinically significant outcomes would be widely useful in DN.
Material and Methods
Patients
A total of 80 children (26 boys, 54 girls) with T1D and/or DN, and a control group, aged 3 to 18 years, were examined. In order to calculate the sample size we used the formula where α = .05 and 80% power, and a pooled SD ≈ 2.60 ng/mL (pilot value from our data). Therefore, a clinically meaningful difference of 2.0 ng/mL would require ~27 patients per group. Our study included 30 children in each patient group (T1D and DN), which provides sufficient power to detect such differences.
The control group consisted of 20 age- and sex-matched healthy children without diabetes or any chronic systemic diseases. Exclusion criteria included cardiovascular, urogenital, and immunological disorders, use of nephrotoxic or anti-inflammatory medications, and dialysis. We excluded patients receiving anti-inflammatory drugs, including NSAIDs, because these agents are known to affect renal tubular function and can alter the expression and urinary excretion of biomarkers such as KIM-1.
The diagnosis of diabetes was made as per recommendation of American diabetic association and diagnosis of diabetic nephropathy was made by performing spot urine protein to check for either the presence of microalbuminuria (30-299 mg/mL) with increased frequency of metabolic syndrome components, stable GFR (creatinine and BUN) and/or macroalbuminuria > 300 mg/mL in 2 of 3 spot urine specimens, progressive GFR decline, hypertension, or any other comorbid. In pediatric patients, DN may manifest initially with glomerular hyperfiltration. Therefore, elevated GFR values in this group were interpreted as consistent with early subclincal DN. DN in this study includes children with albuminuria and/or early hyperfiltration.
A comprehensive examination was performed, including physical examination, blood pressure measurement, blood tests, lipid profile, ECG, ultrasound examinations, etc., which is basic for all patients. Urinary microalbumin excretion measured in 24-hour urine collection samples using the traditional method. Glomerular filtration rate is used to assess renal function. Schwartz formula for children and adolescents aged 1 to 18 years: eGFR = 0.413 ×height/Scr (height—sm, Scr—standardized serum creatinine mg/dL).
Enzyme-Linked Immunosorbent Assay (ELISA)
The level of kidney injury molecule type 1 (KIM-1) in urine samples was determined using a commercial Human KIM-1 ELISA Kit (Cat. No. EH0210, 96 determinations; Wuhan Fine Biotech Co., Ltd, Wuhan, China). The assay was performed according to the manufacturer’s instructions. The kit is for research use only. The procedure included the following main steps: urine was centrifuged, samples and standards were diluted according to the instructions; samples, standards, and labeling blanks were added to the wells of a plate coated with antibodies to KIM-1. The plate was incubated at 37°C for 90 minutes. Biotinylated antibody and streptavidin-HRP were added sequentially with incubation and washing. Substrate (TMB, calorimetric reaction) was added. Stop reagent was used to stop the reaction. Optical density was measured at a wavelength of 450 nm using an ELISA reader. KIM-1 concentration was calculated from a calibration curve.
Statistics
Descriptive statistics method, which includes calculation of Mean, SEM, estimation of reliability of mean value SEM used.
Normality of continuous variables was assessed using the Shapiro–Wilk test and visual estimation of histograms. Normally distributed variables were analyzed using one-way ANOVA with Tukey’s post-hoc test. Non-normally distributed variables were analyzed using the Mann–Whitney U test (2 groups) or the Kruskal–Wallis test with Dunn’s post-hoc correction (3 groups). Correlations were assessed using Spearman’s test. Multiple linear regression was conducted after checking assumptions of normality of residuals, linearity, and absence of multicollinearity. Chi-Square test and Fisher`s Exact test were used to analyze the relationships between categorical variables.
To explore the underlying structure of the data and reduce multicollinearity, principal component analysis (PCA) was applied. Variables were normalized before analysis to prevent scale differences from influencing the component extraction. Components with eigenvalues exceeding 1 were considered significant, and the scree plot was used to confirm the appropriate number of components. The resulting principal components were used in subsequent analyses to capture the main sources of variability in the dataset. Variables with high loading scores on the first principal components (eg, diabetes duration, microalbuminuria, GFR, DKA episodes) were selected and entered individually into multiple regression models.
Two-step clustering done using Statistica 10.0 software. An intelligent clustering method in which the optimal clustering number is automatically determined done. It identifies clusters by 2 processes: first, preclustering, followed by hierarchical clustering. Hierarchical algorithms were used to estimate the optimal clustering number based on the silhouette width, the calculation of the distance using the log-likelihood and clustering in accordance with Schwarz’s Bayesian criterion
Data were processed using GraphPad Prism 10.0 software for Windows (USA, San Diego, California). P values less than .05 are considered statistically significant.
Ethical Approval and Consent to Participate
The study was approved by the ethical review committee of the Bogomolets National Medical University (No. 4/2024). The informed consent with a written signature was obtained upon the agreement from participants after the purpose of study had been explained. All informed consents were signed by the children (from 12 years old) themselves and/or their parents and were stored in the medical records. Study participants were informed to withdraw at any time and/or to refrain from responding to questions. Data obtained from them was kept confidential using code instead of any personal identifiers. Study done in accordance with World Medical Association’s Declaration of Helsinki.
Results
Clinical Characteristics of Patients
The study was conducted from 2024 to 2025 and included children with type 1 diabetes and diabetic nephropathy in the endocrinology department of Children’s Clinical Hospital №. 6 in Kyiv, Ukraine. All patients underwent examination and consultation every 3 months, and all of them (except for the control group) were on flexible dosing intervals of insulin treatment. During each periodic hospital visit, the following indicators were recorded: age, duration of diabetes, weight, height, body mass index (BMI), blood pressure, HbA1c level, fasting glucose level, blood biochemical parameters (total protein, cholesterol, ALT, AST, bilirubin, creatinine, urea), complete blood count, urinalysis and markers of renal function. Results given in Table 1.
Clinical and Laboratory Characteristics of the Patient Base (Mean ± SEM).

P < .05. ***P < .001. ****P < .0001.
The study included: 30 children—T1D, 30 children—DN, and 20 children of the control group. In the T1D group, the mean age was 11.9 ± 0.6, in the DN group, in the control group—13.5 ± 0.9 (P > .05; Figure 1).

Age values in examined children. P > .05. Data expressed as Mean ± SEM.
The gender distribution of patients in T1D group was 9 boys and 21 girls, in the DN group—8 boys and 22 girls (P > .05), in the control group—9 and 11, respectively. The average duration of T1D in T1D group was 6.5 ± 0.6 years, in DN group − 9.9 ± 0.5 years (P < .001; Figure 2).

Duration of diabetes in examined children. ***P < .001. Data expressed as Mean ± SEM.
In group of children with T1D the lowest BMI observed—17.01 ± 0.5 kg/m2. In group of children with DN—18.7 ± 0.5 kg/m2. In control group BMI was 19.7 ± 0.6 kg/m2 (P < .01, Control vs T1D), (P > .05, Control vs DN), (P < .05, T1D vs DN; Figure 3).

BMI values in examined children. Control groups. *P < .05; **P < .01. Data expressed as Mean ± SEM.
The highest heart rate value was detected in T1D group—84.2 ± 2.1 bpm, in DN group—79.6 ± 1.4, the lowest one was in control group—76.9 ± 2.5 bpm (P < .05, Control vs T1D), (P > .05 Control vs DN), (P > .05 T1D vs DN). Systolic blood pressure measurements in T1D, DN and control groups were 106.8 ± 3.6 mmHg, 103.2 ± 3.9 mmHg, and 108.2 ± 3.8 mmHg respectively (P > .05). T1D diastolic blood pressure—67.9 ± 2.6 mmHg, in DN group—64.9 ± 2.9 mmHg, control group—69.9 ± 3.7 mmHg (P > .05). The differences weren’t statistically significant.
Complete blood count (RBC, Hb, etc) was analyzed and compared in all groups. RBC values in T1D and DN group were the same—4.3 ± 0.1 1012/L, while in control group 4.2 ± 0.1 1012/L (P > .05). No difference in Hb level found, that is, in T1D group—134.4 ± 2.6 g/L, in DN group—135.3 ± 2.8 g/L, in control group—138 ± 3.6 g/L (P > .05). WBC in T1D group—5.1 ± 0.3 109/L, in DN group—4.5 ± 0.1 109/L, control group—4.4 ± 0.1 109/L (P > .05). PLT level was 255.5 ± 11.3 109/L in T1D group, 252.9 ± 7.2 109/L in DN group and 266.8 ± 13.6 109/L in control group (P > .05). There weren’t differences between groups in ESR level—5.0 ± 0.5 mm/h, 4.6 ± 0.4 mm/h, and 4.4 ± 0.5 mm/h, respectively (P > .05).
We analyzed laboratory biomarkers in all study groups. Total blood protein values didn’t show any differences: T1D group—63.1 ± 0.7 g/L, DN group—63.2 ± 0.6 g/L, control group—63.2 ± 0.9 g/L (P > .05). Cholesterol level was the same in T1D and DN groups—3.9 ± 0.1 mMol/L, in control group—4.0 ± 0.1 mMol/L (P > .05). In T1D group ALAT was 16.4 ± 0.9 U/L, in DN group—15.9 ± 0.8 U/L, in control group—14.6 ± 0.8 (P > .05). However, the ASAT level in T1D group was higher—25.3 ± 1.1 U/L than value of DN group—18.7 ± 1.7 U/L and 16.6 ± 2.1 U/L in control group (P < .01, Control vs T1D), (P > .05, Control vs DN), (P < .05, T1D vs DN). The highest serum creatinine level observed in T1D group—67.1 ± 2.4 mMol/L, in DN group—57.7 ± 2.8 mMol/L and 65.5 ± 2.3 mMol/L in control group (P < .05, T1D vs DN), (P > .05, Control vs DN), P > .05, Control vs T1D). Bilirubin level didn’t show significant differences in our groups: T1D group—7.8 ± 0.4 mMol/L, DN group—9.3 ± 0.4 mMol/L, control group—9.2 ± 0.5 mMol/L (P > .05). The same goes to urea levels,—3.7 ± 0.2 mMol/L, 3.6 ± 0.1 mMol/L, and 3.8 ± 0.1 mMol/L respectively (P > .05; Figure 4).

Laboratory biomarkers in examined children. ns—P > .05, *P < .05, ** P < .01. Data expressed as Mean ± SEM.
Glucose metabolism parameters, such as blood glucose level and Hb1Ac were also examined in our study groups. Mean blood glucose level in T1D and DN groups were 10.7 ± 0.4 mMol/L and 10.4 ± 0.3 mMol/L, respectively. And 4.0 ± 0.1 mMol/L in control group (P < .0001, Control vs T1D), (P < .0001, Control vs DN), (P > .05 T1D vs DN). Hb1Ac in T1D group—8.6 ± 0.4%, in DN group—8.7 ± 0.2% while in control group—4.5 ± 0.1% (P < .0001, Control vs T1D), (P < .0001, Control vs T1D), (P > .05, T1D vs DN). Diabetic ketoacidosis episodes in T1D and DN group were 2.4 ± 0.1 per year and 2.8 ± 0.2 per year respectively (P > .05; Figure 5).

Glucose metabolism parameters in examined children. ns—P > .05. Data expressed as Mean ± SEM.
In group of children with T1D the level of microalbuminuria was 3.4 ± 1.2 mg/day, much higher level observed in DN group—51.9 ± 7.4 mg/day (P < .0001). Glomerular filtration rate in T1D group—79.8 ± 1.4 mL/min/1.73m2, in DN group—117.3 ± 2.1 mL/min/1.73m2, in control group—93.2 ± 2.5 mL/min/1.73m2 (P < .01, Control vs T1D), (P < .001, Control vs DN), (P < .0001, T1D vs DN; Figure 6).

Markers of renal dysfunction in examined children. ****P < .0001. Data expressed as Mean ± SEM.
Urine Kidney Injury Molecule-1 in Children With T1D and/or DN
Among the various candidate biomarkers of tubular injury, we selected kidney injury molecule-1 (KIM-1) because it is a proximal tubular glycoprotein with minimal expression in healthy kidneys but marked upregulation after injury. Compared with other markers such as neutrophil gelatinase-associated lipocalin (NGAL), cystatin C, liver-type fatty acid binding protein (L-FABP), KIM-1 known to have a higher specificity for tubular epithelial damage and has been validated in experimental studies as an early indicator of diabetic kidney injury.
In group of children with T1D urine KIM-1 level was 4.73 ± 0.3 ng/mL, while in group of children with DN—10.85 ± 0.6 ng/mL. While control group value was 1.2 ± 0.2 ng/mL (P < .0001; Figure 7).

KIM-1 levels in examined children. ***P < .001, ****P < .0001. Data expressed as Mean ± SEM.
Spearman’s correlation was performed to correlate the main factors that were found to be interrelated and those that determine the progression of diabetic nephropathy (Figure 8).
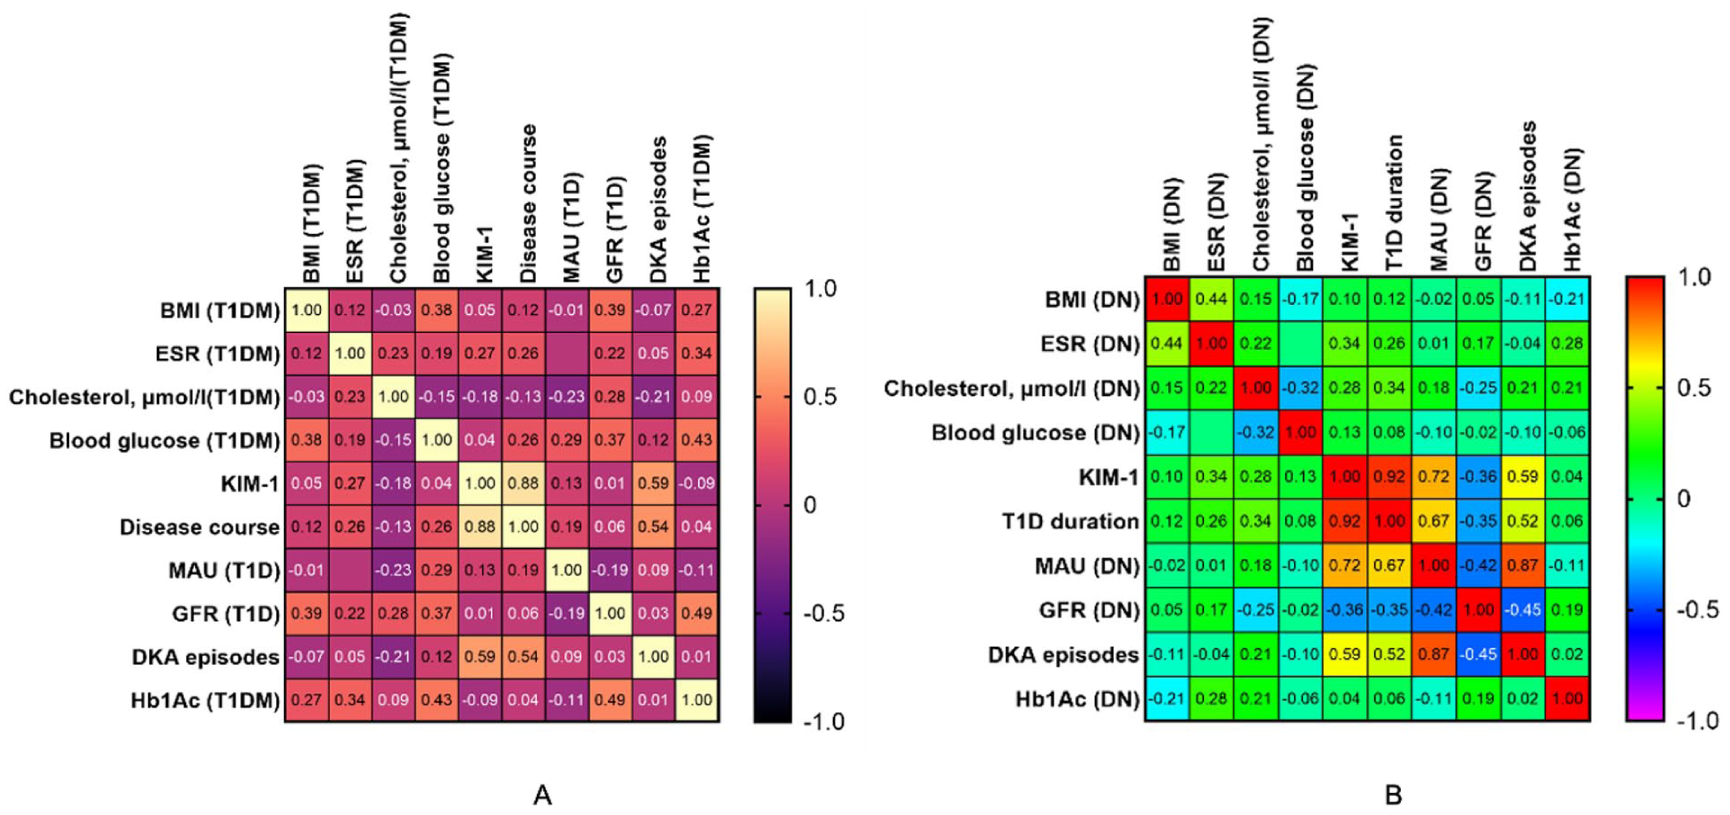
Heat map of correlations between clinical and laboratory parameters and KIM-1 in patients with T1D (A) and DN (B).
In T1D group KIM-1 strongly correlated with diabetes duration (r = .88, P < .001) and DKA episodes (r = .553, P < .001). In DN group KIM-1 is strongly correlated with T1D duration (r = .935, P < .001), MAU (r = .734, P < .001) and DKA episodes (r = .550, P < .001).
To examine whether changes of KIM-1 levels were distinct in relation to other clinical and laboratory disorders, we evaluated its relationship with T1D, GFR, MAU, DKA episodes/year, complete blood count data (WBC, PLT, ESR), serum creatinine, urea, blood glucose, HbA1c levels using principal component analysis in all 60 patients with T1D with/without DN.
The results of the principal component analysis showed distinct relationships between KIM-1 and serum creatinine (Figure 9). KIM-1, which was linearly correlated with GFR, MAU, T1D duration, and number of DKA episodes/year. The correlation between KIM-1 and MAU level was the strongest, with a correlation coefficient of .50 [95% confidence interval (CI) 0.41-0.59]. These characteristics of KIM-1 were preserved when patients with T1D only and T1D and DN were analyzed together (Figure 9).

Principal component analysis laboratory biomarkers and systemic parameters in children with T1D and/or DN.
Multiple linear regression analysis was done to reveal the best predictor of KIM-1 activation in patients with T1D with/without DN. There were T1D (CI: −6.298 to −1.301, P < .01), MAU (CI: 0.0005-0.043, P < .05), T1D duration (CI: 0.3557 to 0.6155, P < .0001; Table 2).
Linear Regression Analysis of the Risk Factors of KIM-1 Activation.

Based on PCA following parameters were chosen,—T1D Duration (years), GFR, KIM-1, MAU, DKA (Figure 10A).
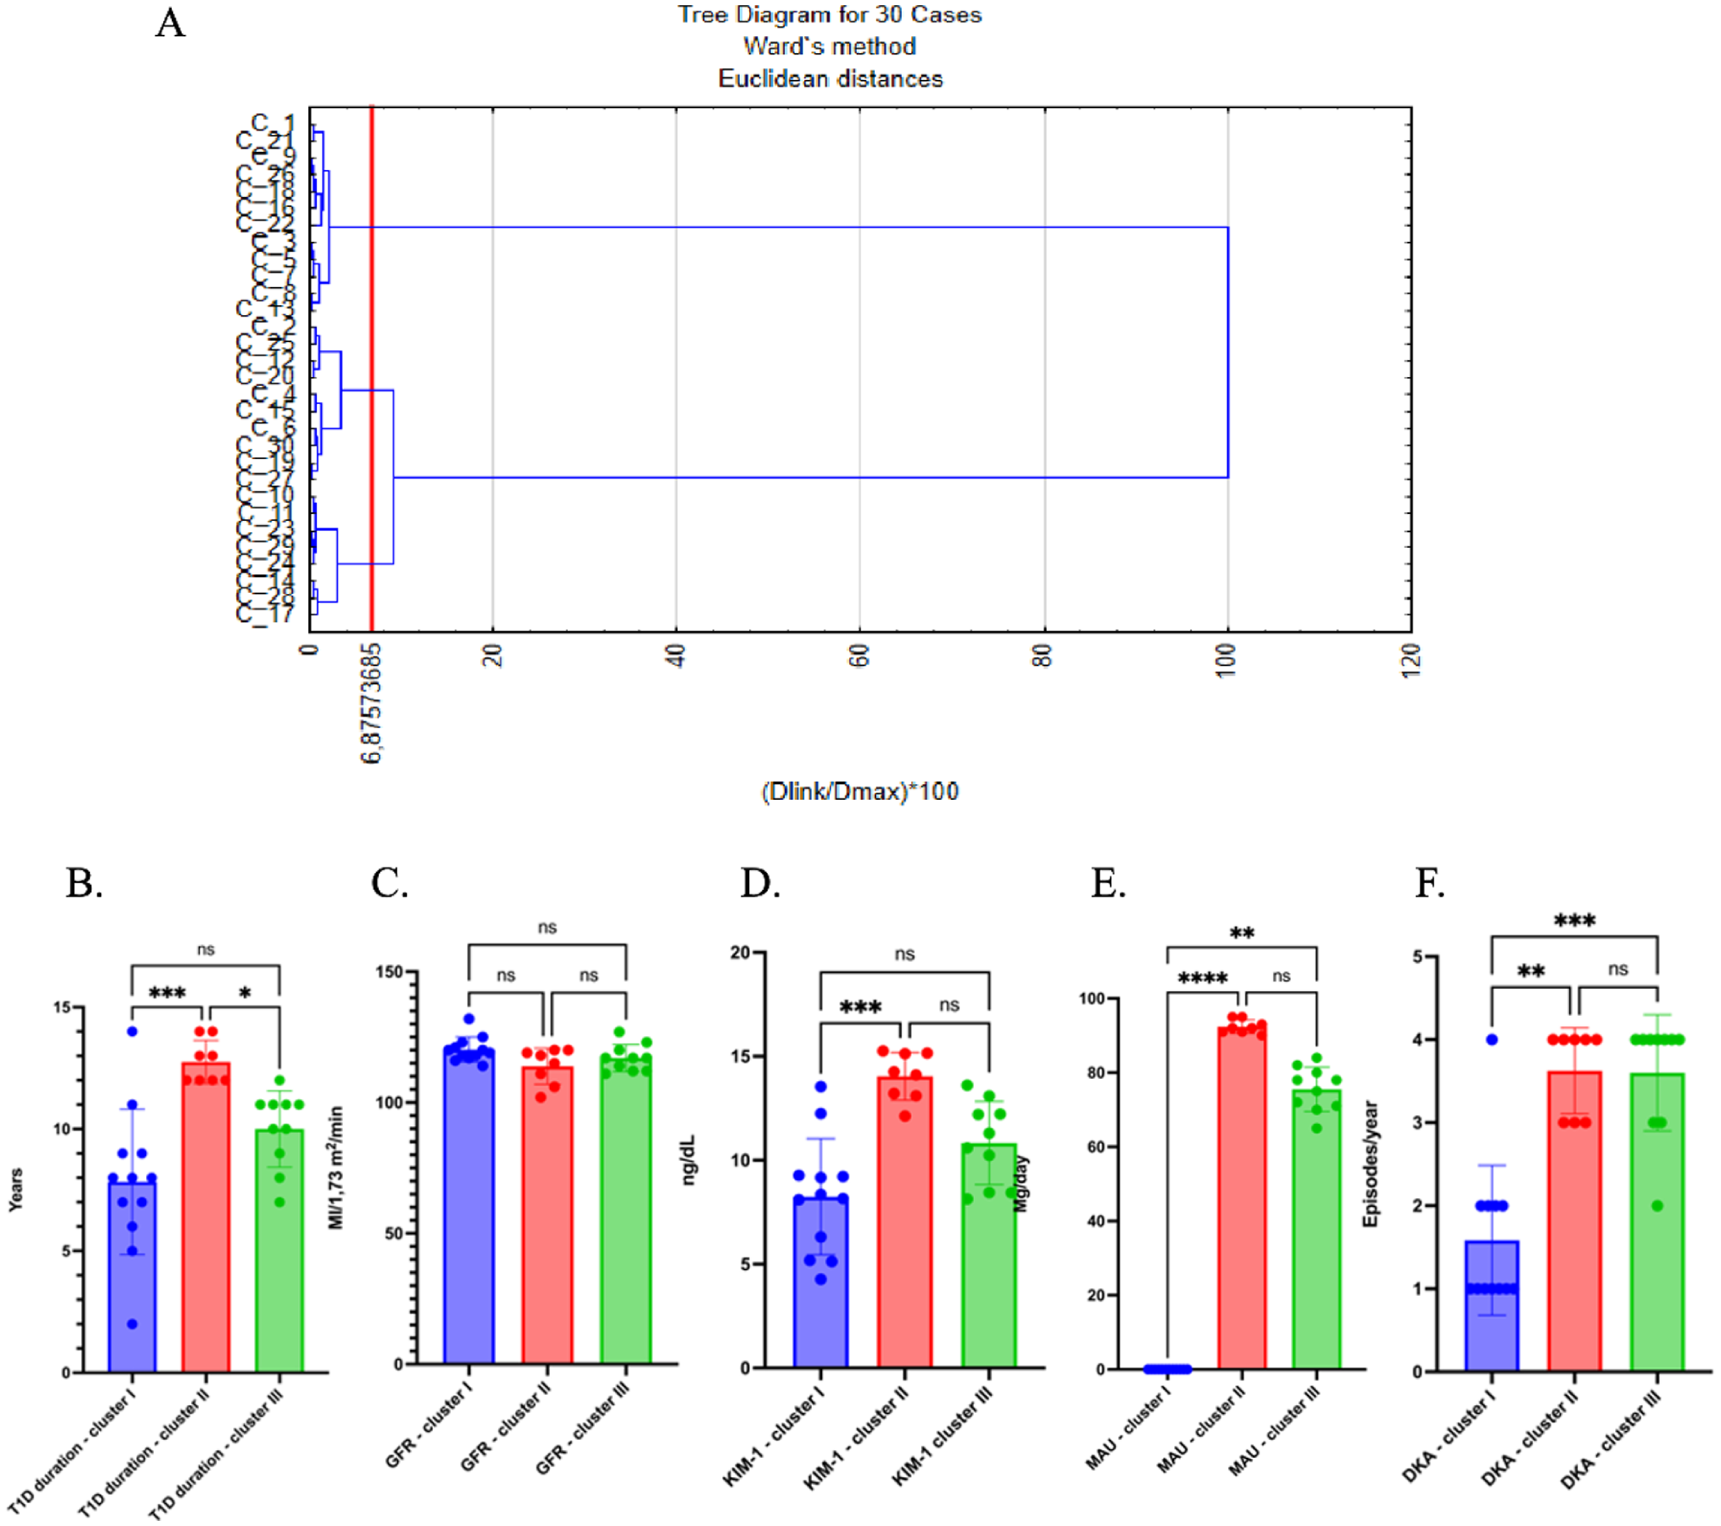
Clusters description in children with DN. (A) Basic clusters description. (B) T1D Duration. (C) GFR. (D) KIM-1. (E) MAU. (F) DKA. *P < .05, **P < .01, ***P < .001, ****P < .0001. Data expressed as Mean ± SEM.
Cluster II patients seem to have the longest duration of T1D, which could suggest they are in a later stage of disease progression (12.75 ± 0.31 years, P < .01 as compared to Cluster I and P < .05 as compared to Cluster III; Figure 10B).
Clusters II and III have a slightly shorter duration of T1D, possibly pointing to varying stages of the disease (7.83 ± 0.86 years and 10.00 ± 0.49 years, respectively). GFR levels have not shown any significant differences between clusters (Figure 10C).
KIM-1 shown increase significantly in Cluster II and III (14.04 ± 0.4 ng/dL and 10.83 ± 0.63 ng/dL, respectively), suggesting that these patients may have sustained kidney injury or damage. Cluster I shows relatively lower KIM-1 values, indicating less renal injury (8.25 ± 0.81 ng/dL, P < .01 as compared to Cluster II; Figure 10D).
Microalbuminuria is higher in Clusters II (92.38 ± 0.65 mg/day) and III75.5 ± 1.89 mg/day) as compared to Cluster I value (P < .0001 and P < .01, respectively) indicating that these patients are at a higher risk for kidney damage (Figure 10E).
DKA episodes in Cluster I shows (1.58 ± 0.26 episodes/year) a consistent pattern of DKA episodes with moderate values, but these episodes decrease slightly in Cluster II (3.63 ± 0.18 episodes/year, P < .01 as compared to control) and III (3.6 ± 0.22 episodes/year P < .0001, as compared to control), which could indicate that metabolic control is better managed in later stages, or it may represent a reduction in acute events (Figure 10F).
Discussion
Albumin in the urine is initially filtered through the glomerulus and subsequently reabsorbed by proximal tubular cells via the megalin-cubilin receptor pathway. The presence of albuminuria defines as a crucial predictor for the progression of diabetic nephropathy, with more persistent and severe forms being linked to a faster decline in kidney function and an elevated risk of cardiovascular disease among individuals with T1D. 12 According to the Kidney Disease Outcomes Quality Initiative (KDOQI) guidelines, patients with T1D should undergo screening for albuminuria 5 years after diagnosis, while those with T1D should be screened at the time of diagnosis. 13
Long-term studies reveal that among diabetic patients presenting with microalbuminuria, approximately 30% to 45% progress to macroalbuminuria within a decade, about 30% revert to normoalbuminuria, and the remaining 30% to 40% persist with microalbuminuria. 14 These findings highlight the need for novel biomarkers to more accurately predict the progression of diabetic nephropathy.
Chronic hyperglycemia remains a risk factor for DN, the conventional biomarker, glycated hemoglobin HbA1c reflects only mean blood glucose levels and fails to account for fluctuations, known as glycemic variability. Glycemic variability is associated with enhanced oxidative stress and inflammatory responses, demonstrated by increased levels of markers like total antioxidant capacity and high-sensitivity C-reactive protein, particularly among youth with T1D.14,15 Inflammation is now considered a major contributor to the pathogenesis of DN. 15
The inflammatory response in diabetic kidneys is mediated primarily by infiltrating macrophages, activated T lymphocytes, and resident dendritic cells. 16 KIM-1, also referred to as T-cell immunoglobulin and mucin-domain containing molecule-1 (TIM-1), acts as a receptor on T cells and dendritic cells and is involved in mediating autoimmune and inflammatory processes.16,17
In healthy kidneys KIM-1 expression is either absent or minimal but becomes significantly upregulated in proximal tubular cells following acute or chronic injury. 18 KIM-1 activation leads to the release of chemokines such as monocyte chemoattractant protein-1 (MCP-1 or CCL2), promoting leukocyte recruitment and activation in the kidney. 19 Moreover, KIM-1 facilitates the clearance of injured and apoptotic cells by tubular epithelial cells and enhances antigen presentation, thereby promoting dendritic cell activation of T lymphocytes.18,19
Elevated KIM-1 levels have been associated with decreased estimated glomerular filtration rate (eGFR) in patients with late DN. 14 Moreover, KIM-1 overexpression has been documented in other renal diseases, such as IgA nephropathy, where affected tubules are typically surrounded by inflammatory infiltrates rich in macrophages and T cells.20,21
Our study demonstrates that KIM-1 is significantly elevated in children with T1D and especially in those who have early DN, compared to healthy controls. Importantly, KIM-1 levels were increased even among T1D patients without overt microalbuminuria, indicating its potential role as an early marker of subclinical tubular injury preceding glomerular damage.
Albuminuria remains the traditional hallmark of early DN, it does not always capture initial renal injury. Consistent with previous reports, our data show that microalbuminuria levels were significantly higher in the DN group compared to T1D patients without nephropathy (P < .0001), supporting albuminuria’s relevance in more advanced stages of DN. However, our findings extend prior knowledge by showing that urinary KIM-1 levels were elevated independently of microalbuminuria in normoalbuminuric T1D patients. This highlights tubular involvement as an earlier event in the pathogenesis of DN.
We observed that urinary KIM-1 levels correlated strongly with disease duration in both T1D (r = .88) and DN groups (r = .72), suggesting that KIM-1 reflects cumulative renal injury over time. In DN patients, KIM-1 also showed a strong positive correlation with microalbuminuria (r = .924) and an inverse correlation with estimated glomerular filtration rate (GFR; r = −.686), underscoring its relationship to both glomerular and tubular dysfunction.
The strong correlation we observed between KIM-1 and diabetes duration suggests that KIM-1 may reflect cumulative renal injury over time. However, this interpretation should be made with the point that diabetes duration is associated with older age and prolonged exposure to other metabolic and environmental risk factors. Therefore, it is possible that the relationship between KIM-1 and T1D duration is partially confounded by these variables. Longitudinal studies are needed to clarify whether rising KIM-1 levels are driven predominantly by the chronic effect of hyperglycemia, patient age, etc.
Interestingly, HbA1c levels did not significantly correlate with KIM-1, indicating that KIM-1 elevation is more related to renal tissue injury than to overall glycemic control at a given time point. This finding aligns with the concept that chronic low-grade inflammation and oxidative stress contribute to DN independently of blood glucose levels.
In our study, HbA1c did not significantly correlate with urinary KIM-1, despite the evidences that chronic hyperglycemia plays a role in the development of DN. This finding underscores the limitation of HbA1c as a biomarker. HbA1c reflects mean glucose levels over the last 2 to 3 months, it does not capture glycemic variability and cumulative chronic metabolic and inflammatory stress that contribute to renal tubular injury. KIM-1 elevation appears to reflect tissue-level damage processes that are not directly proportional to HbA1c values. This suggests that HbA1c alone may be insufficient to fully characterize the risk of early diabetic kidney injury, and highlights the potential added value of tubular biomarkers.
Through principal component analysis and multiple regression analysis, we confirmed that T1D duration, MAU, and disease status (T1D vs DN) were independent predictors of urinary KIM-1 levels. These results support the use of urinary KIM-1 as a sensitive, early biomarker of kidney injury in pediatric patients with T1D, before overt clinical signs of nephropathy develop.
Given that traditional markers like serum creatinine and eGFR changes often appear late in disease progression, introduction the urinary KIM-1 measurement in routine clinical practice may provide a valuable approach for early risk stratification, closer monitoring, and timely intervention in diabetic children at risk for nephropathy.
The dataset suggests that patients in Cluster I are in an earlier stage of disease, with lower levels of kidney injury markers and a longer duration of Type 1 Diabetes. Cluster II and III show increasing markers of kidney injury and worsening GFR, likely indicating more severe kidney dysfunction. The presence of DKA appears consistent across all clusters, with no significant trend indicating a clear progression or improvement in DKA episodes with disease duration.
This could point to a need for early intervention and better kidney monitoring, especially in clusters II and III where renal damage and metabolic control seem to be more prominent. Further analysis, such as correlation or regression analysis, could help to better understand the relationship between T1D duration, kidney function, and the biomarkers involved.
In conclusion, our findings suggest that urinary KIM-1 is a promising, non-invasive biomarker for the early detection of renal tubular injury in children with type 1 diabetes (Figure 11).

Summarized scheme of the management of early subclinical stage of DN.
From a clinical perspective, urinary KIM-1 could complement conventional DN screening (albuminuria and eGFR) by detecting proximal tubular injury at an earlier, potentially reversible stage. We hypothesize that KIM-1 measurement can be useful in higher-risk pediatric T1D patients (longer diabetes duration, poor glycemic control, frequent DKA) where an elevated KIM-1 would provide a closer monitoring (repeat testing in 3-6 months). This in turn can help to adjust T1D management. Diagnostic panels could provide a recommendation to use KIM-1 as a biomarker in research settings and selected high-risk patients. It is important to note that our study was conducted at a single center, which may limit the generalizability of the results. Future multicenter studies are warranted to validate these findings across bigger cohorts and clinical settings, thereby enhancing their broader applicability.
Strengths and Limitations
A major strength of our study is the focus on a pediatric population, which is relatively underrepresented in such field. By examining both normoalbuminuric and albuminuric patients, and including a control group, we were able to detect subtle renal changes that might otherwise go unnoticed in standard clinical assessments. Furthermore, the use of multiple statistical approaches, including principal component analysis and multiple regression, reinforces the robustness of our findings.
However, some limitations should be mentiones. First, our study had a relatively small sample size from a single center, which may limit the generalizability of the results. Larger, multicenter cohorts would help validate the applicability of urinary KIM-1 across different populations. KIM-1 levels were measured at a single time point without accounting for biological variability or potential acute fluctuations. Repeated measurements over time could enhance reliability. Future research addressing these limitations could provide even stronger evidence for the early diagnostic and prognostic value of KIM-1 in diabetic kidney disease.
Footnotes
Acknowledgements
The authors wish to acknowledge the former colleagues from Karolinska Institutet (Stockholm, Sweden).
Ethical Considerations
This study was approved by the local ethical review committee.
Consent for Publication
Written informed consent was taken from the parents of the patient who are legally authorized representative of the minor subject for the publication of this study.
Author Contributions
All authors equally contributed to the paper work.
Funding
The authors received no financial support for the research, authorship, and/or publication of this article.
Declaration of Conflicting Interests
The authors declared no potential conflicts of interest with respect to the research, authorship, and/or publication of this article.
Data Availability Statement
Data will be provided on request.