
Abstract
Objective. This study investigated relationships between adipose tissue deposition within skeletal muscle and morphological and biochemical variables in children with obesity. Methods. Fifty-one Japanese children (16 girls) aged 7 to 16 years were assigned to either mild (<20%), moderate (≥20% to <50%), or severe obesity groups (≥50%). Computed tomography images were taken to calculate the cross-sectional area (CSA) of muscle, subcutaneous and visceral adipose tissue (VAT, for abdomen only), and muscle signal intensities, as an index of intramuscular adipose tissue in the anterior, lateral, and posterior muscles of the abdomen and quadriceps, hamstring and adductor muscles in the thigh. Fasting blood samples were collected to measure plasma lipids, glutamate oxaloacetate transaminase, glutamate oxaloacetate transaminase, uric acid, glucose, and HbA1c. Results. Signal intensity in the severe obesity group was significantly lower than mild and moderate obesity groups in the abdomen and significantly lower than the moderate obesity group in the thigh. Stepwise regression analysis with signal intensity as dependent variable revealed that VAT CSA and age in abdominal muscles and VAT CSA, age, and triglycerides in thigh muscles are predictors of signal intensities. Conclusions. These results suggest that VAT CSA and age are predictors of intramuscular adipose tissue of the abdominal and thigh in children with obesity.
Introduction
Childhood obesity has been one of the great concerns of public health and health promotion in children.1,2 Obesity is associated with increased risk of metabolic diseases such as type 2 diabetes, cardiovascular disease, and fatty liver disease.3,4 Researches already shows the association between metabolic diseases in childhood with several and dangerous repercussions on the adulthood. 5 Therefore, early awareness, prevention, identification, and treatment of obesity are primary medical concerns for children.6,7
A few types of specific adipose tissue depots such as subcutaneous, visceral abdominal, and ectopic adipose tissue, which include intramuscular, hepatic, and pancreatic fat fractions, are known to result from obesity. 8 Among these different types of adipose tissue, intramuscular adipose tissue (IntraMAT) is known as a negative predictor of insulin resistance and impairment of metabolism in adults.9-13 However, information about the IntraMAT accumulation pattern and its function in children has not been well documented. 3 Sinha et al 14 showed that there were significant inverse relationships between intra- and extramyocellular lipids and whole-body insulin sensitivity in lean adolescents (r = −0.59 and −0.53, respectively) and even more so in individuals with obesity. These previous studies documented that IntraMAT is closely related to increased risk of metabolic diseases such as type 2 diabetes in both adults9-13 and children. 14 Surprisingly, the pattern of IntraMAT accumulation in muscles of different locations such as abdominal and lower limbs and the relationship of IntraMAT to physical, morphological, and biochemical properties in children with obesity is not well known. 3
Skeletal muscle attenuation determined by computed tomography (CT) is a useful technique to distinguish between different tissue types in vivo based on their attenuation characteristics.12,15,16 Many attempts have been made using this technique to measure IntraMAT and have shown that muscle attenuation in adults with obesity is significantly lower than in lean individuals.11,12,17 Therefore, this technique is ideal for measuring muscle composition.
The purpose of this study was to compare the relationship between muscle attenuation determined by CT and blood biochemical parameters, subcutaneous adipose tissue, muscle cross-sectional area (CSA) in children with mild, moderate, and severe obesity. We hypothesized that muscle attenuation would be highest in children with severe obesity and that muscle attenuation would be related to visceral adipose tissue (VAT) as found in adults.
Methods
Subjects
Fifty-one Japanese boys (n = 35) and girls (n = 16) aged between 7 and 16 years participated in this study. They were assigned to groups based on categorization of the degree of obesity by the Japanese Society for Pediatric Endocrinology (http://jspe.umin.jp/public/himan.html): mild obesity group (<20%), moderate obesity group (≥20% to <50%), and severe obesity group (≥50%). The children joined as voluntary patients to the clinic for treatment of childhood obesity at the National Mie Hospital. Before the experiment, we explained the procedure, purposes, risks, and benefits associated with the study, and written consent was obtained from the children and their parents. The Institutional Review Board of the National Mie Hospital (Reference Number 25-21) and the Nagoya University Research Center of Health, Physical Fitness & Sports, Nagoya University (Reference Number 25-07) approved the study, which was conducted in accordance with the guidelines of the Declaration of Helsinki. Table 1 shows the physical characteristics of the participants.
Physical Characteristics and Morphological Properties of Categorized Subjects Based on the Degree of Obesity a .

Abbreviations: AD, adductors; CSA, cross-sectional area; HM, hamstrings; QF, quadriceps femoris; SCAT, subcutaneous adipose tissue; VAT, visceral adipose tissue.
Values are means ± SD.
P < .05 versus Mild obesity group; †P < .05 versus Moderate obesity group. AP < .05 versus posterior; QP < .05 versus quadriceps femoris.
Blood Chemistry
Blood samples were drawn in the morning after an overnight fast and sent to a commercial laboratory (SRL Laboratory, Tokyo, Japan) for analysis. All samples were analyzed for total protein, GOT (AST [aspartate aminotransferase]), GPT (ALT [alanine aminotransferase]), uric acid, triglycerides (TG), free fatty acids (FFA), glucose, HbA1c, high-density lipoprotein-cholesterol (HDL-C), and total cholesterol (total-C) concentrations. This test was done on the same day as CT measurements.
Computed Tomography
After the blood sampling, axial images were taken at the mid-thigh between the anterior superior iliac crest and the lateral condyle and abdomen at the umbilicus level using a CT device (High Speed DXi, GE Healthcare Japan, Tokyo, Japan). Scans were obtained at 120 kV (peak) and 310 mA, with a scanning time of 1 second for each portion to obtain abdominal and thigh images. The matrix was 512 × 512 pixels and the field-of-view was different with body size ranging from 320 × 320 mm to 500 × 500 mm for the thigh and from 293 × 293 mm to 442 × 442 mm for the abdomen. Thus, the pixel resolution ranged from 0.63 mm to 0.98 mm per pixel for the thigh and 0.57 mm to 0.86 mm per pixel for the abdomen. All CT images were stored with Digital Imaging and Communication in Medicine (DICOM) format for future analysis.
We were very careful of radiation during CT measurements for our subjects. According to several societies such as the Japanese Society of Pediatric Radiology, Japanese Society of Medical Physics, and Japanese Society of Nuclear Medicine, diagnostic reference level of radiation of 8.5 mGy or less is provided for the abdomen for children from 6 to 10 years. We strictly adhered to this reference in CT measurements.
The muscle groups of the thigh investigated were as follows: quadriceps femoris (QF) including rectus femoris, vastus lateralis, vastus intermedius, and vastus medialis; hamstrings (HM) including biceps femoris-long head, semitendinosus, and semimembranosus; and adductor muscles (AD) including adductor magnus, adductor longus, sartorius, and gracilis. The muscle groups of the abdomen investigated were as follows: anterior muscle group (anterior) including rectus abdominis; lateral muscle group (lateral) including transversus abdominis, internal oblique abdominis, and external oblique abdominis; and posterior muscle group (posterior) including psoas major, multitidus, iliocostalis lumborum, and iliacus.
Image Analysis
To calculate the CSA of muscle groups and subcutaneous adipose tissue (SCAT) of the abdomen and thigh, the edge of the muscle groups was carefully traced using the ImageJ public domain software (version 1.46r, National Institute of Health, Bethesda, MD) as shown in Figure 1. Mean signal intensity (SI) of anterior, lateral, and posterior muscles of the abdomen and QF, HM, and AD of the thigh was measured in 6 muscle groups of the thigh and abdomen using the ImageJ software. Representative mean SIs for the abdominal and thigh muscles were calculated using the following formula:


Representative CT images of abdominal (11 year-old boy in severe obesity group) (a) and thigh (10 year-old girl in severe obesity group) (b).
As shown in Figure 1, the SIs of adipose tissue were lower than those of muscle within a given muscle. Thus, a given muscle group with lower SI represents a relatively higher adipose tissue infiltration.
The CSA of VAT was calculated from abdominal CT images using a segmentation algorithm based on the Hounsfield Unit (Fat Scan, e-JAPAN IT Co Ltd, Ibaraki, Japan).
The reliability of CSA of thigh muscles was already reported in our previous studies. Briefly, test-retest reliability of CSAs of the thigh muscles was 1.6%, 18 and intraclass correlation coefficients ranged from 0.98 to 1.00. 19
Statistical Analysis
All values were reported as means and standard deviations. One-way analysis of variance (ANOVA) was used to compare variables for physical characteristics, body composition, and blood biochemistry among the 3 groups. Pearson product-moment correlation coefficients were used to determine the association between variables. Stepwise regression analysis was performed, with SIs of each muscle group at the thigh and abdomen as dependent variables. The independent variables, with multicollinearity considered, were age, height, weight, sex, degree of obesity, VAT CSA, urinary acid, total-C, TG, glucose, HbA1c, and muscle CSA. The level of significance was set at P < .05. All statistical analyses were performed using IBM SPSS Statistics (version 23.0J, IBM Japan Corp, Tokyo, Japan).
Results
Table 1 shows the physical characteristics and morphological properties in the categorized obesity groups. Physical characteristics such as weight, degree of obesity, and waist circumference of the severe obesity group were significantly greater than the mild obesity group. Similarly, VAT CSA and muscle CSAs in the abdomen and thighs of the severe obesity group were significantly greater than the mild obesity group. In addition, the degree of obesity, waist, VAT CSA, VAT CSA/weight, and lateral and total CSAs in the abdomens of the severe obesity group were significantly greater than the moderate obesity group. Abdominal SI at lateral, including transversus abdominis, internal oblique abdominis, and external oblique abdominis, and mean of the sever obesity group were significantly lower than the mild and moderate obesity groups. Similarly, abdominal SI at lateral and mean of the moderate obesity group were significantly lower than the mild obesity group. Abdominal SI at posterior, including psoas major, multitidus, iliocostalis lumborum, and iliacus, of the moderate and sever groups were significantly lower than that at anterior. HM, AD, and mean SIs of the severe obesity group were significantly lower than the mild obesity group. QF had the highest SI than HM of all obesity groups and AD of moderate obesity group, representing QF was the least IntraMAT.
Blood chemistry profiles in the categorized obesity groups are shown in Table 2. We found no significant differences in any of the blood parameters, except for uric acid. In the severe obesity group, uric acid was significantly greater than that of the mild obesity group.
Blood Parameters of the Subjects a .
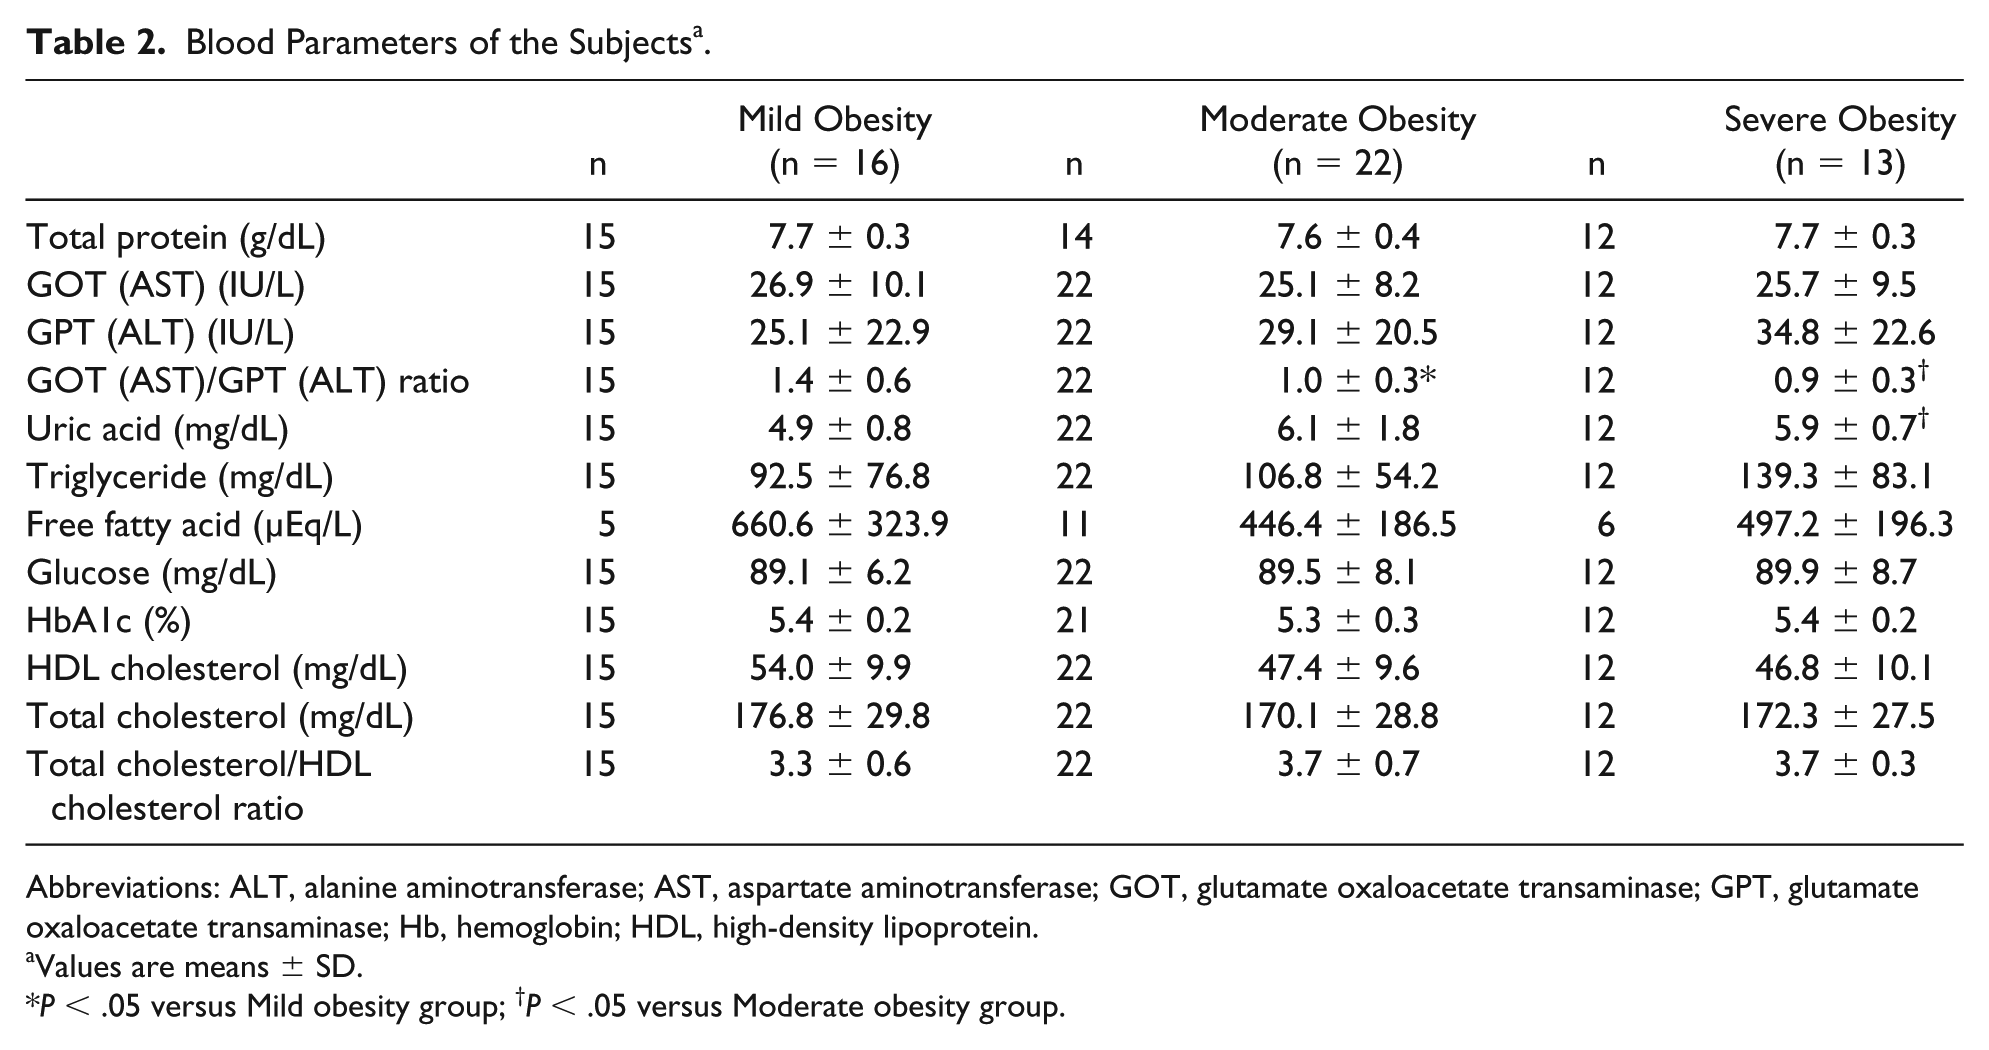
Abbreviations: ALT, alanine aminotransferase; AST, aspartate aminotransferase; GOT, glutamate oxaloacetate transaminase; GPT, glutamate oxaloacetate transaminase; Hb, hemoglobin; HDL, high-density lipoprotein.
Values are means ± SD.
P < .05 versus Mild obesity group; †P < .05 versus Moderate obesity group.
Correlation coefficients between the SIs of abdominal and thigh muscle groups were tested. We found significantly high correlation coefficients in all pairs. Among the abdominal muscle group, the lowest correlation coefficient was found between the anterior and posterior muscles (r = 0.402, P = .003), and the highest correlation coefficient was found between the lateral and anterior muscles (r = 0.637, P = .001). Among the thigh muscle group, the lowest correlation coefficient was found between the quadriceps and adductors (r = 0.657, P = .001), and the highest correlation coefficient was found between HM and adductors (r = 0.746, P = .001). We also found significant correlation coefficients in SIs among the abdominal and thigh muscles, which ranged from 0.454 (P = .001) to 0.741 (P = .001).
Table 3 shows the correlation coefficients between the abdominal and thigh muscles SIs and physical characteristics, body composition, and blood variables. We found that the abdominal posterior SI was significantly associated with age (r = −0.393, P = .001), and the abdominal lateral and AD SIs were significantly associated with weight (r = −0.355, P = .05, r = −0.282, P = .05, respectively). Abdominal lateral, abdominal mean, HM, AD, and thigh mean SIs were negatively associated with degree of obesity, waist, VAT CSA, and abdominal SCAT CSA (r = −0.307 to r = −0.621, P = .01 to P = .01). Posterior SI was significantly correlated with abdominal and thigh muscle CSAs (r = 0.278 and r = 0.287, P = .05 and P = .05, respectively). Abdominal lateral and HM SIs were significantly correlated with uric acid (r = −0.316 and −0.306, P = .05 and P = .05, respectively).
Relationship Between Muscle Signal Intensities in the Abdominal and Thigh and Variables.
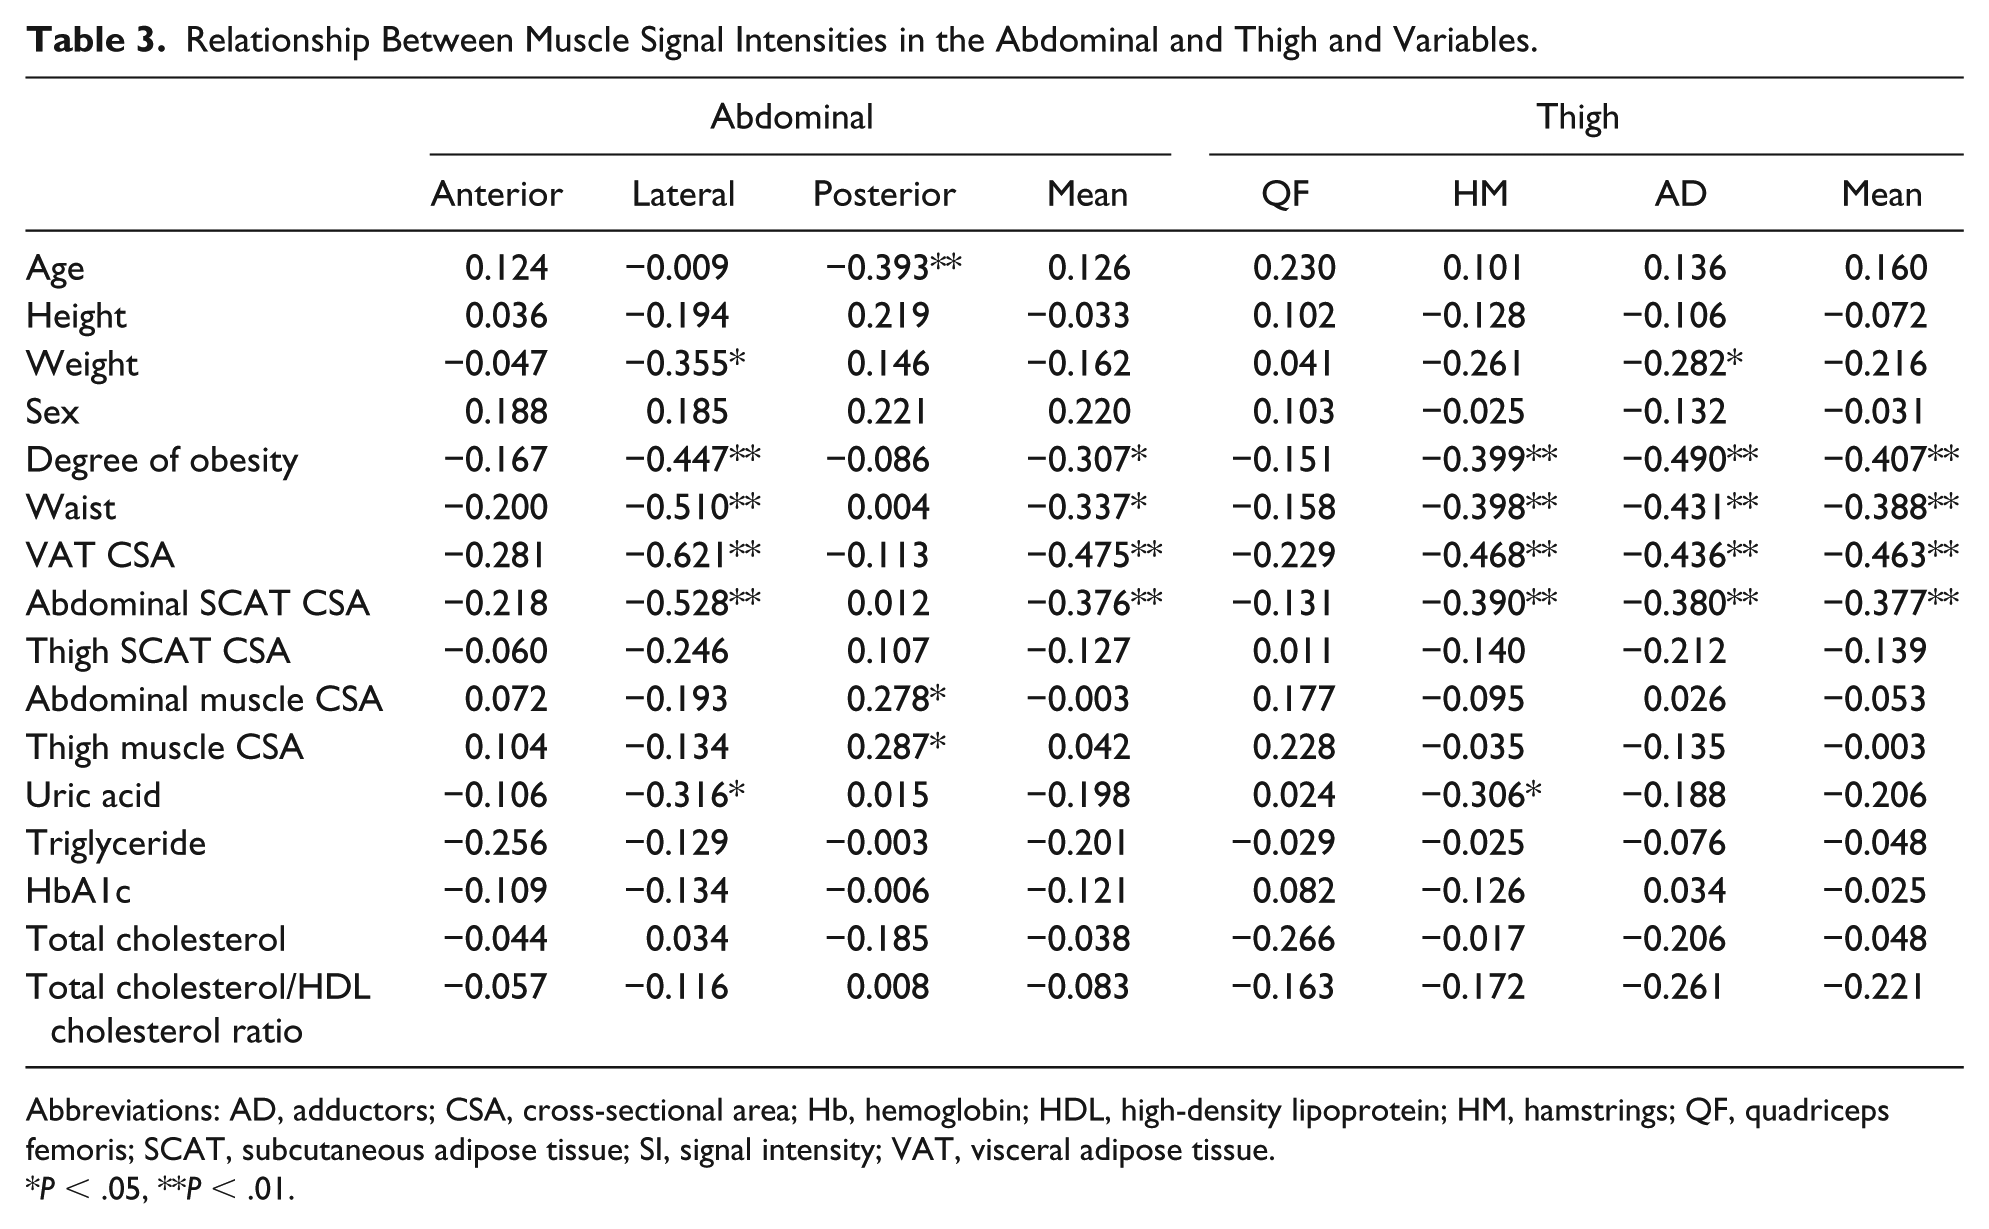
Abbreviations: AD, adductors; CSA, cross-sectional area; Hb, hemoglobin; HDL, high-density lipoprotein; HM, hamstrings; QF, quadriceps femoris; SCAT, subcutaneous adipose tissue; SI, signal intensity; VAT, visceral adipose tissue.
P < .05, **P < .01.
Stepwise multiple regression analysis was performed with the abdominal and thigh SIs as dependent variables and demographic, morphological variables, and blood variables as independent variables (Table 4). The VAT CSA and age were predictive of abdominal SI (r = 0.568, P = .001), and VAT CSA, age, and TG were predictive of thigh SI (r = 0.681, P = .001). Multicollinearity was calculated at the variance inflation factor (VIF) with SPSS Statistics software as the index of multicollinearity. If VIF was 10 or more, multicollinearity was suspected, but in this study it was in the range of 1.033 and 1.111.
Stepwise Multiple Regression Analysis as Dependent Variables of Muscle Signal Intensity and Independent Variables.

Abbreviations: CSA, cross-sectional area; SE, standard error; SI, signal intensity; TG, triglyceride, VAT, visceral adipose tissue.
Discussion
The purpose of this study was to assess the relationships between SIs in abdominal and thigh muscle groups and the physical characteristics, morphological characteristics, and blood chemistry in children with obesity. Correlation analysis revealed linear relationships between VAT CSA and lateral and mean abdominal muscle SIs or HM, AD, and mean thigh muscle SIs. Stepwise linear regression analysis showed that VAT CSA and age were common predictive variables for explaining abdominal and thigh means SIs. These results suggest that SIs of the abdominal and thigh muscles could be a risk factor for metabolic syndrome in children with obesity.
As expected, we found significant intergroup differences among the mild, moderate, and severe obesity groups in physical (weight, degree of obesity, and waist) and morphological (VAT and muscle CSAs in abdomens and thighs) characteristics and in abdominal and thigh muscle SIs. Overall, our results were consistent with previous studies. 14
As anticipated, the abdominal and thigh muscle SIs were closely correlated with each other. This result demonstrated that the IntraMAT of limb and abdomen in children linearly increases with degree of obesity. This result supports the study of 15 healthy Mexican-American girls with body mass index (BMI) ranging from 18 kg/m2 to 46 kg/m2 that showed the percent volume of fat infiltration in specific organs such as the pancreas tail, liver, and muscle are closely associated with BMI. 20 Interestingly, all abdominal and thigh muscles were highly correlated to each other. However, our result of the correlation analysis between SI and morphological variables (Table 3) was different among the abdominal and thigh muscles. Similarly, specific abdominal and thigh muscles were significantly correlated with some parameters such as degree of obesity or VAT CSA. Taken together, the decrease in SI, that is, increase in IntraMAT in the abdomen and thigh in the whole body, may take place in a similar fashion in children with obesity.
According to the correlation analysis between muscle SIs and variables, we observed 2 distinct groups (Table 3). The first group was the lateral abdomen, HM, and AD, which showed significant correlations between the SIs in these muscles and the degree of obesity, waist, VAT CSA, or abdominal SCAT CSA. IntraMAT within these muscles was closely associated with adipose tissue at visceral or subcutaneous regions of the body. This type of association has also been found in adults. 21
The other muscle group was the anterior abdomen, posterior abdomen, and QF, which showed no significant association between SIs in these muscles and the degree of obesity, VAT CSA, or abdominal and thigh SCAT CSAs. This distinct difference in correlation trend may be associated with a dependent accumulation of IntraMAT and the degree of obesity. The lateral and posterior abdomen, HM, and AD showed intergroup difference in SI, but not in anterior abdomen and QF (Table 1). This result suggests that accumulation of IntraMAT in lateral abdominal, HM, and AD muscles is dependent on obesity, but not in the anterior abdomen and QF in children with obesity. With the thigh muscles, we showed a similar result with IntraMAT content in HM and AD being significantly higher than QF in young and older individuals. 22 These results suggest that it is genetically predisposed to accumulate IntraMAT within the lateral abdomen, HM, and AD in the thigh. Hence, these muscle groups are good indicators of adiposity in the whole body of children with obesity.
We found that SIs in lateral muscle of the abdomen and HM in thighs were significantly correlated with serum uric acid. Elevated serum uric acid is known as a risk factor associated with abdominal obesity, low level of HDL-C cholesterol, insulin resistance, and impaired glucose tolerance. 23 Increased SI in a given skeletal muscle using CT image represents greater IntraMAT. Lateral abdominal muscle was the only muscle group demonstrating significant differences in SIs among the 3 groups. HM has been found to have the highest IntraMAT in muscle groups of the thigh.22,24 Thus, both lateral abdominal muscle and HM are representative muscle groups reflecting IntraMAT. Hongo et al 25 showed that elevated serum uric acid was strongly associated with the prevalence of cardiometabolic risk factors such as abdominal obesity, hypertension, dyslipidemia, and increased fasting plasma glucose in 958 boys and girls aged 12.1 to 15.0 years. Taken together, our correlation analysis shows that lateral abdominal muscle and HM are key muscles that predict cardiometabolic risk factors in boys and girls with obesity.
A noteworthy result from stepwise linear regression analysis was that VAT CSA and age are the independent variables that explain the SIs of abdominal and thigh muscles. TG was an additional predictable variable for the thigh. According to Gallagher et al, 21 intermuscular adipose tissue and VAT in whole body increased linearly with total adipose tissue of whole body in adults. Even though Gallagher et al did not report a relationship between intermuscular adipose tissue and VAT, we speculate that these 2 variables are highly correlated with each other. This would be the reason that VAT CSA was a predictor of SI of abdominal and thigh muscles. However, this result may conceptually conflict with Maffeis et al, 26 who used 30 boys and girls with overweight and obesity. Both VAT CSA and muscle fat content have been shown to be related to insulin sensitivity in previous studies.10-12 In addition, hepatic fat content was related to BMI (r2 = 0.50, P < .03) and fasting serum insulin concentration (r2 = 0.29, P = .023) in 15 children diagnosed as lean and obese. However, muscle fat content is more highly correlated than hepatic fat content with BMI (r2 = 0.80, P < .03) and fasting serum insulin (r2 = 0.63, P = .01).
Another predictive variable of IntraMAT was age for both abdominal and thigh muscles in children with obesity even though there was no significant relationship between age and SIs in abdominal and thigh muscles (Table 3). According to standardized regression coefficients, the effect of age on variance of muscle SI were approximately half those of VAT CSA in the abdomen and thigh, suggesting that the age effect on IntraMAT in abdominal and thigh muscles was smaller than that of VAT CSA.
TG was selected as a predictable variable for thigh, but not abdominal muscle, as a result of stepwise multiple regression analysis. Interestingly, there were no significant correlations between TG and any muscles in the thigh as shown by simple linear correlation analysis (Table 3). According to Cree et al, 27 the r value from correlation analysis between intramyocellular lipids in the soleus and fasting plasma TG was 0.014 (r2 value as percentage from linear regression analysis was 2.1%), which was not significant. Similar to Cree et al, 27 we also found no significant correlation between SIs in abdominal and thigh muscles and fasting plasma TG. However, it is reasonable that TG was selected as a predictable variable, because it is thought that IntraMAT is stored in muscle as a form of TG. 28 This discrepancy may be because TG is a humoral factor that does not reflect IntraMAT. Nevertheless, combining with other factors in stepwise multiple regression analysis, TG was selected as an independent variable.
Limitation of this study is whether our result was derived from genetic predisposition of obese subjects. However, we did not measure any genetic predisposition parameters in this study. Further research on this point is necessary.
In conclusion, SI of abdominal and thigh muscles in children with obesity is associated with VAT CSA and age. TG is also a variable that predicts SI of thigh muscle. These results suggest that VAT CSA and age are predictors of IntraMAT of the abdominal, especially the lateral muscle, and thigh, especially HM and AD, in children with obesity. The results of this study present screening of risk assessment for metabolic syndrome of children with obesity.
Footnotes
Author Contributions
HA: Contributed to conception; contributed to analysis and interpretation; drafted manuscript; critically revised manuscript; gave final approval; agrees to be accountable for all aspects of work ensuring integrity and accuracy.
KK: Contributed to conception; contributed to acquisition; drafted manuscript; critically revised manuscript; gave final approval; agrees to be accountable for all aspects of work ensuring integrity and accuracy.
KT: Contributed to conception and design; contributed to interpretation; drafted manuscript; critically revised manuscript; gave final approval; agrees to be accountable for all aspects of work ensuring integrity and accuracy.
Declaration of Conflicting Interests
The author(s) declared no potential conflicts of interest with respect to the research, authorship, and/or publication of this article.
Funding
The author(s) disclosed receipt of the following financial support for the research, authorship, and/or publication of this article: This study was supported in part by the Descente and Ishimoto Memorial Foundation for the promotion of Sport Science.