
Abstract
Introduction
Cerebral palsy (CP) is a group of disorders that affect a person’s ability to move and maintain balance and posture. It is the most common motor disability in childhood. Population-based studies report prevalence estimates of CP ranging from 1.5 to more than 4 per 1000 live births or children of defined age range.1,2 The incidence of CP is same in India as compared to the Western world. The exact causes of CP are not always known but many cases are caused due to factors affecting the brain before birth. However, in few children viral infections, lead poisoning, or head injuries that occur early in life can result in acquired CP. Till date very few studies have evaluated blood lead levels in children with CP. Lead interferes with the process of rapid growth, development, and differentiation in the developing brain. Raised lead levels may cause permanent damage.3,4 Children are more vulnerable to raised lead levels because of increased risk of exposure and biological susceptibility to lead. Also lead exposure in children with preexisting neurological disorders, as in CP, can further impair their residual cognitive, motor, or behavioral function. These children are at increased risk of raised lead levels due to abnormal eating habits (pica) and increased lead absorption. Initially, the Centers for Disease Control and Prevention considered blood lead level of <10 µg/dL in children as safe. 5 Several studies have concluded that toxic effects of lead can be seen at lead levels ≤10 µg/dL. Hence, the Centers for Disease Control and Prevention now recommends that children with lead levels >5 µg/dL require measures to decrease exposure to lead. 6
The present study was planned to estimate blood lead levels in children with CP and compare them with neurologically normal controls.
Participants and Method
The study was conducted at Guru Teg Bahadur Hospital, which is situated in the eastern part of Delhi catering to patients from East Delhi and Uttar Pradesh from February 2012 to March 2013.The population belonged to lower socioeconomic status and had water supplied through a pipeline not made from lead by the Delhi Jal Board. Approval was obtained from the University College of Medical Sciences Delhi Ethical Committee on December 3, 2011. Sample size of 34 was calculated based on a previous study by Kumar et al 7 for 80% power and α of .05 to detect a difference of lead levels of 10 µg/dL between cases and controls. Written informed consent was obtained from parents/guardians of study participants. Cases consisted of 34 children 2 to 12 years of age diagnosed with CP. CP was defined as a group of disorders that affects movement and posture, causing activity limitation that is attributed to nonprogressive disturbances that occur in developing fetal or infant brain up to 5 years of age. 8 Controls consisted of 34 age- and sex-matched neurologically normal children attending the outpatient department at the same hospital with minor ailments other than central nervous system disorders. Children with other chronic liver, renal, and cardiac diseases were excluded from the study. Children with congenital anomalies or syndromic diagnosis were also excluded from the study.
All baseline clinical characteristics and demographic data were recorded as per proforma. Anthropometric parameters, that is, weight, height, and head circumference, were measured as per standard method. Detailed environmental history adapted from the World Health Organization 9 was recorded to know the source of exposure to lead, which included general condition of the residence and school in which child spends time, evidence of peeling paint, any recent renovations to the house, sources of smoke and dust near the house, and measures attempted by the family to control dust and dirt. It also included abnormal habits in children like history of pica and washing hands before meals. Source of drinking water and occupations of household members related to lead exposure was also recorded.
All cases underwent neuroimaging and other investigations as per protocol for establishing the etiology of CP and prognosis. Hemogram, serum bilirubin, and blood urea estimation was carried out in all cases and controls. A venous blood sample of 1.5 mL was collected from all cases and controls for lead estimation. Lead extraction was carried by using distilled HNO3 and concentrated perchloric acid (70%). 10 Subsequently, lead estimation was done by an atomic absorption spectrophotometer (Schimadzu Flame AA-680).
Statistical Analysis
Data analysis was done using SPSS Version 17.0. Comparison of mean blood lead levels was done using unpaired Student’s t test. The effect of environmental factors on lead levels was studied by Student’s t test. Number of children with lead levels ≥5 µg/dL and ≥10 µg/dL were compared using χ2 test. Odds ratio was calculated. P < .05 was taken as significant.
Results
A total of 68 children were enrolled for evaluation and lead estimation (34 cases and 34 controls). A total of 34 CP cases were recruited. Their age was in the range of 24 to 144 months. Age and sex distribution was the same in the cases and controls as the 2 groups were age and sex matched (P > .05).
Of the 34 cases of CP, 26 (76.5%) had quadriplegic CP. Seizures were present in 17 (50%) of them. Majority, 32 (94.1%), underwent neuroimaging. Magnetic resonance imaging was abnormal in 29 (91.2%) CP cases.
Table 1 shows the age and sex distribution of cases and controls.
Age and Sex Distribution of Cerebral Palsy Patients.
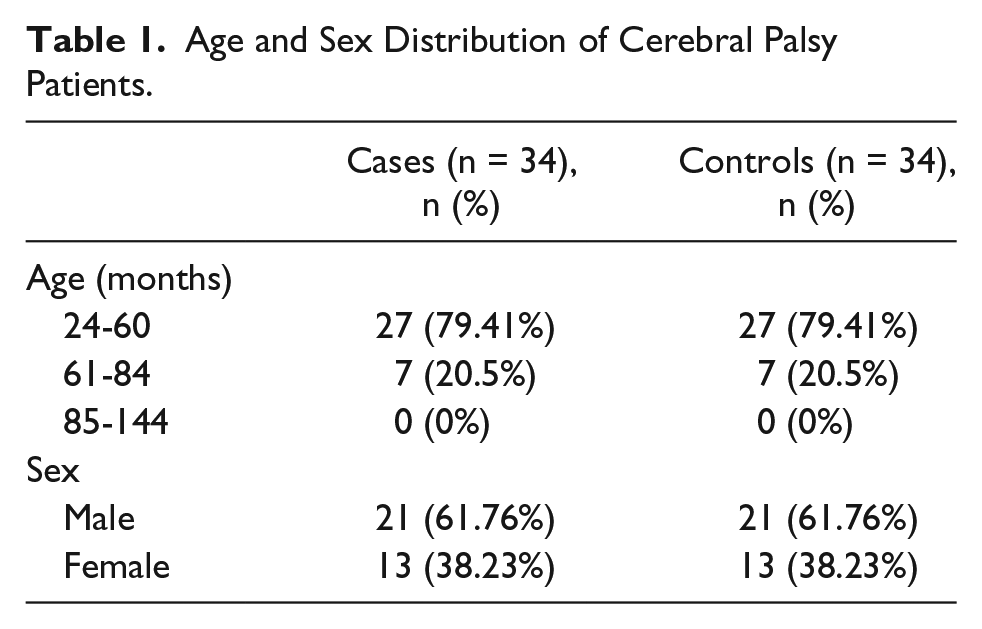
Table 2 shows the clinical profile of cases.
Clinical Profile of Cerebral Palsy Cases.
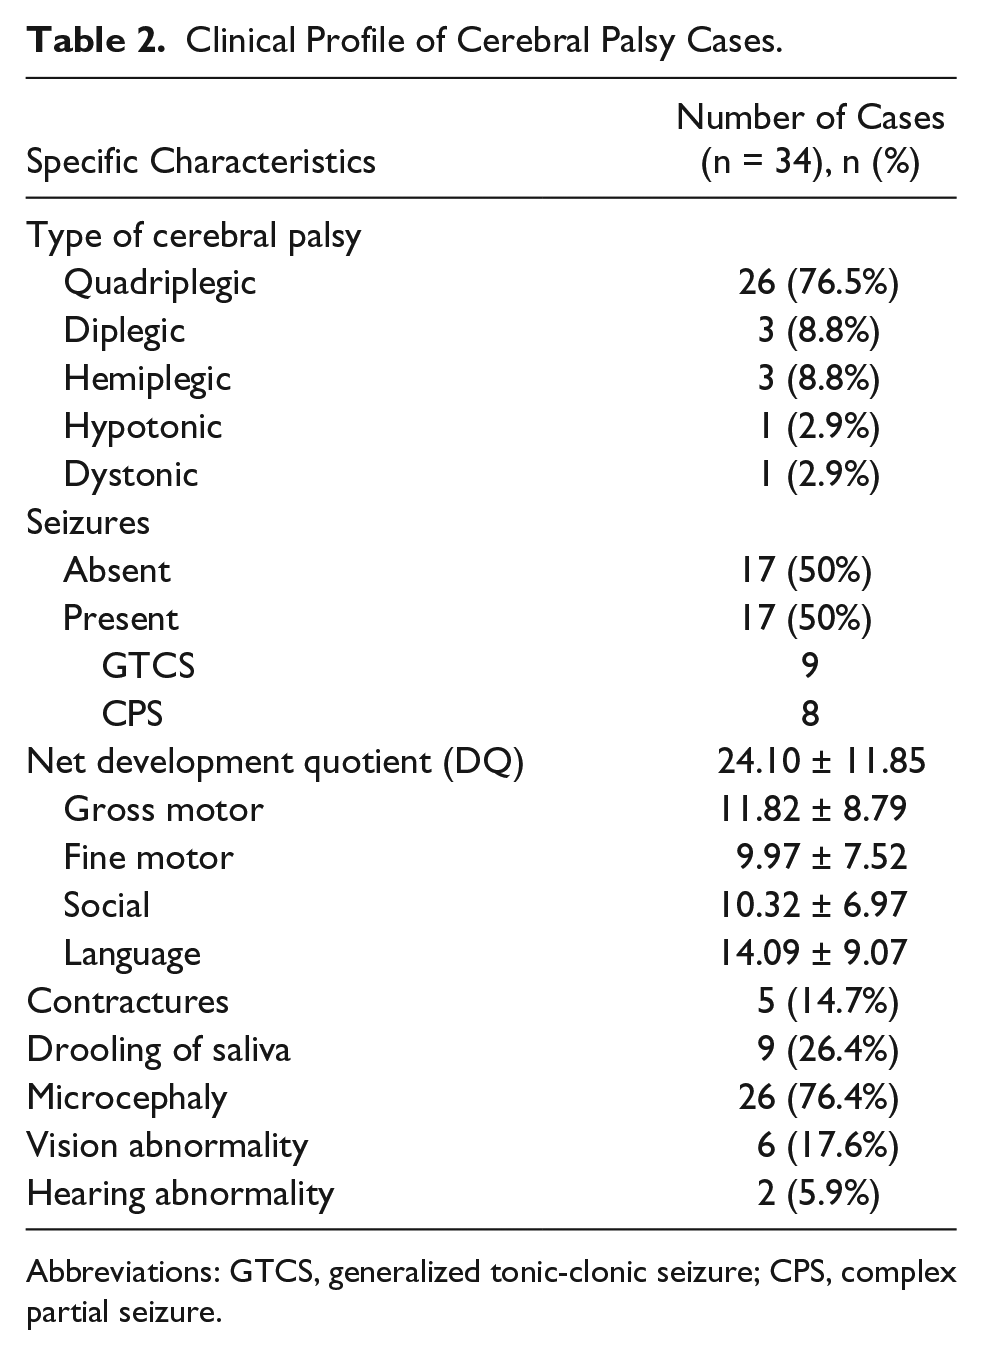
Abbreviations: GTCS, generalized tonic-clonic seizure; CPS, complex partial seizure.
Table 3 shows the comparison of lead levels among CP cases and controls. The results revealed that the lead levels were higher in CP cases when compared with controls (P < .001). Figure 1 depicts .ROC curve of mean lead levels in cases vs controls ( Area under the curve 0.753,95% CI 0.638-0.863 )
Comparison of Mean Blood Lead Levels Among Cases and Controls.

Abbreviation: CI, confidence interval.
The mean difference is significant at P < .05 using unpaired t test.
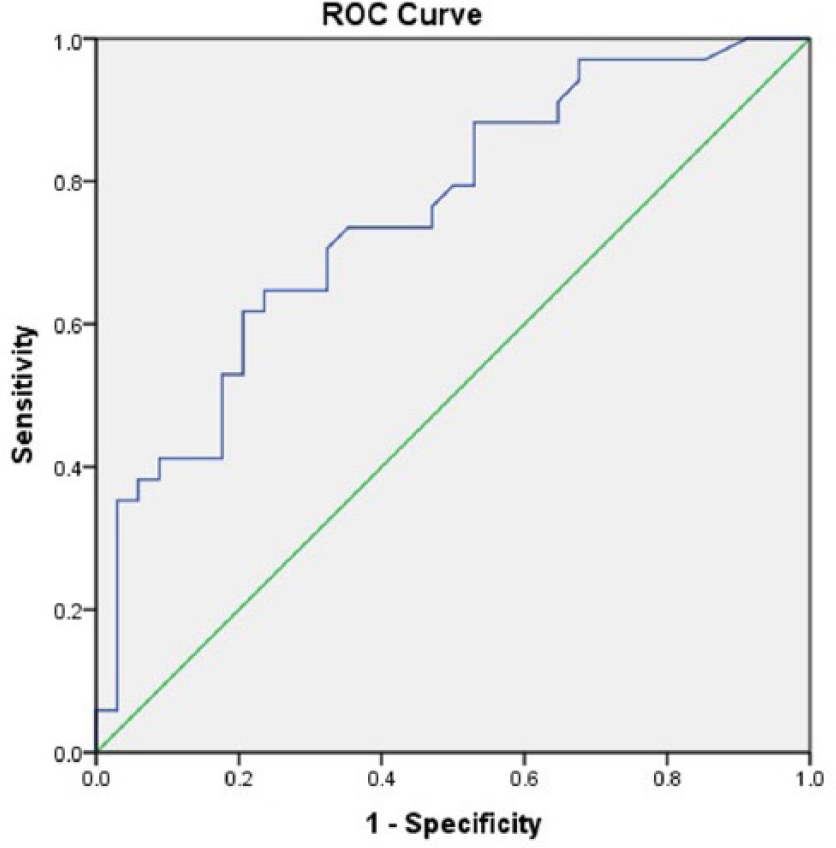
ROC curve depicting mean lead levels in cases vs controls (Area under the curve 0.753,95% CI 0.638-0.863).
Table 4 shows the distribution of lead levels among CP cases and controls. Lead levels ≥5 µg/dL were seen in 19 (55.88%) cases, while only 7 (20.59%) controls had blood lead levels ≥5 µg/dL, with difference being statistically significant (P = .003). Lead levels ≥10 µg/dL were seen in 13 (19.11%) cases, while only 1 (1.47%) control had blood lead levels ≥10 µg/dL, with the difference being statistically significant (P < .001).
Distribution of Blood Lead Levels Among Cases and Controls.

Abbreviations: OR, odds ratio; CI, confidence interval.
The wide confidence interval is due to low number of children in the category.
The mean difference is significant at P < .05 using χ2 test.
Table 5 shows the relationship between mean lead levels and environmental factors in CP cases and controls. In CP cases, those who exhibited pica had increased lead levels in comparison to children with no history of pica (P = .029). Children who played in outdoor areas containing contaminated soil had increased lead levels (P = .035). Environmental factors were not associated with increased lead levels in controls Blood lead levels did not correlated with hemoglobin in cases and controls. There was no significant difference with age and sex in the mean blood lead levels
Relationship Between Environmental Factors and Mean Blood Lead Levels in Cases and Controls.

The difference is significant if P < .05.
Discussion
Blood lead levels in children with CP are important as raised lead levels may aggravate cognitive decline and neurobehavioral problems. Also, lead toxicity in early life can cause permanent brain damage leading to CP. In the present study, mean lead levels in CP cases were 9.20 ± 8.31 µg/dL compared to 2.89 ± 3.04 µg/dL in controls (P < .001). A similar difference in CP cases and controls was seen in a study by Kumar et al, 7 in which blood lead levels were 19.33 ± 16.94 µg/dL in CP children and 11.96 ± 10.97 µg/dL in controls, with P < .05. Similarly, in the study by Ahamed et al, 11 lead levels were 18.60 ± 7.93 µg/dL in children with neurological disorders and 10.37 ± 5.08 µg/dL in controls, with P < .05. Another study by Mahmoudian et al 12 demonstrated higher lead levels in children with neurological disorders as compared to controls (P < .01).
In our study, 19 (55.88%) CP children had blood lead levels ≥5 µg/dL, whereas only 7 (20.58%) controls had levels ≥5 µg/dL (P = .003); 13 (38.23%) CP children versus 1 control had blood lead levels ≥10 µg/dL (P < .0001). Environmental and dietary education was given to children with lead levels ≥5 µg/dL. Although 4 (11.7%) CP children had blood lead levels ≥20 µg/dL, none of the children required chelation therapy as the levels were below 45 µg/dL. As CP children are prone to micronutrient deficiencies, 13 which causes increased lead absorption, dietary advice to improve micronutrient deficiencies was given to these children.
Despite significant difference in mean levels of cases and controls, the levels in our study were lower as compared to previous studies. A fall in lead concentration has been demonstrated after phasing out of lead from petrol worldwide. Singh and Singh 14 conducted a study and proved that lead levels have declined in the Indian environment after the phase out of lead containing petrol. The results of this study showed that mean blood lead levels of children from Mumbai, Chennai, Bangalore, Amritsar, and Lucknow urban centers have fallen from 18.1 µg/dL in the leaded petrol phase to 12.1 µg/dL in the unleaded petrol phase, hence the explanations for results in our study, as our study was conducted in the urban area of Delhi serving the East Delhi and Uttar Pradesh population.
Prenatal exposure to lead or raised cord blood lead levels have been shown to retard in utero neurodevelopment as shown by decreased motor cluster score using Brazelton neonatal behavior scale with increased cord blood lead levels in the study conducted by Parajuli et al. 15 The higher blood lead levels in children with CP in the present study were the consequences rather than the cause of CP, because the majority of children in our study had risk factors pointing to etiology of CP.
In our study, detailed environmental history was recorded to know the source of exposure to lead in cases and controls. In the PC cases, the correlation of environmental history with mean blood levels revealed pica and outdoor activities in soil were associated with higher lead levels. Mean blood lead levels were 12.33 ± 10.02 µg/dL in children with history of pica and 6.07 ± 4.60 µg/dL in children who did not have history of pica (P = .029). Pica as a risk factor for raised lead levels has been documented previously. 16 Mean blood lead levels were 10.32 ± 9.06 µg/dL in children spending time in outdoor sites containing contaminated soil and 5.56 ± 3.47 µg/dL in children who did not have such history(P = .004). Increased lead levels due to ingestion of household paint, dust, soil, via hand to mouth activity in children attending special education institute has been documented by Rojas et al. 17 Similarly, Kumar et al 7 also demonstrated higher mean blood lead levels in children with pica. An increased incidence of pica has been found to occur in children with central nervous system congenital anomalies and in patients taking antiepileptics. 18
The results revealed that there was no significant difference with age in the mean blood lead levels (P > .05). There was no significant difference with sex in the mean blood lead levels (P > .05). The blood lead levels did not correlate with hemoglobin in cases and controls.
Lead levels in CP children have been studied in very few studies, and comparison with age- and sex-matched controls have not been carried out previously. The effect of environmental factors has also been evaluated. Our study was conducted with a small sample size and detailed evaluation of lead levels in water and soil could not be done. Moreover, IQ assessment could not be done in all children showing how raised lead levels affect IQ. Hence, in our study children with CP were found to have higher blood lead levels as compared to neurologically normal children, but additional studies need to be considered in order to further support this relationship. They may have higher blood lead levels because of pica and other micronutrient deficiencies. Raised lead levels in these children may further decline their already compromised cognitive and intellectual functioning. Routine estimation of lead levels in them may not be cost-effective as shown in a study by Feldman and Chen. 19 Further studies are required to document the clinical effects of lead levels.
Author Contributions
NB: Contributed to conception and design; contributed to acquisition, analysis, and interpretation; drafted manuscript; gave final approval; agrees to be accountable for all aspects of work ensuring integrity and accuracy.
AA: Contributed to conception and design; contributed to analysis and interpretation; drafted manuscript; critically revised manuscript; gave final approval; agrees to be accountable for all aspects of work ensuring integrity and accuracy.
MAAF: Contributed to design; contributed to analysis and interpretation; critically revised manuscript; gave final approval; agrees to be accountable for all aspects of work ensuring integrity and accuracy.
TS: Contributed to conception; contributed to analysis and interpretation; drafted manuscript; gave final approval; agrees to be accountable for all aspects of work ensuring integrity and accuracy.
BDB: Contributed to conception; contributed to analysis and interpretation; critically revised manuscript; gave final approval; agrees to be accountable for all aspects of work ensuring integrity and accuracy.
Footnotes
Declaration of Conflicting Interests
The author(s) declared no potential conflicts of interest with respect to the research, authorship, and/or publication of this article.
Funding
The author(s) disclosed receipt of the following financial support for the research, authorship, and/or publication of this article: Intramural Research Grant for Chemicals, University College of Medical Sciences.