
Abstract
This study compared the growth of healthy infants fed a hypoallergenic 100% whey-based extensively hydrolyzed formula (EHF) with Bifidobacterium lactis (test) with that of infants fed an extensively hydrolyzed casein formula (control). Formula-fed infants (14 ± 3 days) were randomized to test or control groups until 112 days of age. Anthropometrics were assessed at 14, 28, 56, 84, and 112 days, and daily records were kept for 2 days prior to study visits. Serum albumin and plasma amino acids at 84 days were assessed in a subset. A total of 282 infants were randomized (124 test, 158 control). Significantly more infants dropped out of the control (56%) as compared with the test (41%) group. Mean daily weight gain was significantly higher in the test group compared with the control group (27.95 ± 5.91 vs 25.93 ± 6.12 g/d; P = .027) with the test group reporting significantly fewer stools (2.2 vs 3.6 stools/d; P < .0001). The control group reported significantly more days with >3 loose stools/d and a higher incidence of vomiting as compared with the test group. There were no differences in gas, mood, sleep, or serum albumin. Plasma arginine and valine were significantly lower in the test group, whereas leucine and lysine were higher; all values were within normal limits. Significantly more adverse events attributed to the study formula were reported in the control group. The 100% whey-based hypoallergenic EHF containing Bifidobacterium lactis and medium chain triglycerides supported growth of healthy infants. Future studies on the application of this formula in clinically indicated populations are warranted.
Background
It is widely accepted that breastfeeding is the gold standard to promote optimal growth and development of newborns. Cow’s milk–based infant formulas are often used to supplement breast milk or used exclusively in infants whose mothers choose not to breastfeed. Approximately 2% to 3% of infants are allergic or intolerant to cow’s milk formula and require an alternative formula.1-3 The American Academy of Pediatrics (AAP) recommends extensively hydrolyzed formula (EHF) for the dietary management of infants who are allergic or intolerant to intact cow’s milk formula. 4
A new, 100% whey-based, extensively hydrolyzed, nutritionally complete infant formula designed for the dietary management of infants with cow’s milk protein allergy has been developed. This EHF also contains the probiotic Bifidobacterium lactis (B lactis CNCM I-3446). Supplementation of infant formula with probiotics (live microorganisms capable of colonizing the intestinal tract to beneficially influence host health) may provide benefits beyond general nutrition. B lactis is a well-characterized bifidobacteria strain originally isolated from human feces. It has been extensively studied in in vitro and clinical studies in pediatric populations.5-9 This probiotic has a designated Generally Recognized as Safe (GRAS) status for use in routine infant formulas, and it has been utilized in infant formulas for more than 15 years worldwide.
The medium-chain triglyceride (MCT) content of this formula as compared with commercially available EHFs in the United States is relatively high (49% of fat source). MCTs provide a readily available fat source designated for use in conditions of fat malabsorption. These triglycerides have fatty acids with chain lengths ranging from 6 to 12 carbons in length and are able to be absorbed into the portal circulation independent of bile acids and pancreatic enzymes and more rapidly than long-chain triglycerides (LCTs). 10 Because their intraluminal hydrolysis is rapid and relatively complete, MCTs are absorbed mainly as free fatty acids and only rarely as monodiacylglycerols. In addition, MCTs are a good source of acetyl groups, which are useful in lipid synthesis.
The present study evaluated the effects of this new formula on overall growth and tolerance in healthy, term infants by comparing weight gain in healthy infants receiving this new EHF infant formula with a group of infants receiving a similar commercial formula from 2 weeks to 4 months of age. Additional measures included length and head circumference (HC), feeding tolerance, serum albumin and plasma amino acids.
Methods
This study was a randomized, controlled, double-blind, multicenter clinical trial of 2 formula groups in parallel conducted at 25 sites throughout the United States. Participants were healthy, full-term (>37 weeks gestation), exclusively formula-fed infants with birth weights ranging from 2500 to 4500 g, whose caregivers had given informed consent to participate in the study. Caregivers had chosen to exclusively formula feed their infants prior to study enrollment. Exclusion criteria were the following: congenital illness or malformations that affected infant feeding and/or normal growth, suspected or known allergy to cow’s milk protein, significant prenatal and/or postnatal disease, any readmission to hospital (except for hyperbilirubinemia) prior to enrollment, receiving oral or intravenous antibiotic therapy in the 10 days prior to enrollment or probiotics in the week before enrollment, or receiving prescription medication (with exception of topical antibiotics and/or treatment for thrush) or frequent use of over-the-counter medications, except vitamin and mineral supplements.
At 14 ± 3 days of life, after receiving informed consent from caregivers, participants were randomized to either a 100% whey-based, extensively hydrolyzed infant formula with 49% of its fat source from MCT (test; Nestlé Nutrition, Florham Park, NJ) or a commercially available casein-based extensively hydrolyzed infant formula with 55% of its fat source from MCT (control; Pregestimil, Mead Johnson Nutritionals, Evansville, IN). Both formulas contained all the vitamins and minerals known to be essential for the healthy growth and development of infants and were lactose free. A comparison of the formulas is found in Table 1. The products were labeled with the same study number, with the only discernable difference being the label color. The identity of the specific product was unknown to caregivers, enrolling sites’ support staff, study managers of the CRO and sponsor, the statistician, and the investigators.
Product Descriptions.
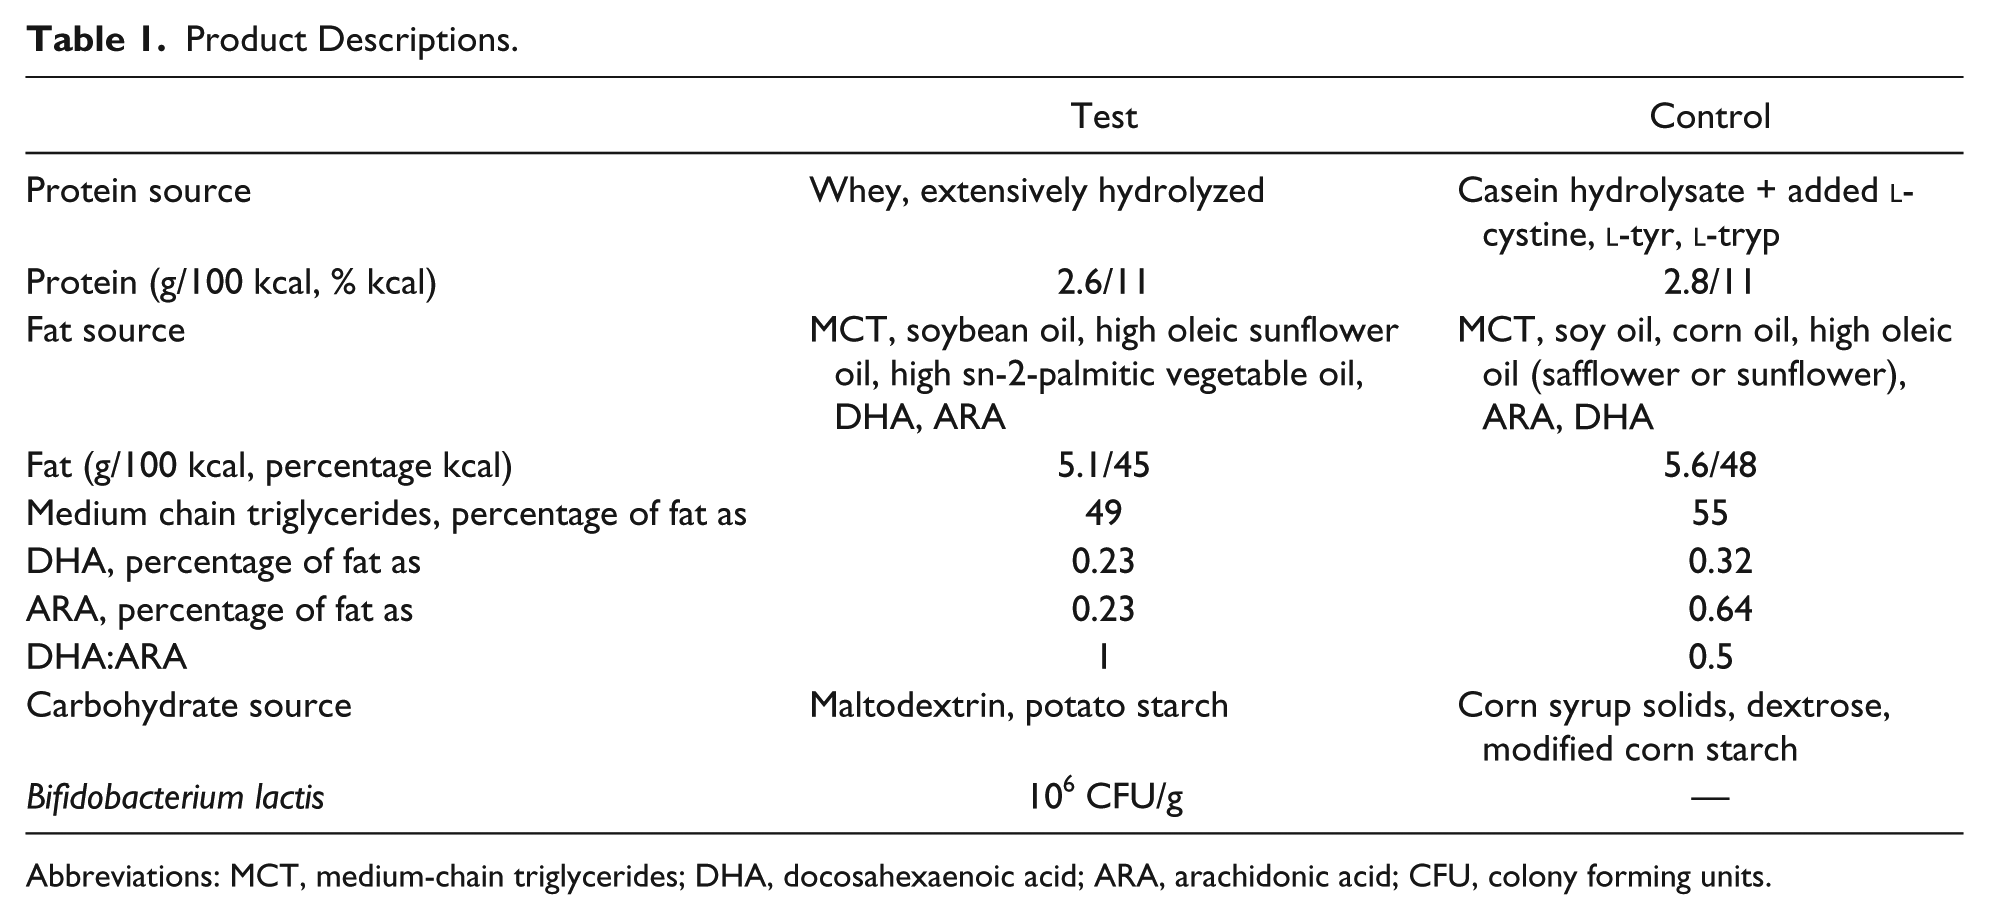
Abbreviations: MCT, medium-chain triglycerides; DHA, docosahexaenoic acid; ARA, arachidonic acid; CFU, colony forming units.
Participants received the assigned study formula as their exclusive source of nutrition until 112 days of life. Study visits were scheduled at 14, 28, 56, 84, and 112 days of life, where weight, length, and HC were measured. For 2 days prior to each study visit, caregivers kept a detailed record of formula intake, stool characteristics, spit-up, vomit, longest stretch of sleep, and mood of the infant. Adverse events (AEs) were assessed throughout the study. In a subset of 41 infants (n = 21 in the test, n = 20 in the control group), a blood sample was taken at 84 days of life for analysis of serum albumin and plasma amino acids.
The first participant was enrolled in December 2010. The last participant completed the study in May 2013. Institutional review board (IRB) approval was given by Copernicus Group IRB (Durham, NC), and for sites affiliated with medical schools/universities, their respective IRBs gave their approval. The study was registered with clinical trials.gov (NCT01210391).
Statistical Methods
The primary objective of this clinical trial was to assess growth (weight gain in grams per day) in infants fed the test formula compared with those fed the control formula. In each study group, the number of participants to complete the study protocol was 56. The sample size was chosen according to FDA contract 223-86-2117, “Clinical Testing of Infant Formulas with respect to Nutritional Suitability for Term Infants,” AAP-CON, June 1988. 11 The document states, “The standard deviation of gain in weight on a sex-specific and formula-specific basis for a 3-1/2 month interval beginning during the first month of life is about 4.5 g/d. The number of subjects of a specified sex needed in each of two groups to detect a 3 g/d difference in weight gain (P < .05) with a power of 0.8 in a one-tailed test is therefore 28.” A sample size of 56 per treatment group (with both genders) was, thus, required.
All statistical analyses were performed using SAS statistical software (version 9.2). Statistical significance was tested at the 1-sided 5% level unless otherwise specified. Continuous safety and effectiveness parameters were summarized by presenting the number of subjects, mean, standard deviation, median, minimum, and maximum by formula group (test or control). Tabulation of categorical parameters by formula group included counts and percentages, and 95% CIs were provided as appropriate. All randomized participants were analyzed using the following analysis populations. The primary outcome was analyzed in the intent-to-treat (ITT) and per protocol (PP) populations. Secondary outcomes, including safety end points, were analyzed in the ITT population.
The ITT population was defined as all randomized participants who took any amount of the study formula. The PP population was defined as those who took study formula continuously over the whole treatment period. A break of no longer than 3 days was accepted. In addition, those with the following conditions were excluded from the PP population: hospitalization for more than 3 days and nonexclusive feeding of assigned formula during the first 4 months of the study. A nonexclusive formula diet was defined as follows: more than 1 bottle of another formula per week, or being off study formula feeding for ≥3 consecutive days, or taking 4 or more teaspoons (ie, 20 g) of complementary foods per day, and/or taking more than 3 oz of juice per day.
Results
Caregivers of 282 infants consented to their infants participating in the study. They were randomized to control (n=158) or test (n=124). The first 229 eligible participants were randomly assigned in a 1:1 ratio, stratified according to the center, separately for boys and girls. During the study, it was noted that one group had a higher drop-out rate than the other; in November 2012, to deliver 56 completed participants per group in a timely manner, the last 53 eligible participants were randomly assigned in a 1:4 ratio in favor of the group with the higher drop-out rate. A total of 139 (49%) participants did not complete the study (either did not complete the final study visit or did not complete the study PP; Figure 1) The control group had a significantly higher overall drop-out rate than the test group (56% vs 41%, respectively; P = .015), with a significantly higher number of drop-outs caused by AEs (26% vs 15%, respectively; P = .019) and lost-to-follow-up (14% vs 4%, respectively; P = .005) as compared with the test group.

CONSORT flowchart depicting numbers of participants who withdrew throughout the study and who were removed from the PP analysis.
Demographics of the ITT population for the 2 groups are presented in Table 2. No differences were observed in race, sex, route of delivery, or gestational age between groups. Birth weight, length, and HC were similar between the groups. Mothers of infants fed with test formula had a higher education level (more individuals completing college) than mothers of infants fed with control formula (P = .026). At enrollment, there were no differences in smoking exposure between the groups; however, at the end of the study, significantly more infants in the control group had smoking in the household (13% in the test and 3% in the control group).
Demographics and Birth Anthropometric Information for the ITT Population. a

Abbreviation: ITT, intent to treat.
No significant differences were seen between groups with any parameter (P > .05).
Based on World Health Organization reference.
In the ITT population, there were no differences in the amount of formula intake between the groups (780 mL/d [26.36 oz/d] in the test group vs 806 mL/d (27.26 oz/d) in the control group; P = .445). However, in the PP population, the test group had a significantly (P = .033) lower intake than the control group (26.79 oz/d [792 mL/d] in the test group vs 29.83 oz/d [882 mL/d] in the control group).
Daily weights and weight gain for each study visit are shown in Table 3. Mean daily gains in weight (g/d) were computed from 14 ± 3 days to 112 ± 3 days for each infant. In the ITT population, the mean daily weight gain was 27.95 ± 5.91 g/d in the test group and 25.93 ± 6.12 g/d (within 3 g/d difference of each other; P = .027) in the control group. Looking at gender separately, mean daily gains in weight were 30.6 ± 4.8 g/d for boys and 24.5 ± 5.4 g/d for girls assigned to the test formula and 27.3 ± 6.0 g/d for boys and 24.3 ± 6.0 g/d for girls assigned to the control formula. There was a significant difference by formula assignment in mean daily weight gain in boys (P = .004) but not in girls.
Daily Weight Gain and Weights at Each Visit, ITT and PP Populations. a

Data expressed as means ± SD.
Based on World Health Organization reference.
Indicates statistical significance between test and control groups (P < .05).
In the PP group, test boys and girls combined had a mean daily weight gain of 28.09 ± 6.17 g/d compared with 25.42 ± 6.47 g/d for the controls (within 3 g/d difference of each other; P = .020). Mean daily gains in weight in the PP group were 30.81 ± 5.29 g/d for boys and 24.83 ± 5.59 g/d for girls assigned to the test formula and 26.59 ± 5.68 g/d for boys and 23.65 ± 7.28 g/d for girls assigned to the control formula. There was a significant difference by formula assignment in mean daily weight gain in boys (P = .002) that was greater in the test group by more than 3g/d as compared with controls. No significant difference was observed in girls.
As seen in Table 3, for the ITT group, weight parameters (absolute value, z-score, and weight-for-age percentile based on World Health Organization [WHO] reference) were significantly greater in the test group for boys and gender combined at 56, 84, and 112 days of age. In the PP population (Table 3), no statistical differences existed except in boys at 112 days of age for absolute weight and weight-for-age percentiles and for boys and sexes combined at 84 and 112 days of age in z-scores, where the test group had greater weights for boys and sexes combined.
Because smoking exposure differed between the 2 groups, this was included in the mixed-effects model analysis for formula differences in weight gain. The model revealed no effects of smoking in mean weight gain per day within formula assignment. The statistical difference seen between weight gain in test infants who had not been exposed to smoking and the ITT control infants who were exposed was not seen in the PP group.
For the ITT population, boys in the test formula were significantly longer (absolute values at all time points; length-for-age z-scores at 84 and 112 days; length-for-age WHO percentiles at 56, 84, and 112 days) than the boys in the control group at all time points. These differences were not seen for girls or when the sexes were combined. Within the PP population, no differences in length, rate of length gain, length-for-age z-scores, or percentiles were seen at any visit for boys, girls, or sexes combined.
In the ITT population, for boys and for sexes combined, the test group had significantly greater HC (absolute values, z-scores, and HC-for-age percentile) at 28, 56, 84, and 112 days. Girls in the test group had significantly greater HC than girls in the control group (absolute values and HC-for-age z-scores at 56 and 84 days and HC-for-age percentiles at 28 and 56 days).
In the ITT sample, there were significantly more infants in the control group whose weight-for-age fell below the fifth percentile. There were no statistically significant differences in the incident rates of infants whose measurements fell below the fifth percentiles of the relevant WHO growth charts for length for age, weight for length, and HC for age. Over the study period, 12 infants in the test group (10%) and 33 infants in the control group (22%) had at least 1 incident of weight less than the fifth percentile (P = .011). In the PP population, 8 infants in the test group (12%) and 17 infants in the control group (21%) had at least 1 incident of weight for age less than the fifth percentile (P = .014).
Stool frequency, color, and consistency are reported in Table 4. In general, the control group had more frequent stools (3.6 stools/d in the control group vs 2.2 stools/d for visits combined; P < .0001) that were more yellow (41% in the control vs 25% in the test group; P = .0014) and liquid (34% in the control vs 6% in the test group; P < .0001). Similar results were seen in both the ITT and PP populations (Table 4).
Stool Characteristics. a

Abbreviations: ITT, intent to treat; PP, per protocol.
Data expressed as mean ± SD. For color and consistency, the mean proportion of all stools categorized as a particular color or consistency is stated.
Frequency of spit-up and vomitting was also documented for 2 days prior to each visit. For visits combined, the ITT test group reported “none” for frequency of spitting up, significantly more than the control group. This was not significant in the PP group (36% reporting “none” in the test group vs 34% in the control group; P = .731). A significantly (P = .034) higher percentage of infants in the control group experienced vomiting (13%) than those on test formula (7%) in the ITT population; this difference was not observed in the PP population (6% in the test, 9% in the control group; P = .26). There were no differences in flatulence between the groups for either the ITT or PP populations.
No differences were seen in mood, as categorized on a scale of 1 to 5, with 1 being happy and 5 indicating very irritable. Nearly 80% of the time, infants in both the test and control groups of both the ITT and PP populations indicated a mood of a 1 or 2. No differences were also seen in the longest stretch of sleep recorded by caregivers between the groups.
In total, 846 AEs were reported throughout the course of the study (39% in the test and 61% in the control group). Infants assigned to test formula had significantly (P < .001) fewer AEs than infants assigned to control formula. In the test group, 14% of the AEs were reported to be definitely or probably related to the formula by the site investigator; in the control group, 29% of the AEs were reported to be definitely or probably related to the formula. The most frequently reported AEs included loose stools, cough, and nasal congestion. In total, 15 participants had a serious AE (SAE) throughout the study. All these SAEs were deemed to be unrelated or unlikely to have a relationship to the study product. Six participants in the test group had an SAE, and 9 in the control group had an SAE.
A blood sample was taken from a subset of infants (n = 42; 21 in the test and 21 in the control group) at 84 days for serum albumin and plasma amino acid analysis. Serum albumin was similar between the 2 groups and within normal limits (4.31 ± 0.27 g/dL in the test and 4.25 ± 0.38 g/dL in the control group). The test group had significantly (P < .05) lower levels of valine and arginine and higher levels of leucine and lysine. Values for these amino acids were all within normal limits for both groups. Both groups had higher values of aspartic acid than the reference range.
Discussion/Conclusion
Mean daily weight gains from 14 to 112 days were 27.95 g/d in the test group and 25.93 g/d for the control group in the ITT population. This difference was statistically significant, although the difference between the 2 groups fell within the AAP-CON recommended difference of 3 g/d used to establish noninferiority between different infant formulas. 11 Furthermore, the weight gain observed in both groups was within the expected range of typical growth in infants of this age. Two growth studies of EHFs have been recently published. One compared growth in infants fed an extensively hydrolyzed casein formula versus an amino acid–based formula, 12 whereas the other compared a liquid and powder EHF. 13 In these studies, the growth observed in the EHF groups was 28.2 g/d, 12 28.9 g/d, and 28.4 g/d, 13 which is comparable to the growth that the sexes combined in the test group (27.95 ± 5.91 g/d) exhibited in the study presented here.
When looking at the PP analysis, for boys and girls combined, there was a statistical difference between groups for daily weight gain (28.09 g/d in test vs 25.42 g/d in control; P = .020). As in the ITT analysis, this difference was within the AAP-CON recommendations 11 (difference of 2.67 g/d). Similar to the ITT analysis, in the PP group, boys in the test group had significantly greater weight gains than those in the control group, with the difference in the PP group being 4.22 g/d (30.81 g/d in test boys; 26.59 g/d in control boys). The study was designed to show noninferiority of the test product as compared with the control formula; it was not expected to show superiority of one product over another in terms of growth differences >3 g/d for sexes combined or separately. The result that boys in the test group had significantly greater daily weight gains and that this difference was greater than the AAP-CON recommended 3 g/d difference, was unexpected. For the purpose of the original intent of the study, noninferiority was demonstrated in terms of growth for the test formula.
It is uncertain why the boys in the control group had statistically significantly lower weight gains. Formula intakes of the PP population between the groups were statistically significantly greater at 84 and 112 days of age and for visits combined in the control group; therefore, the difference in weight gain could not be attributed to less volume intake. Although not evaluated, perhaps differences in actual stool volume could have affected weights. Participants in the control group did have significantly more stools. The osmolality of the control formula is 320 mOsm/kg water, whereas the test formula is 217 mOsm/kg water. While neither formula is hypertonic, it is possible that this difference in the formula could have affected stool consistency, with looser stools being seen in the control group (34% in the control compared with 6% in the test group; Table 4). This could have affected the weights observed in this study. It is important to note that for sexes combined, differences in weight gain were within 3 g/d. One difference seen was between parents/caregivers of infants assigned to control formula or test formula, where significantly more parents/caregivers of infants in the control formula group smoked than parents/caregivers of infants in the test formula group in the ITT sample. Also, maternal education was higher in the test group. Although this may have affected feeding practices, it is uncertain why any effects of either of these factors would have been seen in boys but not in girls.
There were some stool pattern similarities observed in this study as compared with other studies of EHFs.12,13 In a study comparing an extensively hydrolyzed casein-based formula with an amino acid-based formula, the stool frequency in the extensively hydrolyzed casein formula group was reported as 3.5 stools/d at day 14 and 2.9 stools/d at 28 days. 12 This is comparable to the control group in our study (3.6 stools/d), and the protein hydrolysate base used in both these formulas was from the same manufacturer. A stool frequency of 1.5 to 3.2 stools/d when using a liquid casein-based EHF and 1.2 to 2.5 stools/d when using a powder casein-based EHF has also been reported. 13 This is lower than what was observed in the powder control group of this study. In comparison, the whey-based test group in studied here reported 2.2 stools/d, which is less than the frequency observed for the control group of this study as well as in other studies evaluating EHF.12,13 Stool consistency was reported on a different scale than used in this study; however, it was noted that compared with an amino acid–based formula, stools in the EHF group were more firm at 14 and 28 days of life. 12
Both test and control groups had higher-than-expected drop-out rates, with a significantly higher drop-out rate in the control group (56%) as compared with the test group (41%). Participants in this study were healthy infants, with no clinical indication for an EHF; therefore, the unusual smell/taste consistent with these formulas could have prompted caregivers to withdraw their infants from the study. A limitation of this study is that the population consisted of healthy infants who may not have the necessity to use an EHF. Further studies on the longer-term use of this formula in specific populations such as infants with cow’s milk allergy are warranted. It would be interesting to compare drop-out rates in such a population with that seen in this study because infants with cow’s milk allergy may require use of an EHF.
In conclusion, a multicenter 4-month trial was conducted to establish noninferiority in weight gain between a new 100% whey-based EHF and a control formula. Study results confirmed daily weight gain between groups within 3 g/d for sexes combined. Therefore, the study objective was met, with adequate growth demonstrated in infants fed the new 100% whey-based EHF.
Author Contributions
DF was responsible for recruitment of majority of subjects, interpretation of results, and critical review and input into the manuscript. LC participated in the design of the study, coordination of acquisition of data, interpretation of results, and wrote the first draft of the manuscript. SS was responsible for the statistical analysis of the study. H. Storm participated in the design of the study, interpretation of results, and critical review and input into the manuscript. JS initiated the study, provided medical oversight throughout the study, participated in interpretation of results and critical review and input into the manuscript. RS, the study PI, participated in the design of the study, recruitment of subjects, interpretation of results, and critical review and input into the manuscript. All authors read and approved the final manuscript.
Footnotes
Acknowledgements
The authors would like to acknowledge study investigators and their staff for their cooperation.
Authors’ Note
Trial registration: This study was registered at clinicaltrials.gov, NCT01210391.
Declaration of Conflicting Interests
The author(s) declared the following potential conflicts of interest with respect to the research, authorship, and/or publication of this article: L. Czerkies, H. Storm, J. Saavedra are all employees of Nestlé Nutrition.
Funding
The author(s) disclosed receipt of the following financial support for the research, authorship, and/or publication of this article: This study was funded by Nestec SA.