
Abstract
Social isolation is a well-documented contributor to poor mental and physical health, and interventions promoting social connectedness have been associated with various health benefits. This study examined predictors of participation in a telephone-based social connectedness intervention for socially isolated older adults. Data were obtained from a social-connectedness intervention that paired college students with Houston-area, community-dwelling adults aged 65 years and older and enrolled in Medicare Advantage plans. We combined machine learning and regression techniques to identify significant predictors of program participation. The following machine-learning methods were implemented: (1) k-nearest neighbors, (2) decision tree and ensembles of decision trees, (3) gradient-boosted decision tree, and (4) random forest. The primary outcome was a binary flag indicating participation in the telephone-based social-connectedness intervention. The most predictive variables in the ML models, with scores corresponding to the 90th percentile or greater, were included in the regression analysis. The predictive ability of each model showed high discriminative power, with test accuracies greater than 95%. Our findings suggest that telephone-based social-connectedness interventions appeal to individuals with disabilities, depression, arthritis, and higher risk scores. scores. Recognizing features that predict participation in social-connectedness programs is the first step to increasing reach and fostering patient engagement.
Keywords
What this paper adds?
Telephone-based social-connectedness interventions appeal to older adults with disabilities, depression, arthritis, and higher risk scores.
Future social connectedness programs tailored to those most likely to engage, as identified in this work, could observe reductions in potentially preventable emergency department visits and inpatient admissions, which would lover overall total spend on care.
Recognizing features that predict participation in social-connectedness programs is the first step to increasing reach and fostering patient engagement.
Introduction
Social isolation has broad consequences for individuals of all ages and substantially contributes to poor mental and physical health among older adults specifically, making it a major public health and social concern. Despite research highlighting the prevalence of social isolation and loneliness across the older-adult population, efforts to combat social isolation are still limited in their reach. Reports of social isolation and loneliness have markedly increased since the COVID-19 pandemic (Adepoju et al., 2022), driven in part by a higher risk for COVID-19 complications and mortality in older adults, which necessitated increased social distancing and self-isolation during the pandemic (Shoaib et al., 2021). A University of Michigan poll conducted in June 2020 found 56% of older adults reported feeling isolated compared to 27% before the pandemic in 2018, with an exponential increase in feelings of loneliness (Piette et al., 2020). The impact of social isolation on mental and physical health has led to the development and design of appropriate interventions to mitigate its impact.
Several multidisciplinary efforts have arisen to combat social isolation; however, the success of these programs has varied by population and program characteristics. A recent review evaluated loneliness and social-connectedness interventions in older adults and found successful strategies are rooted in “purposeful activity and maintaining contact with one’s social network” (O’Rourke et al., 2018). Another review categorized successful approaches to enhance social connection in older adults into four groups: (a) intergenerational programming, (b) aging-friendly neighborhoods or communities, (c) community-based, physical group activities, and (d) technology (Suragarn et al., 2021). All four approaches significantly improved emotional well-being (Gonyea & Burnes, 2013), sense of belonging (Jang, 2020), physical activity levels (Franke et al., 2021), and meaningful connections with family and friends (Tsai et al., 2015). During the COVID-19 pandemic, many interventions focused on technological strategies to connect individuals while adhering to social-distancing guidelines. One particularly promising intervention incorporated a web-based social-connectedness platform that facilitated peer communication among older adults. Investigators noted that reading messages on the website correlated to feeling less depressed during the 1-year follow-up period (Hwang et al., 2021). These findings suggest that effective social-connectedness interventions can help improve social skills, enhance social support of older people, provide them with more opportunities for social interactions, and target maladaptive social cognition (Masi et al., 2011). However, a common thread across these studies is that they report pre-post changes in effectiveness and pay little or no attention to non-participants who would have been eligible for such interventions, but did not participate. As such, there is limited information regarding differences between people who participated and those who did not.
Social connectedness interventions in older adults tend to have low participation rates (Balki et al., 2022) with studies of such interventions often reporting this as a limitation (Ibarra et al., 2020). For example, Kwok et al. (2021), reported a 20% participation rate in a center-based group exercise program for older adults. An older study on factors associated with participation in a community senior health promotion program reported low participation rates, with 103 participants and 531 non-participants (Buchner & Pearson, 1989). This low participation has prompted interest in understanding motivators and predictors of participation. While information about reasons for participation in social connectedness interventions among older adults is limited, one qualitative study (Cohen-Mansfield, 2022) identified self-reported need for support and companionship as motivators for engagement.
The paucity of literature highlights a need to recognize individuals most likely to enroll/engage in social-connectedness programs. Acknowledging and understanding individuals who are more likely to participate in these interventions allows researchers to leverage their willingness to engage as a potential factor in enhancing intervention effects. It is equally important to understand individuals who are not likely to engage in these types of intervention to address gaps and design programs to better meet their needs. Predictors of engagement can allow for interventions to be specifically tailored to criteria that will appeal to the whole spectrum of individual engagement level, resulting in maximum participation. Using supervised machine-learning approaches as well as traditional linear regression methods, this study examined predictors of participation in a telephone-based social-connectedness intervention for older adults.
Methods
Program and Data
Data were obtained from a social-connectedness intervention pairing college students with Houston-area, community-dwelling adults aged 65 years and older and enrolled in Medicare Advantage plans (n = 18,960). Inclusion criteria for older adults was based on (1) membership in a large payer’s Medicare Advantage (MA) plans, (2) residence in the Houston, Texas at the time of the study, (3) aged 65 years or older at the time of the study, and (4) previous documentation of socially isolation and/or loneliness. We excluded persons who died, changed plans, opted out/declined the intervention. Eligible older adults who indicated interest in the program were partnered with students, who spent an average of 1 hour weekly, up to 16 weeks, with each older adult assigned to them. Additional details about the program enrollment process are captured in an earlier study. (Adepoju, Jennings, Schrader, Reeve, McManaman-Bridges, Gilbert, King, Dobbins, Rollins, Cockerell, Woodard and Torres-Hostos, 2022)
Measures
Explanatory Variables
The following explanatory variables were included in the machine-learning models: subject demographic characteristics, Medicare enrollment information, healthcare utilization patterns over the past year, Medicare risk adjustment indices, and comorbidities. Demographic characteristics included age, gender, race/ethnicity, English-language fluency, disability status, and low-income status. Medicare enrollment information included coverage length in months, Medicare/Medicaid dual enrollment, prior enrollment (within the past year) in a special needs plan (SNP), and participation in a primary care provider (PCP) attribution shared risk program. Health care utilization patterns included rates of emergency department (ED) visits, inpatient (IP) admissions, and IP days. Risk indices included Charlson Comorbidity Index (CCI), Functional Comorbidity Index (FCI), Medicare risk score, and Medicare prescription risk scores. Comorbidities were captured using condition flags that indicate the presence or absence of the following conditions: Acute Myocardial Infarction (AMI), Arthritis, Asthma, Anxiety, Back problems, Cardiovascular Disease (CVD), Connective Tissue Disease, Congestive Heart Failure (CHF), Chronic Obstructive Pulmonary Disease (COPD), Dementia, Depression, Diabetes, Hemiplegia, HIV/AIDS, Liver problems, any Malignancy, Myocardial Ischemia, Neurological conditions, Obesity, Osteoporosis, Peripheral Vascular Disease, Renal conditions, Stroke, Vision issues, and Ulcers.
Outcome of Interest
The primary outcome was a binary flag indicating participation in the telephone-based social-connectedness intervention. While attempts were made to reach all eligible participants (telephonically), the reach rate was 32%, and only 4% of eligible subjects participated in the program. Participants are defined as those who were eligible, reachable, enrolled, and participated in more than one phone call. Non-participants included those who were eligible but were unreachable or did not respond to the participation invitation.
Analytic Approach
Machine Learning Model Development
The following supervised machine-learning methods for classification were implemented to predict older-adult participation in the social-connectedness intervention: (1) K-nearest neighbors (KNN), and (2) decision tree and ensembles of decision trees, including (3) gradient-boosted decision tree and (4) random forest. The four models used in this study were chosen based on their previously shown strong discriminative performance in prediction-related classification problems (Kongsompong et al., 2021; Petrescu et al., 2021). For each model, we split the data into a training data set (75% of the data) and a testing data set (25% of the data) using the train-test-split technique in the scikit-learn package within Python, which incorporates random sampling without replacement, resulting in no significant differences in study variable distribution in the training and testing datasets. The training data were used to predict intervention participation as a function of the predictor variables.
A total of 59 predictive features were used in the training models (the same 59 features were used in all four models) and the feature importance scores were used to identify the contribution of each feature to the predictive strength of the models. The prediction models were built using the best-fitting parameters for each model, which were obtained by GridSearchCV with fivefold cross-validation. GridSearchCV is an approach (provided in the scikit-learn software machine-learning library in Python) that exhaustively considers all combinations of parameters to perform hyperparameter tuning of models. All analyses were performed in Python version 3.9.0.
Machine Learning Model Evaluation
The testing data set was used to evaluate the predictive performance of each model using (a) predictive accuracy (%) and (b) the area under the receiver operating characteristic (AUROC) curve. Accuracy and AUROC are commonly used evaluation metrics for predictive models, and are consistent with literature (Kongsompong et al., 2021; Petrescu et al., 2021). Accuracy represents the proportion of the total number of predictions that were correctly classified and is estimated as a ratio of the sum of true positives (TP) and true negatives (TN) divided by the sum of the TP, TN, false negatives (FN), and false positives (FP). The receiver operating characteristic (ROC) curve illustrates the trade-off between the model’s sensitivity and its specificity. Thus, the area under the ROC curve (AUROC) provides insight as a measure of diagnostic ability of a binary classification model.
Regression Model Development
After identifying two of the four machine learning models with the strongest predictive ability, we selected the most predictive variables to include in the regression model. We defined the most predictive variables as those with a feature importance score greater than or equal to 0.04 in either of the two machine learning models (see results section for the two machine learning models with the strongest predictive ability). Scores above 0.04 correspond to the 90th percentile or greater in the distribution of feature importance scores for either models. This criterion is similar to techniques employed for component retention in Principal Component Analysis (PCA) and are documented and discussed thoroughly by Cangelosi and Goriely (2007). The results section describes variables that were statistically significant in the logistic regression model and maintained a high R2 in the regression model.
Justification for Using Machine Learning Algorithms and Regression Analysis
There are many advantages to dual machine learning and traditional regression methodology. We use the predictive power of the machine learning models to narrow down the set of possible health and demographic characteristics in the data from hundreds of potential variables to the seven most applicable. This allows us to implement the regression model with only the most relevant independent variables thus minimizing potential bias and contemporaneous effects as well as researcher error in selecting the correct number of variables to include the regression model.
Results
Overall, the sample comprised 18,960 older adults. Table 1 shows the demographic characteristics by social-connectedness intervention participation status. About 40% of the sample were between 65 and 69 years old, 30% were between 70 and 74 years old, 17% were between 75 and 79 years old, and 13% were over 80 years old. Approximately 55% of the sample were female. Majority of the sample were non-Hispanic White (60%), 24% were non-Hispanic Black, 10% were Hispanic, and 4% were Asian. About 82% of the sample spoke English, 11% had dual enrollment in Medicaid and Medicare, 11% were disabled, and 18% were low-income. Only 5% of the sample were enrolled in an SNP. Intervention participation varied by gender, race/ethnicity, Medicare/Medicaid dual-enrollment status, disability status, low-income status, and SNP enrollment (all p < .001).
Demographic Characteristics by Intervention Participation Status (N = 18,960).
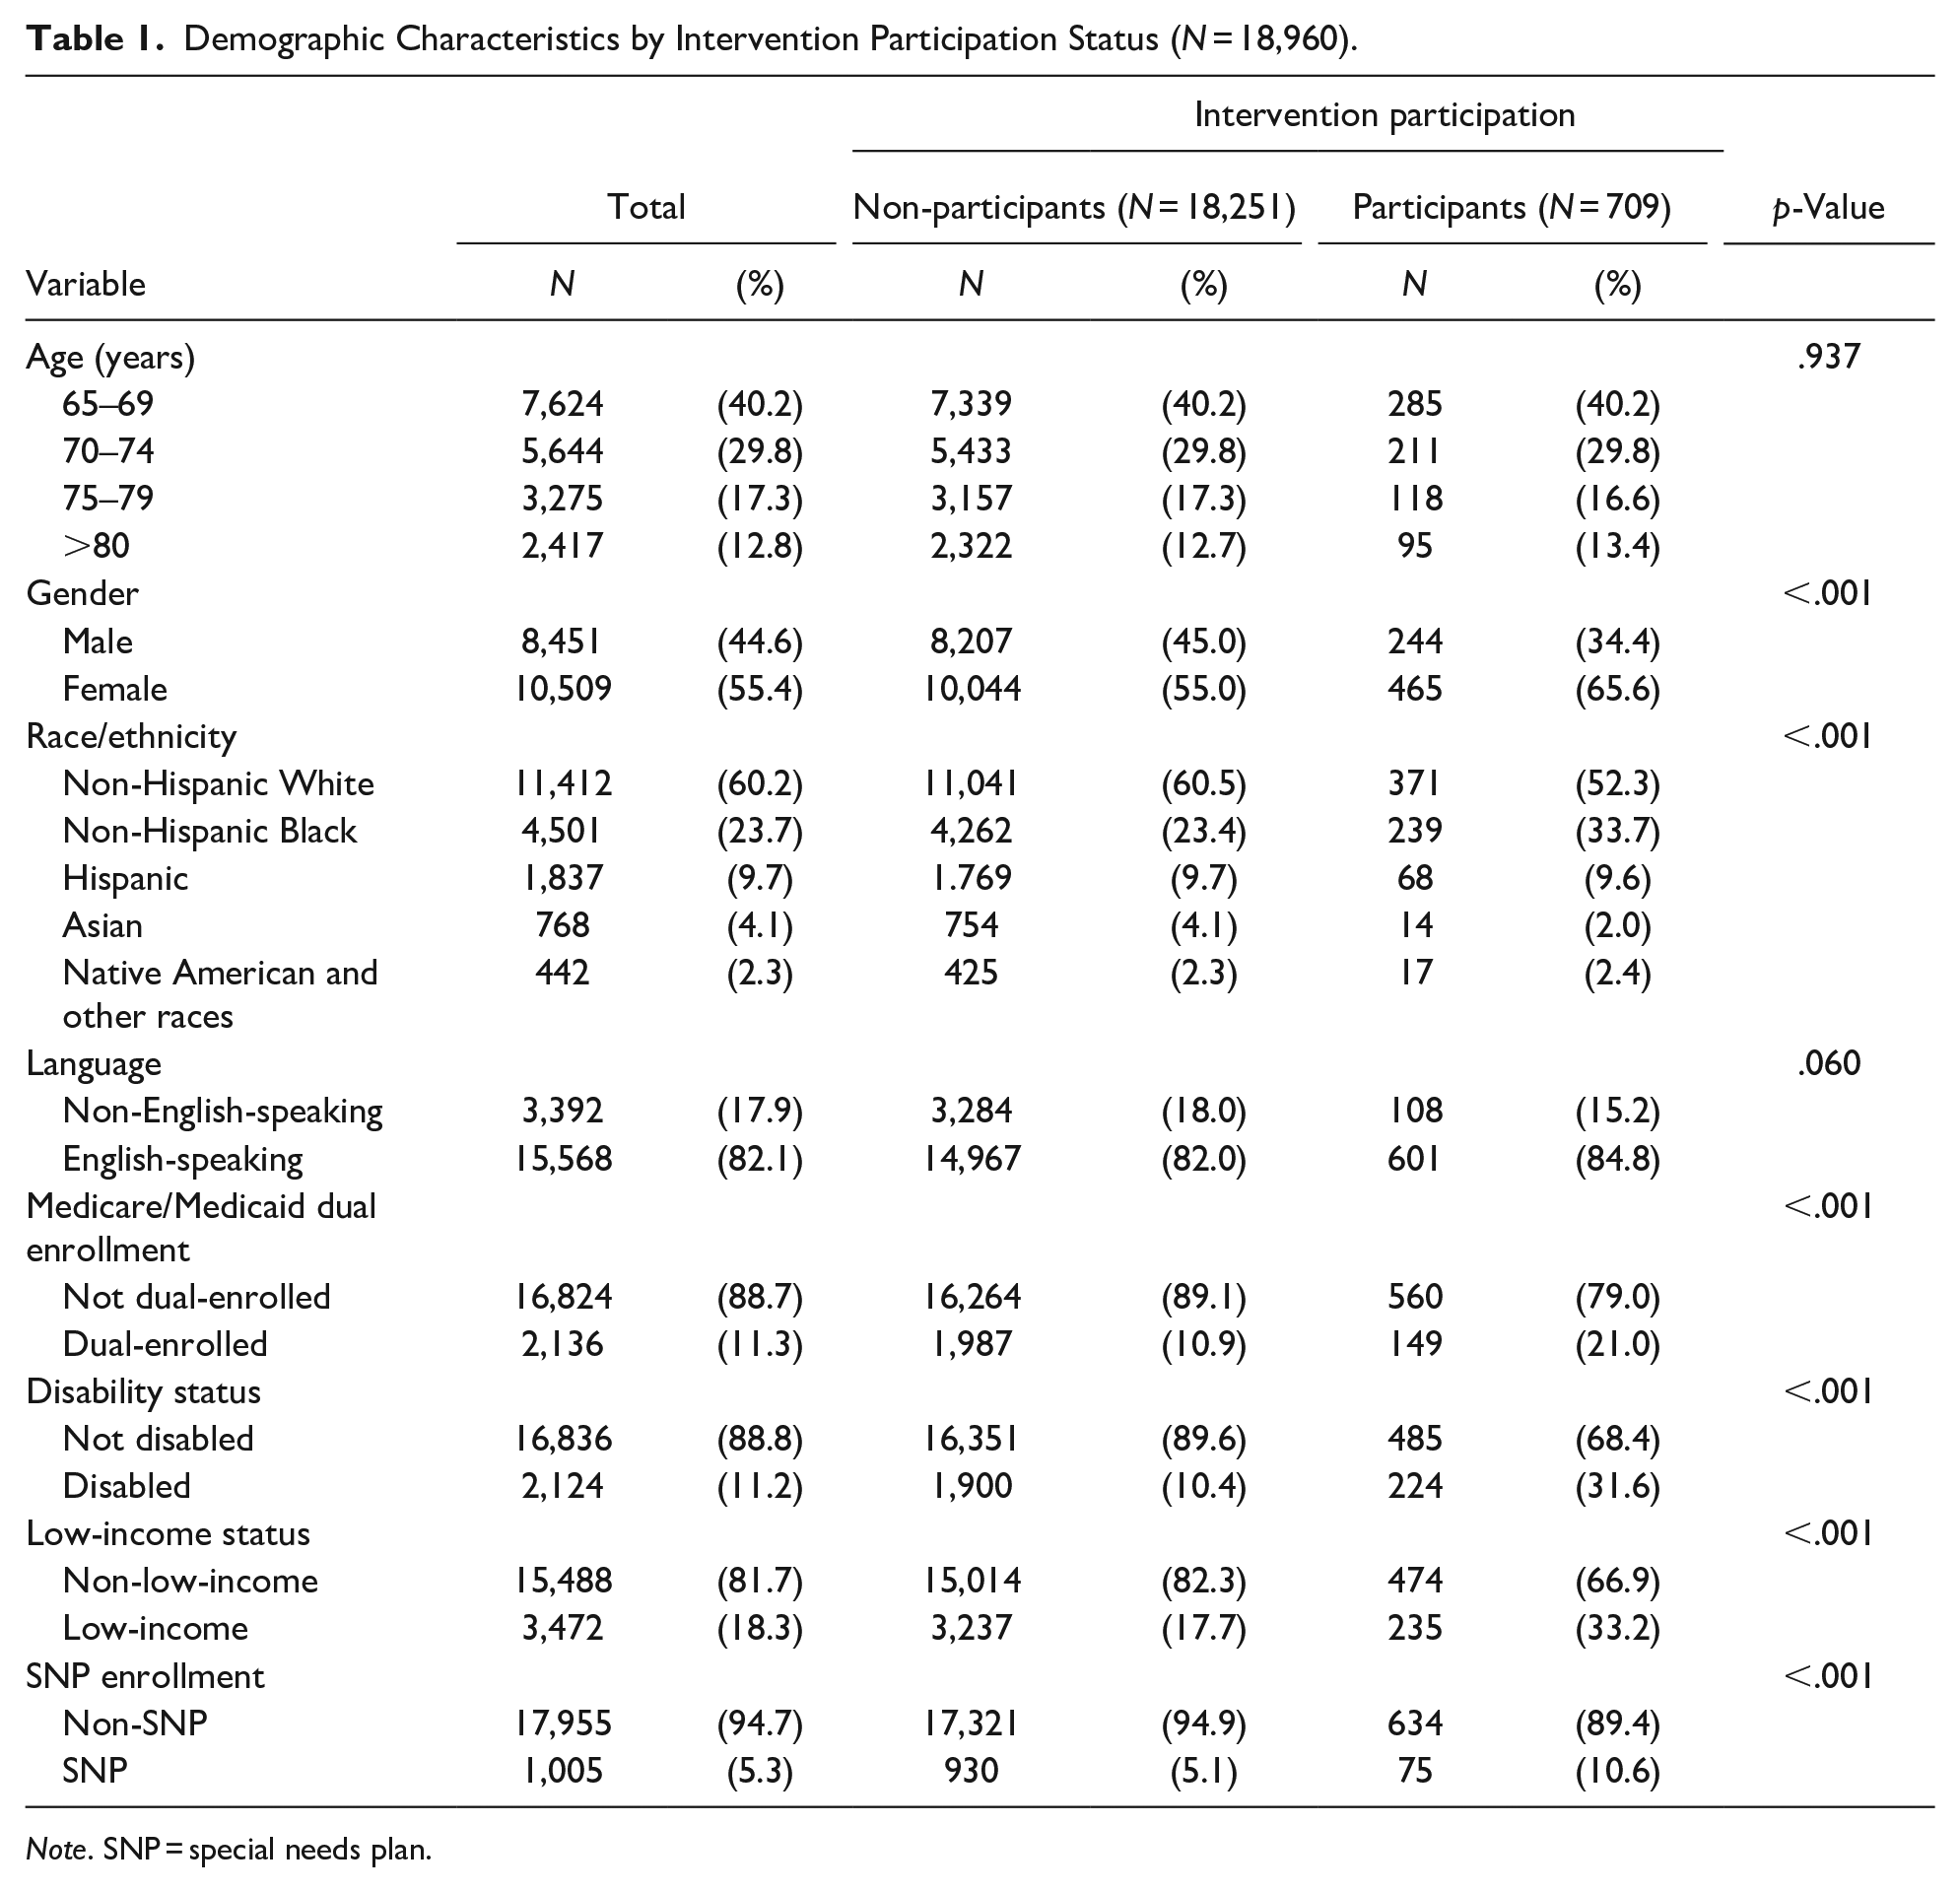
Note. SNP = special needs plan.
Prediction of Intervention Participation
Based on test accuracy (%) and AUROC, the random forest and gradient-boosted decision tree were the most predictive models. The predictive abilities of all models, represented by the test accuracy and AUROC, are shown in Table 2. The k-NN model with its best parameters yielded a test accuracy of 96.0% and an AUROC of 0.612. The decision tree model with its best parameters yielded a test accuracy of 96.1% and an AUROC of 0.647. The gradient-boosted decision tree model with its best parameters yielded a test accuracy of 96.1% and an AUROC of 0.739. The random forest model with its best parameters yielded a test accuracy of 96.1% and an AUROC of 0.740.
Predictive Performance of Each Model, Measured by Test Accuracy (%), and AUROC.

Note. AUROC = area under the receiver operating characteristics; KNN = K-nearest-neighbor.
Feature Importance
Figure 1 displays the feature importance in the random forest model for each predictor considered. The random forest model identified the most important features as Medicare risk score, Medicare prescription risk score, FCI score, CCI score, and race/ethnicity. Figure 2 displays the feature importance in the gradient-boosted decision tree model for each predictor considered. The gradient-boosted decision tree model identified the most important features to be Medicare risk score, Medicare prescription risk score, depression, FCI score, and disability status.

Feature importance plot of the random forest model predicting social-connectedness intervention participation in older adults.

Feature importance plot of the gradient-boosted decision tree model predicting social-connectedness intervention participation in older adults.
Logistic Regression Model
Together, the most predictive features from the random forest and gradient-boosted decision tree models were: FCI Score, Medicare prescription risk score, depression indicator, disability status, anxiety indicator, arthritis indicator, and Medicare Risk Score. After regressing the outcome of interest on the most predictive features, six of the seven features were significant at the 95% level (Table 3). Table 3 shows that individuals with a disability (OR = 2.49, 95% CI [2.08, 2.98], a diagnosis of depression OR = 2.02, 95% CI [1.65, 2.47], and a diagnosis of arthritis (OR = 1.28, 95% CI [1.07, 1.52] are significantly more likely to engage in social connectedness programs. Similarly, increasing Medicare risk scores (OR = 1.10, 95% CI [1.00, 1.20], Medicare prescription risk scores (OR = 1.17, 95% CI [1.06, 1.30], and FCI scores were associated with a higher likelihood of engagement.
Logistic Regression Model Examining Top Features From Random Forest and Gradient Boosted Tree Models.

Discussion
This study implemented dual machine-learning and regression approaches to identify important features for participation in a telephone-based social-connectedness intervention among older adults. Our dual approach has two advantages. (1) machine-learning offers the ability to consider higher-dimensional, complex interactions between predictor variables that traditional statistical modeling cannot address, and (2) machine learning provides a data driven approach for variable selection into the regression model—this is especially useful when using complex healthcare data that contains hundreds of potential variables. Based on machine learning models with the highest discriminative power, our analysis identified Medicare risk score, Medicare prescription risk score, FCI score, FCI flag for depression, disability status, anxiety, and arthritis to be the most important features. Both random forests and gradient-boosted decision trees provided moderately strong discriminative ability.
Our finding that individuals with higher functional comorbidity scores are more likely to participate in social-connectedness interventions aligns with previous research. An indicator of multimorbidity, higher FCI scores are associated with lower health-related quality of life (Fortin et al., 2005; O’Rourke et al., 2018). Because individuals with multimorbidity often require familial and social support to conduct activities of daily living (ADLs), a higher propensity to engage in social-connectedness interventions is expected, as they provide the necessary support to meet ongoing needs. Older adults with higher FCI are also likely to be more sedentary during COVID, potentially lonelier, and open to the connection that program participation offers. One specific comorbidity, arthritis, was one of the seven strongest predictors of program participation. A 2019 study found strong associations between osteoarthritis and risk of social isolation (Siviero et al., 2020). Symptoms such as joint pain could limit older adults from participating in social activities.
Likewise, individuals with disabilities and those with mental health disorders such as depression were also more likely to engage in social-connectedness interventions. Others have hypothesized that the “absence of social integrative relationships” from a narrowed social network can cause feelings of exclusion and marginality (Weiss, 1973), intensifying negative affect. Individuals with depression may perceive their social support to be low and may consequently experience worse outcomes, recovery, and social functioning (Wang et al., 2018). Conversely, studies have shown that lower perceived social support predicts higher levels of depressive symptoms among patients followed longitudinally over an 18-month period (Leskelä et al., 2006). For individuals with disabilities, when measured on a scale of functional disability (the ability to socialize and do work and the number of days spent ill in bed), lower perceived social support is associated with intensified functional disabilities over short (6-month) and long (18-month) term periods (Rytsälä et al., 2006).
While race and ethnicity were not one of the seven most predictive features in the machine learning model, both were important features predictive of participation in the social connectedness program (see Figures 1 and 2). In the context of the pandemic, social isolation has worsened, with racialized minorities disproportionately impacted by COVID-19 infection (Centers for Disease Control and Prevention, 2020), resulting in dwindling network size, and intensified isolation as a results of bereavement (Verdery et al., 2020). Given that social support is a predictor of functional disability (Litwin, 2011; Shim et al., 2012; Travis et al., 2004) and that individuals from minoritized communities have less access to quality mental health resources (Hawkley & Cacioppo, 2010; Saltzman et al., 2020), this population is likely to receive the most benefit from community based interventions to reduce social isolation and loneliness.
Identifying features that predict participation in social-connectedness interventions is an essential initial step in maximizing intervention engagement. While such interventions are often perceived as being resource intensive and/or cost neutral, the ability to target them to specific patients most likely to engage (and benefit) in such interventions, may contribute to greater cost effectiveness and greater returns on investment. Rather than attempting to reach all older adults, our findings suggest that those with greater clinically vulnerability as indicated by higher Medicare risk scores, higher functional comorbidity indices, older adults diagnosed with depression, disabilities, and arthritis are more likely to engage in telephonic social connectedness interventions. Future social connectedness programs tailored to those most likely to engage, as identified in this work, could observe reductions in potentially preventable emergency department visits and inpatient admissions, which would lover overall total spend on care.
While this study has many strengths, there are also limitations to be considered. The results are based on data relating to Medicare Advantage beneficiaries and thus, findings may not be generalizable to older adults enrolled in traditional Medicare. Additionally, other variables such as access to broadband/internet services, education level, co-occurrence of social needs such as food insecurity, housing instability, may influence the likelihood of enrollment in the program; however, such data are not available in the claims data that we used. Despite these limitations, these findings are actionable considering that various sectors throughout the health ecosystem have the resources to scale effective telephone-based social-connectedness interventions to reduce loneliness and social isolation. However, they must maximize participation rates to realize the actual value of the programming. Use of predictive modeling can help to identify individuals more likely to participate and engage, better inform resource allocation and intervention approaches to address social isolation and ameliorate its associated health consequences in older adults. We are aware of the limitations of predictive modeling including bias from overfitting. To address this, we utilize specific models to minimize this shortcoming as well as sample splitting. In particular, random forest models, which build a collection of decision trees on bootstrapped training samples, limit overfitting without increasing classification error due to bias. Gradient-boosted decision trees, on the other hand, build a collection of smaller trees grown sequentially where each tree improves by using information from the previously grown trees. Overall, both supervised machine-learning techniques provide robust and powerful predictive models.
Footnotes
Acknowledgements
We thank Dr. Jessica Dobbins (Humana) and Dr. LeChauncy Woodard (University of Hoston) for their comments and review of this manuscript.
Declaration of Conflicting Interest
The author(s) declared the following potential conflicts of interest with respect to the research, authorship, and/or publication of this article: Dr. Glasheen is employed by Humana. The other authors have no conflicts to declare.
Funding
The author(s) received no financial support for the research, authorship, and/or publication of this article.
Ethical Approval
N/A, data were obtained from a previous study cited in the manuscript.