
Abstract
Elderly patients with chronic kidney disease treated by haemodialysis are at increased risk of malnutrition and cachexia, becoming frail, with associated greater mortality. The physical performance test (PPT), using nine tasks to assess multiple domains of physical function is robust and reproducible, but time consuming, whereas the clinical frailty score (CFS) is more rapid. We compared the results from independent blinded observers in 22 haemodialysis patients, 16 (72.7%) male, mean age 65 ± 12.5 years. The PPT and CFS scores were highly correlated (r = −0.88, p < .001), with a high level of agreement (kappa score 0.91) for classifying patients as frail. Both scores were strongly associated with serum creatinine (PPT r=0.76, CFS r=−0.86, p < .001), hand grip strength (PPT r = 0.68, p = .001 CFS r = 0.64, p = .002), lean body mass index (PPT r = 0.50, p = .02, CFS r = −0.46, p = .038). We found that the CFS performed favourably compared to the PPT for haemodialysis patients in identifying and screening patients for frailty.
Introduction
The number of elderly patients with chronic kidney disease (CKD), treated by haemodialysis has been exponentially increasing in Europe. Elderly patients, and in particular those with CKD, are at greater risk of malnutrition, cachexia and muscle wasting, and such patients are at risk of becoming frail, associated with increased mortality (Chowdhury et al., 2017).
A number of assessments of physical activity have been introduced into clinical practice to assess patient performance to screen for frailty; ranging from the multi-task physical performance test (PPT) (Lusardi et al., 2003), to shorter versions such as the short physical performance battery, 6 minute and shorter timed walking tests, standing on one leg, sit to stand and timed to get up and go from a seated position (Ortega-Pérez de Villar et al., 2018). The majority of these tests have been shown to be highly reproducible (Ortega-Pérez de Villar et al., 2018). Although the PPT has strong predictive validity, it is time consuming, as the PPT comprises a series of nine scored tasks, each with a score of 0–4, which assess activities of daily living, aerobic capacity, vestibular balance, cognition, communication, dexterity, eating, functional mobility, occupational performance, processing speed and upper extremity function and so cannot be readily performed as part of routine clinical practice (Lusardi et al., 2003; Ortega-Pérez de Villar et al., 2018). On the other hand, the Clinical Frailty Scale (CFS) is a tool that has been developed to be more readily applicable for clinical practice, and provides a gradient of frailty, scaled from a score of 1 being very fit, to well, managing well, apparently vulnerable, mildly frail, severely frail, very severely frail and terminally ill with a score of 9 (Rockwood et al., 2005). Previous reports of the PPT have suggested a cut off score of 24 for determining mild frailty (Lusardi et al., 2003), and >4 for frailty using the CFS (Rockwood et al., 2005). Although there have been reports of using the PPT, and variants of the PPT in patients with chronic kidney disease (Reese et al., 2017) and dialysis patients (Vazquez-Rigueira et al., 2019) and similarly the CFS (Alfaadhel et al., 2015; Nixon et al., 2019). There have been no studies reporting on a direct comparison of these two tests in haemodialysis patients. As such, we wished to determine how they compared in assessing frailty, and how scores related to body composition and muscle function.
Methods
The PPT was undertaken in a cohort of haemodialysis patients dialysing in a single centre who had provided written informed consent for the CONVINCE study in November 2019 (Blankestijn et al., 2020). The PPT was standardised, with each patient scored from nine domains; writing a sentence, simulated eating, lifting a book and putting it on a shelf, putting on and removing a jacket, picking up a penny from the floor, turning 360°, 50 foot walk test, climbing one flight of stairs and then climbing stairs. The CFS was introduced into routine clinical practice, as part of holistic approach to patient management, and recorded by the individual patient’s dialysis nurse. Prior to introduction dialysis staff were provided with an educational program and instruction on using the CFS scale (Alfaadhel et al., 2015). Whereas the PPT was supervised by a research nurse, and each was blinded to the other’s score. Body composition was determined by multifrequency bioimpedance, following a standardised protocol, post-the mid-week dialysis session (El-Kateb & Davenport, 2016), which has been shown to be in agreement with dual energy X-ray absorptiometry (Fürstenberg & Davenport, 2010). To make comparisons between patients we adjusted body composition measurements for height, to generate lean body mass index (LBMI) and appendicular lean mass index (ALMI). Muscle function was assessed by hand grip strength (HGS) following a standardised method using a grip-D strength dynamometer (Takei Scientific Instruments Co, Nigata, Japan) (Omichi et al., 2016). Patient demographics, laboratory investigations were retrieved from hospital computerised data bases, and co-morbidity was graded by the Stoke-Davies co-morbidity grading (Davies et al., 2002).
Standard statistical tests were used to determine normality of data and comparisons made using the t test or Mann-Whitney U test, as appropriate, and Chi square analysis with correction for small numbers. Bivariate analysis was by Spearman’s correlation, and weighted kappa used for comparison scores. To calculate effect size, non-parametric data was logarithmically transformed. Statistical analysis was carried out using SPSS version 27.0 (IBM, Armonk, NY, USA) and GraphPad Prism version 9.2 (San Diego, CA, USA). Data are presented as mean ± standard deviation, median (interquartile range), and 95% confidence limits, or as a percentage. Statistical significance was taken as p < .05.
Results
Measurements were made in 22 patients, 16 (72.7%) male, mean age 65 ± 12.5 years, 7(31.8%) diabetic, median dialysis vintage 43.5 (30.1–65.7) months and median CFS 4(2–6). Although this was a small study, patients studied were representative of patients dialysing in our other centres; 72.7% male, mean age 63.3 ± 15.2 years, Davies co-morbidity grade (1(1–1) and CFS (4(3–6).
Patients Assessed by Physical Performance Test and Clinical Frailty Score and Divided According to Cut-Points for Frailty (<24 for PFT and > 4 for CFS). Patient Demographics, Laboratory Investigations and Body Composition. Data Expressed as Integer, Mean ± Standard Deviation. * p < .05, ** <0.01 ***<0.001 Versus Frail.

Note. Stoke-Davies co-morbidity grade (Davies grade), Body composition data. LBMI=lean body mass index; ALMI = appendicular lean mass index; ECW = extracellular water; TBW = total body water; Pre-dialysis blood biomarkers: CRP = C reactive protein; NTproBNP = N terminal brain natriuretic peptide pg/mL; β2M = β2 microglobulin, Physical strength: HGS = hand grip strength.
Patients Assessed by Physical Performance Test and Clinical Frailty Score and Divided According to Cut-Points for Frailty (<24 for PFT and > 4 for CFS). Patient Demographics, Laboratory Investigations and Body Composition. Data Expressed as 95% Confidence Limits and Effect Size.

Stoke-Davies co-morbidity grade (Davies grade),Body composition data: LBMI = lean body mass index; ALMI = appendicular lean mass index; ECW = extracellular water; TBW = total body water; Pre-dialysis blood biomarkers: CRP = C reactive protein; NTproBNP = N terminal brain natriuretic peptide pg/mL; β2M = β2 microglobulin; Physical strength: HGS = hand grip strength.
Univariate Associations with Physical Performance Test and Clinical Frailty Score. 95% Confidence Limits in Brackets.
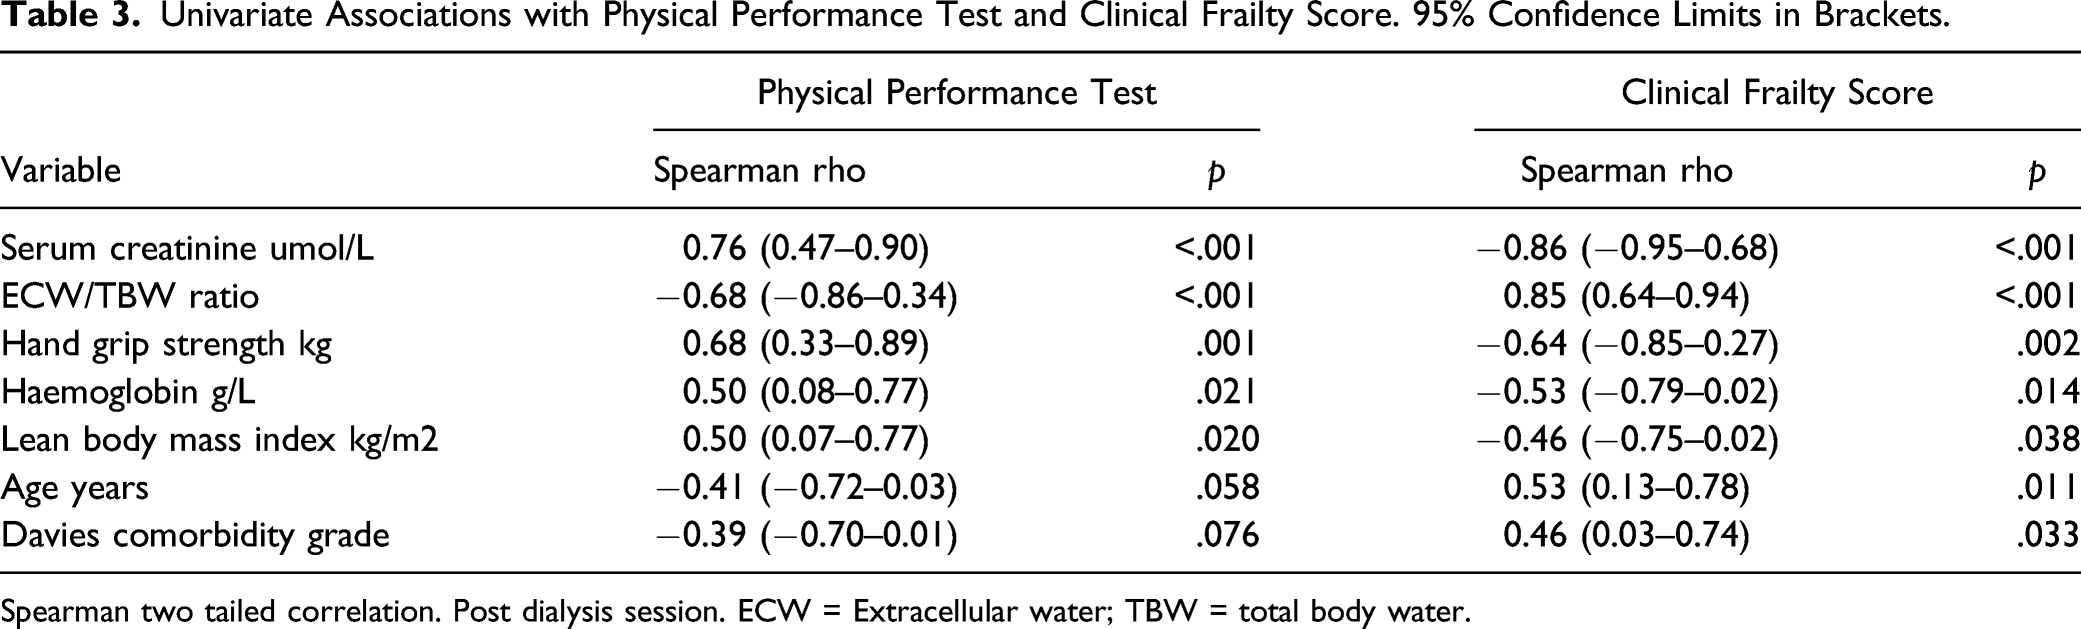
Spearman two tailed correlation. Post dialysis session. ECW = Extracellular water; TBW = total body water.
Discussion
The PPT assess multiple domains of physical function by observing the patient perform a series of nine tasks that simulate activities of daily living of various degree of difficulty. Although the PPT has been shown to be reproducible in many different patient groups, including patients with chronic kidney disease and those treated by dialysis (Reese et al., 2013; Vazquez-Rigueira et al., 2019), and highly predictive of falls and along with the short physical performance battery of tests predictive of all-cause mortality. However, the PPT cannot readily be performed in a time-limited outpatient clinic review, whereas patients can be quickly screened using the CFS. Previous studies in dialysis patients have also reported an association between CFS scores and patient mortality (Alfaadhel et al., 2015). We found that the CFS appeared to perform favourably when compared to the PPT, with a high kappa score and AUC suggesting a very high level of agreement between the two scoring systems. One previous study of 30 dialysis patients compared the CFS with the frailty index, and also reported that the CFS was the most predictive of all the non-physical assessments in determining frailty (Nixon et al., 2019). Both the PPT and frailty index require directly observed and potentially cumbersome physical tests and rely solely on physical characteristics to define a patient as frail, whereas the greatest strength of the CFS is its simplicity when compared to other methods of assessing frailty (Worthen & Tennacore, 2019).
Higher PPT scores and lower CFS were most strongly positively associated with serum creatinine, HGS and SLMI, and negatively with ECW/TBW ratios. Although serum creatinine is used as a marker of residual renal function in patients with kidney disease, once patients become dialysis, then serum creatinine becomes more dependent on other factors, including dietary protein intake, muscle mass and physical activity. In keeping with higher serum creatinine, higher PPT and lower CFS were associated with greater muscle strength as assessed by HGS, and lean body mass indexed for height (Worthen & Tennacore, 2019). An increased ECW/TBW ratio in dialysis patients is often associated with ECW overload (Davies & Davenport, 2014), especially when measured prior to a dialysis session. Bioimpedance measurements were made post the mid-week dialysis session, so that patients were closer to their target weight to minimise any such confounding (Tangvoraphonkchai & Davenport, 2017). Although an increased ECW cannot be entirely excluded, there was no association with N-terminal brain natriuretic peptide, a biomarker of volume overload in dialysis patients (Booth et al., 2010), and as such it is more likely that the increased ECW/TBW ratio observed was due to a loss of intracellular water, reflecting a loss of cell mass (Davies & Davenport, 2014).
This was a small pilot study designed to compare the CFS which had been introduced into routine clinical practice with the established PPT. Although the CFS has the advantage of simplicity, it is a subjective tool (Worthen & Tennacore, 2019). It was therefore important to have an educational program and instruction on applying the CFS for our dialysis centre nursing staff, prior to the introduction of the CFS into clinical practice. However, in terms of determining frailty, with assessors blinded to the other score, the CFS closely mirrored the PPT. Independent studies have reported a strong association between frailty and increased mortality for dialysis patients when using either the PPT or the CFS (Alfaadhel et al., 2015; Worthen & Tennacore, 2019). Although a small study, increasing frailty with both scores was associated with loss of muscle mass, muscle strength, older age and co-morbidity.
Conclusion
The PPT assess multiple domains of physical function by observing the patient perform a series of nine tasks that simulate activities of daily living of various degree of difficulty. Although the PPT is reproducible in different patient groups, and predictive of all-cause mortality, it requires time and equipment, so limiting its use as a rapid screening test for every-day clinical practice. In this study, the CFS similarly identified frail patients favourably when compared to the PPT, and although subjective, the CFS can be used as a rapid screening tool, readily applicable to everyday routine clinical practice.
Footnotes
Declaration of Conflicting Interests
The author(s) declared no potential conflicts of interest with respect to the research, authorship, and/or publication of this article.
Funding
The author(s) disclosed receipt of the following financial support for the research, authorship, and/or publication of this article: This study is supported by CONVINCE study Horizon 2020 research and innovation programme Grant Agreement No (754803).
Author Contributions
Author contributions AD conceived the study and analysed data and wrote first draft
Ethical Approval
United Kingdom ethics approval (18/EM/0213).
Informed Consent
Data Availability
Availability of data and material Royal Free Hospital Renal audit data base.