
Abstract
The diffusion of fully automated vehicles (AVs), or self-driving vehicles, is expected to provide many affordances for older adults. If older adults are not willing to use AVs, they will not be able to reap these affordances. Understanding factors related to older adults’ willingness to use AVs is key to ensuring that successful strategies can be devised to promote their utilization in the future. In this study, we investigate U.S. older adults’ willingness to use AVs among a large and diverse sample (N = 1,231). We assessed sociodemographic, population density, health, and attitudinal determinants of willingness to use AVs. Our binary logistic regression results showed that older adults with higher levels of educational attainment, transportation limitations, and positive attitudes toward new technology adoption were more likely to be willing to use AVs. Our study indicates that older adults’ willingness to use AVs are complex and vary among U.S. older adults. Practical implications and study limitations are discussed.
In developed countries around the world, there are growing percentages of the population that are becoming older adults (aged 65 and older) (Christensen et al., 2009). As such, these countries are experiencing an increasing number of people that live with chronic health issues, which can limit older adults’ ability to live active lives, including limitations in one’s ability to drive a motor vehicle (Ralph et al., 2013).
There are over 30 million licensed drivers aged 65 and older in the U.S. (Federal Highway Administration [FHWA], 2015). Though older adults aged 65 to 74 tend to have similar travel and transportation preferences and transportation behaviors as younger adults aged 18 to 29, individuals that are in their later 1970’s and 1980’s encounter more severe mobility and transportation barriers (Shergold et al., 2016). Sensory (e.g., vision, hearing), motor (e.g., motor coordination, dexterity, muscle strength), and cognitive (e.g., executive functions) declines increase with age, which can impact driving (See Karthaus & Falkenstein (2016) for a review of factors affecting driving among older adults). Of these factors, cognitive and vision declines account for over 80% of the age-related variance in the ability of older adults to safely drive (Anstey et al., 2012).
The role of providing transportation support tends to fall on care partners (e.g., adult children) (Dickerson et al., 2007). In addition, a primary reason why older adults miss their healthcare appointments is due to a lack of transportation (Harrison & Ragland, 2003). Demographic shifts, particularly in different population dense areas, will necessitate that transportation options are available and accessible if older adults are to be able to maintain their participation in society in both urban and rural settings.
The use of emerging robotic and automated technologies has the potential to enhance quality of life and help older adults maintain their independence as they age (e.g., Smarr et al., 2014)—as well as a vast array of other societal benefits that may specifically stem from automated vehicle adoption (Fagnant & Kockelman, 2015). Researchers expect that fully automated vehicles (AVs; i.e., self-driving cars) may allow older adults to live more active, independent, and healthy lifestyles (Duarte & Ratti, 2018; Reimer, 2014; Yang & Coughlin, 2014). The use of AVs could provide a promising solution to some of the mobility barriers that older adults experience and potentially even afford them the ability to re-enter the workforce (Harper et al., 2016; Yankelevich et al., 2018), though AV services may need to be specifically designed to cater to the needs and preferences of older adults (Cunningham & Regan, 2015; Payyanadan & Lee, 2018; Rhiu et al., 2015). However, about 75% of American adults are still apprehensive about using AVs (Edmonds, 2019).
We contribute to previous research by examining sociodemographic, geographic location, and health related factors with U.S. older adult Internet users’ willingness to use AVs. Specifically, our study contributes to the literature by investigating whether specific limitations and needs for assistance with instrumental activities of daily living (IADL) influence older adults’ willingness to use AVs. In doing so, we will be able to better identify which U.S. older adults are most willing to use, and potentially reap the benefits from, AVs.
Background
Technology Adoption Among Older Adults
Our investigation is informed by previous technology adoption research among older adults, which posits that older adults’ perceptions and attitudes toward novel information and communication technologies can influence technology adoption in the future (Peek et al., 2014). Consistent with the senior technology acceptance model (STAM) (Barnard et al., 2013; Chen & Chan, 2014; Renaud & Van Biljon, 2008), previous research has shown that attitudes and perceptions are positively associated with intentions to use AVs (Lee et al., 2017; Liljamo et al., 2018).
Given that AVs have yet to become widely adopted, our investigation accounts for older adults’ attitudes toward new technology adoption, which we expect to be positively related to older adults’ willingness to use AVs. Because older adults’ attitudes toward technology can be predicted by sociodemographic factors and potentially predict technology adoption (e.g., Chen & Chan, 2014), we seek to investigate which sociodemographic characteristics predict U.S. older adults’ willingness to adopt AVs.
Recent Findings on AV Acceptance and Mobility
Emergent research has indicated that age cohort, educational attainment, perceived trust, and affordability can influence attitudes toward and intentions to use AVs (Abraham et al., 2017; Brugeman et al., 2016; Buckley et al., 2018; Gold et al., 2015; Lee et al., 2017; Molnar et al., 2018). Perhaps due to a lack of experience, older adults tend to hold apprehensive views toward fully automated vehicles (Diepold et al., 2017; Eby et al., 2018) and report being less willing to adopt (e.g., Zmud et al., 2016). Some evidence suggests, however, that both younger and older adults still prefer to use vehicles without self-driving features (e.g., Schoettle & Sivak, 2015). Lee et al. (2017) assessed survey data from a sample of 1,765 U.S. adults and found that age (assessed across age cohorts: Silent Generation, Baby Boomers, Generation X, and Millennials) was inversely associated with intention to use AVs. Similarly, a study by Huang et al. (2018), which examined a representative sample of adult residents in Michigan, also showed that age was inversely associated with perceived benefits and risks associated with using AVs. Other factors, such as perceiving greater risks associated with AVs and low levels of trust in AVs, are also associated with more negative beliefs related to AV adoption (Hulse et al., 2018; Sanbonmatsu et al., 2018).
Research that has examined non-U.S. samples, such as Nielsen et al. (2018) that assessed survey data from a large Danish sample (N = 3,040), concluded that younger generations are less skeptical of AVs than older adults. AV adoption enthusiasts tend to be educated, young, males, that reside in urban, as opposed to rural, locations—while skeptics were older participants that lived in rural locations (Nielsen et al., 2018). Taken together, AV acceptance research shows that a multitude of factors are associated with intentions to use AVs; however, age, gender, and geographic divides persist. Though age can be inversely associated with intentions to adopt an AV, attitudes toward and intentions to use vary by more than only age (e.g., Berliner et al., 2019). For example, in a simulated environment, higher levels of vehicle automation increased comfort and enjoyment levels for both younger and older adults (Hartwich et al., 2018). In addition, during observation of actual automated driving tasks (e.g., automated system take-over), age differences were not found (Clark & Feng, 2017; Körber et al., 2016).
Mobility issues could relate to willingness to use AVs, given certain types of mobility disabilities make it nearly impossible, or not as easy, to drive vehicles. In general, some research suggests that individuals who do not drive tend to have greater intentions to adopt AVs (Liljamo et al., 2018). However, we do not know how different IADL limitations are related to willingness to use AVs, among U.S. older adults.
Although U.S. older adults make up a larger portion of the population in rural areas compared to urban and metropolitan areas (Parker et al., 2018); older adults from different geographical locations (characterized by different population densities—rural vs. large metropolitan areas) tend to hold different attitudes toward and divergent experiences with emerging technologies (Cotten et al., 2016). Though we posit that multiple factors may work in conjunction to shape willingness to use new transportation technology, specifically AVs, we specifically examine whether IADL limitations related to transportation influence willingness to use AVs as well as the potential role of geographical locations (e.g., rural vs. metropolitan).
Research gap: Exploring specific IADL limitations/barriers
Though research indicates that older adults who face mobility and transportation barriers may hold positive attitudes toward AVs, the external validity/generalizability of these findings tend to be limited by small qualitative study designs and specific urban contexts (e.g., Faber & van Lierop, 2020). Research has yet to examine whether older adults that face specific IADL barriers (e.g., needing assistance with transportation) are more willing to adopt AVs than those without IADL limitations—while also considering the potential role that residential location/population density (e.g., urban vs. rural locations) may have among a large and diverse U.S. sample of older adults. As such, we seek to address these gaps in the literature by investigating two research questions:
RQ1. What is the relationship between specific IADL limitations and older adults’ willingness to use AVs?
RQ2. Do older adults that reside in different geolocation/population densities (e.g., rural vs. urban locations) have differing willingness to use AVs?
Methods
Data Collection
Data for this study came from a large and diverse sample of U.S. adult Internet users aged 65 and above (N = 1,231). The sample was matched to reflect the sociodemographic characteristics of the 2010 U.S. Census Bureau statistics for U.S. older adults. Participants were recruited through a Qualtrics panel during October and November of 2017. Study participants completed an online survey regarding their technology attitudes and usage behaviors, which took about 20 minutes to complete. The survey questions assessed participants’ attitudes toward and uses for a range of existing and emerging technologies.
Geolocation and Population Density: Metro, Urban, and Rural
Due to data limitations, we were unable to ascertain participants’ location based on self-reported responses. While we did not ask the participants to self-report their location, we did have one behavioral component that we used: their IP address. When users participated in our survey, we were able to capture their global IP address.
To convert the IP data to specific geolocations, we developed and used a Python script that pulled the associated information based on the participants’ IP address (Fennell, 2019). The script used an IP geolocation Application Programming Interface (API) available from ipdata.co (https://ipdata.co/) and returns the location associated with the IP address. We used the API to obtain a list of IP addresses that contained city, state, and zip code. We then took the zip codes and mapped them to the urban and rural population density designations. The U.S. Dept. of Agriculture maintains a data product titled “Rural-Urban Continuum Codes” which we used to classify the metro and non-metropolitan areas (available here: https://www.ers.usda.gov/data-products/rural-urban-continuum-codes/ ). Because the continuum codes were sorted by FIPS (Federal Information Processing Standard) county code we consulted a third resource developed by Data Sharing for Demographic Research at the University of Michigan (available here: https://dsdr-kb.psc.isr.umich.edu/answer/1102), which contains a crosswalk of FIPS county codes and zip codes. Most of our sample falls in the metropolitan population density categories (81%) (RUCC 1–3).
Measures
Dependent variables
Willingness to use AVs was assessed by a single item, which asked participants “would you be willing to use a self-driving vehicle?” (Smith, 2014). Binary response options consisted of 1 = “Yes” and 0 = “No.” Among the entire analytical sample, 19% of participants responded “Yes.”
Independent variables
Previous research indicates that sociodemographic factors play a role in AV adoption (e.g., Sener et al., 2019). The sociodemographic variables assessed in our investigation included age cohorts, gender (1 = female), race, educational attainment, annual income, and employment status. Age cohorts consisted of age 65 to 74, 75 to 84, and 85 and above. In our regression analysis, age cohort 85 and above was used as the reference category. Race was assessed with a nominal measure (African American; Asian; Caucasian; and Other), with Caucasian was used as the reference category. Educational attainment ranged from 1 (less than high school degree) to 8 (doctoral degree), while annual income ranged from 1 (less than $10,000) to 9 ($200,000 or more). Employment status was assessed by a nominal measure (employed full-time, employed part-time, unemployed, and retired—which was the reference category). Moreover, specific functional independence indicators, specifically IADL limitations, were assessed by the standard question: Do you need assistance with any of the following activities: medicine management, transportation, meal preparation, household chores, sitting services, financial assistance, and shopping? Response options ranged from 0 (no) to 1 (yes). Because we were only interested in IADL limitations that may involve transportation and/or spatial mobility, we included need for assistance with transportation, shopping, and household chores in our binary logistic regression analysis. Each variable was dummy coded (1 = need assistance with the task, 0 = do not need assistance with the task). However, we omitted IADL limitations, such as needing assistance with financial services/management, as such limitations do not have suspected implications for mobility or transportation capabilities.
According to the RUCC categories, geographic locations were classified as metropolitan-large (Counties in metro areas of 1 million population or more), metropolitan mid-size (Counties in metro areas of 250,000 to 1 million population), metropolitan-small (Counties in metro areas of fewer than 250,000 population), urban (Urban population of less than 250,000 but greater than 2,500), or rural (Completely rural or less than 2,500 urban population). During our regression analysis, metropolitan-large (55% of sample) was used as the reference category.
Prior research has shown that attitudes can predict technology adoption, among older adults (Chen & Chan, 2014). Attitude toward new technology adoption was measured by a single item that ranged from 1 (I am skeptical of new technologies) to 5 (I love new technologies and am among the first to experiment with and use them) (Rosen et al., 2013).
Analytical Procedures
Our analytical procedures included binary logistic regression analysis and a variety of descriptive statistics and model fit indices (e.g., adjusted R-squared). Binary logistic regression analysis was appropriate to test RQ1, given that the dependent variable of interest (Willingness to use an AV) consisted of a single item with a binary response option. As such, the test statistic of interest in the binary logistic regression models was the exponential beta coefficients, which were subsequently interpreted as odds-ratios. For the binary logistic regression analysis, variables were entered into the model in two-steps (Step 1: sociodemographic and functional independence (IADL) variables, Step 2: attitude toward new technology).
Results
Descriptive Results
Descriptive statistics for all variables used in our analyses are shown in Table 1. The mean age of the sample was 74 years (aged 65–74: 58%, 75–85: 29%, 85 and above: 13%). The sample was 56% female, 84% Caucasian, 9% African American, 4% Asian, and 3% “Other.” Sixteen percent of the sample reported that they need assistance with transportation, 17% need assistance with household chores, and 13% need assistance with shopping. On average, participants had an annual household income between $35,000 - $49,999 as well as “some college education, but no degree.” Eighty-two percent of the sample was retired, 7% employed fulltime, 7% employed part-time, 4% unemployed. In addition, the sample had a population density composition of 55% large metropolitan area, 19% mid-sized metropolitan area, 8% small metropolitan area, 9% urban, and 1% rural.
Descriptive Statistics for All Variables.
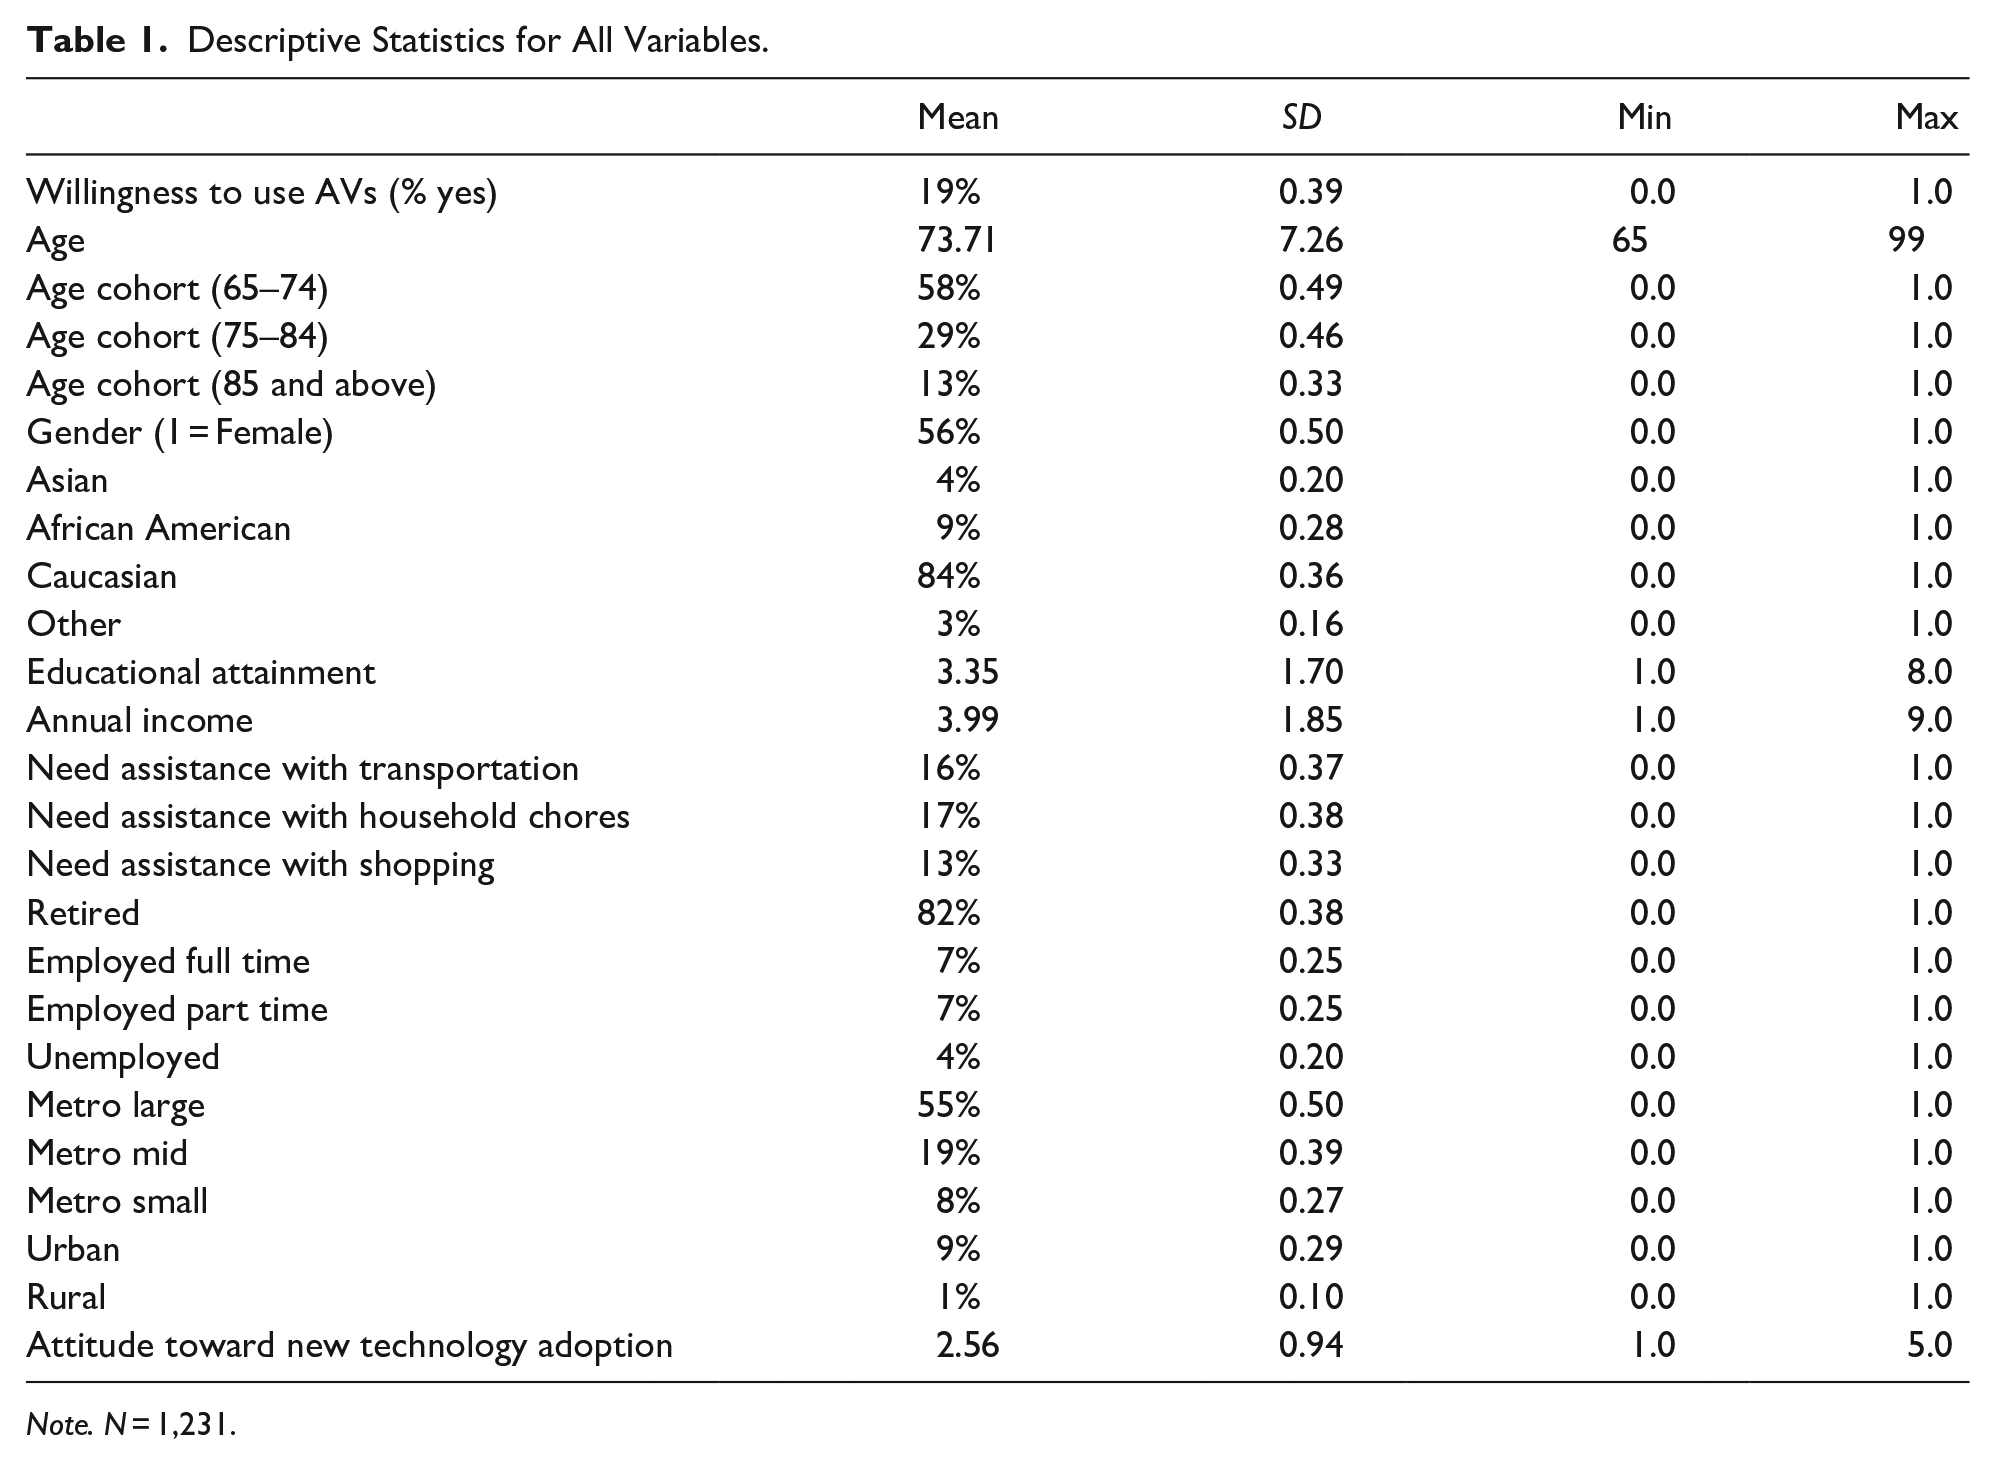
Note. N = 1,231.
On average, participants reported that “I usually use new technologies when most people I know do.” Overall, 19% of the sample was willing to use an AV. Table 2 shows the percent that was willing to use AVs within each sociodemographic group, at each level of the attitude toward new technology adoption measure, and by geolocation/population density category. Twenty percent of the sample were willing to use an AV among those aged 65 to 64, while 21% of participants aged 85 and above were willing to use an AV, and 15% of participants aged 75 to 84. In addition, 21% percent of males were willing to use an AV compared to 16% of females; however, between gender differences were not statistically significant. Our descriptive findings also show that, on average, participants from urban areas were least willing to use AVs compared to participants from the other population density areas.
Percent Willing to Use AVs by Group.
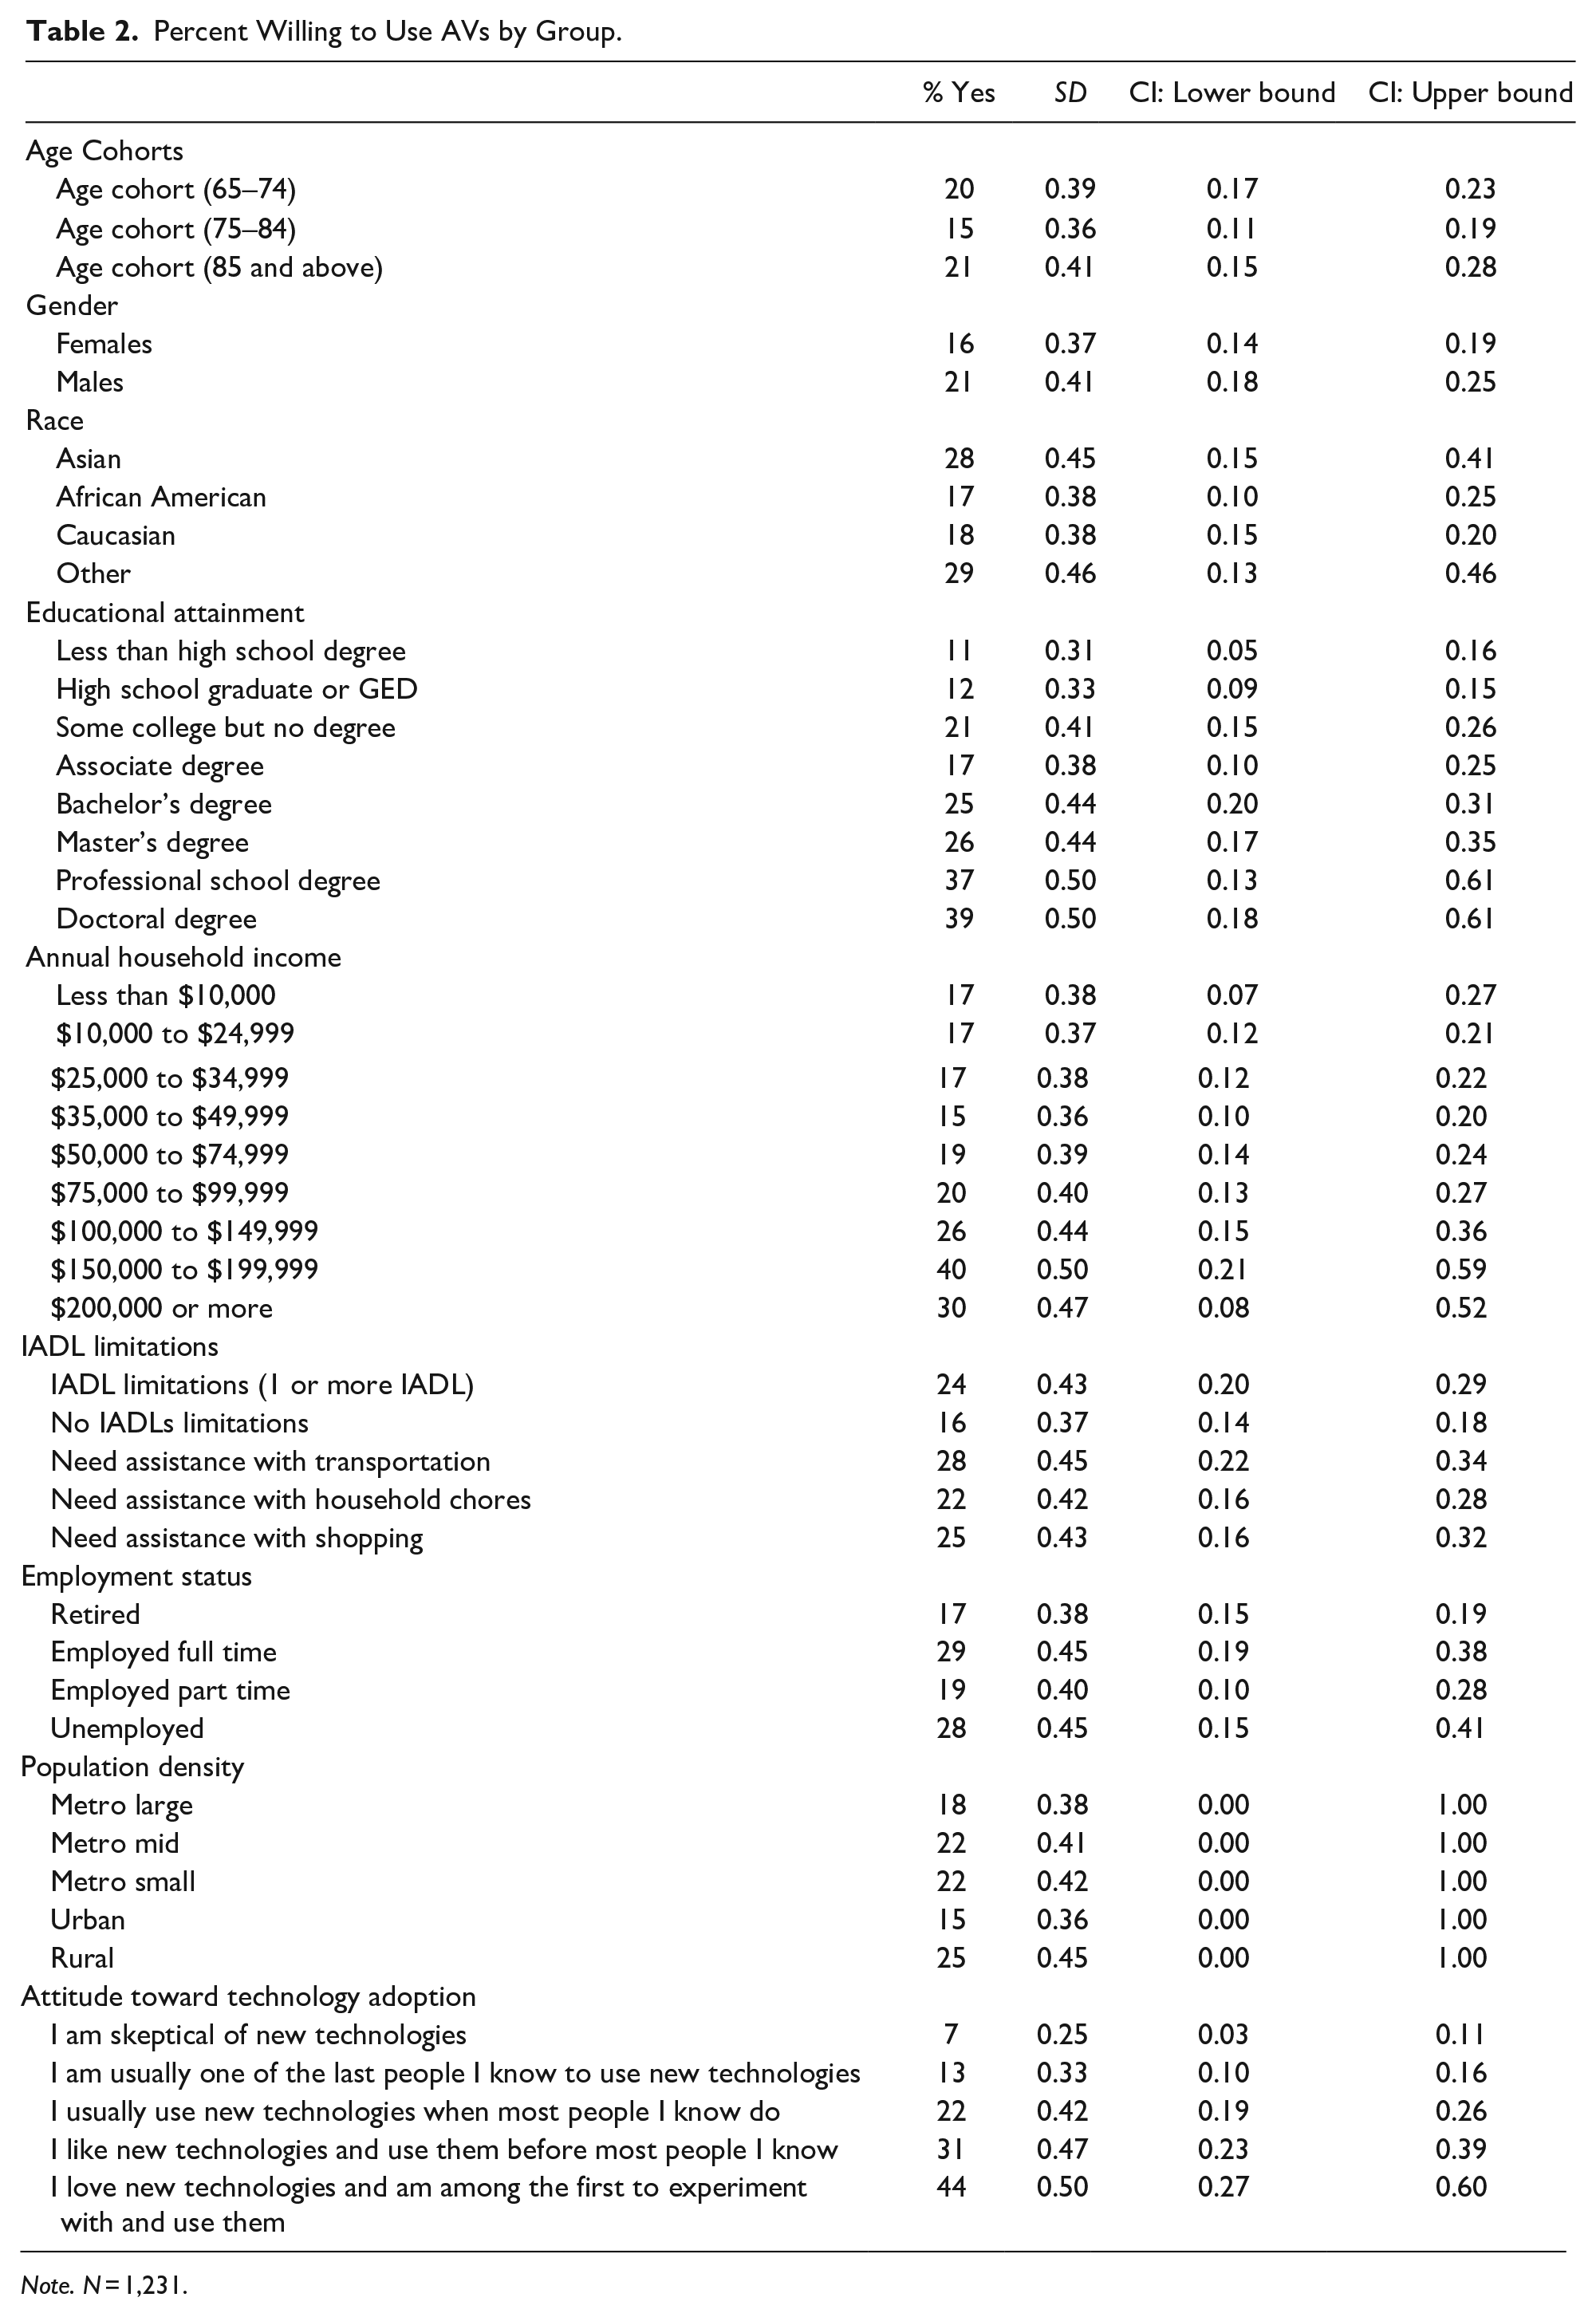
Note. N = 1,231.
Binary Logistic Regression Results: Predictors of Willingness to Use AVs in the Future
Though we observed a range of group differences with the descriptive statistics, only a few of the sociodemographic and individual differences were related to willingness to use AVs in the future. We observed statistically significant and positive associations of educational attainment (Exp. (B) = 1.20, SE = 0.05, p < .001), need for transportation assistance (Exp. (B) = 2.26, SE = 0.25, p < .001), and attitude toward new technologies (Exp. (B) = 1.68, SE = 0.09, p < .001) with willingness to use AVs. On average, each unit increase in educational attainment was associated with a 20% increase in the likelihood that one would be willing to use AVs. In addition, participants who have limitations with transportation were 126% more likely to report that they were willing to use AVs compared to participants who do not face transportation limitations. On average, each unit increase on the attitude toward new technologies measure was associated with a 68% increase in the likelihood that one would be willing to use AVs. However, age cohorts (p > .05), population density (p > .05), gender (p > .05), race (p > .05), annual income (p > .05), and employment status (p > .05) did not have statistically significant associations with willingness to use AVs in the future. All exponential beta coefficients, standard errors, and P-values are shown in Table 3.
Binary Logistic Results: Willingness to Use AVs.

Note. N = 1,231. Cox & Snell R-Square = 0.08, Nagelkerke R-Square = 0.13.
Discussion and Conclusions
Though AV diffusion could provide older adults many affordances for maintaining their mobility, independence, and ability to age in place, to date, little is known about U.S. older adult Internet users’ willingness to adopt AVs. In this study, we investigated whether sociodemographic characteristics, limitations with specific instrumental activities of daily living (IADLs; specifically a need for transportation assistance), population density, and attitudes toward new technology adoption were associated with U.S. older adults’ willingness to use AVs. Consistent with previous AV acceptance research (Nielsen & Haustein, 2018), we found that educational attainment was a key determinant of AV acceptance. However, we did not observe statistically significant age cohort variations, which is inconsistent with prior research (Huang et al., 2018; Lee et al., 2017). The findings highlight that willingness to use AVs varies by more than just age among U.S. older adults. Although we did not obverse statistically significant age differences, our descriptive findings indicated that a larger portion of adults age 85 and above (21%) were willing to use AVs compared to adults age 65 to 74 (20%) and adults age 75 to 84 (15%). As such, future research could benefit by continuing to investigate age cohort differences among older adults regarding their attitudes toward and willingness to use AVs.
IADL Limitations—Assistance With Transportation Matters
We observed that older adults who need assistance with transportation activities were far more likely to report that they were willing to use a fully self-driving AV than those without transportation limitations. We conclude that one factor that can help address RQ 1 is that older adults that have more difficulty with specific IADLs (e.g., transportation difficulties) could be more willing to use AVs. In conjunction with human factors research aimed at personalizing services for older adult AV users (e.g., Rhiu et al., 2015), future research could assess whether older adults with specific IADL limitations perceive greater AV related benefits compared to those without any IADL limitations. As a growing number of older adults may face transportation limitations in the future, AVs may be able to help overcome transportation limitations. However, due to data limitations, we could not explore underlying reasons for transportation limitations (e.g., mobility impairment, cognitive impairment, etc.) in this study (e.g., limited by a single item outcome measure for willingness to use AVs). Future research could benefit from investigating whether specific barriers to transportation influence AV acceptance along with more in depth understandings for the underlying reasons and motivations for AV acceptance.
Location and Demographic Differences
Our descriptive analysis indicated that a larger portion of males (21%) were willing to use AVs than females (16%) and that a larger percentage of Asian participants (28%), and participants that identified as “Other” (29%), were willing to use AVs compared to African American (17%), and Caucasian participants (18%). In addition, greater portions of participants in the top income groups were willing to use AVs compared to participants in the lower income groups.
Our findings also suggest that older adults who have high levels of educational attainment are more willing to adopt fully self-driving AVs compared to those with lower levels of educational attainment. Taken together, the findings suggest that future research on the social aspects of AVs and transportation could continue to explore sociodemographic variations in willingness to use AVs—especially once AV diffusion begins to become widely available. However, regarding RQ 2, we did not find support that willingness to adopt AVs varied by location (e.g., urban vs. rural). Given the tech savvy nature of our sample, it is plausible that divergent patterns could emerge between older adults that reside in locations with varying city design/population densities among a sample that also has more technology experience diversity.
General Technology Attitudes
We conclude that attitudes toward new technology adoption are positively associated with willingness to use AVs among this large and diverse sample of tech savvy U.S. older adult Internet users. For example, 44% of the participants that reported “I love new technologies and am among the first to experiment with and use them” were willing to use AVs, while only 7% of participants that reported “I am skeptical of new technologies” were willing to use AVs. In addition, our binary logistic regression results indicated that, on average, each unit increase on the attitude toward new technology adoption measure was associated with a 67% increase in the likelihood that a participant would be willing to use AVs—while holding constant all sociodemographic variables. This finding supports previous research on the relationship between attitudes and intentions to use AVs (Liljamo et al., 2018). Previous research by Ward et al. (2017) showed that by providing informational materials on AVs to participants they may develop increased perceived benefits of AV use.
Outreach efforts could benefit from targeting older adults that are not traditionally early adopters of new technologies to illustrate potential benefits of AVs to them, which might lead to an increased willingness to use and potentially benefit from AVs—particularly older adults with low levels of educational attainment. Future research could also avail from investigating whether younger older adults (65–74), and those aged 85 and above, are more willing to use AVs compared to those aged 75 to 84. There could be moderating effects by IADLs, whereby older adults that are more likely to face limitations with IADLs are less likely to be able to drive and more likely to perceive benefits from AV use. Such research could add to previous efforts that show people that do not drive a personal vehicle are more willing to use AVs (Liljamo et al., 2018).
Conclusions and Practical Implications
While our study highlights the importance of limitations in IADLs, educational attainment, and attitude toward technologies, we note that this sample was comprised of older adult Internet users. Though our sample was reflective of the sociodemographic characteristics of the U.S. older adult population, about 34% of US older adults do not use the Internet (Anderson & Perrin, 2017)—thus, our sample may have more experience using technology than the actual U.S. older adult population. In addition, the data used in this study were collected in Fall 2017; since that time, additional pilot demonstrations of AVs have begun in various parts of the U.S. Awareness of and/or experience with these pilot programs may lead to differing views on willingness to adopt AVs if the study had been conducted in Fall 2020. Future research that samples both older adult Internet users and nonusers may observe different patterns regarding sociodemographic variations in willingness to use AVs. The outcome measure of willingness to use AVs was a binary measure; thus, participants were not able to report specific circumstances under which they would be willing to use AVs. Future research should investigate the specific scenarios and circumstances under which older adults would be willing to use AVs as willingness to use may be likely to vary.
As populations around the world continue to age, more people will face health and mobility needs that can potentially hinder their quality of life and detract from their successful aging. Health related declines are often the reason why older adults are no longer able to operate a motor vehicle—which can make it more difficult to age in place, make it to doctors’ appointments, and live an active lifestyle. As such, AVs are expected to afford older adults a range of benefits that could help them address these issues and enhance their quality of life—especially those who face transportation limitations. Our study provides insight as to which U.S. older adults are most willing to use and potentially benefit from AV diffusion.
Given that older adults are arguably the segment of the U.S. population which has the most to gain from AV diffusion (i.e., older adults are more likely to experience mobility disabilities than younger age cohorts)—it is imperative that researchers continue to study AV acceptance among older adults and avoid treating older adults as an uniformed-homogenous group. Older adults and other populations at risk of mobility constraints should be a central focus of city planners and urban transportation research as well. Although AV diffusion is anticipated to initially develop on contemporary road systems (Yankelevich et al., 2018), future smart-cities could be designed to help improve mobility and quality of life for the growing older adult population. Because fully autonomous vehicles may take on entirely novel interior and exterior designs (Duarte & Ratti, 2018), AV developers and manufactures can also potentially support older adults by continuing to consider older adults’ mobility needs and preferences.
Footnotes
Declaration of Conflicting Interests
The author(s) declared no potential conflicts of interest with respect to the research, authorship, and/or publication of this article.
Funding
The author(s) received no financial support for the research, authorship, and/or publication of this article.