
Abstract
Introduction
Food insecurity, lack of access to nutritious food for an active, healthy life, is alarmingly increasing for older adults in the United States, with 8.4% of older adults being food insecure (Feeding America, 2016). This statistic is disproportionately higher in Hispanic and African American older adults. Although the national average of household food insecurity is 14%, it is 22.4% for Hispanic households (U.S. Department of Agriculture [USDA], 2016) and 26% for African American households as compared with 11% for White non-Hispanics (Feeding America, 2017). Food insecurity is associated with poverty for older adults, which was 18.4% for older African Americans, 17.5% for older Hispanics, and 8.8% for the U.S. population in 2015 (Administration on Aging, Administration for Community Living, & U.S. Department of Health and Human Services, 2016).
Coleman-Jensen, Rabbitt, Gregory and Singh (2015) define food insecurity as access to nutritious food limited by money and other resources. It is important to note that other resources (supplementary food programs, help from family, friends, religious organizations, or other agencies) may be a factor in older adults and that income alone may not determine level of food security. USDA (2015) distinguishes four levels of food security: (a) high food security, with no food problems accessing food; (b) marginal food security, with one or two reported indications of fear of food shortage without any change of diet; (c) low food security, with reduced quality of the diet, but no food reduction; and (d) very low food security, with reduced food intake and disruption of eating patterns.
Older adults with food insecurity are more likely to have multiple nutritional insufficiencies as compared with their counterparts (Dixon, Winkleby, & Radimer, 2001; Ziliak & Grundersen, 2011). High proportion of nutritional insufficiencies in older adults who have food insecurity is mainly due to their reliance on inexpensive foods, which are high in calories and low in nutritional value (Dixon et al., 2001; Ziliak & Grundersen, 2011). In addition, older adults have a diminished ability to extract nutrients from food, placing those who are food insecure at greater risk of nutritional deficiencies (Dixon et al., 2001; Ziliak & Grundersen, 2011).
These nutritional insufficiencies may contribute to chronic diseases. Food insecurity has been associated with several chronic diseases among low-income adults (Seligman, Laraia, & Kushel, 2010). Diabetes was associated with food insecurity, particularly in women (Fitzgerald, Segura-Pérez, & Pérez-Escamilla, 2011; Gucciardi, Vogt, DeMelo, & Stewart, 2009). Older adults with food insecurity had similar functional limitations of adults who were 15 years older and food secure (Gundersen & Ziliak, 2015). Because health disparities have been shown to exist for food insecurity and chronic diseases among adults, the purpose of this study was to assess these relationships for a representative sample of older adults from the United States and to determine sex and race/ethnic differences.
Method
Source of Data and Compliance With Ethical Standards
This study extracted data and appended two cycles from the National Health and Nutrition Examination Survey (NHANES), 2011 to 2012 and 2013 to 2014, which are available for public use (National Center for Health Statistics [NCHS], 2015). Each survey period applies a complex, stratified, multistage probability cluster sampling design to obtain a nationally representative sample of the U.S. civilian, noninstitutionalized population. These surveys contain data for approximately 20,000 individuals (5,000 per year) of all ages and are generated under the auspices of the NCHS, a division of the Center of Disease Control and Prevention (CDC), a part of the U.S. Department of Health & Human Services. All participants read, understood, and signed informed consent forms. Separate informed consent forms were signed for participants depending on whether they participated in the interview and health examination or just the interview. For this study, the sample weight chosen was for the health examination and was designed to account for unequal probabilities of selection, account for nonresponse, and conform to a known population distribution. Weight and height were measured in a mobile examination center using standardized techniques and equipment. Body mass index (BMI) was calculated as weight in kilograms divided by height in meters squared (kg/m2), rounding to the nearest tenth. Detailed information concerning the data collection procedure for these cross-sectional surveys is found at the website of the NCHS (2015).
Description of Sample
There were 19,151 persons for the 2011 to 2014 cycles. The sample for this study consisted of N = 3,871 adults aged ≥55 years from five racial/ethnic groups with measures for waist circumference from the Mobile Examination Survey (MEC) examination. Specifically, the racial/ethnic categories had 373 Mexican Americans (MAs), 398 Other Hispanics (OHs); 958 non-Hispanic Blacks (NHBs), 423 non-Hispanic Asians, and 1,719 non-Hispanic Whites (NHWs). The category “Other” was not included due to its small sample size. Special analysis of 10,781 adults aged 21 and older was performed to assess food insecurity level by age group.
Major Independent Variables
Sex was designated as male/female and race/ethnicity is described in section “Description of Sample” above. Food security level was based on household interview data using a validated questionnaire, U.S. Food Security Survey Module, developed by the USDA using 10 out of 18 questions for adults (Bickel, Nord, Price, Hamilton, & Cook, 2000). Four categories were provided: full, marginal, low, and very low food security. Two variables for food security (binomial: security, no security) and three levels (full, marginal, and low) were created for this study. Three levels of food security were presented for the descriptive statistics and the binary variable was used to assess the interactions of race/ethnicity by food security and sex by food security. The measure of poverty was considered below 1.00 for the family income to poverty ratio (U.S. Census Bureau, Population Division, Fertility & Family Statistics Branch, 2004). BMI categories corresponded to National Institutes of Health (NIH)’s classification (National Heart, Lung, and Blood Institute [NHLBI] & National Institutes of Health, 2016). The following BMI categories were created: underweight or normal (12-24.9 = 1), overweight (25-29.9 = 2), mild obesity (obesity I) (30-34.9 = 3), moderate obesity (obesity II) (35-39.9 = 4), and morbid obesity (obesity III) ≥40. There were not enough in the underweight category (less than 2%) for adults 55 years and older, so underweight was combined with normal weight. Also, there were not enough older adults in the morbid obesity category, so high obesity was considered 35 and above. BMI categories were used for descriptive analysis; whereas, waist circumference (high ≥ 88 cm, women; high ≥ 102 cm, men; NHLBI & National Institutes of Health, 2016) was used for logistic regression models. Waist circumference has been recommended as an indicator of metabolic fat in older adults in preference to BMI (Chen & Guo, 2008; Guallar-Castillón et al., 2007; Nam, Kuo, Markides, & Al Snih, 2012).
Major Dependent Variables
Chronic diseases assessed for this study were coded as binomial (presence/absence) and included cancer, diabetes, cardiovascular event (stroke, angina, and heart attack or coronary artery disease), lung diseases (asthma, emphysema, and bronchitis), and hypertension. Presence of the disease was an affirmative response to “have you ever been told by a doctor or other medical professional that you had_____________ (the disease).”
Adjustment Variables
Exploratory statistics were performed to determine the association of questionable variables with food insecurity and chronic diseases for older adults. Marital status (married/partnered vs. not married/partnered) was not associated with either variable. The poverty index was converted to a binary variable (<1.00 = poverty, ≥1.00 above poverty). Because 44.4% below the poverty level were food secure (55.6% below poverty were food insecure), the poverty index was used as an adjustment variable. Based on exploratory statistics and the literature the following sociodemographic adjustment variables were added: currently smoking (yes/no), having health insurance (yes/no), age (continuous 55-80 [persons above 80 years were coded as 80 by NHANES to protect identity]), and education (four levels: less than high school, high school graduate or General Equivalency Diploma (GED), some college, college graduate or higher).
Statistical Analysis
Sample weights used for all data analyzed were based on the data file with the smallest sample size, the MEC, and were computed using the average of the 2-year sample weights for each cycle in accordance with instructions from NCHS (2013). All data were analyzed using IBM Statistical Package for Social Sciences (IBM SPSS, version 23) with the module for complex sample design analysis. All analyses were performed considering the differential probabilities of selection and the complex sample design, with SPSS, using the Taylor series linearization. Descriptive characteristics, such as poverty to income ratio, food insecurity, and chronic diseases were compared by sex and by race/ethnicity, and were presented in percent and 95% confidence intervals. Figures 1 and 2 were generated by complex cross tabulation. Figure 1 depicts food insecurity within age groups of adults. Figure 2 presents food insecurity within each BMI category. Logistic regression models were run to determine the odds of chronic diseases for level of food insecurity and food insecurity by race and sex, adjusting for waist circumference and sociodemographics. Five models were conducted: presence of lung disease (asthma, bronchitis, or emphysema), diabetes, cancer, cardiovascular event (heart attack or stroke), and hypertension. Models were considered fit if total classification was ≥75% and the p value for the corrected model was <.01. For variables to be considered significant, a p value of ≤.05 was necessary.

Food insecurity across age groups.

Percent level of food security within BMI category.
Results
Sociodemographics and chronic diseases of the study population are shown in Table 1 by food insecurity level. A significantly higher percent of participants who were food secure had some form of cancer as compared with those with marginal or low food security. In contrast, those with low food security had a higher percent with the highest obesity categories (BMI = 35-39.9 kg/m2 and BMI > 40 kg/m2), high waist circumference (>88 cm women, >102 cm men), diabetes, hypertension, and lung disease as compared with those who were food secure. A significantly higher percent of persons with low food security were from minorities (MAs, OHs, and NHBs) except NHAs as compared with NHWs. Over three quarters of this population rated their health as good or better (self-rated health: good/very good/excellent categories). A significantly lower percent of food insecure (marginal and low) participants rated their health as good or better. A higher percent of persons with low food security attained a low education level, had no health insurance, and were smokers. There were no significant differences in food security level by sex. Food insecurity (marginal and low) was indicated for approximately 13% of the population and 11% of older adults in the study population were below the poverty level (data not shown). Tables 2 to 5 present food insecurity by sex and race/ethnicity for chronic diseases by logistic regression analysis.
Chronic Disease and Sociodemographics of the Study Population by Food Security Level.
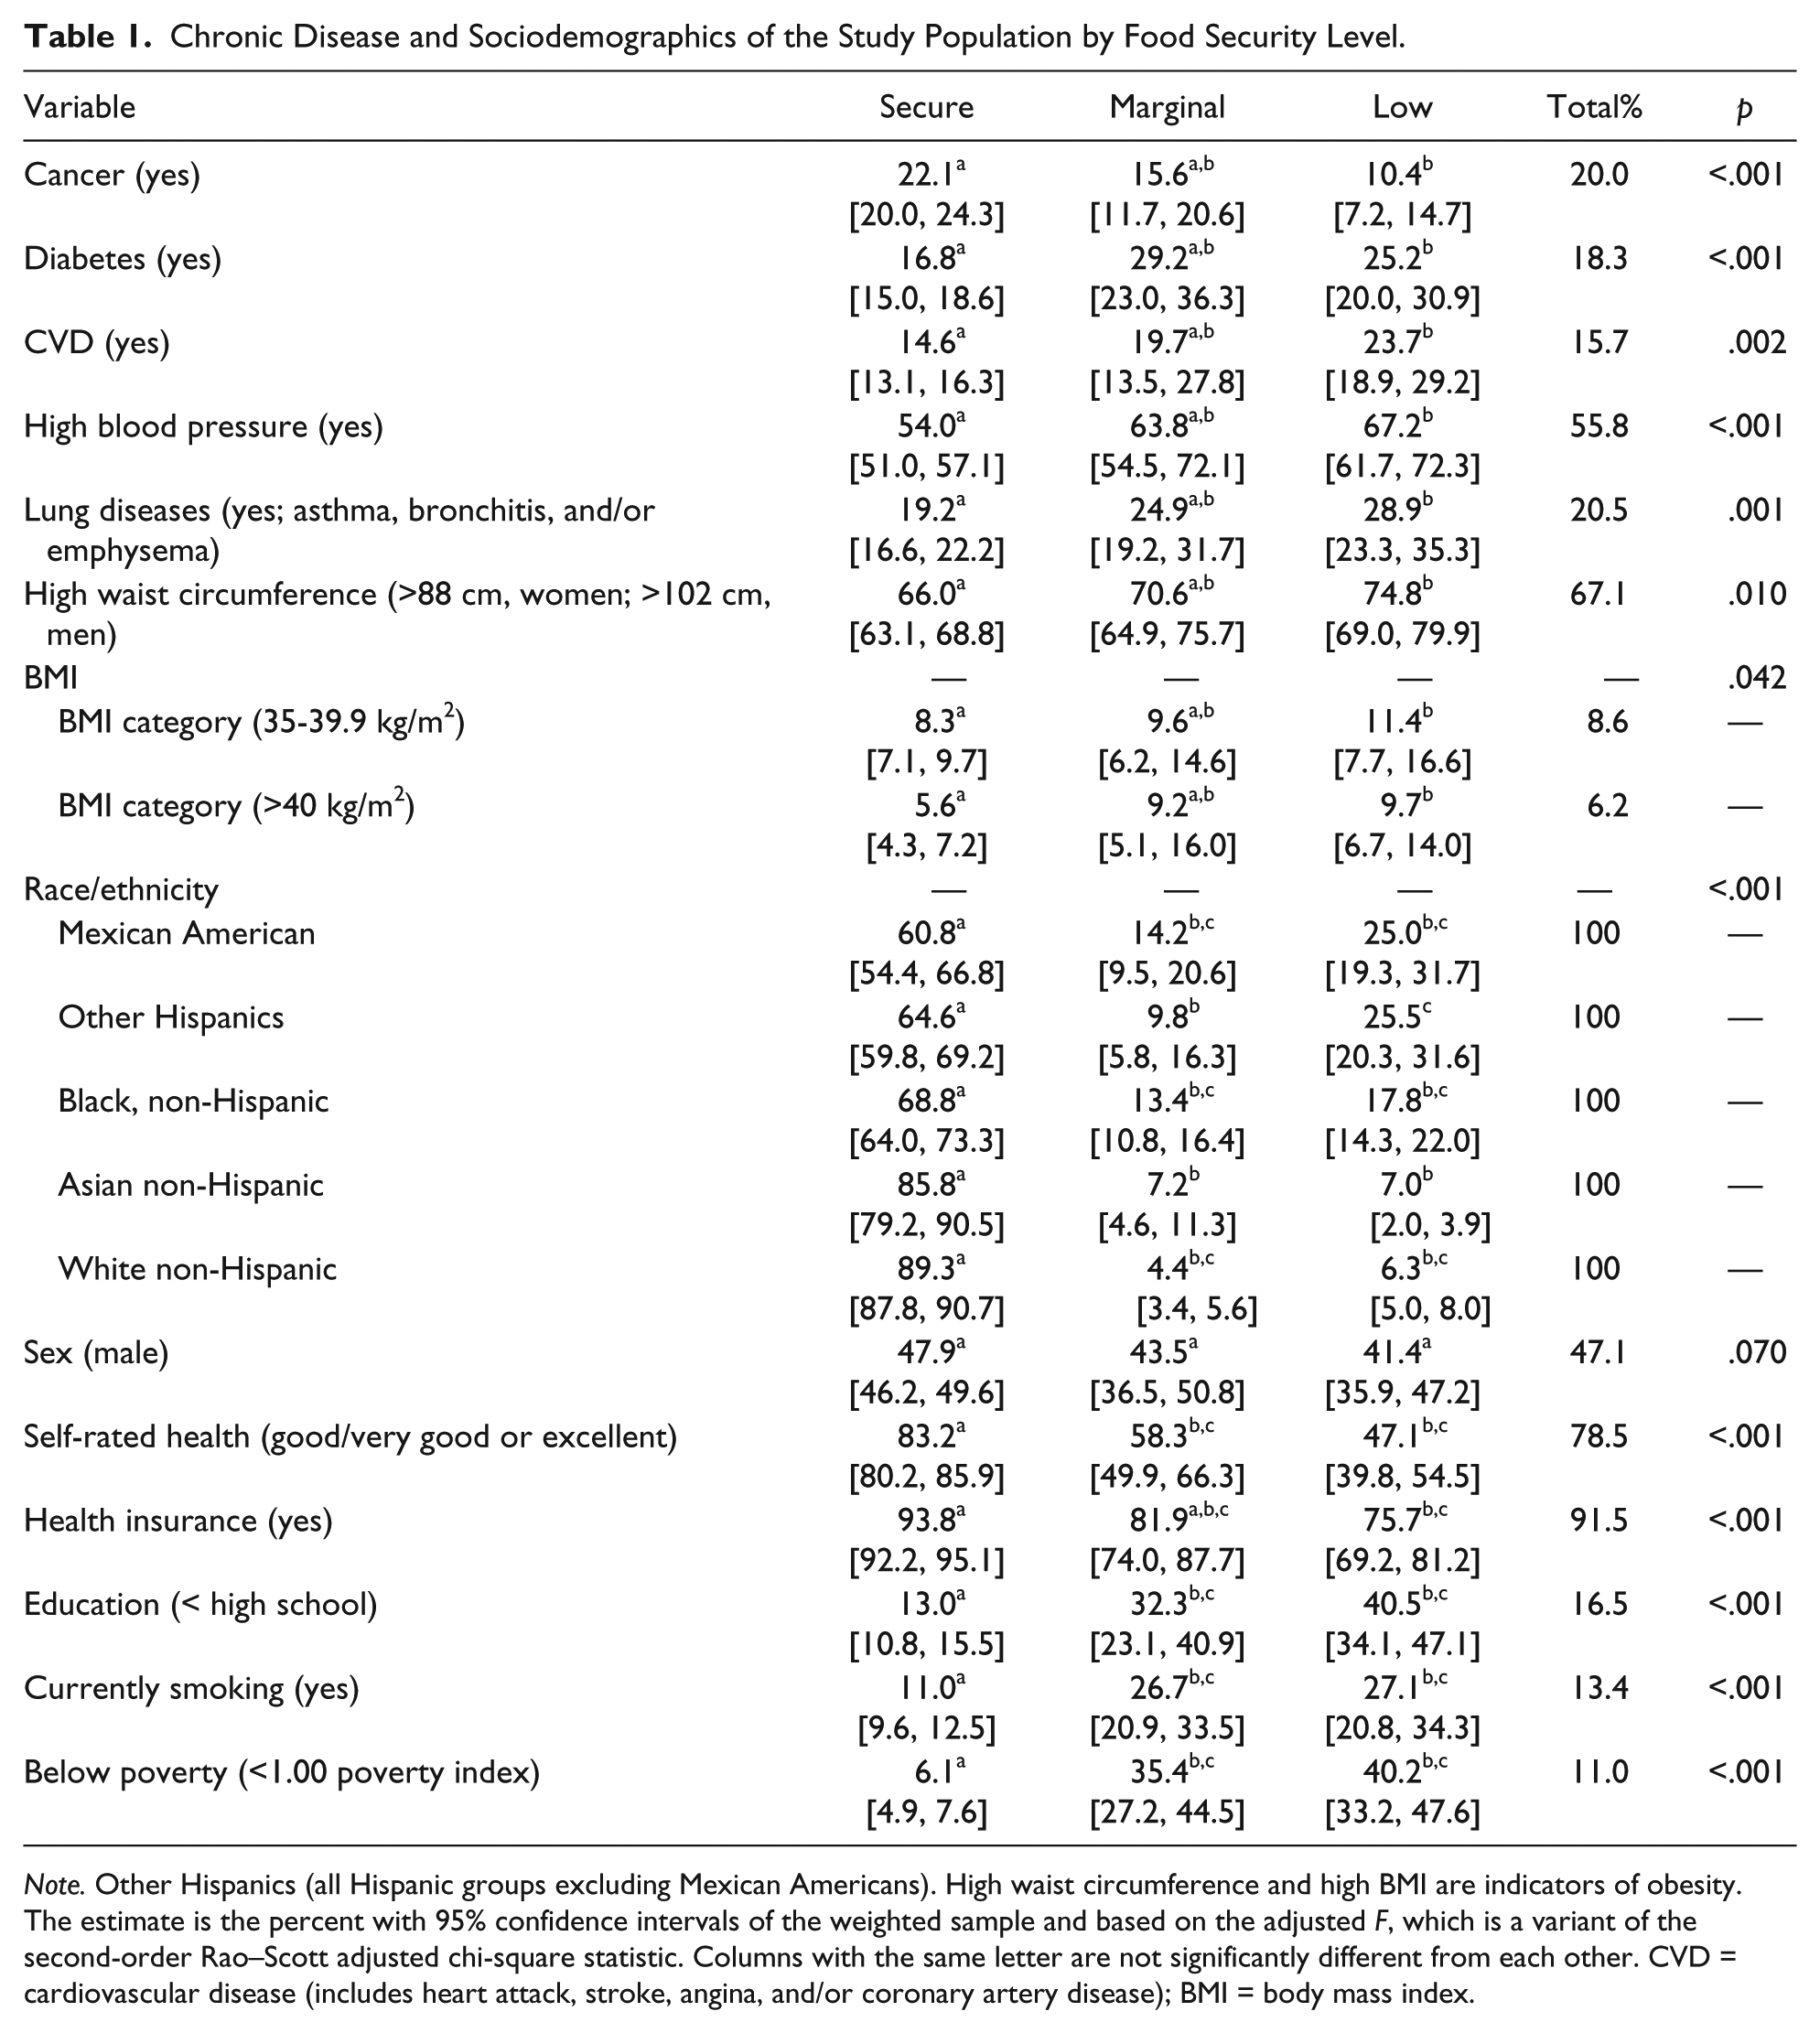
Note. Other Hispanics (all Hispanic groups excluding Mexican Americans). High waist circumference and high BMI are indicators of obesity. The estimate is the percent with 95% confidence intervals of the weighted sample and based on the adjusted F, which is a variant of the second-order Rao–Scott adjusted chi-square statistic. Columns with the same letter are not significantly different from each other. CVD = cardiovascular disease (includes heart attack, stroke, angina, and/or coronary artery disease); BMI = body mass index.
Food Insecurity, Sex, and Race/Ethnicity With Presence of Cancer by Logistic Regression.

Note. Model fit: corrected model, F(19, 14) = 13.1; p < .001; 79.2% of the dependent variable was correctly classified; Nagelkerke pseudo R2 = .100. The estimate is OR with 95% confidence intervals of the weighted sample and based on the adjusted F, which is a variant of the second-order Rao–Scott adjusted chi-square statistic. OR = odds ratio; CI = confidence interval.
Food Insecurity, Sex, and Race/Ethnicity With Diabetes.
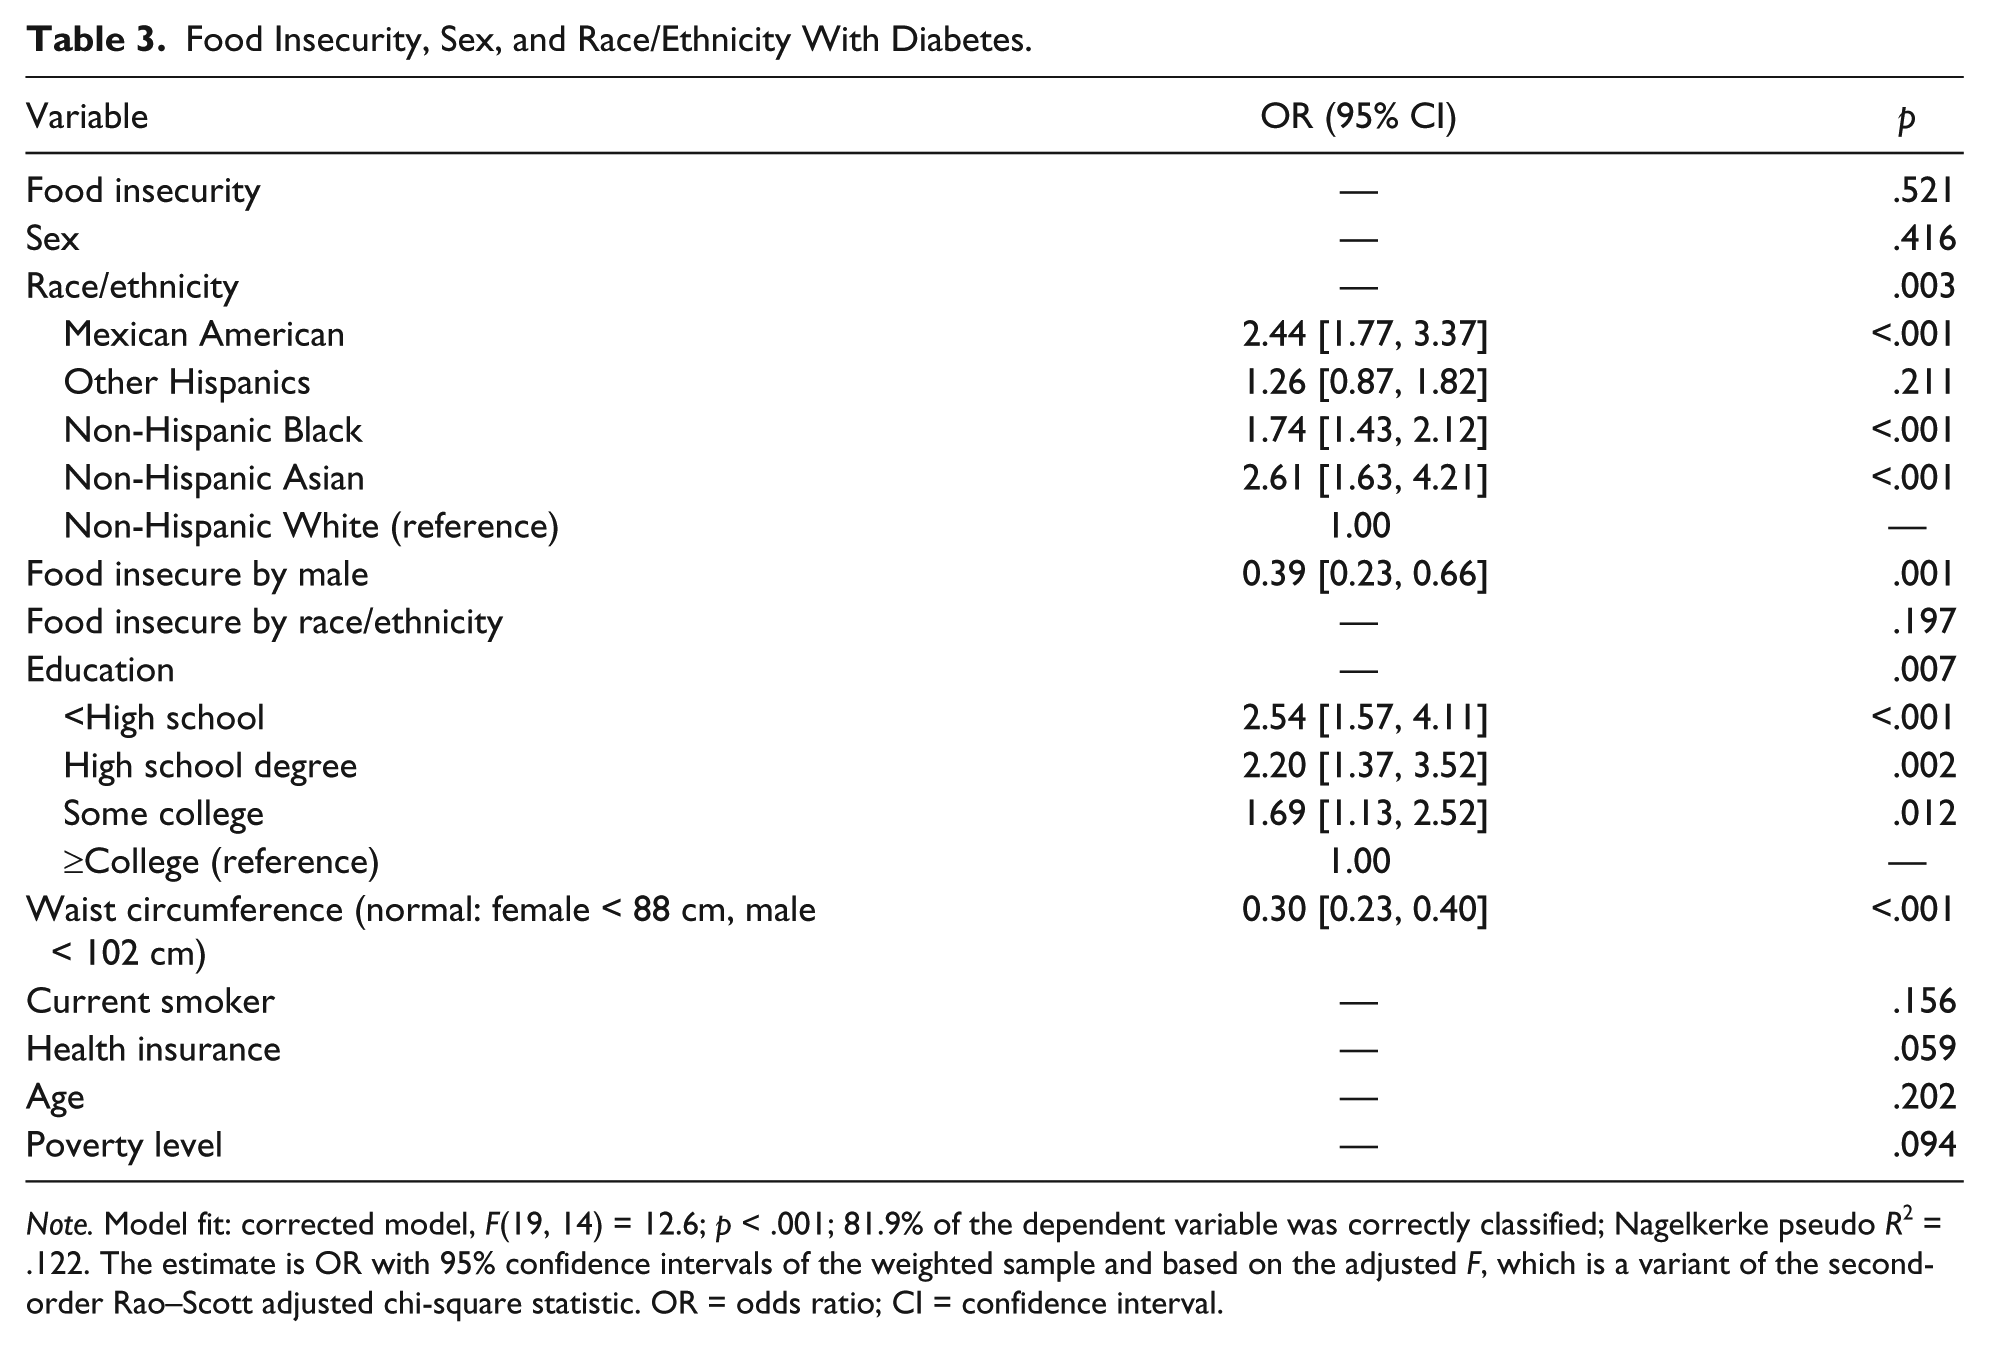
Note. Model fit: corrected model, F(19, 14) = 12.6; p < .001; 81.9% of the dependent variable was correctly classified; Nagelkerke pseudo R2 = .122. The estimate is OR with 95% confidence intervals of the weighted sample and based on the adjusted F, which is a variant of the second-order Rao–Scott adjusted chi-square statistic. OR = odds ratio; CI = confidence interval.
Food Insecurity, Sex, and Race/Ethnicity by Cardiovascular Disease (Angina, Coronary Heart Disease, Heart Attack, and/or Stroke).
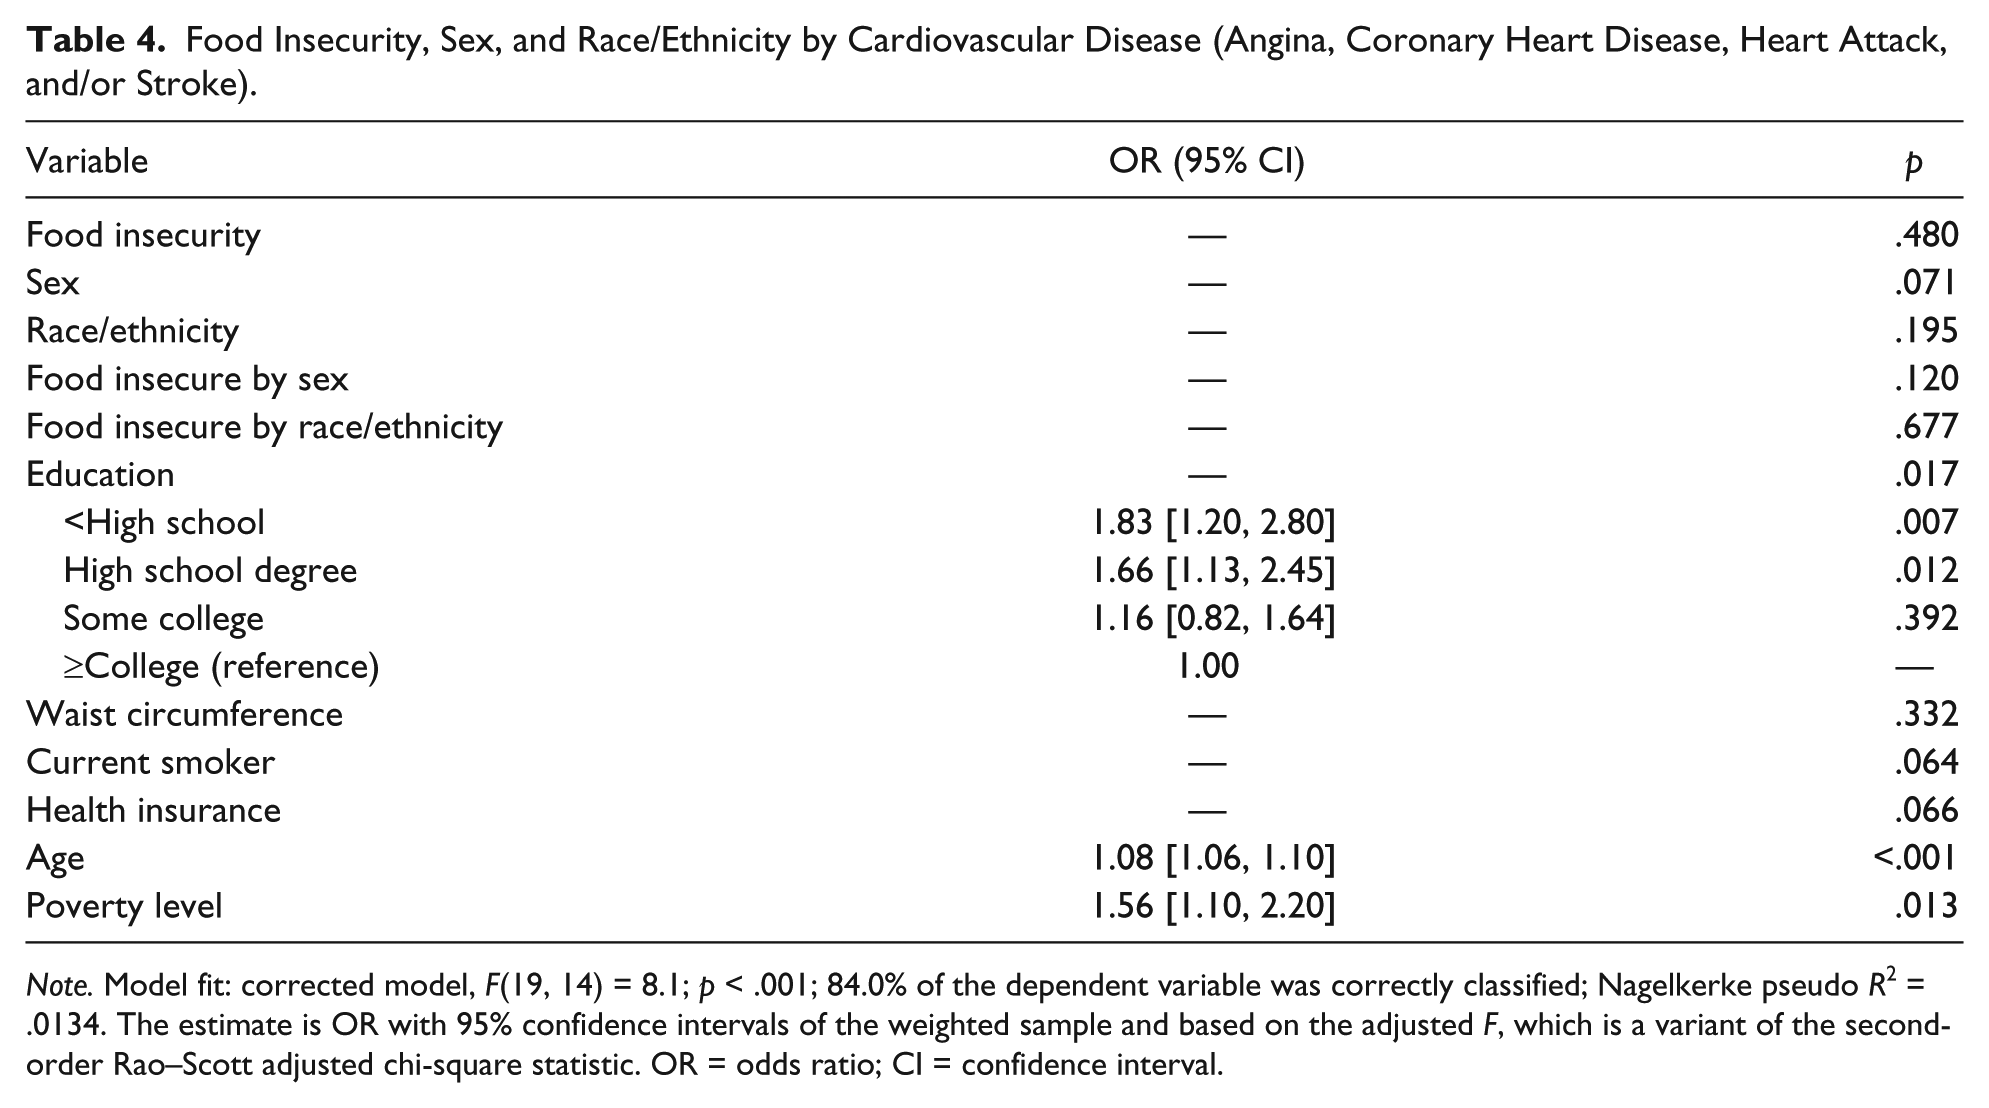
Note. Model fit: corrected model, F(19, 14) = 8.1; p < .001; 84.0% of the dependent variable was correctly classified; Nagelkerke pseudo R2 = .0134. The estimate is OR with 95% confidence intervals of the weighted sample and based on the adjusted F, which is a variant of the second-order Rao–Scott adjusted chi-square statistic. OR = odds ratio; CI = confidence interval.
Food Insecurity, Sex, Race/Ethnicity With Lung Disease (Asthma, Emphysema, and/or Bronchitis).

Note. Model fit: corrected model, F(19, 14) = 9.5; p < .001; 79.3% of the dependent variable was correctly classified; Nagelkerke pseudo R2 = .053. The estimate is OR with 95% confidence intervals of the weighted sample and based on the adjusted F, which is a variant of the second-order Rao–Scott adjusted chi-square statistic. OR = odds ratio; CI = confidence interval.
NHWs, advanced age, and those with a college degree or greater had greater odds of cancer (Table 2) as compared with their counterparts. Specifically, minorities have lower odds of having cancer as compared with NHWs (MAs, odds ratio [OR] = 0.47 [0.27, 0.84], p = .012; OHs, OR = 0.44 [0.26, 0.74], p = .003; NHBs, OR = 0.54 [0.40, 0.74], p < .001; NHAs, OR = 0.35 [0.23, 0.54], p < .001). Food insecurity by sex (p = .750) and food insecurity by race/ethnicity (p = .208) were not significantly associated with cancer.
Males who had food insecurity had lower odds of diabetes (Table 3) as compared with females with food insecurity (ORmale = 0.39 [0.23, 0.66], p = .001). Higher odds of diabetes was found for MAs (OR = 2.44 [1.77, 3.37], p < .001), NHBs (OR = 1.74 [1.43, 2.21], p < .001), and NHAs (OR = 2.61 [1.63, 4.21], p < .001) as compared with NHW (OR = 1.00 [reference]). Diabetes was more likely for older adults with a high waist circumference (normal: female < 88 cm; male < 102 cm; OR = 0.30 [0.23, 0.40], p < .001). Older adults with a lower education level were more likely to have diabetes as compared with those with higher education. Specifically, greatest odds of diabetes were for those with less than high school (OR = 2.54 [1.57, 4.11], p < .001), followed by having a high school diploma or GED (OR = 2.20 [1.37, 3.52], p = .002), and having completed some college (OR = 1.69 [1.13, 2.52], p = .012) as compared with having a college education or above (OR = 1.00 [reference]). Among this older population, age was not a significant predictor of diabetes (p = .202). Poverty was a marginally significant predictor of diabetes (p = 0.94).
Predictors of cardiovascular diseases (angina, coronary heart disease, heart attack, and/or stroke; Table 4) were poverty (p = .013), age (p < .001), and lower education (p = .017). Adults classified as living in poverty had greater odds of cardiovascular disease (OR = 1.56 [1.10, 2.20]) as compared with those above the poverty level. Older adults were more likely to have cardiovascular diseases (1.08 [1.06, 1.10]). Specifically, odds of cardiovascular diseases for lower education level, less than high school and high school or GED, were OR = 1.83 ([1.20, 2.80], p = .007) and OR = 1.66 ([1.13, 2.45], p = .012), respectively, compared with college and above (OR = 1.00 [reference]). Food security (p = .480), waist circumference (p = .332), and race/ethnicity (p = .195) were not significantly associated with cardiovascular diseases. Marginal significance of having cardiovascular diseases was found for smoking (p = .064), health insurance (p = .066), and sex (p = .071).
Food security, alone was not a predictor of lung disease (asthma, emphysema, and/or bronchitis; p = .084; Table 5). Instead, being male (OR = 0.69 [0.52, 0.92], p = .013) and being male and food secure (OR = 0.48 [0.26, 0.86], p = .016) were protective of lung disease. Having a normal waist circumference was also protective of lung disease (OR = 0.69 [0.52, 0.90], p = .009). Persons currently smoking were more likely to have lung disease (OR = 1.99 [1.32, 3.00], p = .002). Logistic regression models for obesity and hypertension could not be fit because classification was <75%.
Food security was compared by age group and presented in Figure 1. This was a special analysis of 10,781 adults aged 21 and older by complex cross tabulation. The groups were significantly different (p < .001). The analysis is of the study population with the addition of younger adults. The percent of adults fearing that they would run out of food was 21.4 [19.3, 23.7]. Younger adults had the highest food insecurity as compared with older adults. Percent reporting fear of running out of food was 18.2 [15.7, 21.1] for adults 50 to 64.9 years old, 11.3 [9.5, 13.2] for adults 65 to 74.9 years old, and 8.7 [6.9, 10.8] for adults 75 years and older. This measure does not consider access to quality food that meets nutritional needs, which may be more of an issue for older adults (American Association of Retired Persons Inc., 2015).
Figure 2 depicts BMI by food security level for the study population (adults 55 years and older; p < .001). The extreme lower weight and upper weight individuals were more likely to be food insecure within their respective BMI category. The percent of food insecure by BMI categories are as follows: underweight, 20.3 [12.1, 32.0]; normal weight, 10.7 [7.9, 14.3]; overweight, 10.5 [8.5, 13.0]; mild obesity, 16.0 [12.7, 19.9]; and moderate-to-severe obesity, 17.9 [13.8, 23.0].
Discussion
In the current cross-sectional study of older adults, low food security was associated with extreme obesity, diabetes, and lung diseases, adjusting for sociodemographics. Women with food insecurity were more likely to have diabetes and lung diseases, after adjusting for race/ethnicity, BMI, smoking, education, health insurance, and age. There were no significant differences in the chronic diseases measured comparing food security with marginal security. Although there is anxiety over food shortage, the quality and actual diet is unchanged with marginal food security. Reduction in diet quality is a risk factor for chronic diseases. Low food security is indicative of a reduction in the diet quality and was related to all chronic diseases (unadjusted characteristics) except cancer. Cancer was associated with food security and high education in the current study. Little explanation can be offered, as there are no publications, to date, concerning cancer and food security.
Based on a review of food insecurity and chronic disease, food insecurity was associated with diabetes (Laraia, 2013); however, these studies did not compare the food insecurity by sex and by race/ethnicity and its association with having diabetes for an older adult population. In an earlier representative sample of U.S. adults above 20 years of age and threefold below the poverty level, those with the lowest food security had higher odds of diabetes as compared with the food secure group (Seligman, Bindman, Vittinghoff, Kanaya, & Kushel, 2007). Seligman et al. (2010) reported greater odds of diabetes for very low food security in a representative sample of low-income, U.S. adults. Gucciardi et al. (2009) found diabetes to be highest in those with food insecurity and that this relationship was stronger for women than men in a Canadian population. In accordance with the U.S. and Canadian studies, Fitzgerald et al. (2011) indicated very low food security was associated with type 2 diabetes comparing Hispanic females with and without diabetes. Furthermore, Fitzgerald and colleagues (2011) found the group with diabetes to have higher BMI as compared with controls.
Obesity indicators were higher for those with low food security as compared with those with food security in our study; in contrast, Lee and Frongillo (2001) indicated lower skin-fold measures for older adults with food insecurity as compared with their counterparts. Their study was done more than 15 years ago and since then, generational and environmental factors have contributed toward obesogenic behaviors regardless of food status. Although the United States is exposed to a culture of increased sedentary activities and portion sizes, individuals living in lower income neighborhoods are faced with additional challenges that contribute to obesity such as (a) the availability of lower cost foods, which are high calorie density, have added sugars and fats; (b) more expensive, poorer quality healthy foods; (c) constrained by transportation access; and (d) higher proportion of fast-food restaurants serving energy-dense, nutrition-poor foods at low cost as compared with more affluent neighborhoods (Food Research and Action Center, 2015).
Poverty, but not food insecurity, was associated with cardiovascular diseases in our study. Irving, Njai, and Siegel (2014) reported that hypertension was associated with food insecurity, regardless of socioeconomic position and race/ethnicity for adults 35 and older. Hypertension was measured by “ever told you had high blood pressure” in the Behavioral Risk Survey and may be an indicator of stress-induced hypertension. The authors indicate that food insecurity is a social determinant that can be removed as a barrier by providing healthy, affordable food regardless of other demographic and economic barriers (Irving et al., 2014). We could not fit a model for hypertension, due to the high number of cases; however, the chi-square test for cross tabulation revealed higher percent of persons with low food security having hypertension as compared with those who were food secure.
There is a scarcity of studies relating race/ethnicity and food insecurity to lung or cardiovascular diseases for older adults. The National Foundation for Ending Hunger in Seniors reported higher rates of asthma, heart attacks, angina, coronary heart disease, and congestive heart failure in older adults with food insecurity as compared with those with food security (Feeding America (2016). Seligman et al. (2010) indicated several cardiovascular diseases (hypertension and hyperlipidemia) were associated with food security in a representative sample of low income, U.S. adults. Coronary heart disease and heart attack, stroke, and peripheral arterial disease were associated with food insecurity (unadjusted) in community-dwelling, physically disabled women ≥65 years from an urban area of the United States (Klesges et al., 2001). For this sample of older, urban women, pulmonary disease was not associated with food insecurity (Klesges et al., 2001). Asthma was associated with food insecurity for Latin American children (Ribeiro-Silva Rde et al., 2014). There are no studies, to date, assessing the association of food insecurity and lung diseases by sex and race/ethnicity in older adults.
This study used a representative sample of older adults from five major racial/ethnic groups. The measure for food insecurity was from a validated USDA method and was for adult and not household, albeit, there are several limitations of this study. The study was cross-sectional, so causality cannot be assumed. Although clinically important adjustment variables were used, there may be confounders. Chronic stress was not measured and could be a potential confounder for food insecurity and chronic diseases. Geographic location was not considered and there are wide differences in urban and rural food environments contributing to food security. For example, neighborhood walkability was correlated with food security for urban seniors (Chung et al., 2012); whereas, Ziliak and Gundersen (2009) reported differences in food security by sex in urban but not rural areas.
Conclusion and Implications
Despite these limitations, the results of this study have numerous implications for gerontologists because demographic differences were found in food insecurity and chronic disease. Qualitative studies are needed to determine behavioral themes by sex and race/ethnicity, particularly in Hispanic women with diabetes and food insecurity and older adults with lung disease and food insecurity. In conclusion, the results of this study have shown interactions between sex, race/ethnicity, and food insecurity with chronic diseases for older adults. Food insecurity, sex, and race/ethnicity were associated with chronic diseases in a representative sample of U.S. older adults. These findings reinforce the need to provide heart-healthy congregate meals to seniors with food insecurity as a possible venue to delay cardiovascular disease complications.
Footnotes
Ethics Approval
The data for this study were available to the public by the Center for Disease Control and Prevention (CDC)’s NCHS. The procedure followed for ethical data collection from human participants is discussed in the “Method” section of this article.
Declaration of Conflicting Interests
The authors declared no potential conflicts of interest with respect to the research, authorship, and/or publication of this article.
Funding
The authors received no financial support for the research, authorship, and/or publication of this article.