
Abstract
Objective:
Responsiveness refers to meeting the legitimate expectations of people who interact with the health system. This study aimed to assess the presence of any inequality in responsiveness based on the different sociodemographic groups.
Methods:
This cross-sectional study was carried out in Tehran. A total of 610 people with a physical disability from 10 comprehensive physical rehabilitation centers (5 public and 5 private) were included in the study through quota sampling. Data were gathered using the World Health Organization Standard Responsiveness Questionnaire and a sociodemographic checklist. Relative inequality indices were used for the analytical statistics.
Results:
Study respondents between 18 and 59 years and those equal to or older than 60 years formed 78.1% (475/610) and 21.9% (133/610) of the total study sample, respectively. The study sample consisted of 298 (48.7%) women and 312 (51.3%) men, and their mean age was 46.4 and 45.6 years, respectively. No significant inequality was found in responsiveness of total centers based on the socioeconomic status of the study participants. However, in the private comprehensive physical rehabilitation centers, significant inequality was found in responsiveness based on residential area per capita, with more reporting of poor responsiveness by people with physical disability in the lower residential area per capita quintiles (Wagstaff index [WI] = −0.262; P = .01). Inequality in responsiveness was also found in the public centers based on education level, with poorer experience in people with higher level of education quintiles (WI = 0.163; P = .02).
Conclusion:
In the private sector, economic issues are the main reason for the poorer experiences. Furthermore, residential area per capita showed to be a more sensitive index among economic indices to measure inequality. In public sector, education level was the key social factor. More attention and interventions need to be implemented by mid-level policymakers and rehabilitation service providers to meet the needs of people with physical disability.
Introduction
In many countries, especially in Europe, providing the population with medical services which are fairly comprehensive and universal is a fundamental policy goal. 1 Countries with high income have strategies for health monitoring, assessment of service provided, and fair pricing of health services and have targeted programs for reduction in inequalities. 2 Health monitoring is tracking the health of a population and the health system which serves that population. Inequality in health and health system function is one of the very important issues that should be monitored. Health inequality monitoring includes finding the differences in the health and health indicators of people belonging to different social groups. Inequality in providing services and the treatment of persons of social subgroups in terms of different socioeconomic characteristics is a key aspect of the health system’s function. 3 Health system responsiveness as one of the goals of this system is considered as experiences of people regarding the nonmedical, nonfinancial aspects of health system when they encounter it. 4 The World Health Organization (WHO) reports that the distribution of responsiveness and inequality that may occur due to differences in the socioeconomic or demographic situation should be considered in the assessment of the health system performance, 5 and monitoring of inequalities in health system responsiveness is recommended. 6,7 The study of inequality is important not only in the field of policy but also from the statistical and ethical aspects. Monitoring the inequality of health indicators and services is recommended in many respects because it provides the necessary information for policymakers who make the decisions. Besides, monitoring health-related indicators and merely considering central values create many challenges without taking into account the inequalities. Because the mean of indicators or the level of service provided may not change considerably over time, the gap between the more and less advantaged groups is increasing. Also, it is ethically necessary to address the issue of inequality. 3
Assessing the responsiveness to people with disability and existing inequalities becomes even more important as they form a large population of more than 1 billion people worldwide, estimated to be 15% of the total global population. More than 650 million people are living with a physical disability, with two-thirds of them living in the developing countries. 8 The vulnerability of people with disabilities can lead to their isolation. People with disabilities need continuous health-care services, especially rehabilitation, but usually experience more barriers to access services and, hence, face poorer health consequences. They have less educational opportunities, less economic participation, and face more poverty. These factors may place this vulnerable group in a lower position in the socioeconomic hierarchies. 9 The WHO reports that the socioeconomic position is found to play a key role in the social determinants of health inequities. 10 It means that people with disabilities, including physical disabilities, are more likely to experience inequality and face unmet needs. According to WHO, most health systems fail to respond to the general and specialized health-care needs of people with disability. These people are twice as likely to have a problem in accessing the health services and find health-care providers than other people and 3 times more likely to be neglected. 11 Furthermore, the care of patients with disabilities may be influenced by the negative attitude of health-care providers toward people with disabilities. 12
In Iran, it is estimated that people with a disability comprise between 4% and 15% of the population. 13,14 Although the precise number of this population is debatable, based on the several definitions of a “person with a disability,” the number is increasing in accordance with the national census. 14 An investigation in Tehran, the capital city of Iran, on inequality in the health service responsiveness to children younger than 14 years with developmental disabilities using Gini coefficient showed that the families with lower socioeconomic status experienced poorer responsiveness than the more advantaged ones. 15 To the best of our knowledge, there is no investigation on the health system responsiveness to adult people with physical disabilities. So, we aimed to answer the question as to whether there is any inequality in meeting the legitimate expectations of people with physical disabilities who attend the comprehensive rehabilitation centers (CRCs) in Tehran based on their socioeconomic situation.
Methods
From October 2016 through March 2017, this cross-sectional study was carried out in 10 CRCs (5 private and 5 public) of Tehran, the capital of Iran. The list of the centers was obtained from 3 medical universities of Tehran as all centers are licensed by these universities. Quota sampling was used for the selection of the 10 centers including from both public and private sector. 16 The geographic distribution of the centers allowed us to have clients from all districts of Tehran (North, South, Central, West, and East).
The proportion estimation formula was used for calculating the sample size, which was estimated to be 610 participants. 16 The allocation of the samples for each CRC was done according to the monthly admissions. The inclusion criteria for the study were the participants being 18 years or older, having a physical disability/impairment according to physician’s diagnosis, being cognitively and physically capable of answering the questionnaire, and having the experience of using rehabilitation services in the last 12 months.
We used the standard health system responsiveness questionnaire which has 7 domains for outpatient services including prompt attention, dignity, choice, autonomy, confidentiality, communication, and basic amenities. For each domain, there are between 2 and 4 questions about the experience of the clients and 1 rating question on a 5-point Likert scale ranging from very good to very bad. The performance of each domain is determined by the answer to the rating question. Although validity and reliability of the responsiveness questionnaire had been established through a multicountry survey, 17,18 for the current study population from Iran, we calculated the internal consistency of the questionnaire (Cronbach α) and internal correlation over time (κ) by implementing test–retest. Cronbach α of the 7 domains showed the range with a minimum of 0.677 for prompt attention and maximum of 0.911 for basic amenities. The minimum κ value was 0.75 for prompt attention and maximum was 0.94 for basic amenities.
A demographic checklist was also completed. Data were gathered through face-to-face interview by the main investigator as well as by 2 trained interviewers.
Outcome Measurement
The responsiveness of the physical rehabilitation centers was the outcome variable. The responsiveness score was calculated based on the responses to the rating question of the 7 domains. The answers on a 5-point Likert scale to the questions were recoded as 5 (very good), 4 (good), 3 (moderate), 2 (bad), and 1 (very bad). To determine the responsiveness as good or poor, firstly, we summed the scores of the domains and averaged them, then categorized the scores into good (combining the very good and good options) or poor (combining the moderate, bad, and very bad options) performance. Hence, the responsiveness was defined as a dichotomous variable (good and poor). 19
Independents Variables
To measure the inequality, we used 4 socioeconomic variables for ranking the population as follows:
Wealth status
To measure the wealth status, 11 household assets (owning a kitchen, a microwave oven, a dish-washing machine, a freezer, a personal computer, a car, a motorcycle, parking space, swimming pool, sauna and Jacuzzi, and a mobile phone) were subjected to principal component analysis (PCA). Kaiser-Meyer-Olkin (KMO) value and Bartlett test of sphericity were used to assess the suitability of the data to perform PCA. The KMO value was measured as 0.71 (higher than the recommended value of 0.6). 20 Also, Bartlett test of sphericity was significant (P < .001). These findings indicated appropriation to proceed with PCA. The principal component technique and varimax rotation were used. The PCA showed 4 components with eigenvalues exceeding 1, each accounting to 25.9%, 14.9%, 9.6%, and 9.3% of the total variance, respectively. The first factor included 5 items (microwave oven, dish-washing machine, personal computer, car, and parking space). This factor which largely contributed to the total variance was considered as the wealth index. 21 Then z-scores of the first factor were computed and recoded into 5 quintiles with the first through fifth quintile representing the poorest and richest, respectively.
Perceived social class
The perceived social status was measured by a question in which the respondents reported themselves as belonging to a scale ranging from 0 to 10 according to their educational level, job status, and income level in comparison with the other members of the population. These are presented as quintiles from Q1 (lowest class) to Q5 (highest class).
Residential area per capita
The residential area per capita (as the ratio of the residential area [m2] to household size) was calculated and recoded into 5 quintiles (first through fifth quintile representing the poorest and richest, respectively).
Education
We asked each participant about his/her total years of education and then recoded into 5 quintiles as Q1 (1-8 years), Q2 (9-12 years), Q3 (13-14 years), Q4 (15-16 years), and Q5 (17-27 years).
Statistical Analysis
In the present study, the inequality in responsiveness according to the mentioned variables was computed using formula 1. Accordingly, 3 relative inequality indices based on 3 STATA commands were computed: (1) standard concentration index, (2) Wagstaff index (WI), and (3) Erreyger index. 22 Furthermore, we tested 2 null hypotheses: (1) the indices are equal to zero and (2) the indices are the same in public and private CRCs. A P value ≤.05 was considered statistically significant. All statistical analyses were conducted using STATA version 12 and SPSS version 16.

where hi is the health variable in which inequality is measured, for example, responsiveness.
C ranges from
Stata commands for estimating 3 kinds of concentration index are presented as follows.
22
The bold sections are the variables in the current study:
conindex
conindex
conindex
Ethical Considerations
This investigation was approved by the committee on ethical issues at the University of Social Welfare and Rehabilitation Sciences with the ethical code IR.USWR.REC.1395.86. The management board of the private and public centers as well as the medical universities in the area permitted this study to be conducted. All individuals who met the inclusion criteria were explained about the goals of the study and were assured that the information would remain confidential. Then, if the individuals were willing to participate in the study, informed consent was obtained from them.
Results
The mean age of the women and men participating in this study was 46.4 (SD = 14.3) and 45.6 (SD = 15.4) years, respectively. The mean years of education of the participants was 12.57 (SD = 5.07). The mean of residential area per capita was 40.57 m2 (SD = 26.63). The median of the per capita residential area was 33.33.
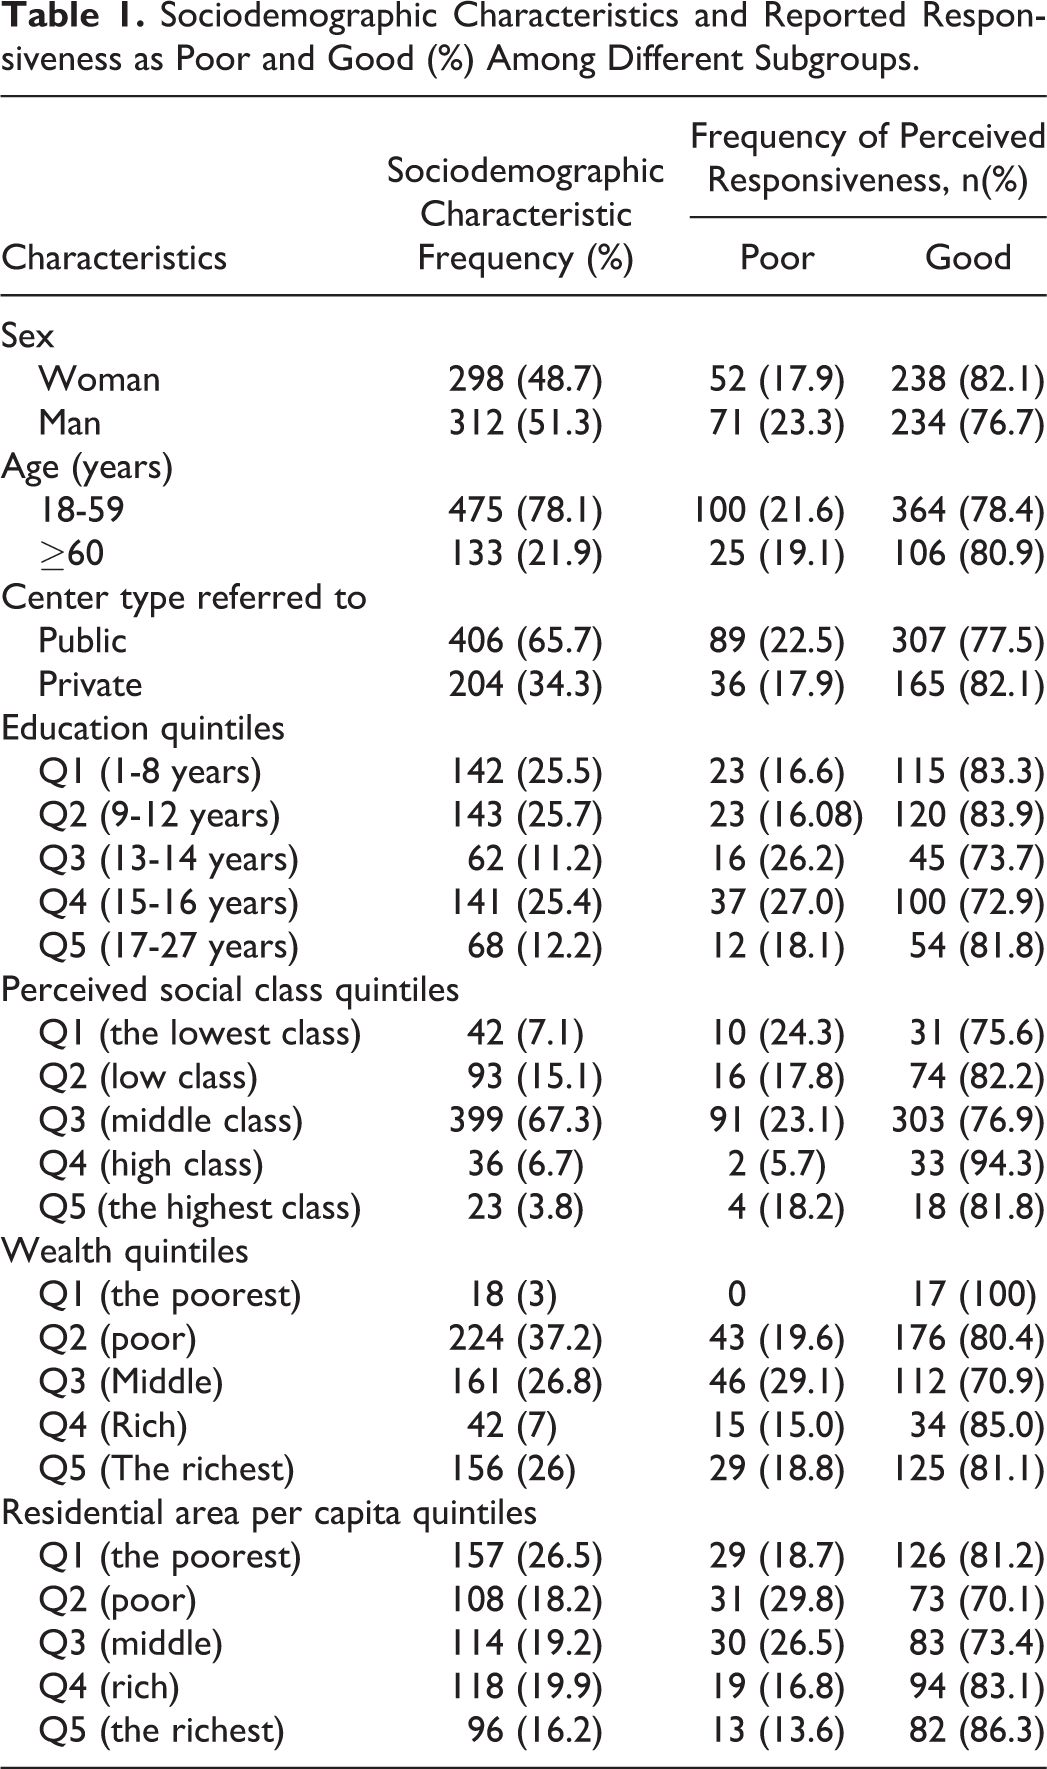
The sociodemographic characteristics and reported responsiveness, as poor and good (%), among the different subgroups are shown in Table 1.
Sociodemographic Characteristics and Reported Responsiveness as Poor and Good (%) Among Different Subgroups.
The findings of inequality based on the 4 socioeconomic variables were as follows.
Inequality in Responsiveness Based on the Residential Area per Capita
Considering the concentration indices calculated based on poor responsiveness status and residential area per capita, there was no inequality in responsiveness in the public sector and total sample. However, there was a significant inequality (P < .05) in the private sector. The amount of inequality based on the 3 calculated indices was different, but the best estimation was obtained based on WI (−0.269; Table 2).
Values of Inequality in Responsiveness Based on Residential Area per Capita.

Abbreviation: CRC, comprehensive rehabilitation center.
aTo reject null hypothesis that the indices are the same in public and private CRCs.
b To reject the null hypothesis that the indices are equal to zero.
As shown in Table 2, in private sectors, not only the calculated indices were statistically different from zero, there was also a significant difference between the public and private sectors (P < .05). In the public rehabilitation centers, the inequality indices were statistically equal to zero. Negative values of the inequality index indicate that the poor responsiveness status is concentrated in the lower quintiles of the residential area per capita (Table 2).
The poor responsiveness status of the private and public sectors based on the residential area per capita is provided in Figure 1.

Poor responsiveness of comprehensive rehabilitation centers (CRCs) and residential area per capita quintiles (of respondents) by public and private sectors.
Figure 1 shows that the pattern of reported poor responsiveness in the 5 residential area per capita quintiles is different in the private rehabilitation centers, indicating that poor responsiveness was reported by a larger percentage of the people in Q1 and Q2 (of residential area per capita) in the private centers. This percentage nearly decreased when the residential area per capita increased.
Inequality in Responsiveness Based on Wealth Status
With regard to the performed tests and values of the concentration indices in the private and public sector as well as the whole sample, no inequality was found in the responsiveness of the studied CRCs in Tehran (Table 3).
Values of Inequality in Responsiveness Based on Wealth Status.

Abbreviation: CRC, comprehensive rehabilitation center.
aTo reject null hypothesis that the indices are the same in public and private CRCs.
b To reject the null hypothesis that the indices are equal to zero.
Table 3 shows that the calculated indices were statistically equal to zero in the total sample as well as the public and private sectors. Also, there was no significant difference between the public and private sectors (P < .05).
Inequality in Responsiveness Based on Perceived Social Class
Considering the results of the statistical tests and values of the calculated inequality indices, we found no inequality in responsiveness in the total sample as well as the public and private sectors. Furthermore, no significant difference was found between the public and private sectors (P < .05; Table 4).
Values of Inequality in Responsiveness Based on Perceived Social Class.
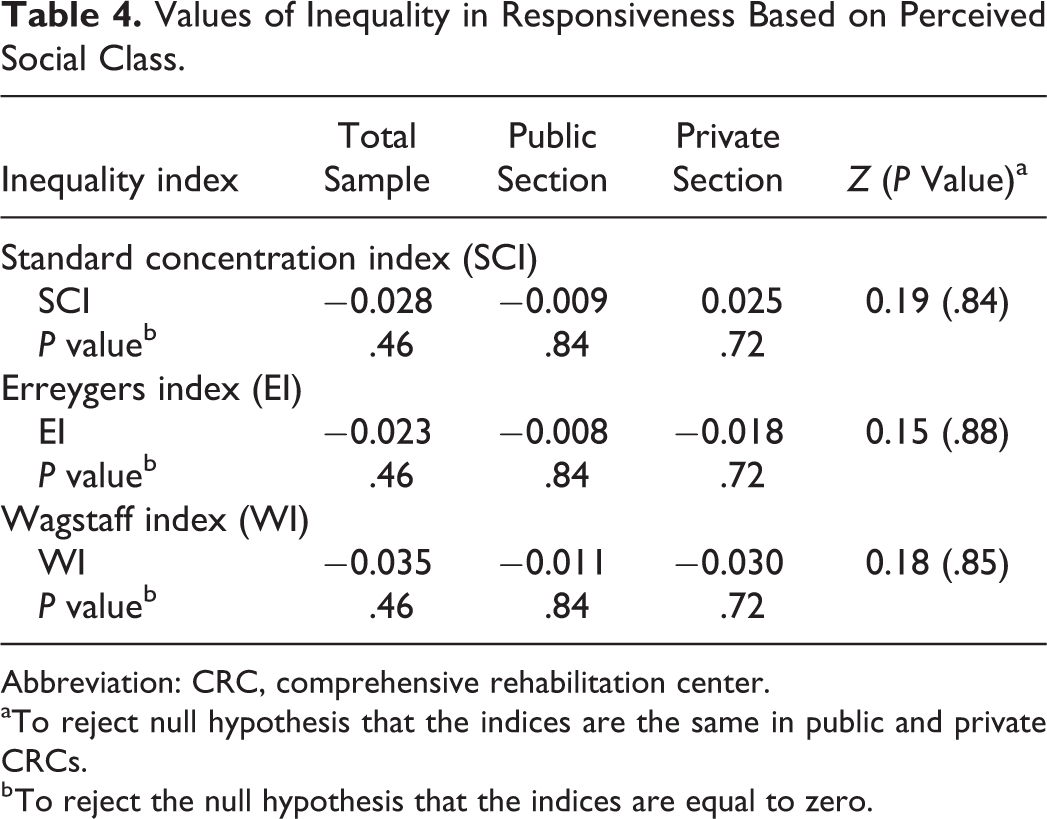
Abbreviation: CRC, comprehensive rehabilitation center.
aTo reject null hypothesis that the indices are the same in public and private CRCs.
b To reject the null hypothesis that the indices are equal to zero.
Inequality in Responsiveness Based on Educational Quintiles
The inequality indices values showed that there was an inequality in responsiveness based on the educational quintiles of respondents only in the public sector CRCs (P < .05). No inequality was found in responsiveness of the total sample and private sector CRCs (Table 5).
Values of Inequality in Responsiveness Based on Education Quintiles.

Abbreviation: CRC, comprehensive rehabilitation center.
aTo reject null hypothesis that the indices are the same in public and private CRCs.
b To reject the null hypothesis that the indices are equal to zero.
Table 5 indicates that the WI was the most sensitive index for estimating the inequality (WI = 0.163). The amount of inequality in responsiveness was statistically different from zero in the public sector. Furthermore, there was a significant difference between the inequality in responsiveness of rehabilitation centers of the public and private sectors (P < .05). The positive values of the inequality indices suggest that poor responsiveness is concentrated in the higher quintiles.
Figure 2 illustrates the poor responsiveness status of the private and public sectors based on the educational quintiles of the respondents.
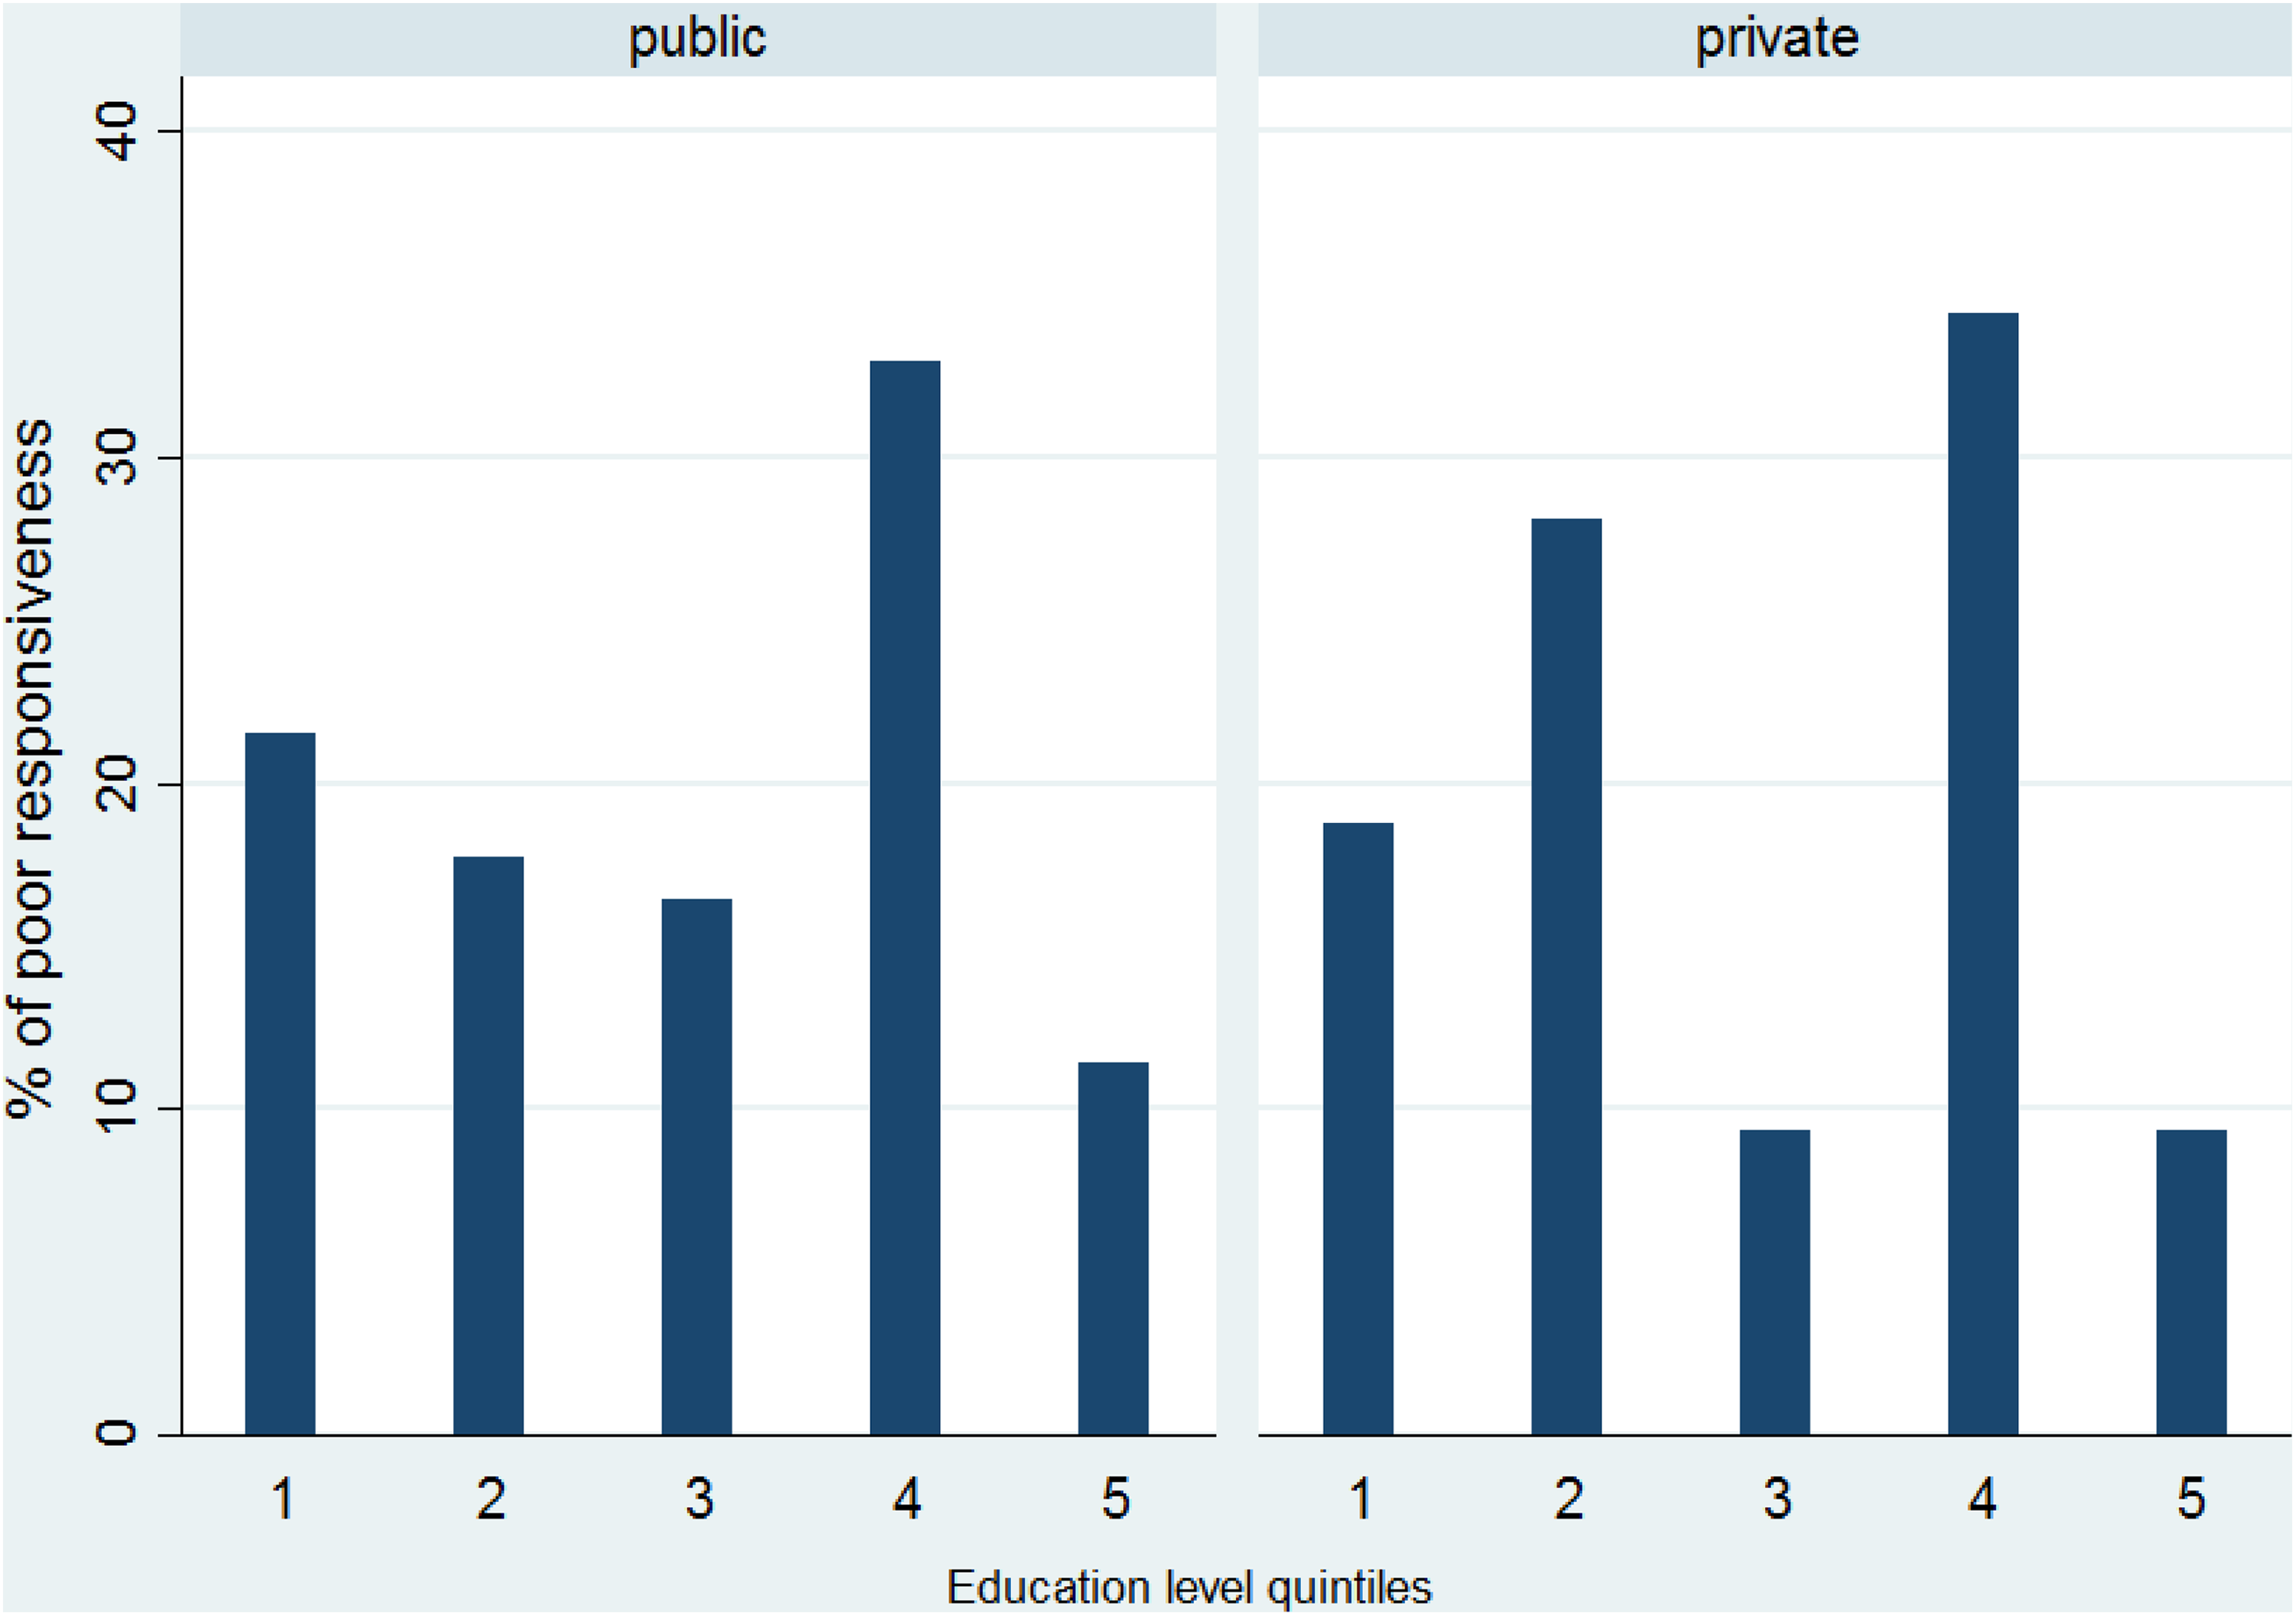
Poor responsiveness of comprehensive rehabilitation centers (CRCs) and education level quintiles (of respondents) by public and private sectors.
As seen in Figure 2, in both center types, a larger percentage of people with high education level reported poor responsiveness. In public CRCs, an increase in the percentage of perceived poor responsiveness could be seen from the middle to lowest education level. However, this ordered pattern was not seen in the private CRCs.
Discussion
The current study aimed to determine the presence of any inequalities in responsiveness of the physical CRCs of Tehran based on the socioeconomic characteristics of the service users who had a physical disability and any possible difference that could exist between the public and private centers. Although WHO is concerned not only with the average level of responsiveness but also with the inequality in its distribution, which may be due to social, economic, and demographic differences, 5 little study has been done in this field. To the best of our knowledge, this is the first time that inequality has been measured in the physical rehabilitation centers in Iran.
In this study, we found that the median residential area per capita of the respondents was 33.3 m2. Based on the previous studies in Iran, the residential area per capita is considered as low, moderate, and high when the values are less than 10 m2, between 10 and 30 m2, and more than 30 m2, respectively. 23 Accordingly, our findings show that nearly half of our study participants were in the middle or lower category of residential area per capita.
In this study, most of the people perceived themselves as belonging to the middle social class. This is in line with the findings of Forouzan et al in the mental health system responsiveness study. 19
The current investigation showed no significant inequality in the overall responsiveness of all the 10 studied CRCs based on the socioeconomic status of the respondents in terms of wealth status, perceived social class, and residential area per capita, indicating that in the overall sample no inequality was found in the treatment in the rehabilitation centers based on the socioeconomic indices. Our results support those of Asghari et al who studied children younger than 14 years with developmental disorders. Although in the study by Asghari et al the interview was done with the parents and not with the patients themselves, they found no inequality in responsiveness to these rehabilitation service users in Tehran based on their income and the calculated Gini coefficient. 15 However, the study on socioeconomic disparities in health system responsiveness (in outpatient care) in India showed that, in the overall sample, a higher proportion of people in the upper wealth quintiles rated the responsiveness as very good compared with the people in the lower wealth quintiles. 24
We found that poor responsiveness status in private physical rehabilitation centers is concentrated in the lower quintiles of residential area per capita. This result indicates that the people referred to the private rehabilitation centers that had less residential area perceived a poorer experience when approaching the rehabilitation centers to receive services. This finding is not seen in the whole study sample including all centers as well as in people who were referred to the public centers. It seems that the residential area per capita as a manifest of economic situation plays an important role. Given the fact that the costs of physical rehabilitation services in private sector in Tehran are more than the costs of services provided by public centers, one probable explanation of this finding is that people who are referred to the private sector to receive the physical rehabilitation services for any reason, despite the low economic status, expect better services than what can be obtained for the money they pay. It should be mentioned that in Iran in 2013, percentage of private expenditure on per capita out of total expenditure on health and percentage of out-of-pocket expenditure per capita of private expenditure on health were estimated to be 59.2% and 88%, respectively. 25 It means that a part of health expenditures is paid by the people. Although responsiveness refers to nonfinancial aspects of health system goals, however, “value for money” considerations in referring people to receive services are of special importance. 26 Also, out-of-pocket payments should be under consideration in health financing policies. 27
Besides, it can be realized from this study that income was not a proper variable for assessing the economic status as most of the participants denied to answer the questions about their monthly income and even their monthly costs. We found that between the socioeconomic indices that we used in this study to measure the inequality, residential area per capita was a more sensitive index in showing the economic differences in a capital city like Tehran because most of the people were more likely to own the items that are usually considered as assets and shown to be more homogenous.
We did not find any inequality of responsiveness considering all the centers based on the years of education. Inequality was found only in the public rehabilitation centers indicating that a larger percentage of people in the upper education quintiles assessed the responsiveness of these centers as poor. Based on the previous studies, public facilities function at less than optimum standards and are often overcrowded. 24,28 One possible justification for the lower standards of the public centers is that the people in the upper educational quintile have expectations that are not met in the public sector.
One of our limitations in this study was nonprobable sampling in Tehran, the capital of Iran, so generalization to other people and settings should be conservative. However, it should be considered that CRCs are referral centers that provide a wide range of rehabilitation services to a broad population with disability.
Another limitation of the current study was with regard to the question about the monthly income and costs of the people with physical disability. The missing response rate was 60%. Therefore, we considered the other socioeconomic measurements.
Conclusion
There is no evidence of inequality in the overall responsiveness of all the studied comprehensive physical rehabilitation centers of Tehran. However, on differentiating the centers as public and private, inequality in responsiveness emerges. In private sector, the key factor is the economic situation, indicating that poorer people with disability have poorer experiences when they encounter the private rehabilitation centers of Tehran. In public sector, the main factor is years of education of the people with disability, illustrating that the legitimate expectations of the more educated people are not met by the public rehabilitation centers of Tehran. This study provides a clear message to fill the gaps, not only for the service providers in the rehabilitation centers of Tehran but also for the policymakers to provide the necessary infrastructure to improve responsiveness in both public and private rehabilitation centers.
Footnotes
Acknowledgments
The authors would like to thank and appreciate all the CRCs as well as the participants of this study. Also, the researchers would like to thank the University of Rehabilitation and Social Welfare for providing the ground for the implementation of this survey.
Declaration of Conflicting Interests
The author(s) declared no potential conflicts of interest with respect to the research, authorship, and/or publication of this article.
Funding
The author(s) received no financial support for the research, authorship, and/or publication of this article.