
Abstract
Career and technical education (CTE) teachers are unique because they often enter teaching with previous workplace experience in industry. In this paper, we link employment and earnings data from unemployment insurance records with data on staffing and certifications for incoming CTE teachers in Washington state to provide a descriptive look at CTE teachers’ entry into the profession. We find that previously employed CTE teachers see substantial pay increases, about $13,000 in annual earnings on average, upon first entering teaching. These increases were widely felt across prior industries but were particularly large for CTE teachers entering through traditional pathways and, among teachers entering through the state’s Business and Industry pathway, for CTE teachers coming from industries with lower average pay.
Keywords
While nearly 80% of recent completers of teacher preparation programs graduated from traditional programs run by colleges and universities (American Association of Colleges for Teacher Education, 2022), career and technical education (CTE) teachers are a unique subgroup of educators in that lateral transitions from positions in industry are seen as a valuable way to connect students with a CTE focus to teachers with prior workforce experience (e.g., Ansel et al., 2025; Blazar et al., 2024; Chen et al., 2023; Nguyen et al., 2023). Alternative routes into CTE teaching have been used in 30 states to make these types of industry connections easier (Bonsu et al., 2013), but there is only limited information about the extent to which CTE teachers are drawn from different industries and whether the opportunity costs associated with leaving positions in industry for teaching make it challenging to recruit CTE teachers through these pathways.
Prior evidence from Tennessee has found that teacher exits to industry are greatest in the “high-growth” technical fields, namely health services, IT, and STEM (Kistler et al., 2024). However, while recent empirical evidence on the broader teacher workforce suggests that the average new teacher earns considerably more after entering teaching than prior to entry (Goldhaber et al., 2024), there is currently no empirical evidence about the unique “front end” of the CTE teacher pipeline and, specifically, where CTE teachers held prior employment and the extent to which they are taking substantial pay cuts (or, alternatively, experiencing considerable earnings gains) by transitioning into CTE teaching.
In this paper, we extend the work of Kistler et al. (2024) to investigate the prior work experiences of CTE teachers in Washington State, both overall and by pathway into the profession and CTE program cluster. Washington, like many states, has a lateral entry to the CTE teaching pathway (the “Business and Industry Pathway”) designed to make it easier for individuals with relevant professional experience to enter CTE teaching laterally in lieu of obtaining a teaching credential through a traditional university-based teacher preparation program. We investigate the entry of individuals through this and the state’s traditional CTE licensure pathway using unemployment insurance data to link CTE teachers’ earnings as teachers to their pre-teaching professional experiences for different industry categories. This allows us to estimate changes in earnings when CTE teachers enter the profession and to characterize how the economic appeal of teaching might differ by industry.
Policy Context and Related Literature
The subjects of this paper, CTE teachers, are important to study for many reasons but particularly in light of recent findings that they have substantial impacts on subsequent student outcomes. For example, Chen et al. (2023) show that students in Massachusetts assigned to CTE teachers with better skills as measured by the state’s performance licensure test tend to have better long-term outcomes, all else equal. Likewise, Theobald et al. (2024) show that students in Washington assigned to CTE teachers from the state’s Business and Industry pathway (discussed below) tend to have better non-test outcomes in high school, all else being equal.
The setting for this study, Washington State, is notable for several reasons. First, the state requires students to complete at least one CTE credit during high school as a graduation requirement, so CTE participation rates in the state are high relative to other states (Goldring et al., 2021). And given the state’s large employers in technology (e.g., Amazon, Microsoft) and engineering (e.g., Boeing) and considerable agricultural economy, it is also not surprising to see that student participation in CTE courses naturally aligns with these industry areas. Specifically, the state has relatively high participation rates in industry groupings—“CTE clusters”—such as “Agriculture, Food, and Natural Resources” and “Science, Technology, Engineering, and Math” and relatively low participation rates in “Architecture and Construction,” “Human Services,” and “Transportation, Distribution, and Logistics.”
The other key piece of context noted above is that Washington State offers two distinct pathways to becoming a CTE teacher. The state has a traditional pathway to CTE certification, akin to requirements for other teaching fields, in which prospective CTE teachers must obtain a bachelor’s degree in teaching with a minimum of 45 quarter hours of study in a specific CTE specialty area. It also provides an alternative pathway that allows CTE teachers to enter the profession through a “Business and Industry” (B&I) pathway. The B&I pathway has no degree requirements but does require teachers to have at least 6,000 hours of relevant prior work experience and attend specific B&I CTE teacher training programs. This B&I pathway to certification is the more popular means of obtaining a CTE teaching credential (Theobald et al., 2024).
This study seeks to contribute to several strands of prior literature. First, in response to long-standing concerns about the competitiveness of teacher pay, several prior papers have sought to quantify the “teacher pay penalty,” i.e., the difference in earnings associated with becoming a teacher relative to “comparable” alternative occupations. While conclusions from early work largely depended on the extent to which researchers accounted for teachers’ summer months, with papers considering hourly wages finding little to no teacher pay penalty (Richwine & Biggs, 2011; West, 2014) and papers considering annual earnings finding penalties of 10% (Taylor, 2008) to 20% (Allegretto & Mishel, 2020), seminal work by Chingos and West (2012) and Feng (2014) leverages teacher exits from the workforce to quantify the opportunity costs of teaching more directly. These papers and recent findings from Brummet et al. (2024) suggest that the average former teacher earns no more, and sometimes less, than they earned as a public school teacher, but that the variance of post-teaching earnings is considerably larger than teaching earnings, which are typically very compressed.
This prior literature raises two important questions. The first is whether these trends hold for teacher entrants as well as exiters; i.e., do individuals entering teaching earn more or less than they made prior to entering the profession? And the second, previewed in the introduction above, is whether these trends hold for CTE teachers, who may have greater opportunity costs to teaching than other teachers given that (by definition) they are highly employable in other sectors of the economy. Two recent papers begin to address these questions. First, Goldhaber et al. (2024) link data on graduates of teacher education programs in Washington to unemployment insurance records in subsequent years. They find that individuals with teaching certificates earn considerably more, on average, in teaching positions than in other positions, and that the average individual in the sample experiences a substantial raise when entering teaching and a substantial decline in earnings upon exit.
Kistler et al. (2024) focus more narrowly on CTE teachers. Using unemployment insurance records in Tennessee, they find that CTE teachers with occupational licenses (comparable to B&I) leave teaching at higher rates than non-CTE teachers, especially in high-growth sectors (IT, STEM, health services). And in contrast with the prior evidence on all public school teachers discussed above, they find that the average exiting CTE teacher earns more in industry upon leaving than they did teaching, especially in high-growth sectors. These findings are consistent with predictions of economic theory; i.e., those with more financially attractive alternatives will be more likely to leave teaching.
This paper seeks to build on the Goldhaber et al. (2024) and Kistler et al. (2024) work by investigating three novel research questions:
What are the prior employment experiences of new CTE teachers in terms of employment rates and industries of employment?
For CTE teachers with prior employment experiences, how does their pay in industry compare to their earnings as teachers?
How do these trends vary across CTE licensure pathways (i.e., B&I relative to traditionally prepared CTE teachers)?
To our knowledge, our investigations of research questions 1 and 2 provide the first statewide empirical evidence about the prior employment experiences of CTE teachers. That said, the most important question for policy purposes is likely RQ3—and specifically, our focus on the prior employment experiences of CTE teachers from the B&I pathway—because while we might expect all CTE teachers to be more likely to come from industry, the existence of the B&I pathway in Washington changes this expectation into a requirement. Therefore, our investigation of the extent to which these teachers are financially impacted by their transition into teaching can provide evidence that may generalize to similar pathways in other states (Bonsu et al., 2013).
Method
Data
Our data for this study come from two sources. The first is Washington’s Office of Superintendent of Public Instruction (OSPI), which maintains data on all students and employed staff in Washington public schools. From OSPI, we use a combination of publicly available data on personnel staffing (known as the S-275) and confidential data (covered by a data sharing agreement with OSPI) on individual teachers’ credentials and endorsements. The staffing data include information on whether an individual was employed in a Washington K–12 school district (as a teacher or other type of personnel) and the course(s) teachers taught each school year, including whether it was a CTE course and the CTE cluster (discussed in more detail below) it falls under. The OSPI data allow us to deduce the pathway through which each teacher entered the profession in Washington (i.e., traditional university or B&I) because each pathway has distinct credentialing requirements. These data also indicate whether a teacher has earned a CTE endorsement. Our OSPI data cover all individuals who taught in Washington public high schools from 2010–2011 through the 2018–2019 school year (denoted going forward as 2011–2019). Our second source is Washington’s Education Research and Data Center (ERDC) which provides data on unemployment insurance (UI) records. 1 The teacher personnel staffing and UI records can be linked at the individual level through unique educator IDs for all individuals.
The linked data span the period from 2010 through 2023 and contain information on quarterly employment (at the employer level), including industry, wages earned, and hours worked. An important limitation of UI records is that they only reflect employment where the employer is contributing to unemployment insurance; labor income earned off the books or through contingent (e.g., 1099 or gig work) or contract work is therefore not captured in our data. The UI records also only capture employed individuals, not those who are unemployed and receiving UI benefits.
The UI records indicate the North American Industry Classification System (NAICS) code(s) of the industry or industries in which individuals were employed. We assign each teacher with pre-service UI data to a prior industry of employment based on where they worked most recently in the observable years prior to their transition to teaching. We then map these industries to CTE clusters and meta clusters using the National Career Clusters Framework 2 to arrive at a set of eight CTE meta clusters in which teachers might previously have been employed: Agriculture, Energy, and Natural Resources; Arts, Design, and Hospitality; Construction, Manufacturing, and Transportation; Digital Technology, Management, and Marketing; Education; Financial Services; Healthcare, Human Services, and Public Service; and Uncategorized. One inherent limitation to these data is that the NAICS code in the UI records describes the industry of the employer, rather than the job that the teacher themselves held. In many cases, this distinction is meaningful. For example, a computer programmer or IT professional working at a hospital would be assigned to the Healthcare cluster, even though their role was in Digital Technology. Similarly, someone might work at a call center for a financial services firm and be assigned to the Financial Services industry, even if that does not accurately describe their skills and experiences.
To describe the CTE clusters in which in-service teachers teach once they begin teaching, we use these same eight meta clusters listed above. Specifically, we use the courses taught by teachers to identify the cluster(s) in which teachers first taught and then aggregate them to the meta cluster level. In the small number of cases 3 in which teachers teach courses that fall into multiple CTE clusters across multiple meta clusters, we assign them to the modal meta cluster in their first year in the classroom.
We examine several measures to describe teachers’ pre-service employment experiences: a binary annual measure of employment (i.e., unemployed or employed), yearly earnings from wages across all employers, and yearly hours worked across all employers. We also examine individuals’ effective wage rate, calculated as total annual earnings divided by annual hours worked. For all measures, we define a year as the period between July 1 and June 30 (so, for example, 2019 would refer to the period from July 1, 2018, to June 30, 2019) so that annual employment measures align with the K–12 school year. All dollar measures are adjusted for inflation and reflect dollar equivalent values from 2011.
Finally, one issue with our analysis is that the observed prior earnings of CTE teachers are endogenous to their decision to move into the teaching workforce (i.e., we might expect individuals with lower earnings to be more interested in making this career switch), and we do not have access to the statewide UI data, only UI data for individuals linked to the CTE teacher data described above. To address the question of whether CTE teachers tend to come from higher- or lower-paying industries, we therefore supplement this individual-level linked data with publicly available data from the Bureau of Labor Statistics (BLS) on occupations and wages in Washington State from 2011 through 2019. 4 We use two versions of these BLS data, one at the state level and one at the metropolitan statistical area (MSA) level, which we link to the individual teacher-level data using the county of teachers’ pre-service employment according to their UI records. We specifically use data on average yearly and hourly earnings by occupation and the number of jobs in a given occupation per 1,000 people in the geographic region (i.e., state or MSA). We then map the BLS occupation codes to the CTE clusters defined in the National Career Clusters Framework so that we can link these average industry measures to individuals’ pre-service employment industry clusters.
Samples and Summary Statistics
Using our linked data, we construct three analytic samples based on the year that an individual began teaching and the availability of UI data prior to that year. The first sample is restricted to individuals who began teaching as CTE teachers in 2011–2019 and who appear in the UI data at least once in pre-service years (n = 1,634). Because we can plausibly observe at least 1 year of employment data prior to teaching (i.e., 2010), we refer to this sample as our “1-year sample.” Given that 2010 is the earliest year in our data, it is possible that this sample of individuals who appear to be new CTE teachers in fact taught for a period of time prior to 2010, or taught in a different state and only entered the Washington teacher workforce in 2011–2019, though evidence suggests that this type of switching between states among teachers is relatively rare (Goldhaber et al., 2015). We further define CTE teachers in this context as those who had a CTE endorsement in their starting year and who taught a CTE course at some point in our window of observation (excluding pre-service classroom experience).
The second sample is our “3-year sample,” comprising CTE teachers for whom we can plausibly observe at least 3 years of employment data prior to teaching. Put differently, our “3-year sample” is a subset of the “1-year sample” that is further restricted to those teachers who began teaching in 2013 or later (n = 1,144). Similarly, our “5-year sample” is a subset of the “3-year sample” and is further restricted to teachers who started in 2015 or later (n = 759).
For each of our analytic samples, we determine teachers’ prior industry meta cluster based on their employment in the pre-service reference year. For example, in the 3-year sample, we assign teachers to the industry in which we observe them 3 years prior to their transition to teaching; if we observe them in multiple industries in that year, we assign them to the one with the most hours worked. Not included in any of these analytic samples are new CTE teachers (who began teaching between 2011 and 2019) for whom we do not observe any pre-service UI data records (n = 314). These excluded teachers may have previously worked as contingent workers, independent contractors, and/or been self-employed; may have worked off the books; may have worked in a different state; or simply may not have been previously employed at all.
Table 1 presents descriptive statistics of the teachers in the 3-year analytic sample, which we privilege as the primary analytic sample for simplicity. 5 Specifically, we show mean employment outcomes and teacher characteristics in the first year of teaching, as well as employment outcomes one year before teachers’ transition to teaching. Our requirement of observable pre-service UI data results in a relatively high employment rate in the year immediately prior to transition (92%). Average earnings were substantially higher in the first year of teaching relative to the year before, both in terms of total earnings ($42,719 versus $30,464) and effective wage rate ($28.89 versus $23.62). We explore this general finding in more depth in the next section.
Descriptive statistics for 3-year analytic sample
Note. Teachers with no pre-service data include CTE teachers who began teaching between 2011 and 2019 whom we do not observe in the UI data at any point prior to teaching. These teachers are excluded from our 1-year, 3-year, and 5-year analytic samples. CTE certification and pathway shown reflect teachers’ recorded certification and pathway status in their first year of teaching.
Analytic Approach
To answer Research Question 1, we summarize CTE teachers’ average employment rate, total earnings, and effective wage rates in the first year of teaching and in the years immediately prior to transition into teaching. We do so overall and separately by the prior industry cluster in which teachers were employed. As noted above, we focus on findings from the 3-year analytic sample, though results for the 1-year and 5-year analytic samples, which serve as robustness checks and are ultimately similar, can be found in Supplemental Table A2.
In addition to examining teachers’ employment and earnings measures, we also summarize the pathway through which CTE teachers enter teaching and the CTE cluster that they ultimately teach courses in, broken out by prior industry cluster. Doing so helps us to understand whether teachers with certain industry backgrounds are more prone to go through the traditional versus alternative (i.e., B&I) certification pathways and whether certain CTE clusters are more likely to have alignment between industry experience and course subject.
To answer Research Question 2, we compare CTE teachers’ pay in industry pre-service to their earnings when they first become teachers. First, we look at the unadjusted distributions of total earnings and of effective wage rates in the years leading up to and including teachers’ transition into the profession, overall and broken out by teachers’ prior industry cluster. Again, for simplicity, we focus on results for the 3-year analytic sample.
To estimate changes in earnings associated with the transition to teaching using a regression framework, we estimate the following model using panel data where each observation is at the teacher-year level:
In (1),
We also run versions of the model that include the terms
Lastly, to answer Research Question 3, we conduct the same analyses that we do for RQ2 but do so for the subsample of teachers who go through the traditional university pathway and, separately, for the subsample who go through the B&I pathway.
Results
RQ1. What Are the Prior Employment Experiences of New CTE Teachers in Terms of Employment Rates and Industries of Employment?
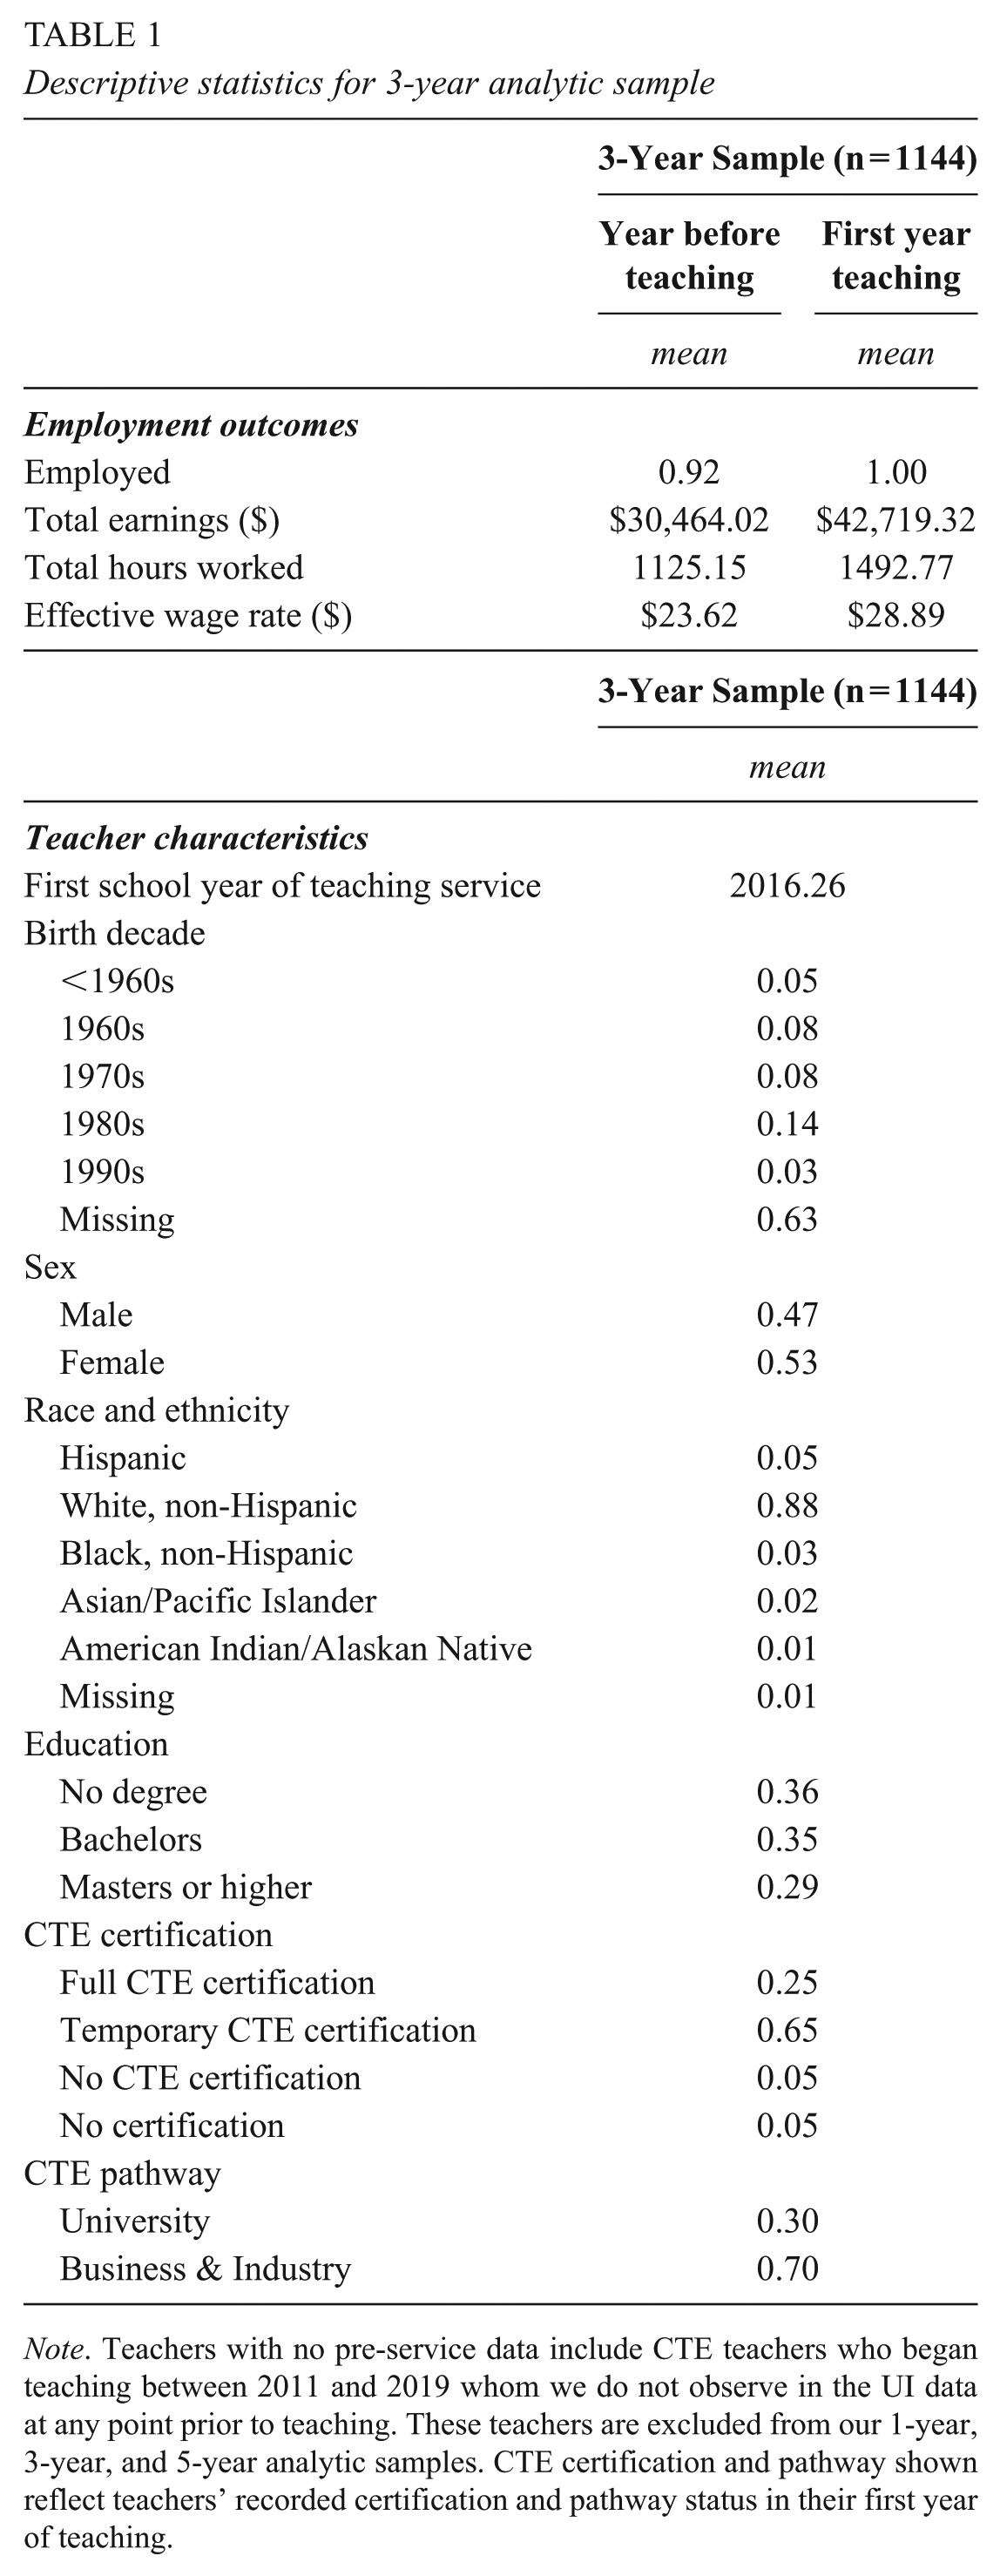
To describe the prior employment experiences of new CTE teachers, we first examine the full sample of teachers who started teaching with a CTE endorsement between 2011 and 2019, regardless of whether they appear in pre-service years in the UI data. Their overall employment rate in the 3 years leading up to their transition to teaching is shown in Figure 1, where we assume that teachers are unemployed in years that they do not have earnings data from UI records. Three years prior to starting teaching, 54% of teachers were employed; this rate steadily increased with each year before individuals became teachers. Given that teachers without earnings data may be employed in another state, self-employed, or employed off the books, this trend can be considered a lower bound on teachers’ pre-service employment rates.
Pre-service Employment Rate for All CTE Teachers Starting 2011–2019
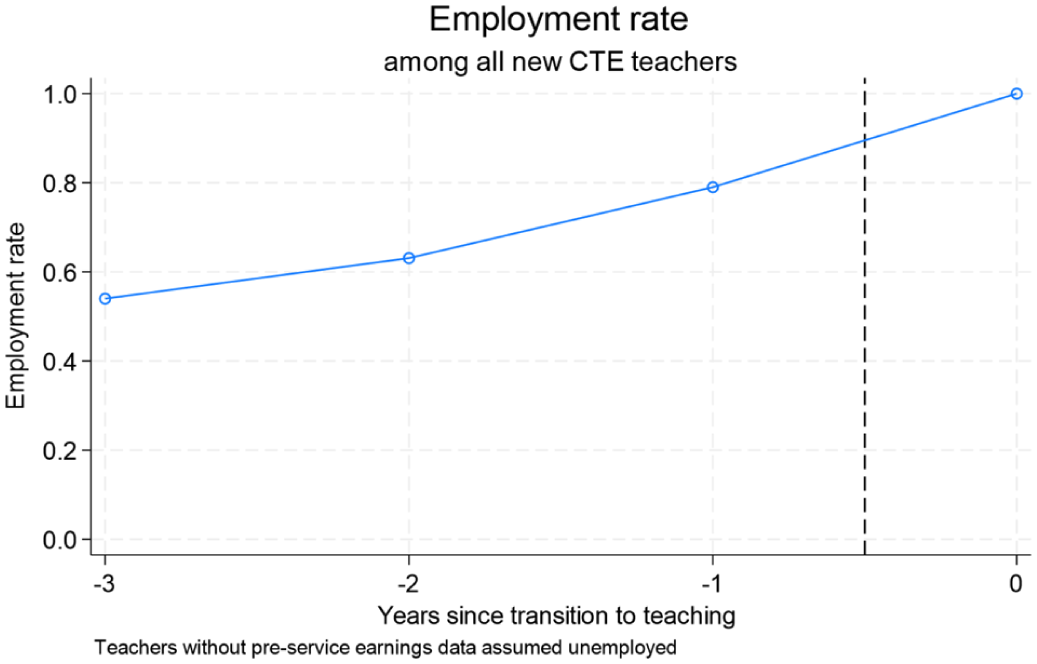
We turn next to our analytic sample of teachers for whom we have at least 1 year of pre-service earnings data (because we cannot observe earnings outside of Washington’s UI system); for simplicity, we focus on the 3-year sample. Comparable to Figure 1, Figure 2 plots this sample’s employment rate in the 3 years leading up to transition into teaching, overall (panel A) and by prior industry cluster (panel B). As described earlier, the analytic sample requirement of having earnings data in at least 1 pre-service year results in a dramatically higher average employment rate among included teachers—91% were employed 3 years prior to teaching. Even with such high overall employment, however, we can observe some variation in the pre-service years across prior industry clusters. For example, employment appears to be less stable in certain clusters (e.g. Agriculture; Arts, Entertainment, and Design; Construction; Digital Technology; Marketing and Sales; Supply Chain and Transportation) where employment rates decrease at points leading up to the first year of teaching. However, these clusters have relatively small numbers of future CTE teachers (n < 60), making observed trends in employment particularly vulnerable to noise.
Pre-service Employment Rate for CTE Teachers in the 3-Year Analytic Sample. (A) Overall. (B) By Prior Industry
The largest pre-service industry cluster by far is Education (n = 445, or 39% of the 3-year sample), for which employment rates are consistently high and stable. To some extent, the large proportion of pre-service teachers employed in the education sector is unsurprising. As we can see from their future choices, these are individuals who are interested in becoming educators, may be in the process of earning education-related degrees and/or certifications to support their entry into the profession, and/or may have been introduced to the field through their prior employment. However, it raises the question of whether their prior employment in the education field was in the Washington K–12 public school system itself or with other types of organizations classified as educational based on their NAICS code. Additionally, how common was pre-service employment with Washington public schools, and was it limited to those from the education industry or did pre-service teachers from other fields also work in some capacity with the school system?
To answer these questions, we plot employment rates specifically in the Washington K–12 public school system for teachers in the 3 years leading up to and including their transition to teaching, shown in Figure 3. Our indicator for employment in the school system is sourced from OSPI data, rather than from UI records. We separate out employment as a teacher and employment in any other role in the school system. Employment rates in “other K–12” roles are greatest among individuals from the Education industry cluster, and we observe that their employment rates increased over time as they approached their transition into teaching. Interestingly, however, pre-service teachers from other industries—such as Financial Services, Healthcare and Human Services, and Hospitality, Events and Tourism—also were employed to a lesser degree by the K–12 system in the years leading up to starting teaching. Though we cannot know with certainty what their employment situations were, it is possible that they were working part time in K–12 schools as a way to learn about or familiarize themselves with the education field or to earn credits toward an eventual teacher certification.
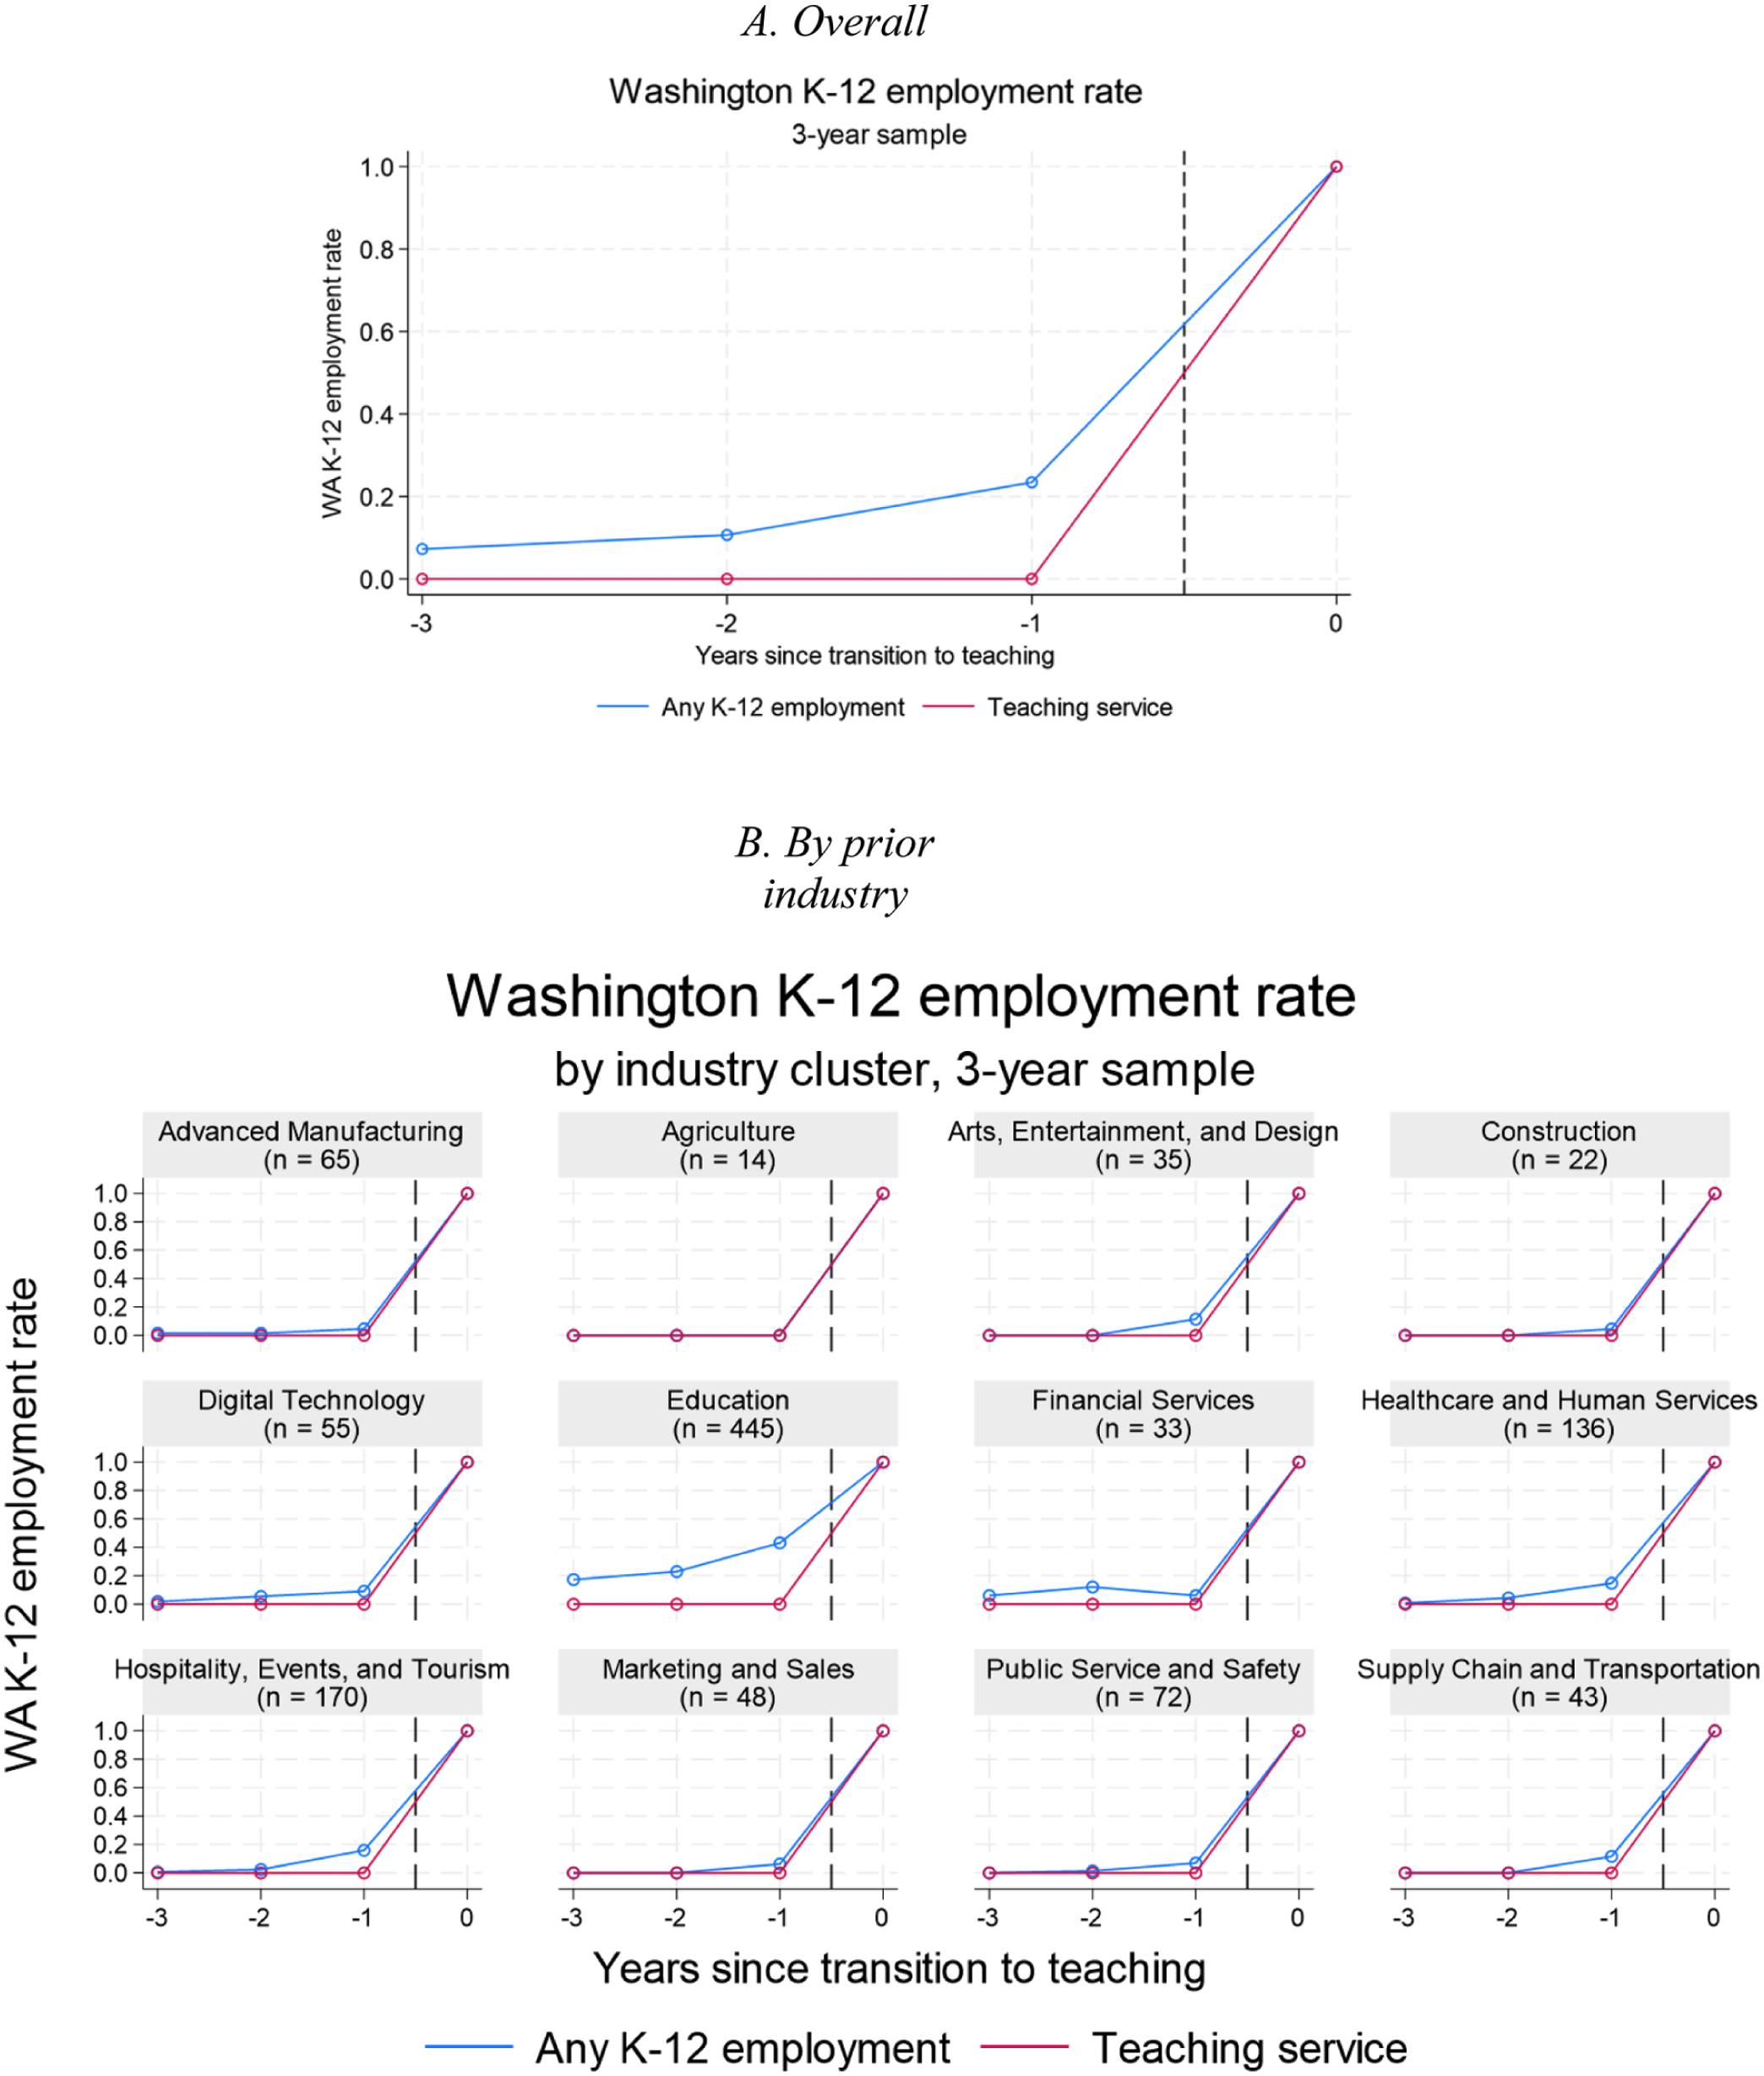
Pre-service Employment in Washington K–12 School System. (A) Overall. (B) By Prior Industry
We next examine how the certification pathways used to enter teaching vary by prior industry of employment. Supplemental Figure A1 shows the flow of teachers from pre-service industry cluster into either the traditional university pathway or the B&I pathway. In addition to the teachers in the 3-year sample, this figure also includes teachers who started teaching in the same time window as the 3-year sample but had no pre-service earnings data; these teachers are categorized as “not yet in the workforce.” One obvious takeaway is that the number of CTE teachers using the B&I pathway is approximately twice as large as the number using the university pathway. While the exact proportion of teachers using each pathway varies across prior industry cluster, there are some teachers from each cluster who enter through each pathway. As mentioned earlier, a considerable percentage (66% for this sample) of teachers categorized as “not yet in the workforce” (i.e., without prior UI records) enter the teaching profession through the B&I pathway, suggesting that these teachers had unobservable work experience prior to teaching or had unpaid work experience that they were able to put toward their B&I certification. 6
Also of potential interest is the alignment between CTE teachers’ prior industry and the CTE cluster in which they go on to teach. Unfortunately, our inability to observe the industry of teachers’ prior jobs, as noted above, limits our ability to analyze the alignment between teachers’ actual work experience and their teaching cluster. Instead, we can only summarize alignment between CTE teachers’ prior industry of employment and the CTE cluster in which they teach, which we show in the Supplemental Material. Specifically, Supplemental Figure A2 shows the flow from pre-service industry meta cluster of employment to in-service CTE cluster taught for teachers who used the university pathway (panel A) and the B&I pathway (panel B). The teachers included in the sample shown are the same as those for Supplemental Figure A1. To the extent that teachers’ prior industry of employment is indicative of knowledge and skills relevant to that industry, it is notable that there is considerable misalignment between pre-service and teaching CTE clusters. In fact, the most popular CTE clusters taught by teachers in each pathway—Digital Technology, Management, and Marketing; and Healthcare, Human Services and Public Service—correspond to relatively small pre-service industry clusters. That said, we do observe greater alignment for teachers in the B&I pathway (0.28 of teachers teach in the same industry cluster as their prior employment, compared to 0.19 in the traditional pathway), consistent with the intent of that pathway to allow industry professionals to apply their experience to classroom instruction, though these results are only speculative given the limitations of our data.
RQ2. For CTE Teachers with Prior Employment Experiences, How Does Their Pay in Industry Compare to Their Earnings as Teachers?
To understand how CTE teachers’ earnings when starting to teach compare to their pre-teaching earnings, we first examine unadjusted average employment outcomes. Table 2 shows the mean total earnings and effective wage rate for CTE teachers in the 3-year sample in the first year of teaching, 1 year prior to teaching, and 3 years prior to teaching for each pre-service industry cluster. Table 2 also includes the statewide industry average earnings and wages calculated from the statewide BLS data (averaged across 2013–2019) that we use in subsequent regressions exploring heterogeneity in earnings by prior industry of employment; the highest-paying industries in Washington are Digital Technology and Energy and Natural Resources, while the lowest-paying are Hospitality, Events, and Tourism and Advanced Manufacturing.
Mean Earnings by Prior Industry Among CTE Teachers in Analytic Sample

Note. All dollar amounts shown in 2011 dollars.
Overall, total earnings jumped dramatically between the year prior to teaching and the first year of teaching, on average across industries by about $15,000 (from roughly $28,000 to $43,000). And this large increase is not merely an artifact of working additional hours as a teacher, as the average wage rate increased from $23.62 to $28.89. While there is some variation across pre-industry clusters, the pattern of increased earnings and wages is consistent.
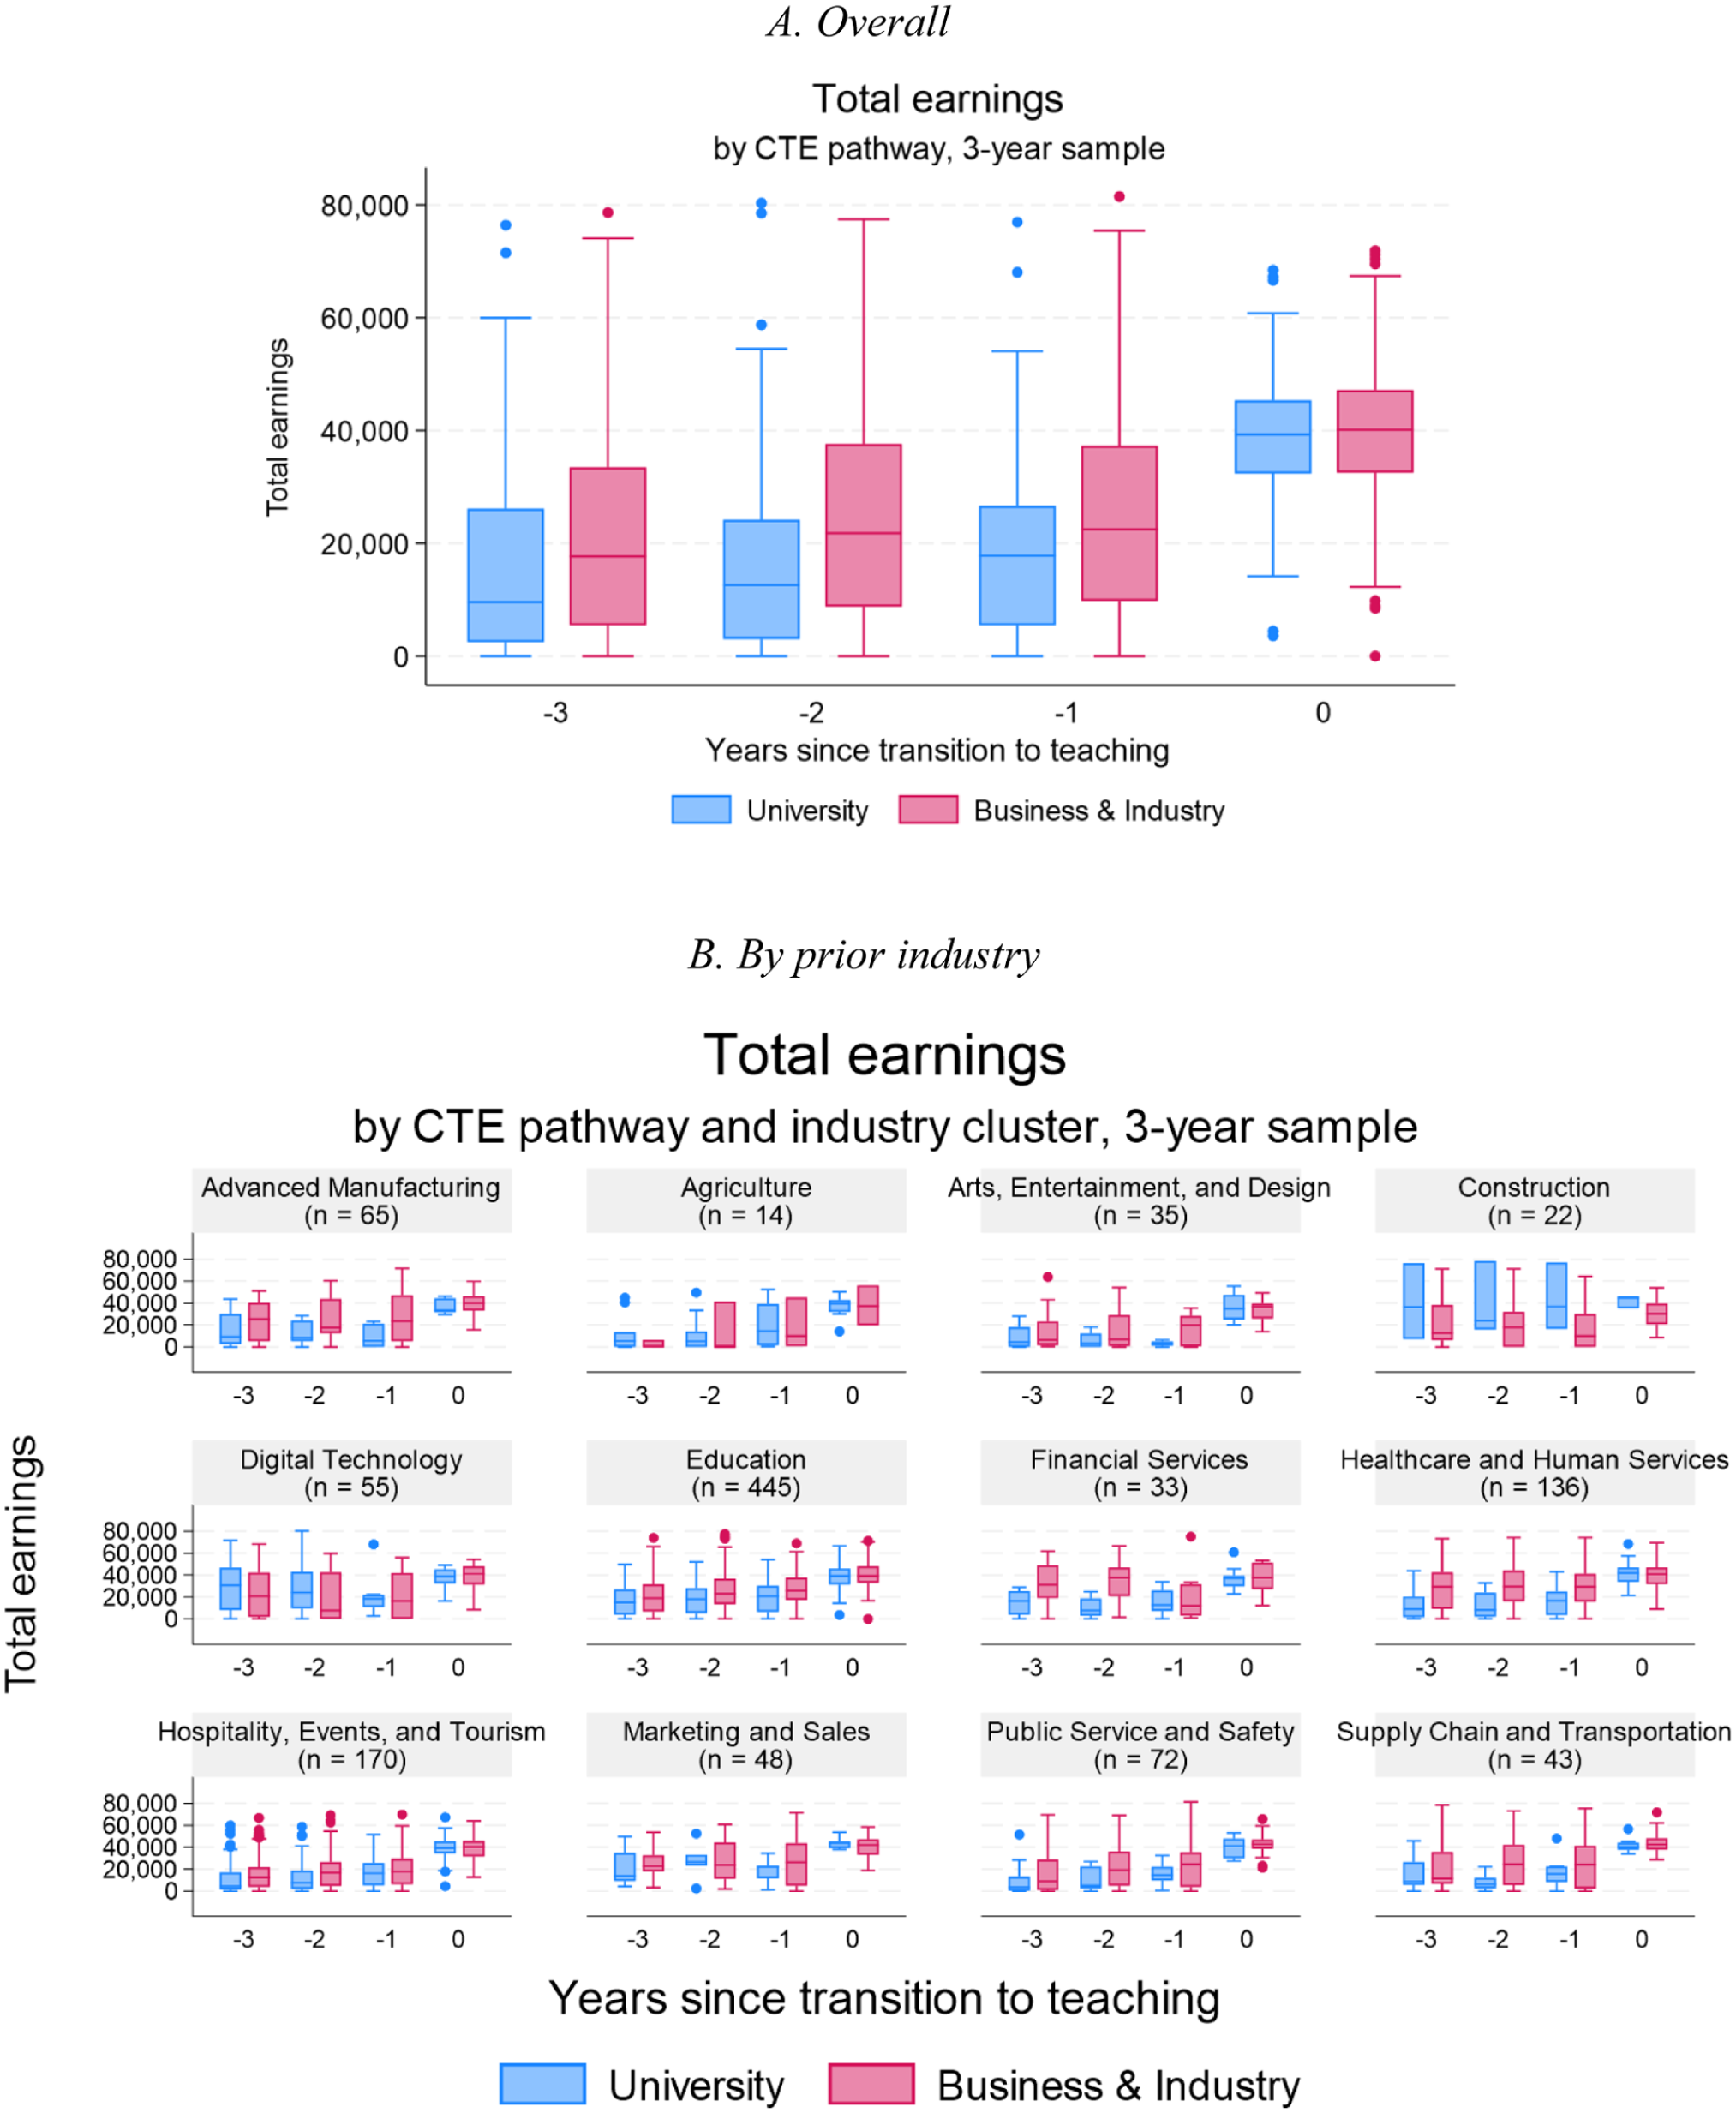
As we show in Figure 4, which illustrates with box plots the distribution of total earnings from the first year of teaching and the 3 years leading up to it, overall (panel A) and by prior industry (panel B), teachers from every industry saw a sizable increase in their total earnings when they began teaching, and nearly every industry received an increase in effective wage rate as well. Consistent with the mean values shown in Table 2, the median total earnings jumps considerably from pre-service years to the first year of teaching. The distribution in total earnings also becomes notably tighter in the first year of teaching—demonstrating the relative consistency in teacher salaries compared to pre-service industry jobs—but even the 75th percentile of pre-service earnings (the upper edge of the box) falls below the median earnings in the first year of teaching for the sample overall. When we look at these yearly distributions separately by industry, there is certainly variation in the distribution of earnings in pre-service years, but the general findings remain consistently true. CTE teachers from all industries increased their earnings substantially—in many cases, approximately doubling their median pre-service earnings—when they entered the teaching profession. 7
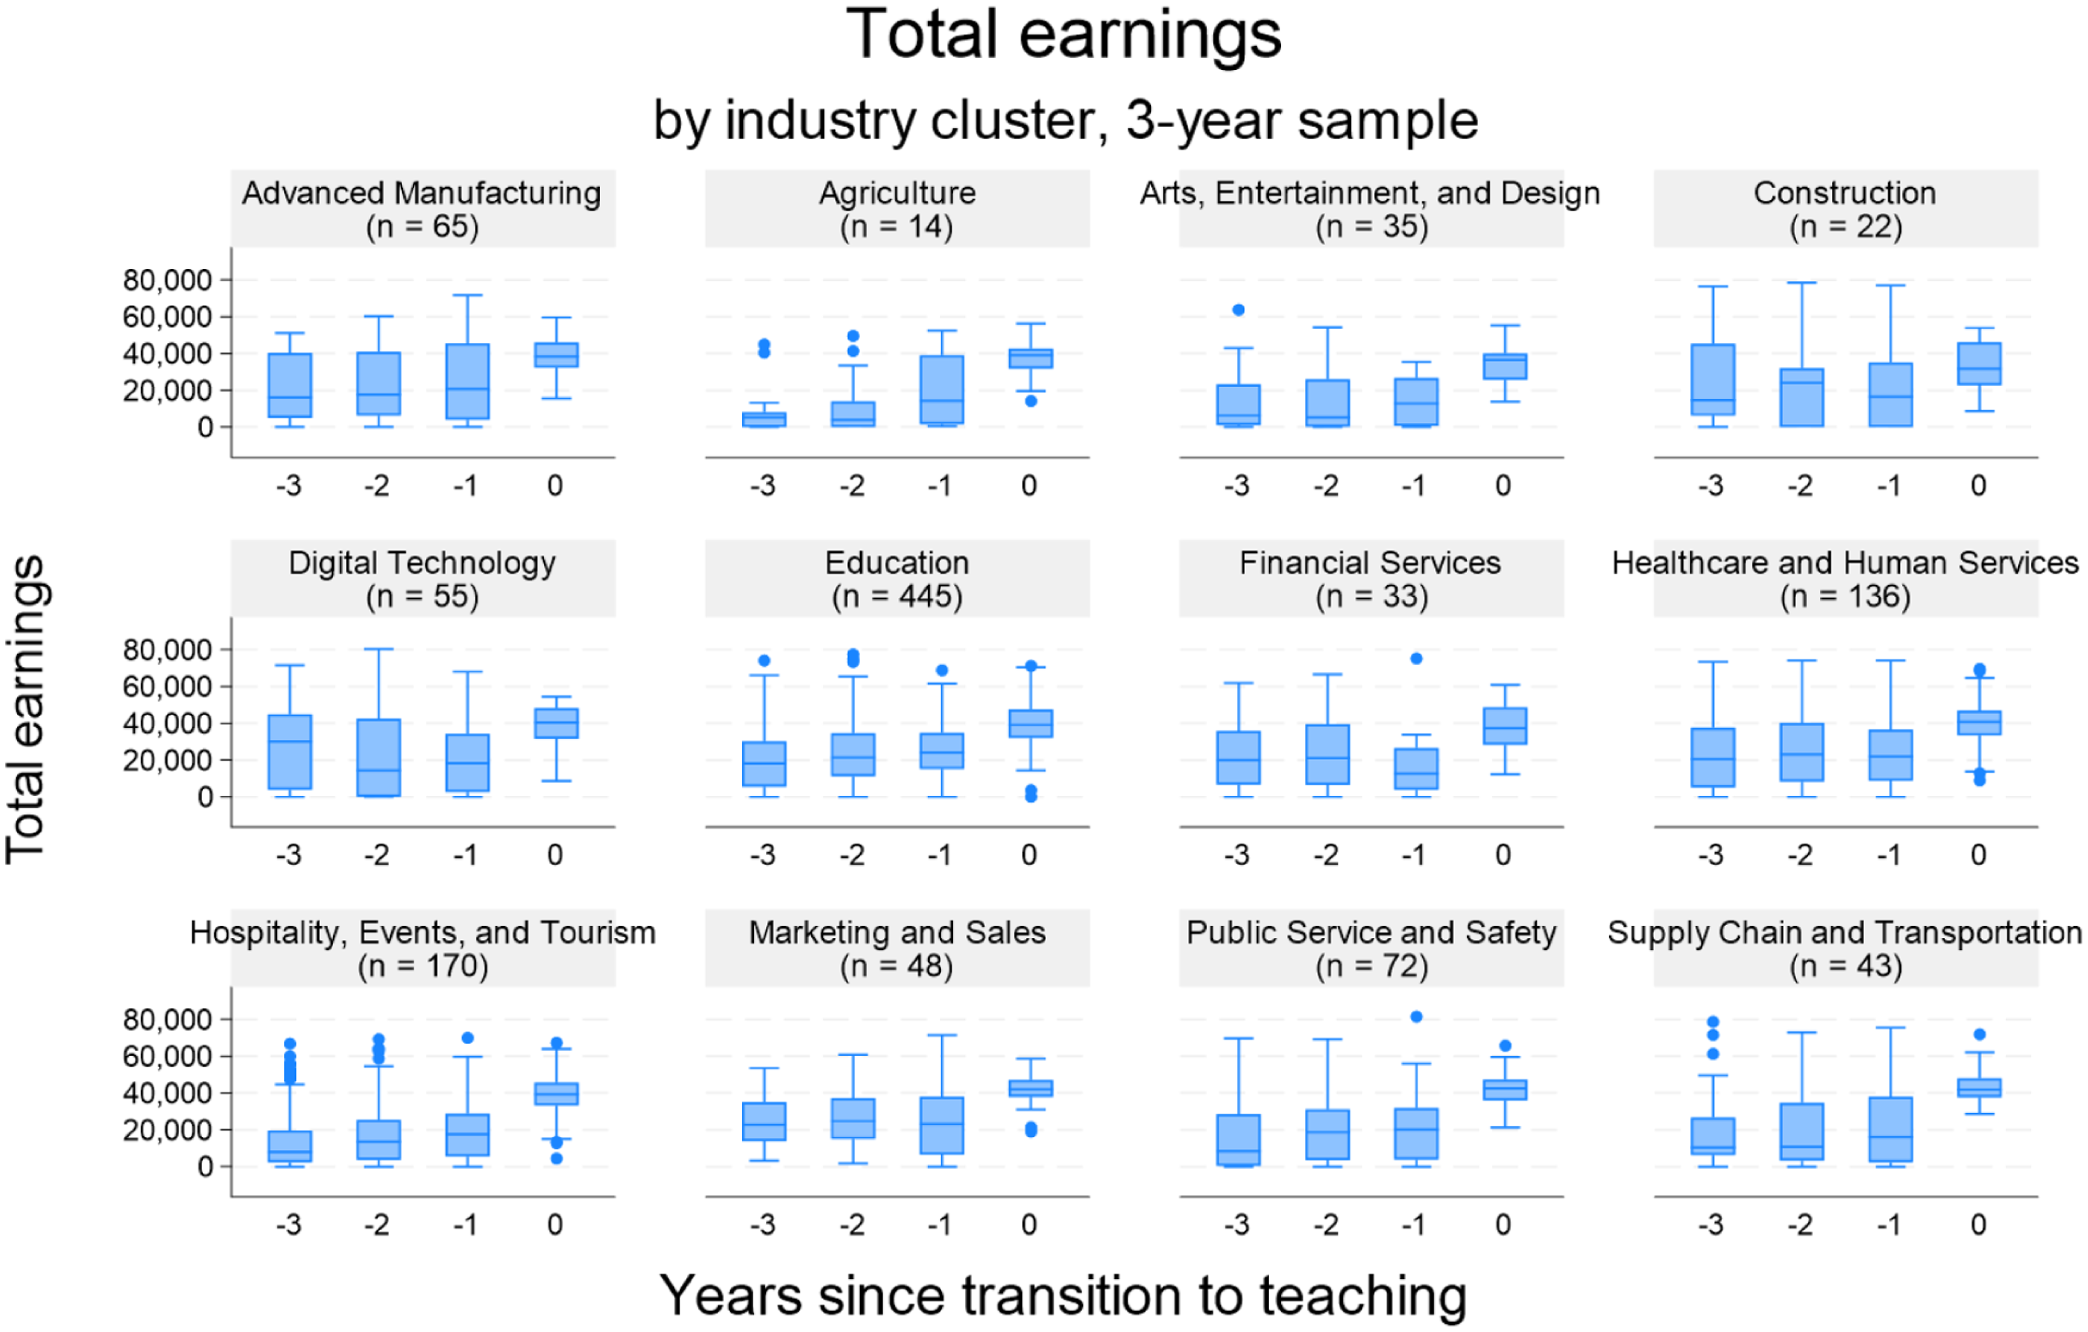
Distribution of Total Earnings in Years Leading up to Transition to Teaching, by Prior Industry
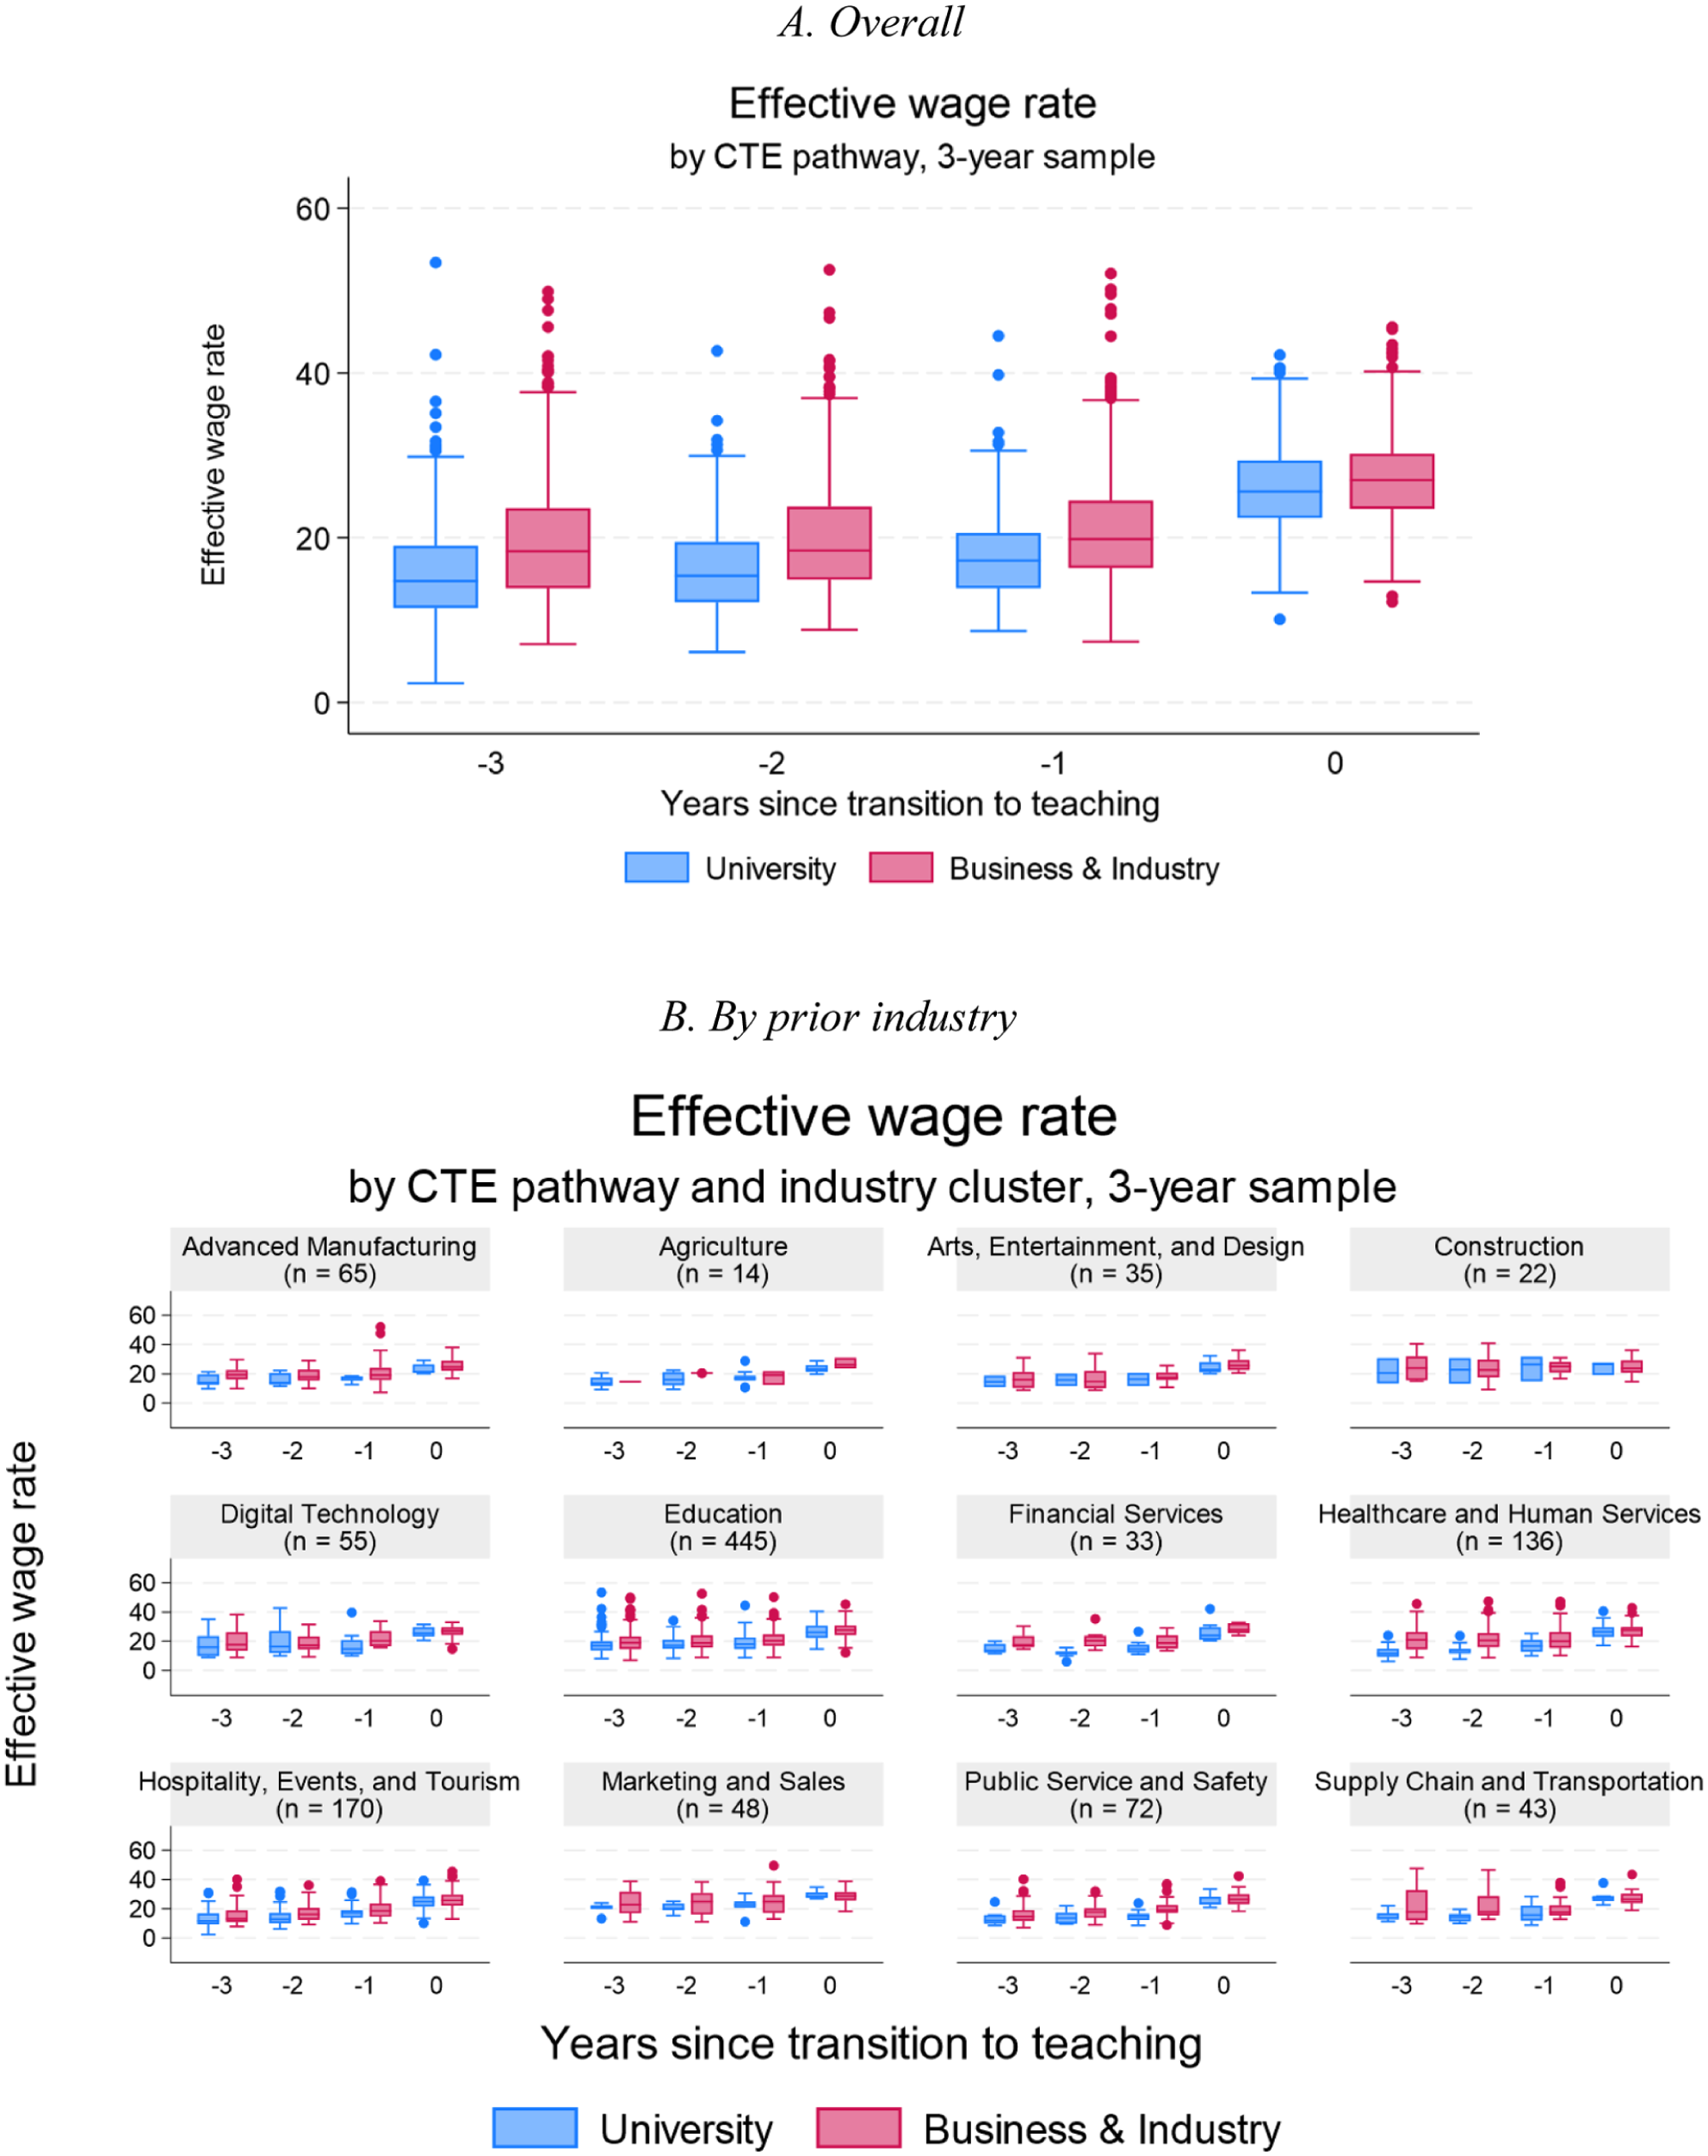
Figure 5 is comparable to Figure 4 but instead plots the yearly distributions of effective wage rate for teachers in the 3-year sample, overall and by prior industry. Again, our findings are broadly consistent with what we observe from the mean values shown in Table 2; the median wage rate increased from pre-service years to the first year of teaching, overall and in every prior industry with the exception of Construction.
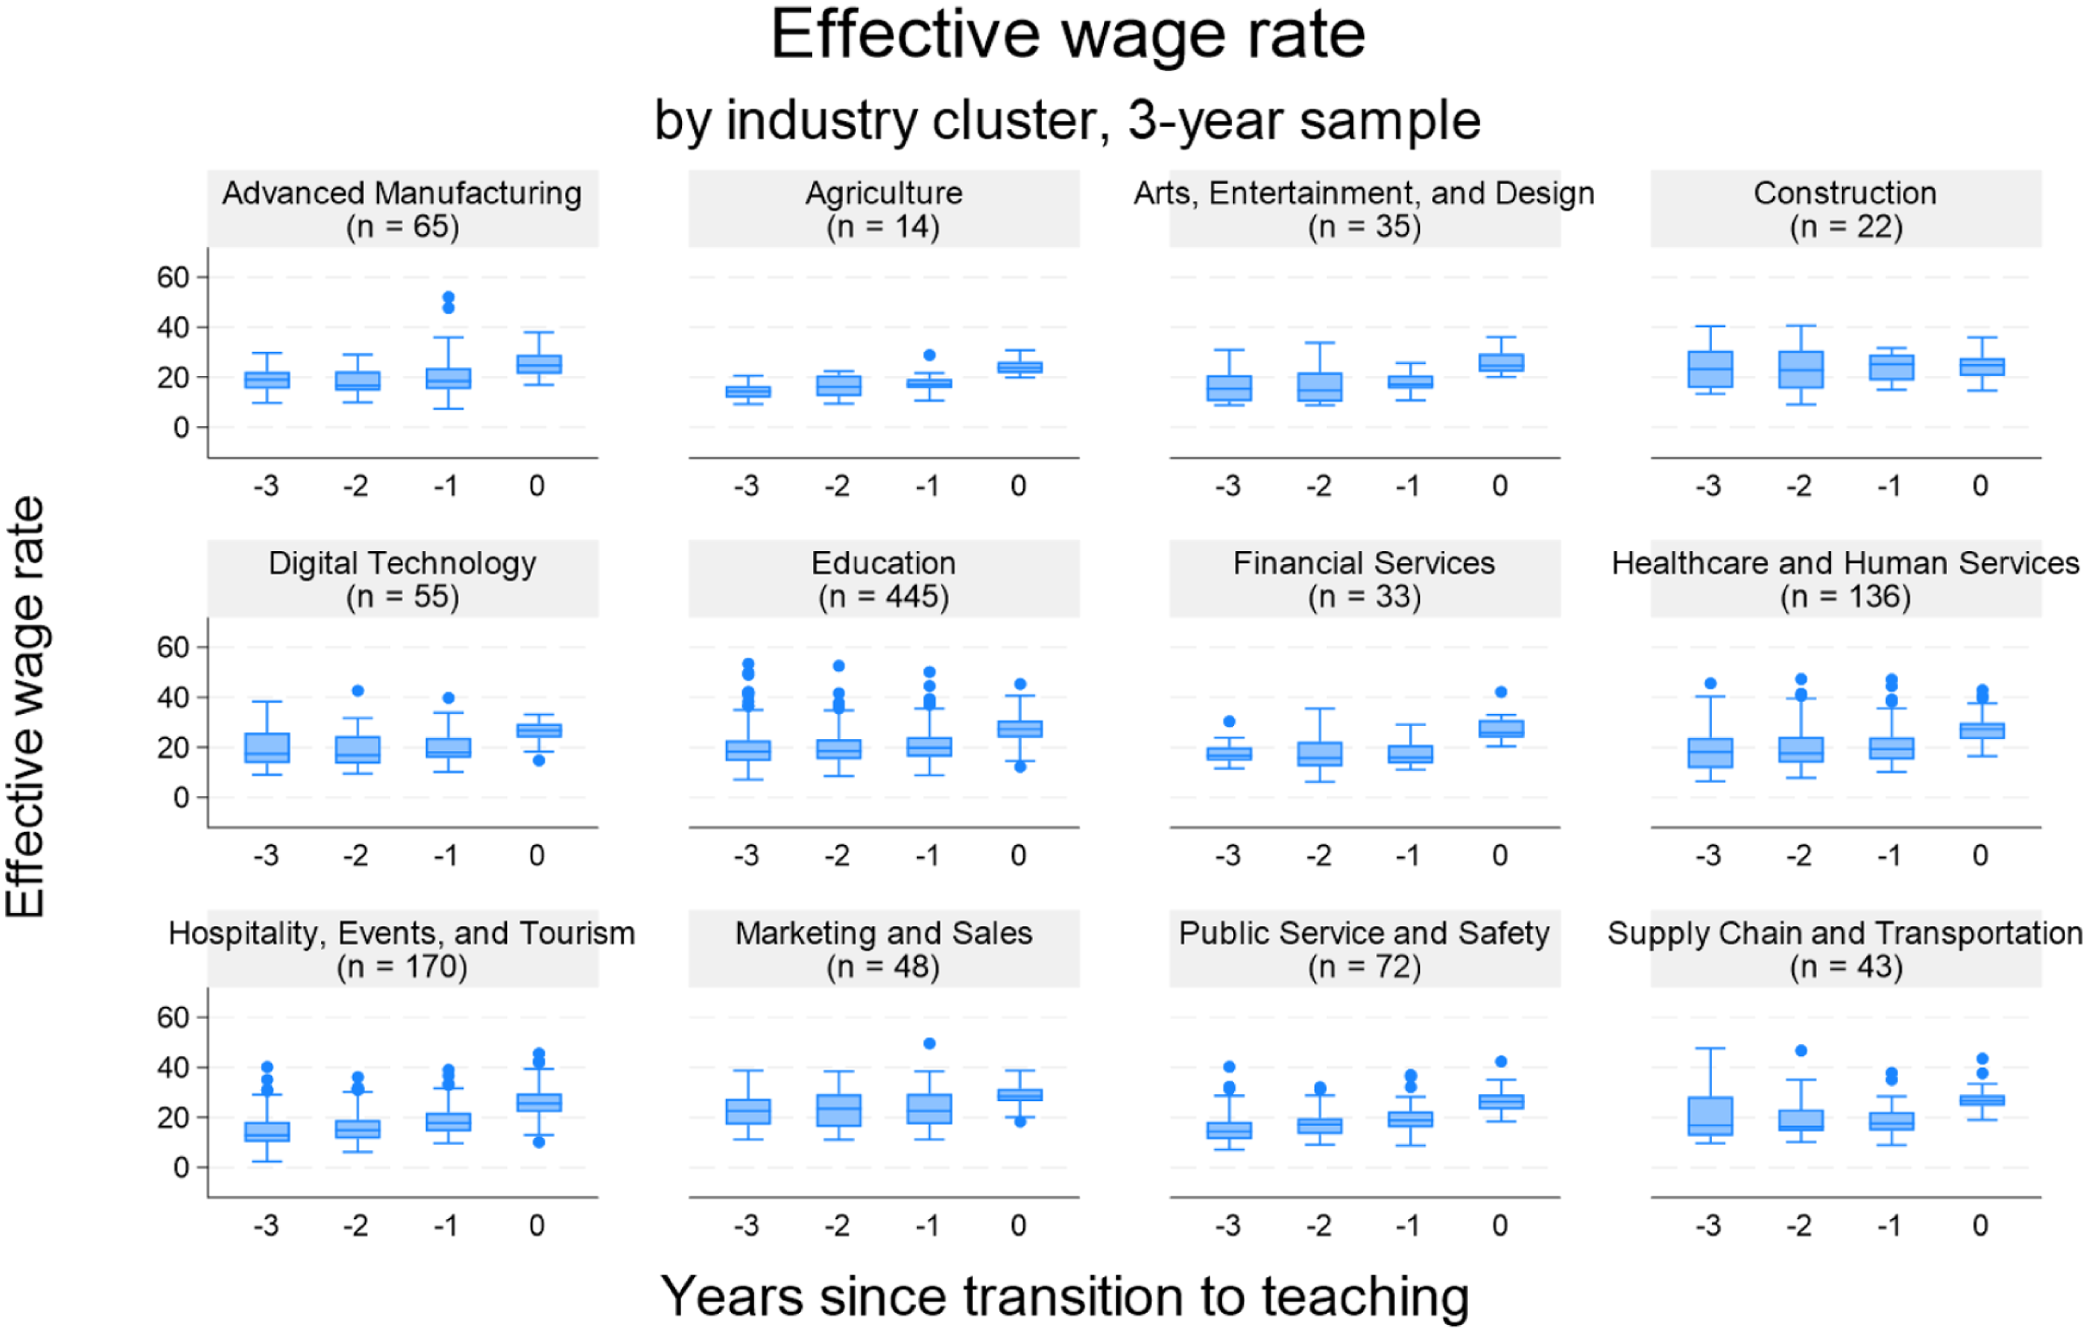
Distribution of Effective Wage Rate in Years Leading up to Transition to Teaching, by Prior Industry
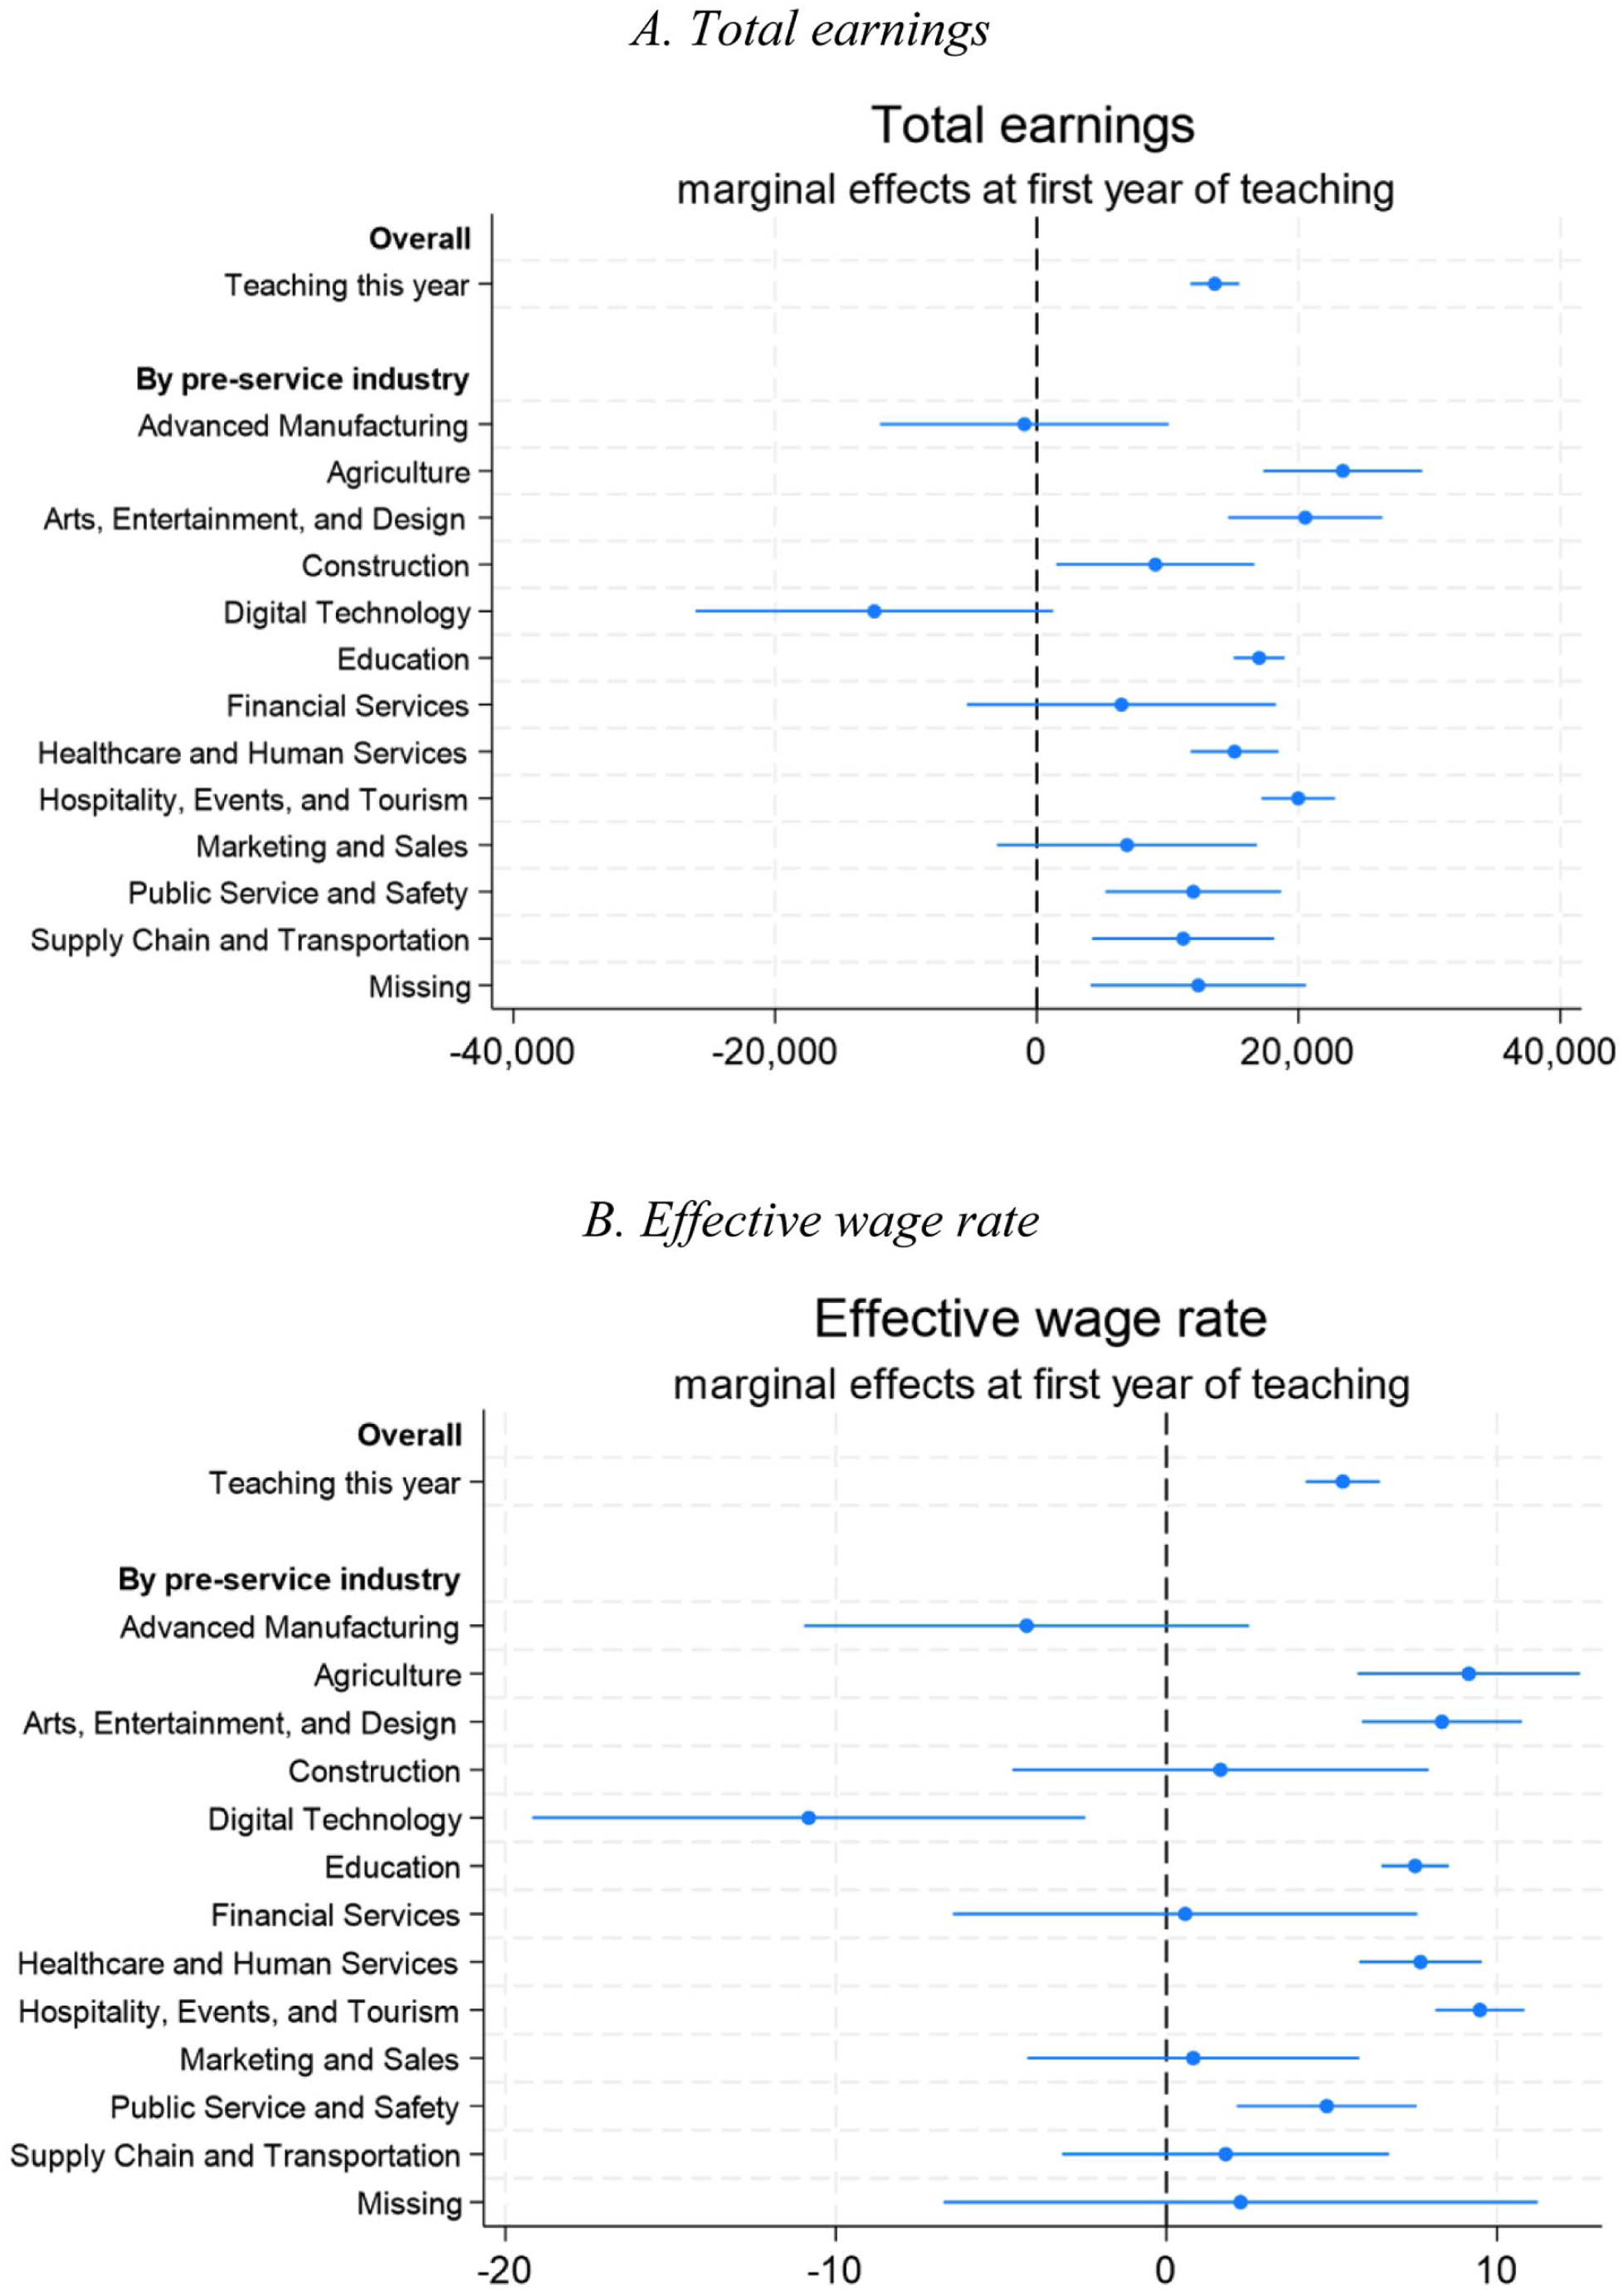
To further explore patterns of changed compensation as individuals transition into teaching, we next estimate the change in CTE teachers’ earnings and wages when they enter teaching using regression models. Table 3 presents the results of these models, the first set of which uses earnings as the outcome (columns 1–4) and the second set of which uses effective wage rate as the outcome (columns 5–8). Each set of specifications is structured as follows: We first estimate models that control for teacher characteristics, 8 then add district fixed effects so teachers are compared to other teachers within the same district, and then replace these teacher characteristics and district fixed effects with teacher fixed effects (our preferred specification) in which teachers are compared to themselves over time. Finally, while we show interactions with specific prior industries graphically in Figure 6, we also add one final specification to Table 3 that interacts the teaching transition variable with the average prior earnings within the teacher’s prior industry of employment.
Estimated Changes in Earnings and Wages upon Transition into Teaching, 3-Year Sample (Start Teaching ≥ 2013)
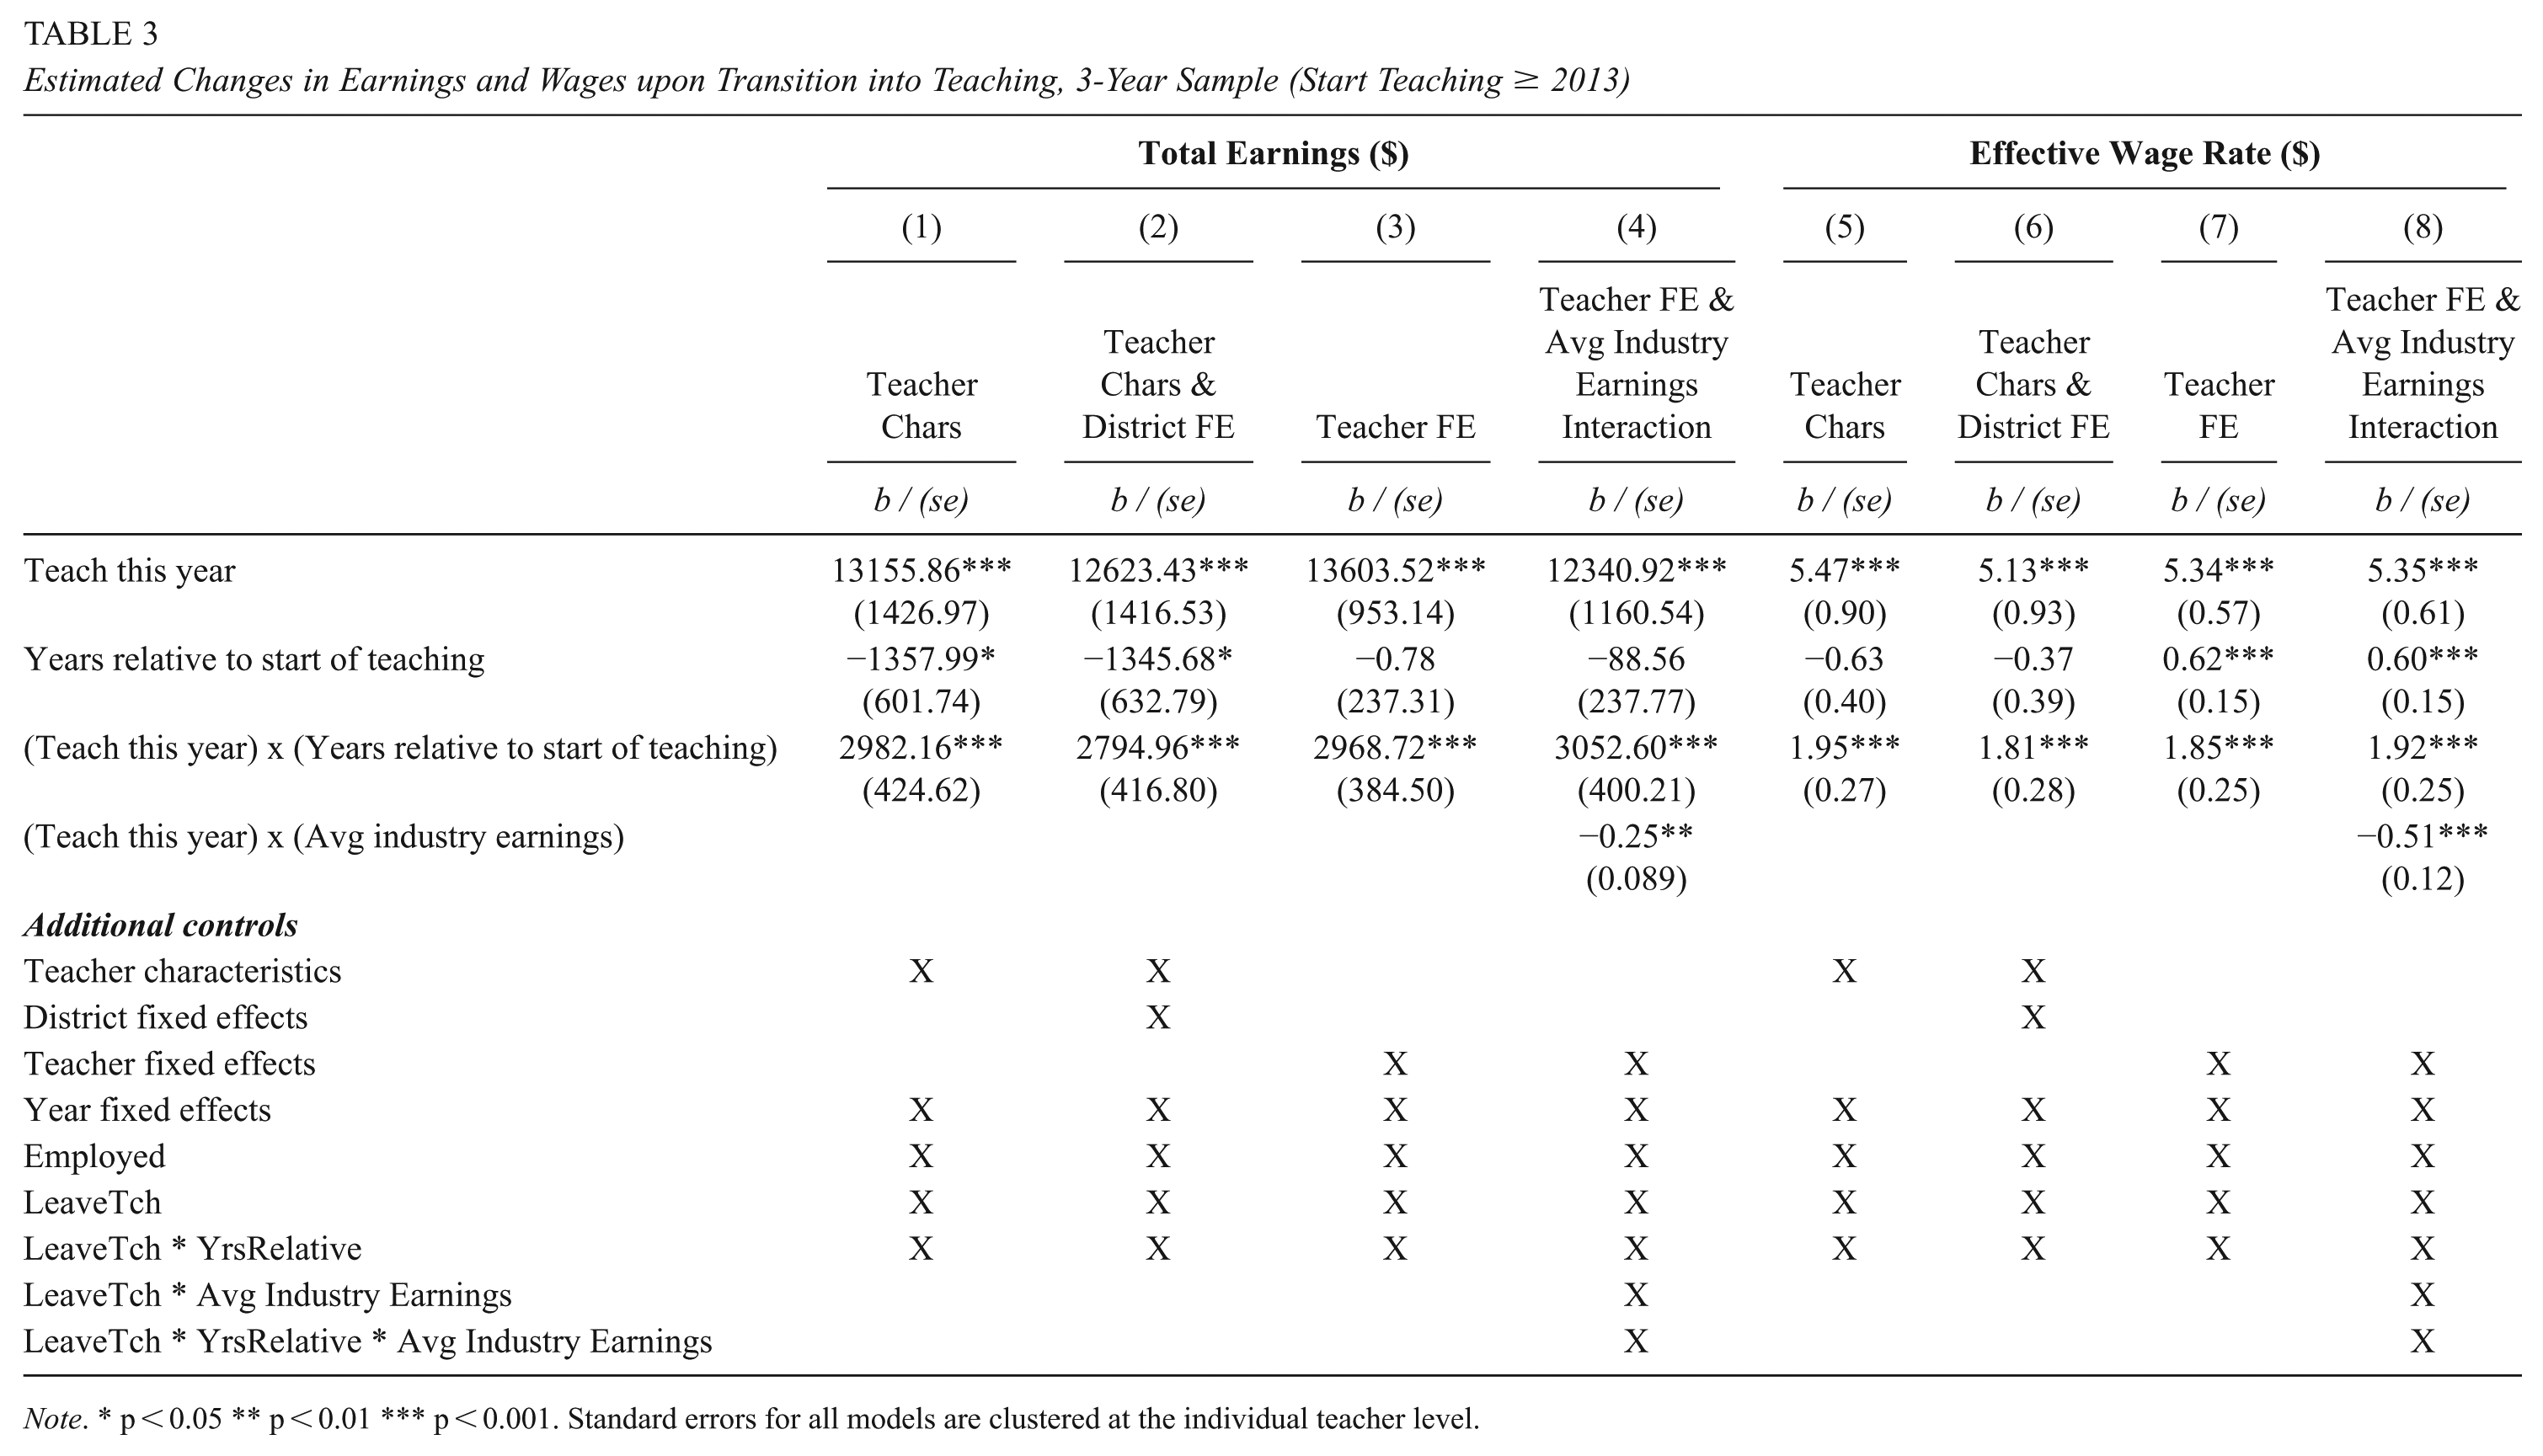
Note. * p < 0.05 ** p < 0.01 *** p < 0.001. Standard errors for all models are clustered at the individual teacher level.
Changes in Earnings upon Transition into Teaching, Overall and by Prior Industry. (A) Total Earnings. (B) Effective Wage Rate
The first row of Table 3 (repeated in the first estimate in Figure 6, panel A) shows the estimated change in earnings for all teachers in the 3-year sample, which corresponds to the estimated coefficient
Columns 5–8 of Table 3 and Figure 6, panel B, show comparable results from models where the outcome is effective wage rate. Our findings are broadly consistent with those for total earnings. Overall, we find that CTE teachers’ wage rates increased by $5.34 in their first year of teaching. Most industry cluster subgroups saw increased wages in their first year, though a larger proportion of these increases are not statistically significant compared to those found for total earnings. Here, Digital Technology is the one pre-service industry cluster for which we find a statistically significant decrease in the effective wage rate of $10.82. Finally, each additional $1 of average wages within a CTE teacher’s prior industry predicts a $0.51 lower salary increase upon entering teaching.
We conduct heterogeneity analyses using supplemental regression models (not shown), wherein we estimate the changes in earnings and wage rates separately for teachers who enter teaching in a city, suburban, town, or rural school district, and separately by cohort. Our interest in heterogeneity by district urbanicity stems from the fact that the industry composition of the local economy, as well as the alternative employment opportunities, can vary substantially by the urbanicity of a region. Overall, we find that there is slight variation in the change in earnings upon entering teaching depending on urbanicity, with the greatest increase for teachers entering rural districts ($14,512), followed by city districts ($14,044), suburban ($13,458), and towns ($12,550); however, the differences between these settings are not statistically significant. We also generally do not find statistically significant differences by urbanicity of industry-level changes in earnings or wages upon entering teaching, though for some industries the variation is substantial (but statistically insignificant). For example, teachers coming from Digital Technology, on average, saw reductions in pay when they started teaching in city or suburban districts, but saw slight increases in pay when starting in a town or rural district. Teachers from Financial Services, on average, had reduced earnings when teaching in a suburban district, but increased earnings in the three other types of districts. By and large, however, we do not detect systematic differences in our overall findings by district urbanicity. We also see little heterogeneity in these results by teaching cohort.
RQ3: How Do These Trends Vary Across CTE Licensure Pathways (i.e., Business and Industry Relative to Traditionally Prepared CTE Teachers)?
To understand how changes in pay when starting teaching vary by CTE pathway, we plot comparable figures and estimate comparable regression models as those described for RQ2, separating out teachers who used the traditional university pathway from those who used B&I. First, Figure 7 presents the distribution of total earnings for these two groups, where the traditional university pathway is shown in blue and B&I in red. Overall, we can clearly observe that the distribution of earnings in pre-service years is considerably wider for B&I teachers; their median earnings in pre-service years are also greater than those of their university pathway counterparts. However, upon entering teaching, the two groups have much more similar total earnings both in terms of distribution and median values, reflecting the relative consistency of first-year teacher salaries compared to those for industry employment. Interestingly, even though B&I teachers have higher earnings in pre-service years than traditionally prepared teachers, both groups have a higher median earnings level in their first year compared to all pre-service years observed.
Distribution of Total Earnings in Years Leading up to Transition to Teaching, by Pathway and Prior Industry. (A) Overall. (B) By Prior Industry
Figure 7, panel B, breaks out these earnings comparisons by pre-service industry cluster. The general pattern found in the overall earnings distributions applies to most, but not all, industry clusters. For example, B&I teachers coming from the Financial Services industry had similar or slightly higher median total earnings in years −3 and −2 compared to their earnings in their first year of teaching; however, in the year immediately prior to transition, their median earnings decreased. This could potentially reflect a shift to part-time work as individuals prepare to enter teaching or, alternatively, could reflect a non-voluntary reduction in earnings that might motivate individuals to shift professions. Across all the prior industries, it is notable that there is no industry in which pre-service median earnings were consistently higher than median earnings in the first year of teaching for either pathway, though the distributions of earnings suggest that some individuals (e.g., university pathway teachers from the Construction sector and B&I teachers from the Financial Services sector) likely took a pay cut when transitioning to teach.
Figure 8 presents the same distributions as Figure 7, but for effective wage rates rather than total earnings. The patterns observed overall are very similar to those observed for total earnings, with higher and more dispersed pre-service wage rates among B&I teachers and median wage rates upon transitioning to teaching that exceed pre-service wage rates for teachers from both pathways. This general pattern applies to many pre-service industry clusters, though again there are exceptions. For example, the effective wage rate for teachers coming from the Construction sector is relatively consistent across all years for both pathways, suggesting that the increase in median earnings for these teachers in their first year of teaching is more a function of hours worked than of hourly pay. Additionally, there are a handful of industry clusters, such as Healthcare and Human Services, Marketing and Sales, and Supply Chain and Transportation, where the pre-service distribution of both total earnings and wage rates is greater for B&I teachers than for those in the traditional university pathway. This variation in distribution by pathway suggests that, depending on the industry cluster from which they came, some B&I teachers likely faced a greater opportunity cost (or a reduced financial benefit) to transitioning to the teaching profession compared to their counterparts in the university pathway, though perhaps in exchange for greater earnings stability. The reverse pattern—wider pre-service pay distributions for university compared to B&I pathways—appears to be less common, though it is seen in Construction and in some pre-service years in Digital Technology, and Marketing and Sales.
Distribution of Effective Wage Rate in Years Leading up to Transition to Teaching, by Pathway and prior Industry. (A) Overall. (B) By Prior Industry
Lastly, we estimate the same regression models described earlier for RQ2, now separately for the subgroup of CTE teachers in either pathway. Tables 4 and 5 present the results of the same model specifications described for Table 3 (for university and B&I pathways, respectively), while marginal effects by prior industry are shown in Figure 9. Focusing again on the preferred teacher fixed effect specification, we find that university pathway teachers had a greater increase in earnings ($21,208 versus $10,409) and effective wage rate ($7.48 versus $4.38) than B&I teachers in their first year of teaching, though the difference between pathways is only statistically significant for total earnings. At the pre-service industry cluster level, this general pattern typically holds, though there are only a few instances where the difference in pay between the two pathways is statistically significant (e.g., total earnings for teachers from Financial Services; effective wage rates for teachers from Healthcare and Human Services). Generally, however, our regression findings are consistent with our unadjusted descriptive findings—on average, both traditionally prepared CTE teachers and B&I teachers received pay increases when first entering teaching compared to their pre-service earnings in industry, though the pay increases were greater for teachers from the university pathway. Finally, and as might be expected, the interaction with prior industry average earnings is only statistically significant for CTE teachers entering through the B&I pathway, suggesting it is only those CTE teachers coming through the B&I pathway who sacrifice some earnings and wage increases if they are coming from higher-paying industries.
Estimated Changes in Earnings and Wages upon Transition into Teaching, 3-Year Sample (Start teaching ≥ 2013), Traditional Pathway
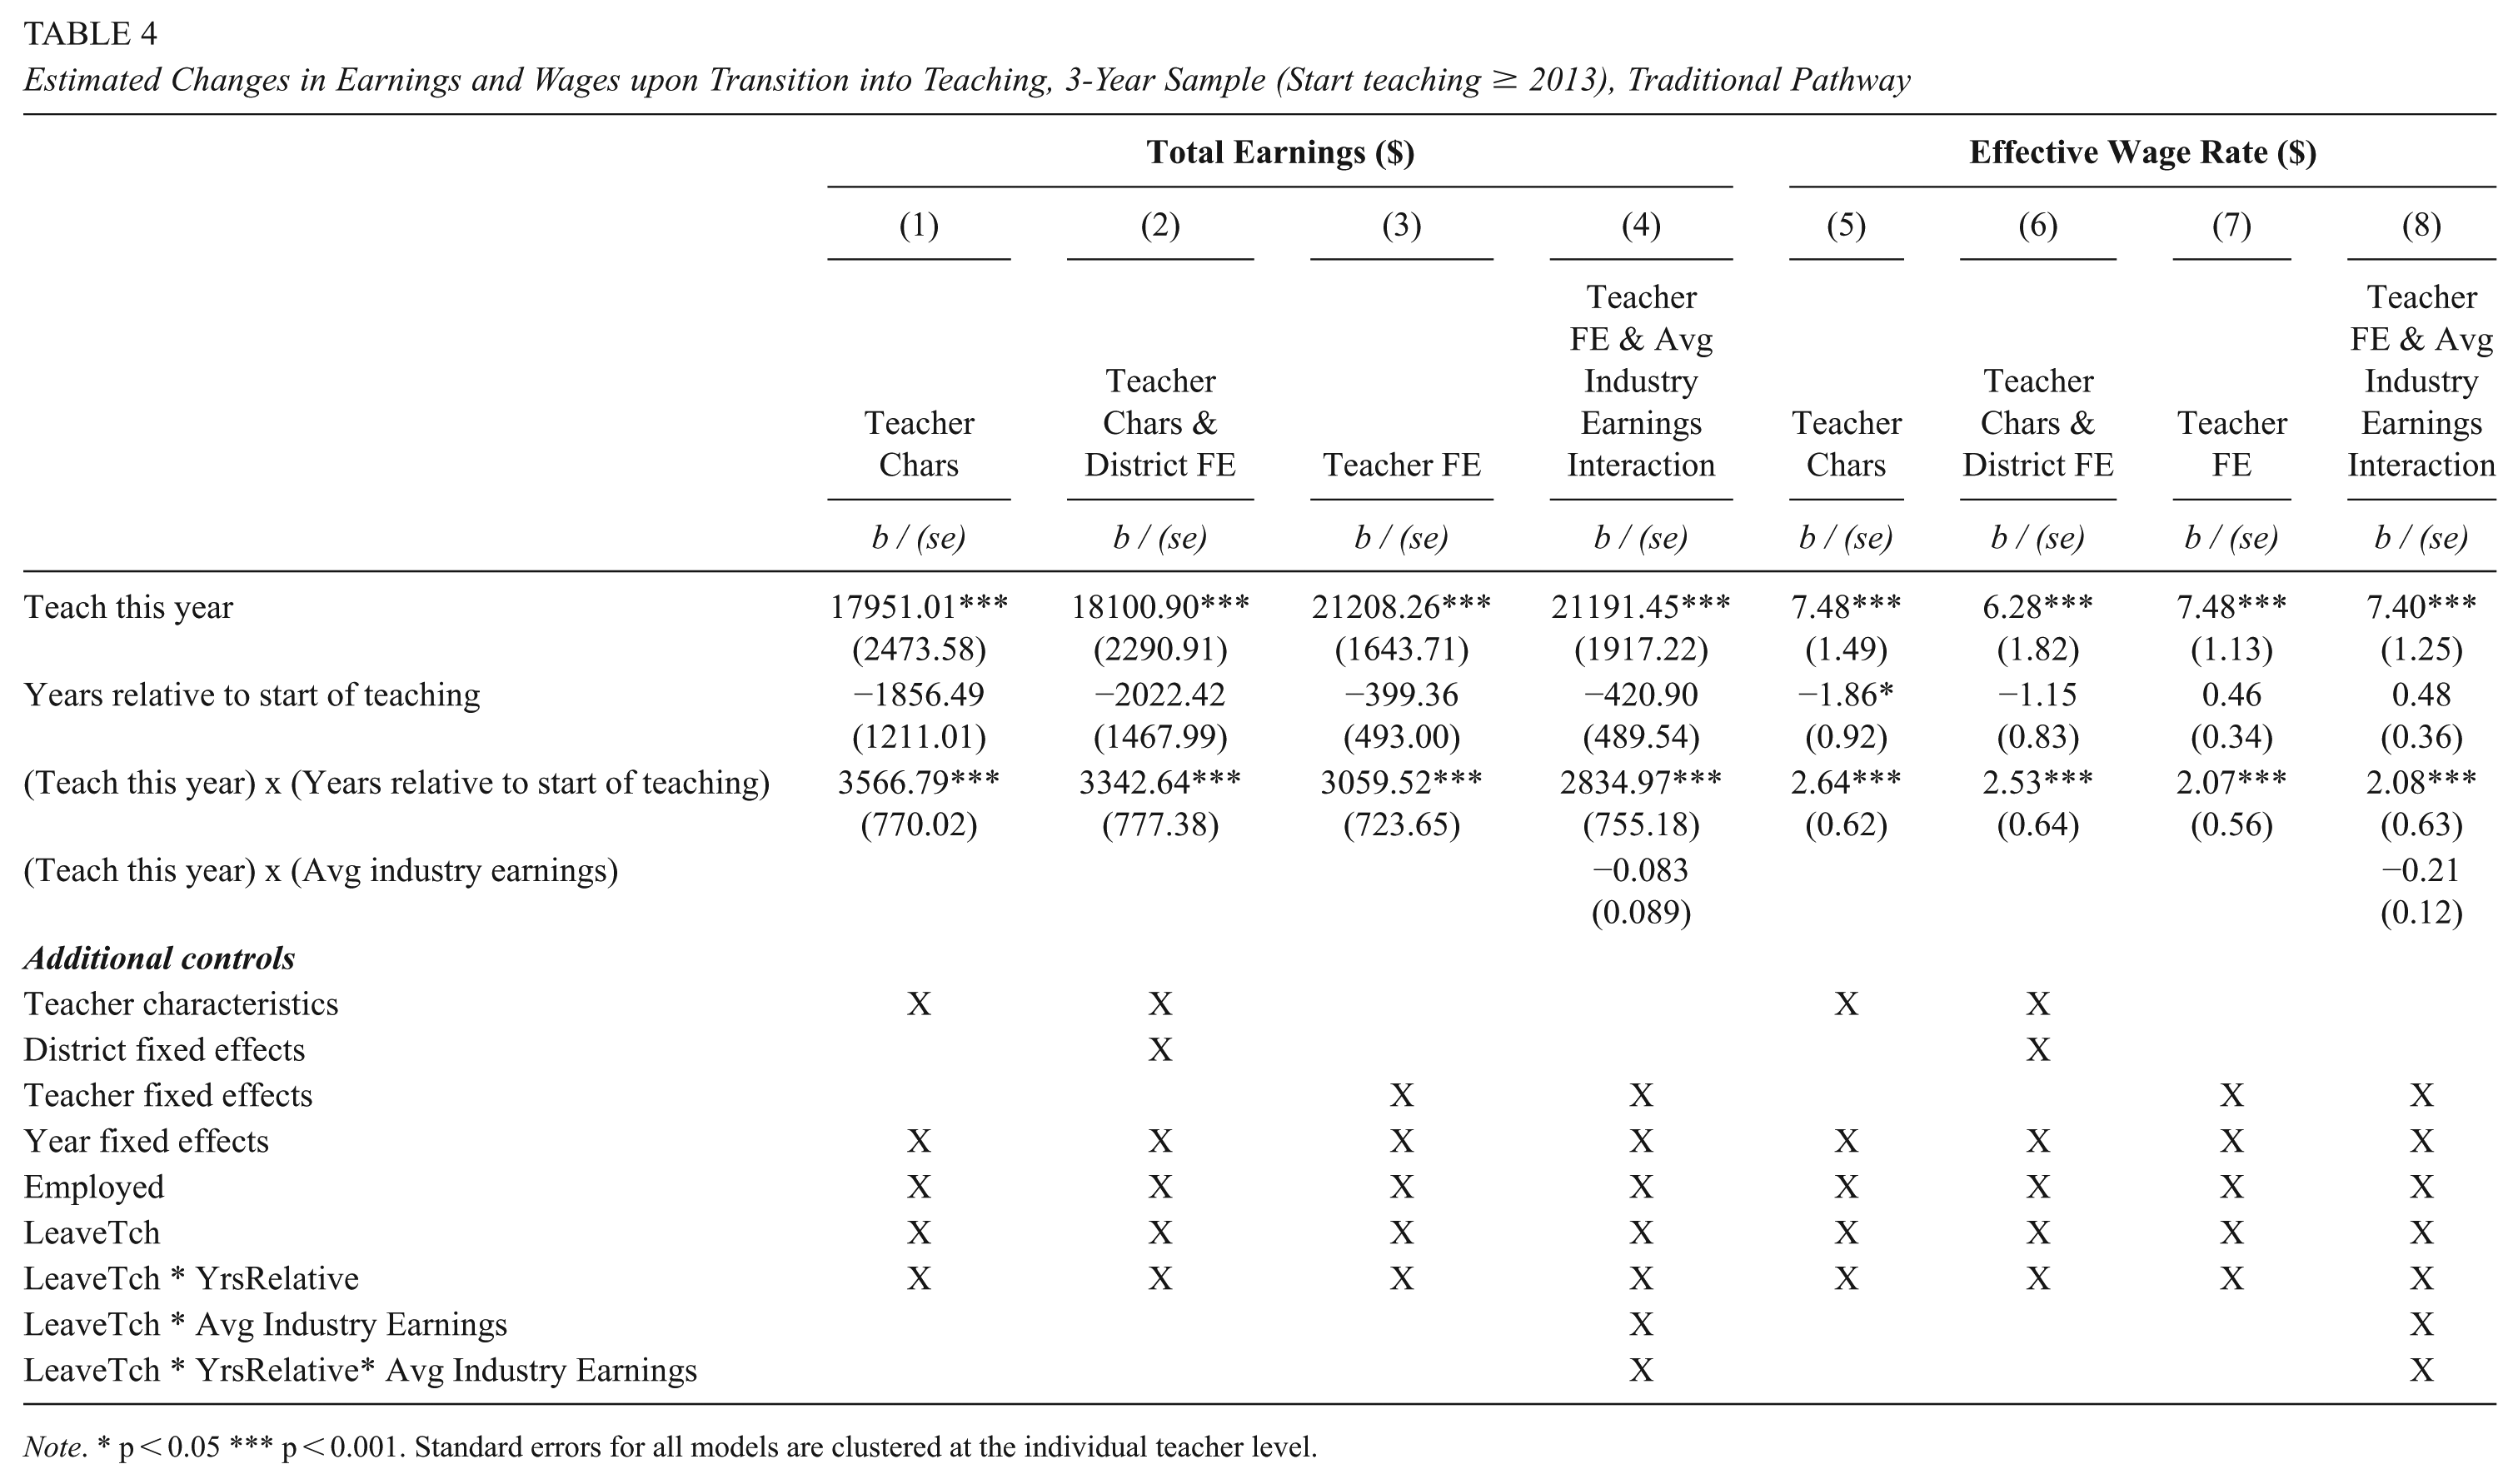
Note. * p < 0.05 *** p < 0.001. Standard errors for all models are clustered at the individual teacher level.
Estimated Changes in Earnings and Wages upon Transition into Teaching, 3-Year Sample (start teaching ≥ 2013), B&I Pathway
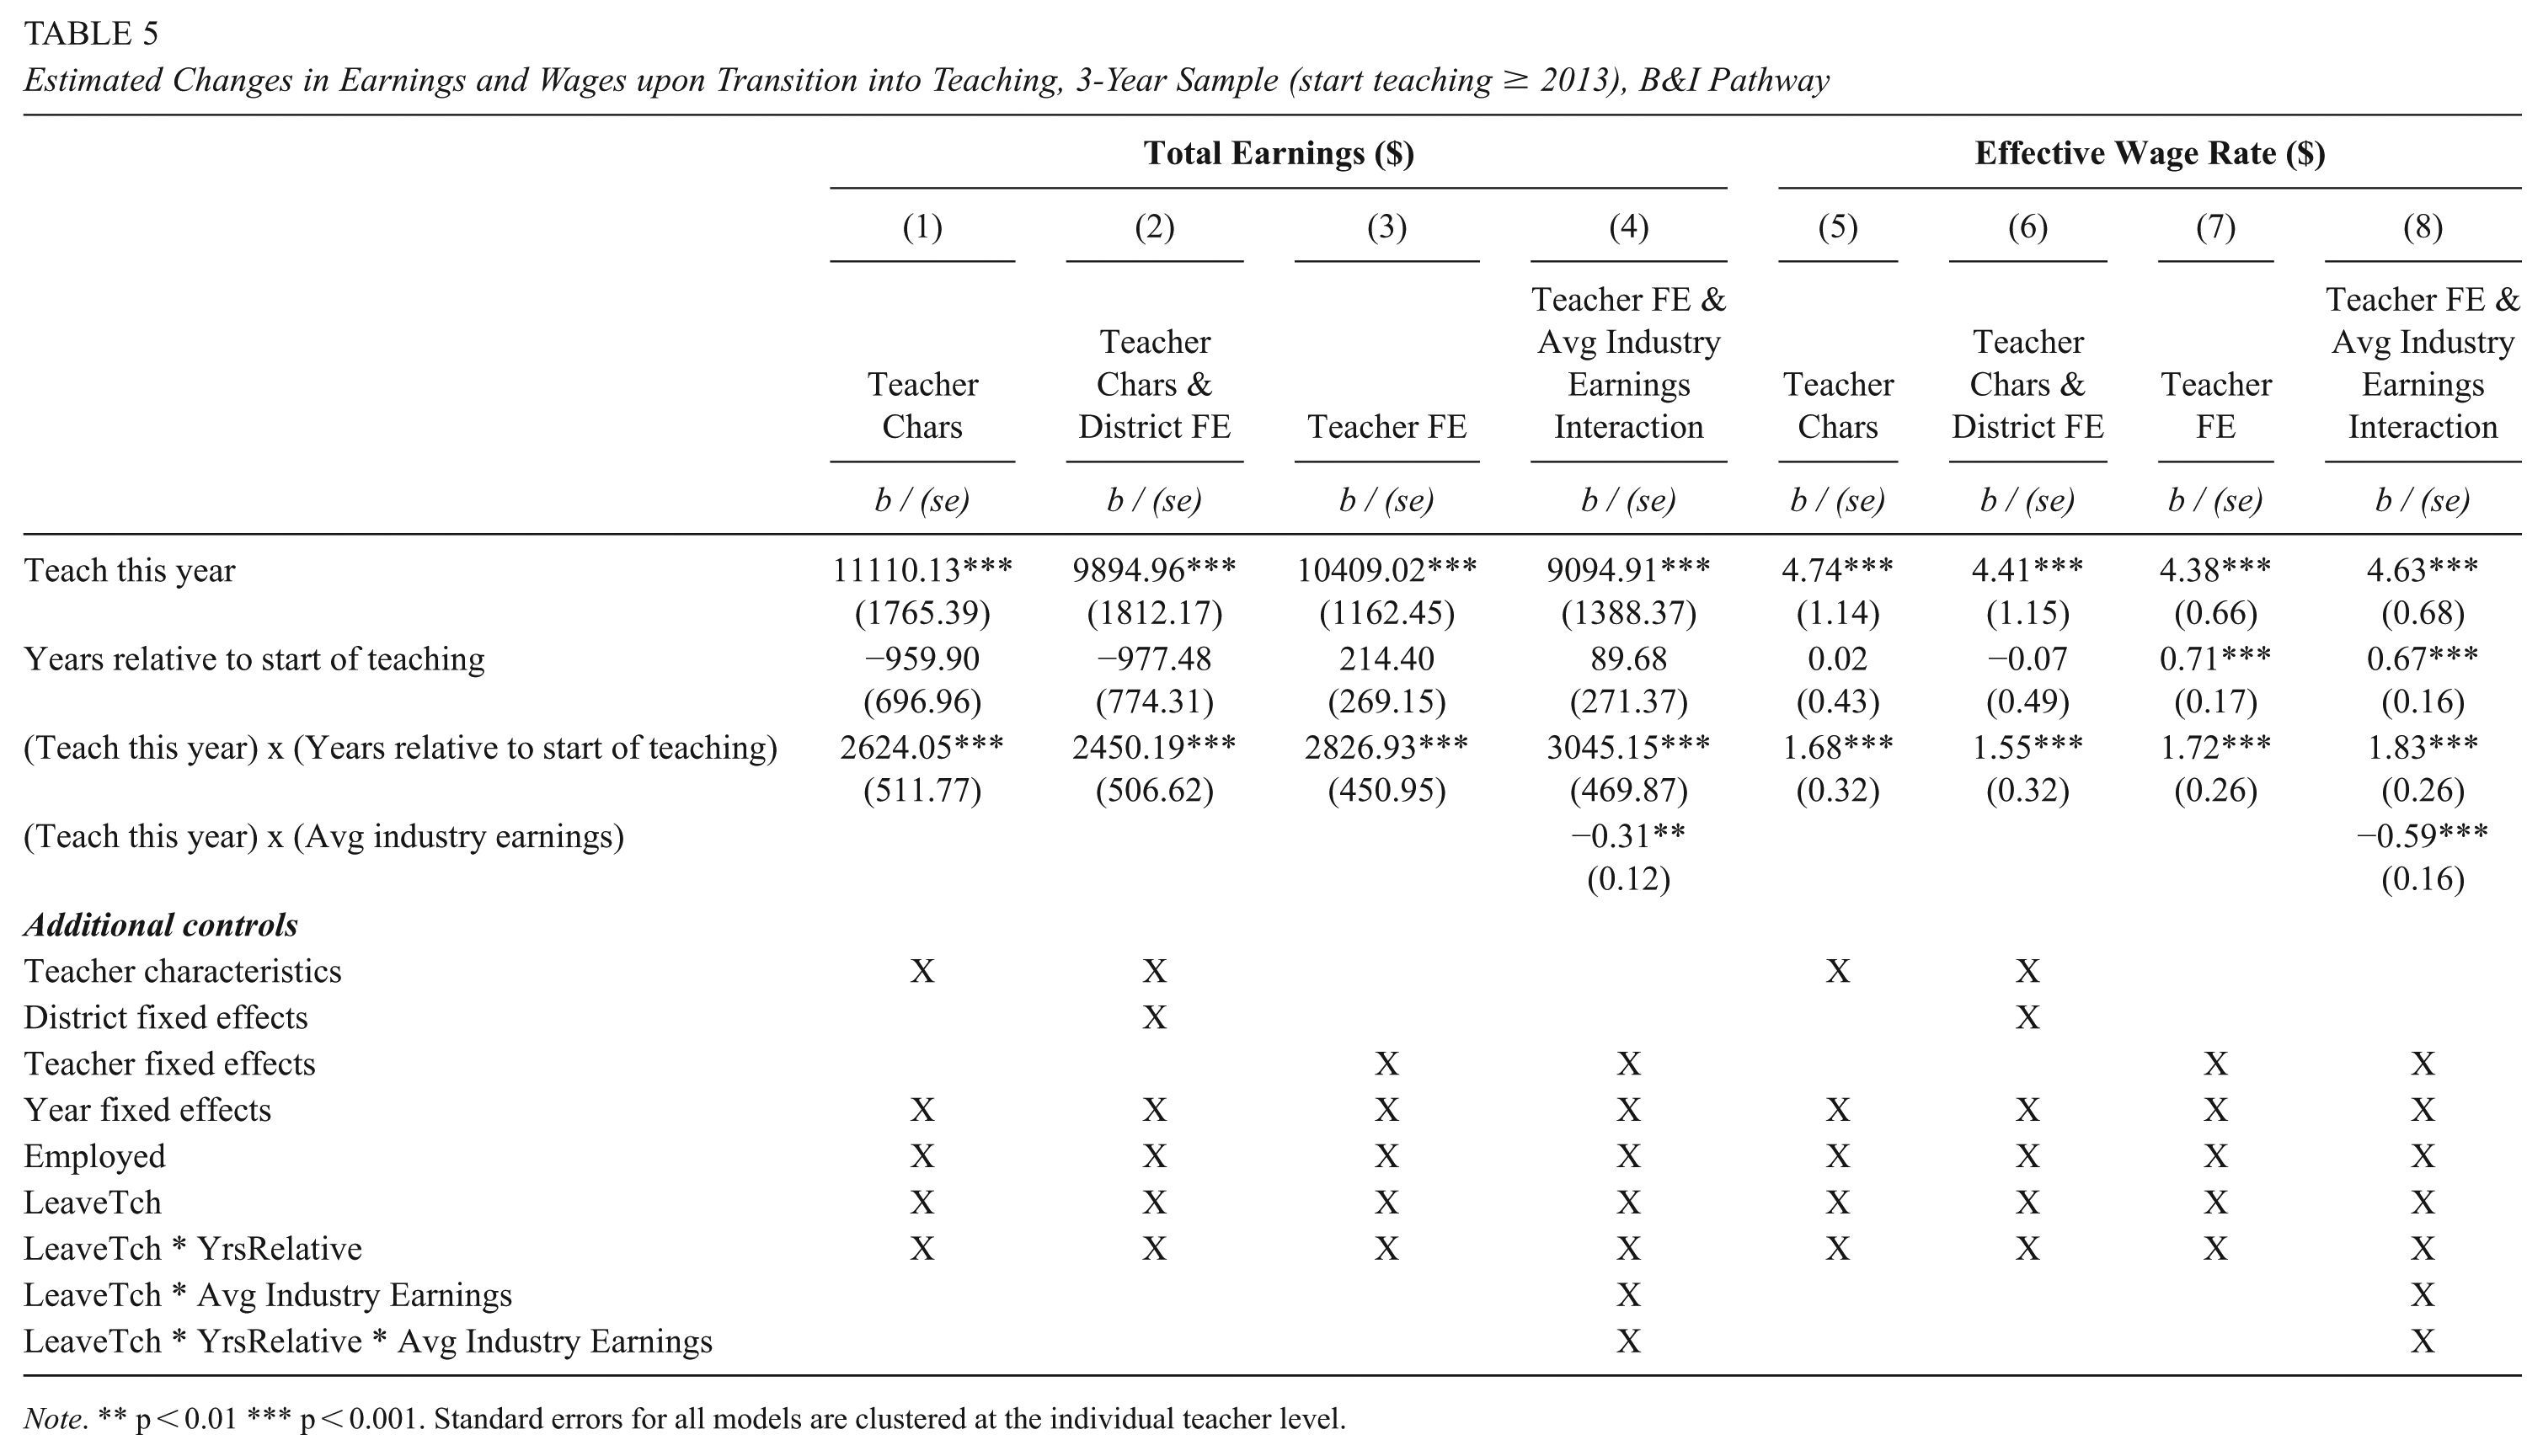
Note. ** p < 0.01 *** p < 0.001. Standard errors for all models are clustered at the individual teacher level.
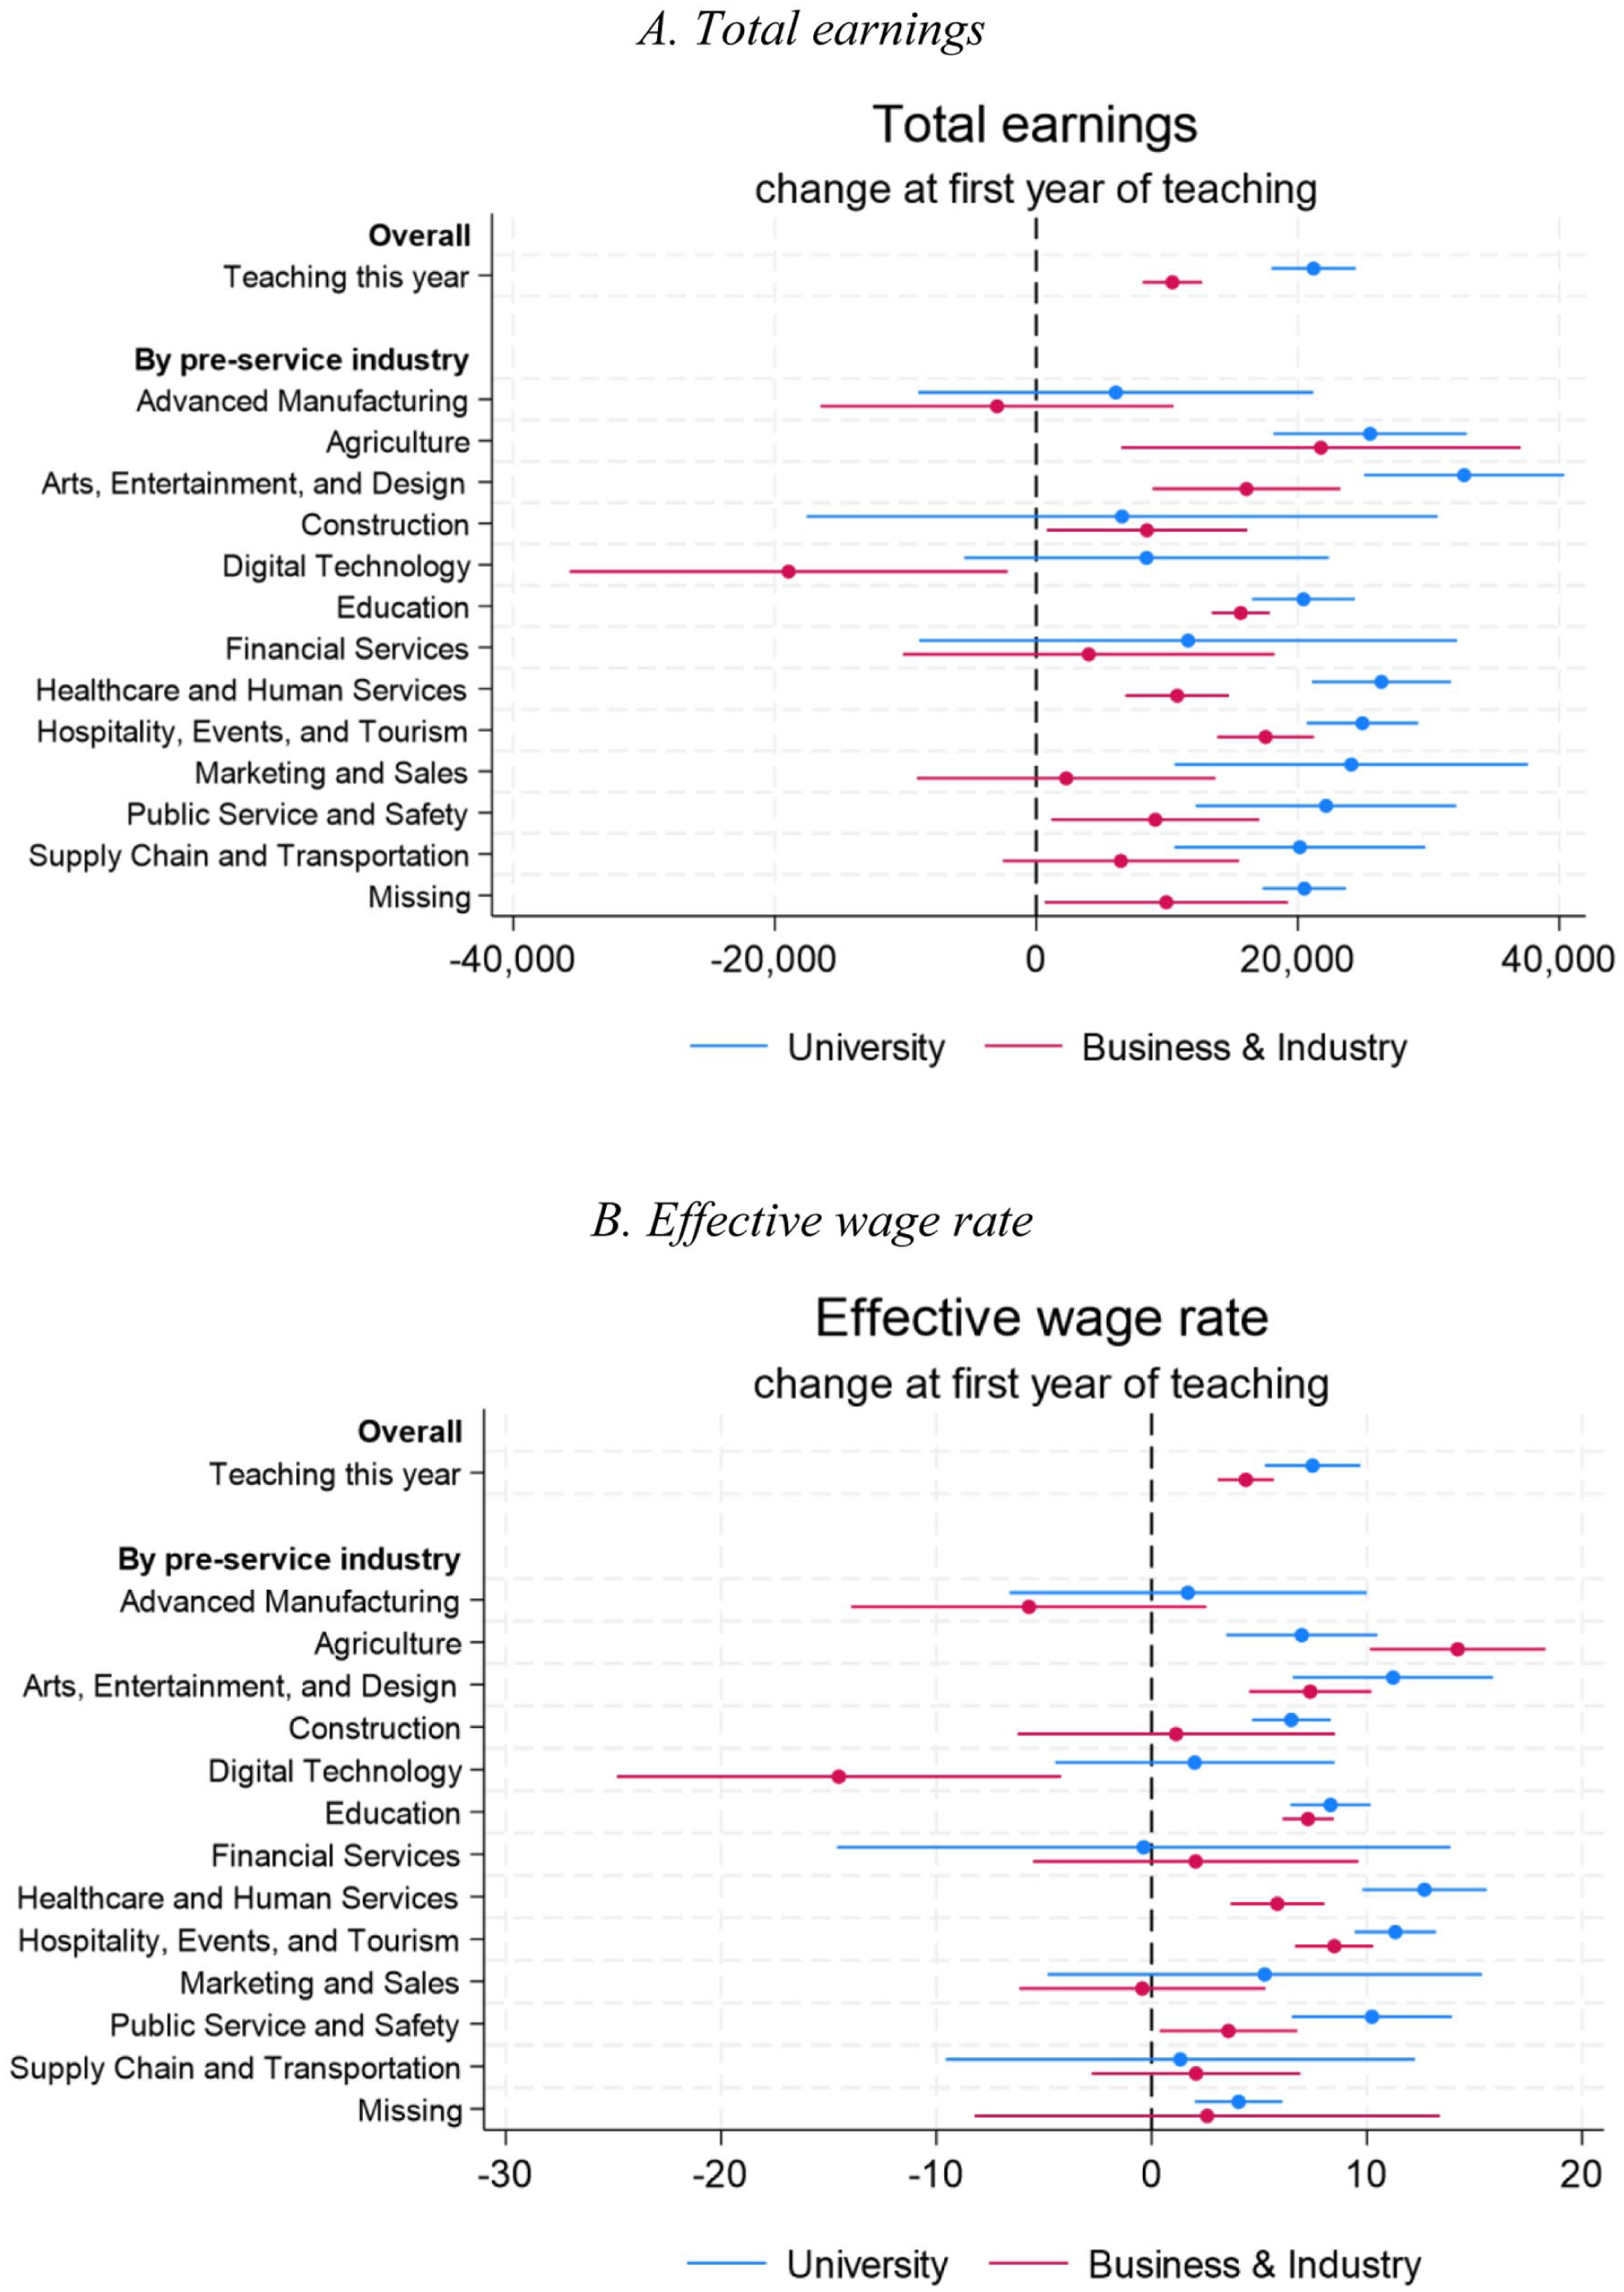
Changes in Earnings upon Transition into Teaching by Pathway, Overall and by Prior Industry. (A) Total Earnings. (B) Effective Wage Rate
Conclusions
This study is the first to our knowledge to describe the unique front end of the CTE teacher pipeline. Taking steps toward understanding the backgrounds and potential motivations of these teachers can help inform strategies for recruiting and retaining CTE teachers and eventually help identify the mechanisms through which teachers’ prior experiences impact students in the classroom. While our analysis cannot speak to the motivations of individuals in industry who might choose to move into teaching but ultimately do not, our paper examines which industries new CTE teachers come from, how their pay from their industry work compares to their compensation while teaching, and how these trends differ depending on the pathway through which they entered teaching. This descriptive analysis alone cannot comprehensively fill our gaps in understanding, but it puts us a step in the right direction.
We have several key findings worth highlighting. First, CTE teachers come from a wide range of industry backgrounds, but the most common by far is Education. Our methodology for identifying teachers’ prior industry is to privilege their employment in the reference year (i.e. 3 years prior to teaching for the 3-year sample), so it is possible that our estimate of the proportion coming from Education (about 32%) is an overestimate if individuals transitioned earlier from other industries into Education before beginning teaching. It is also possible that the nature of UI data and the types of employment that it can and cannot capture may limit our ability to observe pre-service work and earnings more in some industries than others, leading us to underestimate pre-service participation in non-Education industries. For example, using evidence from tax filings, Garin and Koustas (2021) report that the proportion of workers who are primarily self-employed is particularly high in construction (among men), and to a lesser extent, real estate, administrative, professional, and health care services (among women). 9 Those caveats notwithstanding, the overrepresentation of teachers from the Education sector helps to highlight a related finding—the proportion of teachers coming from many industries that are in high demand for instruction (particularly in Washington State) is relatively small. Only 1% of CTE teachers in our sample depicted in Figures 4 and 5 come from the Agriculture, Energy, and Natural Resources meta cluster; 7% come from Digital Technology, Management, and Marketing; and 15% come from Healthcare, Human Services, and Public Service.
Regarding the question of how compensation compares for CTE teachers before and after they start teaching, we find that pay for new CTE teachers is significantly higher than it was in their pre-service employment in industry. Though we do find some variation in the distribution of pre-service pay by industry cluster, the median teacher from all clusters received a pay bump when starting teaching. For high-demand CTE clusters, our regression results indicate that teachers from Agriculture and from Healthcare and Human Services saw significant increases in both total earnings and wage rate when they transitioned into teaching, whereas teachers from Digital Technology were the one group who saw a marginally significant decrease in total earnings and a statistically significant decrease in wage rate. Teachers’ pre-service pay in several industry clusters (including Digital Technology) also had much wider distributions than their in-service pay in their first year of teaching, suggesting that the volatility or uncertainty of earnings in industry might also factor into the decision to enter teaching.
It is worth considering that one limitation of the sample in this study is that we only observe individuals who do enter the teaching workforce. Our analysis cannot speak to individuals who might have considered teaching but decided to stay in their industry. And likewise, there are limitations related to the fact that we only observe outcomes for individuals that do move into CTE teaching. People switch jobs for a reason, and it is likely that those who actually did choose to teach were more likely to have been less successful in their industry work and faced lower opportunity costs to switching professions. Thus it is perhaps not surprising that we see the average individual that does move into teaching experience a large increase in earnings. But as we note at the start of our paper, Goldhaber et al. (2024) found that student teachers who consider teaching and do not ultimately do so earn less than their counterparts who do enter teaching, and it was possible that the calculus was different for individuals who already have workplace experience and potentially a career trajectory in another industry. However, our results suggest that the dynamics are similar for the CTE teacher labor market: Individuals that move into teaching tend to earn more after the move than before.
Finally, and perhaps of greatest policy relevance because of the prevalence of B&I pathways across the country (Bonsu et al., 2013), when we compare the patterns of pre-service and in-service compensation for new CTE teachers from university and B&I pathways, we find that overall, patterns are quite similar. As expected, given that many individuals from the university pathway are likely entering their first full-time positions after college, the pay increase for CTE teachers entering teaching from the university pathway ($21,208 in total earnings) is larger than for B&I ($10,409 in total earnings), but the pay bump for B&I teachers is still substantial and statistically significant. This is an interesting complement to the “teacher pay penalty” literature (e.g., Brummet et al., 2024; Chingos & West, 2012; Feng, 2014) and bookend to the findings specific to CTE teachers by Kistler et al. (2024) that CTE teachers with occupational certifications (i.e., B&I teachers) earn higher pay after leaving teaching. Both sets of findings point to the conclusion that, despite often idealistic views of teachers’ motivations, individuals’ decisions about entering or exiting teaching are not based purely on altruistic reasons or lifestyle preferences, but that financial reasons—and the availability of well-paying alternatives—play a meaningful role.
Supplemental Material
sj-docx-1-ero-10.1177_23328584261448134 – Supplemental material for The Front End of the CTE Teacher Pipeline: Characterizing the Prior Work Experiences of CTE Teachers
Supplemental material, sj-docx-1-ero-10.1177_23328584261448134 for The Front End of the CTE Teacher Pipeline: Characterizing the Prior Work Experiences of CTE Teachers by Elise Dizon-Ross, Grace Falken, Dan Goldhaber, Patrick Lavallee Delgado and Roddy Theobald in AERA Open
Footnotes
Acknowledgements
We thank ERDC for sharing the postsecondary data used in this paper and the Washington Office of Superintendent of Public Instruction (OSPI) for providing the K–12 student and teacher data used in this paper through data sharing agreement 2021DE-009. Responsibility for any and all errors rests solely with the authors.
Author Note
The opinions expressed are those of the authors and do not represent views of the Institute or the U.S. Department of Education. The research presented here uses confidential data from the Education Research and Data Center (ERDC) located within the Washington Office of Financial Management (OFM). ERDC’s data system is a statewide longitudinal data system that includes de-identified data about people’s preschool, educational, and workforce experiences.
Funding
The authors disclosed receipt of the following financial support for the research, authorship, and/or publication of this article: The research reported here was supported by the Institute of Education Sciences, U.S. Department of Education, through Grant R324A200092 to the University of Washington. The research reported here was also supported by the Institute of Education Sciences, U.S. Department of Education, through Grant R305B200035 to the University of Pennsylvania.
Notes
Authors
ELISE DIZON-ROSS is a researcher at American Institutes for Research. Her research examines the impacts of economic inequality and access to basic needs on student outcomes and the education sector, from K–12 through higher education.
GRACE FALKEN is a project director at the Annenberg Institute at Brown University. Her research explores labor market dynamics of teachers and other public school staff as well as issues at the intersection of education and climate change.
DAN GOLDHABER is the director of the Center for Education Data & Research (CEDR) at the University of Washington and the director of the Center for Analysis of Longitudinal Data in Education Research (CALDER) at the American Institutes for Research. His work focuses on issues of educational productivity and reform at the K–12 level, including the broad array of human capital policies that influence the composition, distribution, and quality of teachers in the workforce, and connections between students’ K–12 experiences and postsecondary outcomes.
PATRICK LAVALLEE DELGADO is a PhD student in Education Policy at the University of Pennsylvania, Graduate School of Education, where he serves as an IES Predoctoral Fellow and as a Fontaine Fellow. His research interests include community college and career and technical education, how they prepare a local workforce for good jobs today and new jobs tomorrow, and disparities in their education and labor outcomes.
RODDY THEOBALD is the deputy director of CALDER and a managing researcher at American Institutes for Research. His research focuses on teacher education, teacher licensure, special education, and career and technical education.
References
Supplementary Material
Please find the following supplemental material available below.
For Open Access articles published under a Creative Commons License, all supplemental material carries the same license as the article it is associated with.
For non-Open Access articles published, all supplemental material carries a non-exclusive license, and permission requests for re-use of supplemental material or any part of supplemental material shall be sent directly to the copyright owner as specified in the copyright notice associated with the article.