
Abstract
We describe alignment between high school career and technical education (CTE) and local labor markets across five states—Massachusetts, Michigan, Montana, Tennessee, and Washington. We find that CTE is partially aligned with local labor markets. A 10-percentage-point higher share of local jobs related to a CTE career cluster is associated with a 3-point higher rate of CTE concentration in that cluster. Women and students from racial or ethnic minority groups are better aligned with local employment than men, in part due to their selection of CTE fields like Education & Training, Health Science, and Hospitality & Tourism, which correspond with a large portion of the workforce in almost every metro area. We find more limited evidence of dynamic, short-term adjustments in CTE after changes in local labor markets. A small degree of realignment lags the labor market by 2 to 3 years and is only observed following changes in college-level employment.
Keywords
Introduction
Career and technical education (CTE) has undergone a dramatic renewal in U.S. high schools over the last two decades. Once considered a vocational track for non-college-bound students, CTE is now interwoven into the fabric of the secondary curriculum with the goal of preparing students for both college and careers. States typically organize CTE programs around “career clusters,” and the 16-cluster National Career Clusters Framework 1 that many states have adopted spans almost every occupation one could have, including those requiring a college or advanced degree. This breadth is in response to a perceived skill shortage in middle skill occupations from the perspective of employers (Craig, 2019; Kochan et al., 2012); increasing costs of attending college; and the idea that learning practical, applied, or occupationally relevant skills is valuable for both college-bound and career-bound students. CTE is a big part of modern U.S. education. CTE has bipartisan support at the federal level (Meckler, 2018), its own funding and accountability systems, and its own department in many state and local education agencies. Given its forward-looking employment focus, CTE is often part of the bridge between K–12, college, and the workforce, playing a role in state and local efforts to improve K–12-to-workforce pipelines (Dorn, 2012; Gewertz, 2017). But CTE policy developments have quickly outpaced CTE research, especially around the topic of alignment, or the idea that CTE students are gaining skills and knowledge that they could later use in careers that are in demand by employers.
Policymakers and economists often call for formal, public technical education in skills that are aligned with labor market needs (Cullen et al., 2013; Education Commission of the States, 2019; Gonzales & Gang, 2019; Scott & Thompson, 2019; State Council of Higher Education for Virginia, 2020; Tennessee Department of Education, 2020), and alignment is also a key priority among chambers of commerce across the country. There is a commonly held belief among policymakers, parents, and students that public schools should educate students in skills and knowledge they can use at work (Klein, 2019). Since most young adults live close to where they attended high school (Sprung-Keyser et al., 2022), satisfying this belief would mean providing skills that are in demand by nearby employers.
Scholarly research on alignment lags far behind policy and is largely limited to studies of college students. About one in three U.S. high school graduates do not enroll directly in college (De Brey et al., 2021), and more do not complete a college certificate or degree. For them, high school CTE coursework is a rare opportunity to explore career interests and develop skills that offer a return in the labor market. We study whether a student’s CTE coursework resembles the surrounding labor market, which may determine the success of the CTE-to-workforce pipeline. Specifically, we quantify and describe static and dynamic alignment between high school CTE and local labor markets in five states with diverse populations, economies, and CTE systems.
There is no widely accepted definition of an aligned CTE program. We operationalize the concept by quantifying the similarity between CTE participation in a given field and local employment in that field. Specifically, we compute and associate two percentages: the percentage of an area’s CTE students with at least intermediate investment in a particular career cluster—Architecture & Construction, for example—and the percentage of local workers who have Architecture & Construction occupations. We collect these percentages for each career cluster and all metro and nonmetro area in five states. A positive correlation between CTE and employment shares indicates some degree of CTE-workforce alignment.
To preview results, we find consistent evidence of partial alignment between the percentage of an area’s CTE students who take courses in a particular CTE cluster and the fraction of area jobs aligned with that cluster. Looking across metro/nonmetro areas and clusters, a 10-percentage-point higher share of local jobs related to a CTE career cluster is associated with a 3-point higher share of local 12th-grade CTE students who concentrate in that cluster. Women and students from racial or ethnic minority groups tend to be better aligned with local jobs, largely because they are more likely to concentrate in the Business Management & Administration, Education & Training, Health Science, and Hospitality & Tourism clusters. These fields typically account for at least half of area jobs. This does not necessarily mean that female and minority CTE students are on track to higher-paying jobs after school. In related research, Carruthers et al., (2024) find that—conditional on typical entry-level education requirements—the fields where women are overrepresented also tend to have jobs with lower wages and salaries. This result, combined with our findings herein, suggests that women tend to concentrate in fields where jobs are more plentiful and more evenly distributed across metro areas, but not necessarily higher paying. We find limited evidence of dynamic, short-term adjustments in CTE alignment, which we quantify as the relationship between an area’s employment growth in particular fields and growth in the number of CTE concentrators in that field. This relationship is consistently positive but statistically imprecise in the short term.
These findings deepen a thin area of the CTE research literature and offer a replicable framework for quantifying alignment in other settings. Our findings are descriptive, however, and we leave to future research the questions of how schools, students, and employers each contribute to static alignment; the circumstances under which we might observe more dynamic alignment (for example, following large changes to labor demand); as well as both the short-term and long-term consequences of workforce alignment in CTE programs.
Related Research and Contribution
There is a small but growing literature on how CTE coursework affects students, generally showing positive effects on graduation, employment, or earnings in the first several years after high school (Dougherty et al., 2019; Hemelt et al., 2019; Kreisman & Stange, 2020; Mane, 1999). Alignment is related to the much less studied questions of why students choose particular CTE pathways in high school (or why they choose CTE at all), and why schools offer some CTE pathways but not others. The labor market is a likely candidate for both, and an explanation for why we might observe similarity between the distribution of local students and workers across CTE fields.
One potential mechanism behind CTE-workforce alignment is the effect of labor markets on student choices over their CTE options. We know that postsecondary students consider the labor market when deciding whether to enroll in college and whether to major in particular fields (Acton, 2021; Blom et al., 2021; Goulas & Megalokonomou, 2019; Grosz, 2022; Han & Winters, 2020; Liu et al., 2019; Long et al., 2015; Weinstein, 2022). It is possible that high school students behave similarly when selecting CTE courses or pathways. In support of this idea, Ansel et al. (2022) find that most eighth-grade students applying to one of Massachusetts’s Regional Vocational and Technical Schools report future jobs as being the most important factor in their preferred school.
A second potential pathway to aligned CTE systems is the effect of labor markets on state, district, and school capacity and decisions to offer, expand, or contract programs in concert with aligned jobs. This mechanism is in part dictated by federal policy. The Strengthening Career and Technical Education for the 21st Century Act of 2018 (“Perkins V”) requires that CTE programs document alignment with in-demand jobs. Atwell et al. (2022) outline some of the ways in which community colleges have done so, including preapprenticeship programs with local high schools and firms. Yue (2021) describes an extreme example of CTE supply response across secondary and postsecondary systems in West Tennessee, where a new $5.6 billion Ford electric vehicle plant will employ close to 6,000 workers. State support for “Blue Oval City” include a new technical college campus and efforts to incorporate relevant coursework into K–12 schools.
Finally, the causal direction may run from schools to the workforce as well, if employers locate, expand, or design their operations around the number of area high school graduates with skills in particular fields. There is theoretical and empirical evidence that local education—both the quality and type of skills present in an area—matters for firm location decisions (Almazan et al., 2007; Schlegel & Backes-Gellner, 2023).
Why might we not observe static or dynamic alignment between local CTE and employment? The three mechanisms reviewed above rely on assumptions that could be invalid in practice. In order for the labor market to affect student CTE choices, students would need to have good information about employment and earnings coming from different CTE areas, and they would need to value that information. But at the postsecondary level, students have faulty information about typical earnings in different fields; and even when given accurate information, idiosyncratic preferences dominate their program and major choices rather than the employment or earnings outlook (Baker et al., 2018; Beffy et al., 2012; Wiswall & Zafar, 2015). The same may be true for high school students, who additionally have less discretion in choosing their courses than college students, and who do not usually need to select a focal area of study. CTE supply might appear to be misaligned with the labor market if schools and education agencies are constrained in staffing in-demand programs, particularly in fields where teachers have competing alternatives in the workforce (Kistler et al., forthcoming).
The focus of our study is on quantifying overall CTE-workforce alignment, a necessary step toward identifying which of the above mechanisms might or might not be responsible. The most closely related research on alignment at the K–12 level is a report by Sublett and Griffith (2019), who quantify the alignment of CTE concentrations and local labor markets, by field, across 215 metropolitan areas in the United States using the High School Longitudinal Study of 2009. They find evidence of local alignment, in that “students take more CTE courses in fields that support more local jobs” (p. 21), although overall student participation rates were low in career clusters that synced with the nation’s top fields: business, hospitality and tourism, marketing, and manufacturing. Also related is a report by Harris et al. (2020), who document the proximity of 20 in-demand occupations in West Virginia to aligned CTE programs, as well as state reports projecting degree completion in specific fields alongside growth in related occupations (e.g., Tennessee Higher Education Commission, 2020).
We add to existing research in two ways. First, we quantify CTE-to-workforce alignment among recent cohorts of students. Sublett and Griffith (2019) find evidence of alignment in a static sense for a nationally representative sample of the 2013 12th-grade cohort, meaning that at a point in time, areas with more concentrated employment in particular sectors tended to have more concentrated student enrollment in affiliated clusters. We examine the same relationship for several recent 12th-grade cohorts in five states, up to and including the class of 2019. In addition, we quantify whether changes in employment are correlated with changes in affiliated CTE course-taking and course offerings. In this respect, we also add to recent work by Sublett and Tovar (2021), who find that fields with higher forecasted employment growth correspond with lower community college enrollment. Our dynamic alignment estimates will help us determine if K–12 CTE moves in more sync with the labor market.
We emphasize that our analyses of static and dynamic alignment are descriptive. Both are symptomatic of a causal relationship between labor markets and schools, following one or more of the pathways described above. But the relationships we document between local CTE and workforce depth in an area could be driven by outside influences on both sectors, and we do not make causal claims about our findings or hold up one mechanism over the others. In addition, we leave the consequences of aligned or misaligned CTE programs to future research. Perfect alignment with the local labor market, in either a static or dynamic sense, is not necessarily good for students in the long term if the skills they acquire in CTE are rigid and unadaptable to changing technologies and evolving local economies.
Data
Our goal is to quantify the correlation between employment and aligned CTE concentrators in a labor market. In order to do so, we rely on five states’ administrative education data systems for CTE concentrator counts and the Bureau of Labor Statistics (BLS) Occupational Employment and Wage Statistics (OEWS) series for estimates of total employment by occupation. In order to marry these two data sources, we define local labor market boundaries and use a crosswalk that links occupations to their most relevant CTE career cluster. We describe each of these four inputs in turn.
Local Labor Markets
We define local labor markets to be metropolitan statistical areas (MSAs) and nonmetropolitan areas as defined by the U.S. Office of Management and Budget, the U.S. Census Bureau, and the BLS for its May 2021 OEWS release. 2 This has a number of advantages over other definitions of local economic boundaries, chief of which is that we can observe annual, occupation-level estimates of employment for MSAs and nonmetropolitan areas (described below), but not for finer geographies such as counties or commuting zones. In addition, MSAs balance the student view of relevant jobs, which might be narrower than even commuting zones, with the statewide policy and economic development views of alignment. An MSA is a core urban area with a population of at least 50,000 people, plus surrounding communities with social and economic connections to the core. MSAs can cross state lines, such as the Memphis MSA, which includes nine counties in Tennessee, Arkansas, and Mississippi. Counties that are not in an MSA can be grouped into nonmetropolitan areas, such as the 13-county Southwest Montana nonmetropolitan area. Metropolitan area definitions have changed over time, 3 and many nonmetropolitan areas were consolidated beginning with the 2018 OEWS. 4 For consistency, we assign counties to their May 2021 MSA or nonmetropolitan area for all years. 5
The chief disadvantage of how we delineate labor markets is that we do not bound rural labor markets as well as we might if data were available for counties or commuting zones. Nonmetropolitan areas describe proximate rural counties in some cases, but they can cover very broad areas and stretch the definition of a local labor market past its logical boundary. The East-Central Montana nonmetropolitan area, for example, spans 32 counties and runs more than 450 miles east to west. Massachusetts has just one nonmetropolitan area, covering every non-MSA township in the state, from Williamstown in the northwest to Nantucket Island in the southeast. The OEWS has the most detailed annual level of employment estimates for nonmetropolitan areas that we know of, and we keep nonmetropolitan areas in the main analysis sample so that more rural students are represented. As shown below, results are similar when we focus on MSAs and exclude nonmetropolitan areas, and also when we limit the analysis to nonmetropolitan areas.
Cluster-to-Occupation Crosswalk
Critical to our analysis of alignment is a method for identifying the jobs that are aligned with a student’s CTE coursework. We risk overestimating alignment if we associate too many jobs with a particular set of CTE courses: for example, all service jobs for service-oriented clusters like Finance, Marketing, or Human Services. On the other hand, we risk underestimating alignment if we define too few jobs as aligned with particular CTE sequences. We take a balanced approach and associate a given career cluster’s enrollment in a metro-year with total metro-year employment in occupations that are aligned with that cluster. 6
We group BLS occupation codes within their most relevant CTE career cluster using a crosswalk developed by the Economic Development and Employer Planning System (EDEPS, https://www.edeps.org/). The EDEPS crosswalk assigns one of the 16 major career clusters to all nonmilitary occupations listed in the 2018 version of the Standard Occupational Classification (SOC) coding system, which we merge with 2010 SOCs to cover earlier years of OEWS data. The EDEPS crosswalk is largely identical to an occupation-to-cluster mapping produced by the U.S. Department of Education and last revised in 2012, 7 but with the addition of new and updated occupation codes that were introduced with the 2018 SOC system. Each career cluster is associated with many different occupations, ranging in number from 13 to 134. Pest control jobs (SOC code 37-2021), for example, are grouped with the Agriculture, Food, and Natural Resources cluster in the EDEPS crosswalk as well as the legacy crosswalk from the U.S. Department of Education.
We merge the EDEPS crosswalk with BLS-determined typical entry-level educational requirements for each occupation. Entry-level pest control workers, for example, typically have at least a high school diploma or its equivalent. Soil and plant scientists (SOC 19-1013) are also grouped with the Agriculture, Food, and Natural Resource cluster but typically have a bachelor’s degree at the entry level. These are categorical and somewhat coarse designations, that is, the modal education level for entry-level workers in a particular job. Almost all Education, STEM (science, technology, engineering, and mathematics), and Information Technology jobs are designated as requiring a college education, while almost all Hospitality & Tourism or Manufacturing jobs are designated as requiring a high school education or less. Educational attainment varies widely even within occupations, and BLS designations generally understate the extent of postsecondary education among workers with a particular occupation (Carnevale et al., 2013). Accordingly, we use these designations to divide area employment into two broad totals: jobs where new workers usually need a college education, and jobs where they usually do not. We refer to these as “college-level” and “high-school-level” jobs but acknowledge that they do not represent fixed college or career pathways.
Occupational Employment Estimates
We describe local employment in each occupation, aggregated to the career cluster level via the EDEPS crosswalk, using publicly available information from the BLS on employment at the place-by-year-by-occupation level. The OEWS series reports estimated employment volume and earnings for detailed occupations with SOC codes. OEWS data, published annually and available for MSAs and nonmetropolitan areas, are the result of BLS surveys to a rotating sample of over one million firms who report to state unemployment insurance (UI) systems.
The OEWS is the best available resource for our purposes, with annually estimated job totals at granular geographic and occupational levels, but OEWS estimates exclude occupations that are not covered by UI, such as self-employment. About 10% of U.S. workers are self-employed, and this varies across occupations and industries. Workers in the broad agriculture and natural resource industry, for example, are 27% likely to report being self-employed in the Current Population Survey. 8 Self-employment is less common among younger workers and so may be less relevant to high school CTE students, but nonetheless, self-employment omissions will understate (overstate) alignment to the extent that we undercount total employment related to more (less) popular CTE fields.
We draw on the 2010–2019 May OEWS for results to follow. Comparing OEWS employment statistics for the same area over time is vital for describing alignment with area CTE (especially dynamic alignment), but this is challenging for several reasons. The BLS has periodically changed the set of detailed occupations listed in the OEWS, shifting from SOC 2010 to 2018 in phases and making other ad hoc consolidations and separations of occupation titles. We reduce the practical effect of these changes by aggregating several hundred occupations into 16 career clusters. In addition, we use the 2010 or 2018 SOC where appropriate and reconcile the two using a BLS crosswalk connecting the two systems. We assign any remaining OEWS occupation codes not found in the EDEPS crosswalk to a career cluster based on related job titles or previous codes for the same job title. Other major changes in the OEWS either predate or post-date the OEWS data we use in this analysis, such as a change to the survey reference period in 2002, or COVID-19-era challenges in survey collection for 2020 and 2021.
Administrative Education Data
We have research-practice partnerships with education agencies in Massachusetts, Michigan, Montana, Tennessee, and Washington. Through these partnerships, we have access to student-level, longitudinal data on high school enrollment, course-taking, and CTE career clusters. Administrative data cover the universe of public high school students in each state and span several recent cohorts. Our data agreements do not permit us to pool individual-level data from multiple sites, so the analyses described in the next section rely on student counts that have been aggregated to the year-by-metro level.
We limit each state sample to 12th-grade students observed at least 4 years across Grades 9 through 12, and we assign concentrator status to students who met or surpassed a threshold number of courses in a given CTE cluster. We use a two-course threshold for Massachusetts, Michigan, and Montana and a three-course threshold for Tennessee and Washington. We differentiate our concentrator flag in this way to approximate the same level of CTE intensity across the five-state sample. CTE programming overlaps with general academic coursework to a greater degree in Tennessee and Washington, and a two-course concentrator threshold would overstate CTE engagement in those locations. 9 Our concentrator designation is best thought of as a flag for a student’s potential CTE concentration in a particular cluster. The two-course or three-course rule we use is consistent with federal Perkins V guidance but will differ from official concentrator designations in each state. A formal CTE concentration depends on criteria that we do not always observe in the data, such as a student having taken a specific sequence of courses, or a student’s school being approved to offer a particular CTE program of study. We allow students to be flagged as potential concentrators in more than one cluster.
We sum the number of concentrators in each metro/nonmetro area, cohort, and cluster, suppressing counts less than 10 (that is, leaving those counts missing in the multistate sample). We also compute separate sums for the number of female, male, and Black/Hispanic/Native American concentrators in each area, cohort, and cluster, again suppressing counts less than 10. We omit any suppressed metro-cohort-cluster cells from the analysis, and we show that the general pattern of results is not sensitive to their inclusion with small-cell imputations.
Finally, for each metro-cohort-cluster cell, we merge concentrator counts to OEWS estimates for total employment, employment in jobs where a high school entry-level education is typical, and employment in jobs where a college education is typical. We merge each 12th-grade cohort’s fall year to that year’s May OEWS estimate so that the labor market data are measured as of 1 year prior to the traditional spring graduation. For example, the 2019–2020 cohort in a metro area is linked to the May 2019 OEWS employment estimates for that area.
Table 1 describes the combined education-employment sample. We observe 7 to 10 cohorts of 12th-grade students across the multistate sample, up to and including the 2019–2020 cohort. There are 6 to 18 metro/nonmetro areas and 6 to 16 CTE clusters in each state. Tennessee and Washington follow the 16-cluster National Career Cluster Framework. Michigan does as well but also has a 17th cluster for Energy. We group Energy concentrators with Architecture & Construction concentrators in Michigan based on the state curriculum for the Energy program and the clusters where affiliated jobs (e.g., line workers and pipefitters) are grouped in the EDEPS crosswalk.
Cross-State Sample

Note. The table describes the multistate sample of CTE concentrator counts, by state-defined cluster, matched to area employment in each cluster’s aligned occupations. We define potential concentrators as students with at least two courses in a cluster in Massachusetts, Michigan, and Montana; or at least three courses in a cluster in Tennessee and Washington. We do not apply other criteria used by states for formal concentrator designations, as these vary across states and years and involve additional data that we do not always observe. Cohort refers to the spring of the 12th-grade academic year.
We observe nine clusters for Massachusetts, one of which is a consolidation of four clusters in the national framework. Business Management & Administration, Finance, Human Services, and Marketing are grouped into “Business and Consumer Services” in Massachusetts. In order for the employment data to match the consolidated cluster, we aggregate OEWS estimates for employment in those fields to the same supercluster for Massachusetts. We do not observe concentrator counts for four of the nationally standardized clusters in Massachusetts, and we treat those omissions in the same way that we treat small-cell suppressions. Rather than correlate zero Government & Public Administration concentrators with a nonzero number of Government & Public Administration jobs in the state, we omit that cluster from the Massachusetts subset of the sample. This tends to overstate alignment in results to follow, but as we show, our conclusions are very similar with and without imputations that account for these omissions.
Montana, the smallest and most rural state in the sample, has just six clusters, although each of these can be harmonized with the national framework. Montana’s Family & Consumer Sciences cluster groups together Arts, A/V Technology, & Communications, Education & Training, Hospitality & Tourism, and Human Services. The state’s Industrial Technology cluster combines Architecture & Construction, Manufacturing, STEM, and Transportation, Distribution, & Logistics. In the Montana OEWS data, we follow suit and aggregate employment totals to the appropriate cluster.
The last two rows of Table 1 give a sense of scale between CTE concentrator counts and local employment in aligned occupations. For every 100 workers in a metro-year-cluster combination, there are one to two potential 12th-grade CTE concentrators in the same metro, year, and cluster.
Static Alignment
As a starting point, Figure 1 plots the number of CTE concentrators in a metro, cluster, and year against total employment in the same metro, cluster, and year. Both statistics are expressed in logs to minimize the influence of a small number of very large metropolitan areas, and scatter points represent average values from 100 evenly sized bins. There are 6,692 metro-year-cluster cells depicted in Figure 1. The quadratic fit implies that at the mean, an additional 1,000 local workers in a particular cluster is associated with 6.5 more local concentrators in the same cluster. This is evidence of alignment between CTE and the local workforce, but much of the pattern in Figure 1 is driven by differences in metro size. Larger metro areas may have more students participating in all kinds of programs, CTE or otherwise. Nevertheless, Figure 1 refutes misalignment in scale between area workforces and CTE programs.

Overall alignment between CTE concentrators and area employment.
Figure 2 depicts proportional alignment overall and by typical entry-level education. The horizontal axis of Panel A measures the percentage of total area employment in a given year and metro area that is accounted for by employment in a particular cluster. The vertical axis measures the percentage of all potential 12th-grade concentrators in that same area and year, who are concentrating in that same cluster. Panel A shows that in areas where a cluster accounted for a larger percentage of area employment, the share of concentrators in that field was also larger. For example, in the Detroit, Michigan metro area, just 0.7% of 2017 employment was in Government and Public Administration, versus 17.2% in Business Management & Administration. Among 2017–2018 CTE concentrators in the Detroit area, 0.5% were in Government and Public Administration, whereas 8.7% were in Business Management & Administration. In the Kingsport, Tennessee, metro area (which crosses the state line into Bristol, VA), 1.5% of 2018 employment was in STEM and 11.6% was in Health Science. Among CTE concentrators on the Tennessee side of the metro area, 6.3% were in STEM and 17.0% were in Health Science. We estimate the slope of the fitted line between concentration shares (

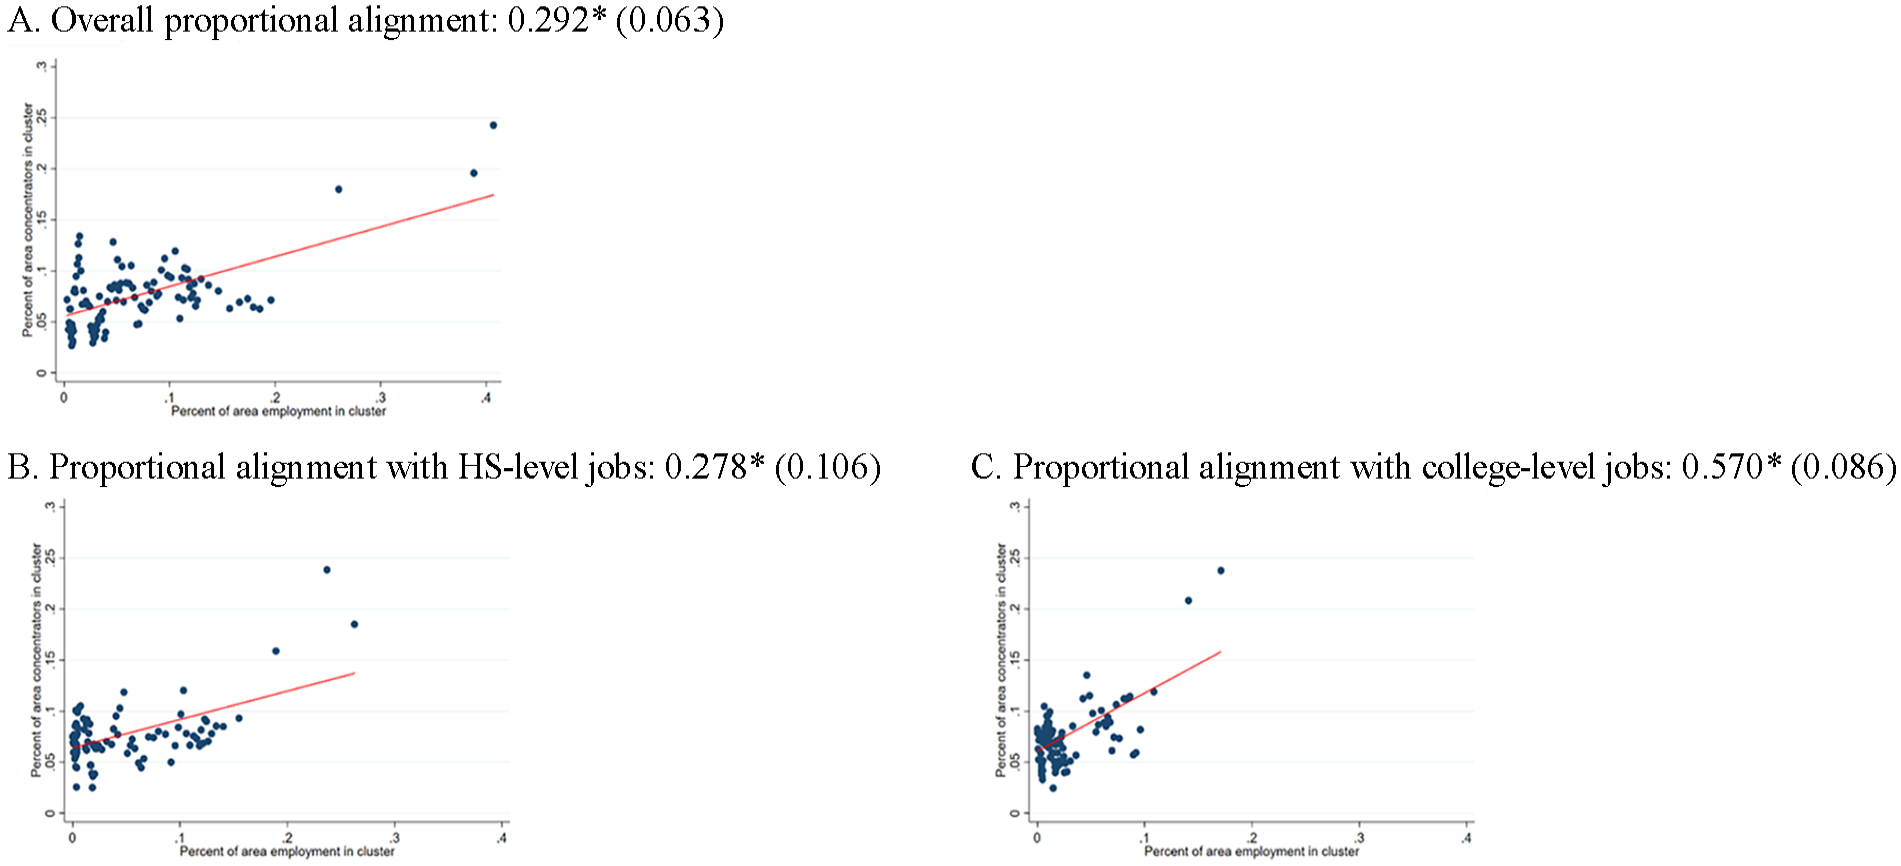
Proportional alignment between CTE concentrators and area employment.
In our preferred, baseline specification of Equation (1), we omit metro-year-clusters with suppressed or unavailable concentrator counts, and we weight estimates by total area employment to account for statistical noise arising from small-city fluctuations in employment and concentrator counts. We estimate standard errors for
Note that
Looking across the whole sample, we estimate the slope of the fitted line in Panel (a) to be
The rest of Figure 2 redefines
Table 2 reports Equation (1) estimates for
Proportional Alignment Estimates—Sensitivity to Weighting, Influence, Imputation, and Metro Definition
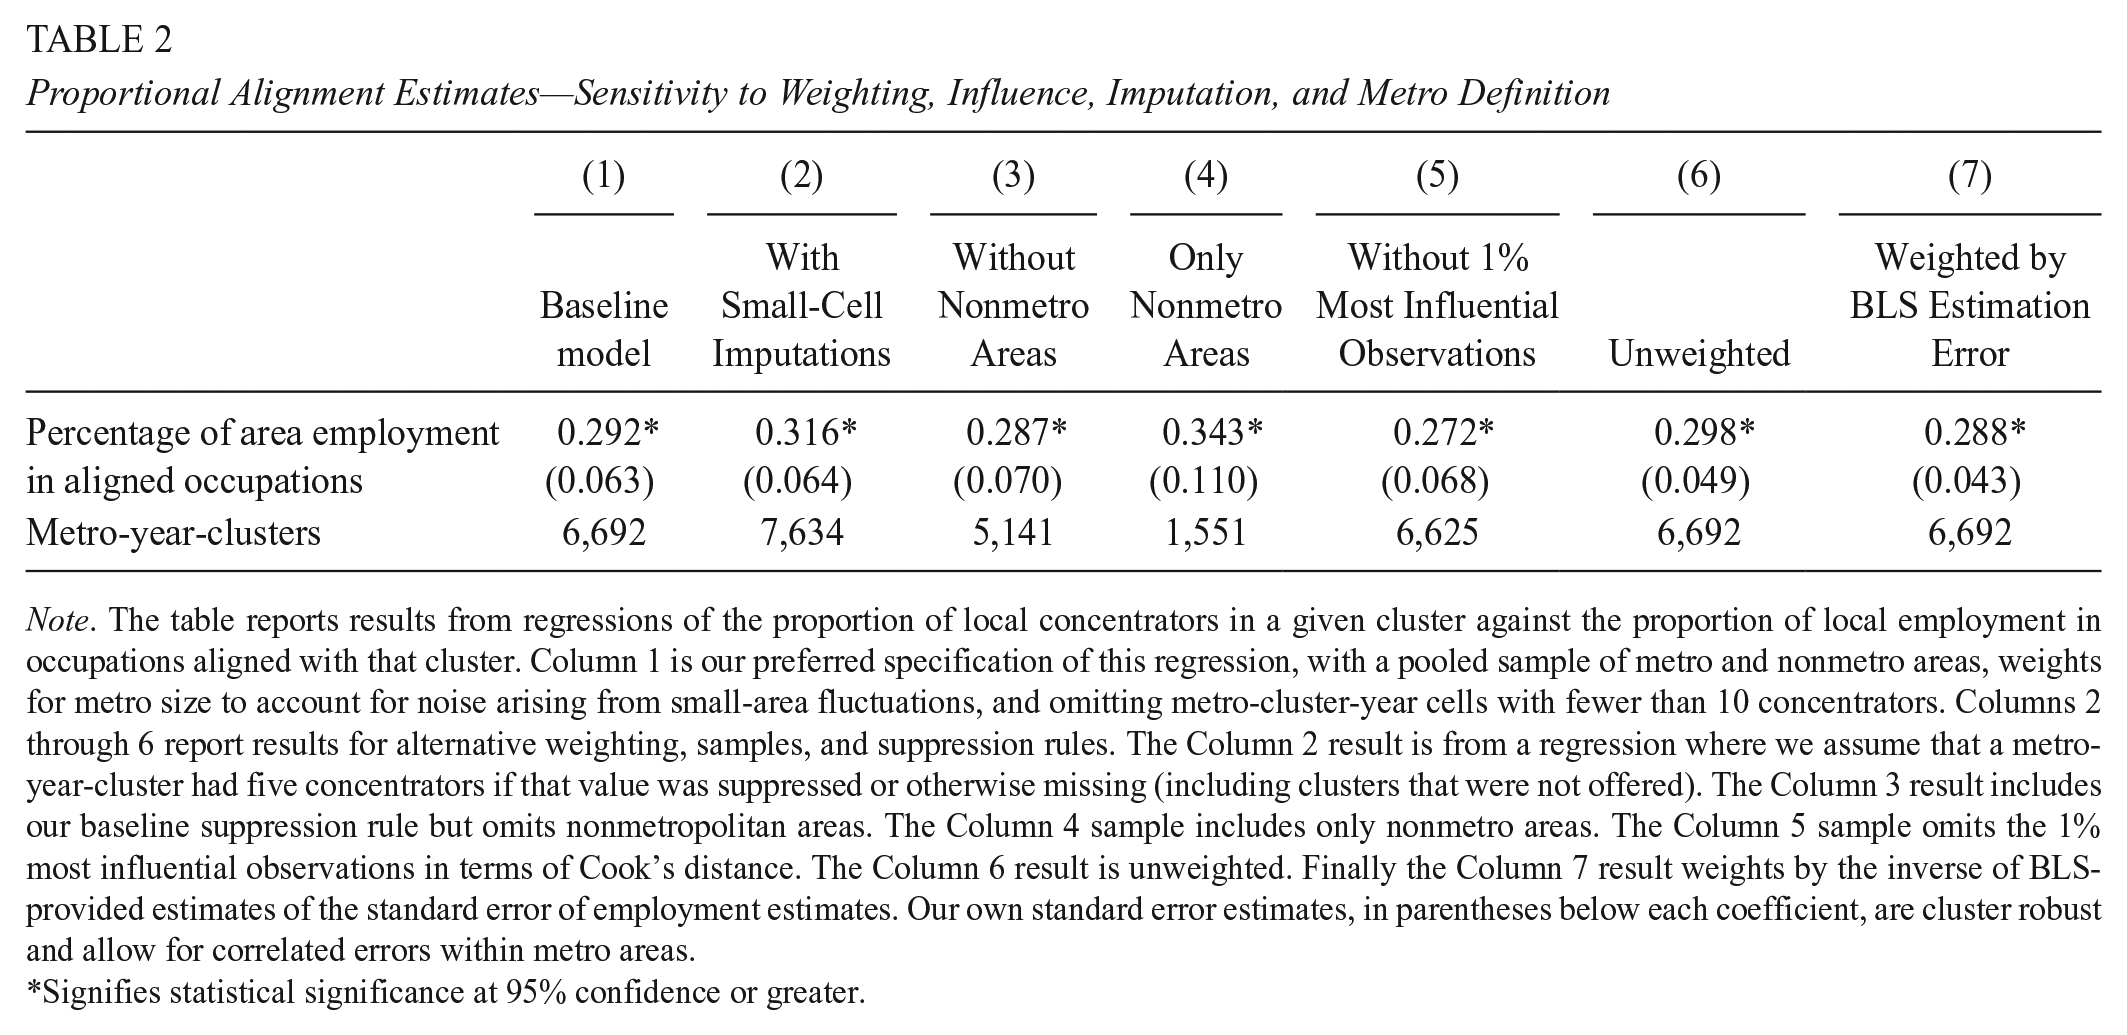
Note. The table reports results from regressions of the proportion of local concentrators in a given cluster against the proportion of local employment in occupations aligned with that cluster. Column 1 is our preferred specification of this regression, with a pooled sample of metro and nonmetro areas, weights for metro size to account for noise arising from small-area fluctuations, and omitting metro-cluster-year cells with fewer than 10 concentrators. Columns 2 through 6 report results for alternative weighting, samples, and suppression rules. The Column 2 result is from a regression where we assume that a metro-year-cluster had five concentrators if that value was suppressed or otherwise missing (including clusters that were not offered). The Column 3 result includes our baseline suppression rule but omits nonmetropolitan areas. The Column 4 sample includes only nonmetro areas. The Column 5 sample omits the 1% most influential observations in terms of Cook’s distance. The Column 6 result is unweighted. Finally the Column 7 result weights by the inverse of BLS-provided estimates of the standard error of employment estimates. Our own standard error estimates, in parentheses below each coefficient, are cluster robust and allow for correlated errors within metro areas.
Signifies statistical significance at 95% confidence or greater.
Figure 3 depicts proportional alignment for two broad groups of CTE clusters, and for three demographic subgroups of students. For Panel (a) and (b) results, we estimate Equation (1) for two subsamples of metro-area-cluster cells. The Panel (a) sample focuses on six technical and/or applied clusters: Agriculture, Food, & Natural Resources; Architecture & Construction; Law, Public Safety, Corrections, & Security; Manufacturing; STEM; and Transportation, Distribution, & Logistics. For Panel (b), we focus on the remaining 10 clusters of business, service, and other fields. We chose this particular division to be in agreement with Massachusetts and Montana cluster consolidations, and because these two superclusters have different education levels in the workforce. Jobs in the technical and applied supercluster tend to have lower entry-level education—36.9% are college-level jobs versus 57.4% in the business, service, and other occupation supercluster. 10 Panels (a) and (b) as well as Equation (1) regression results in panel titles point to a similar degree of proportional alignment for both superclusters.
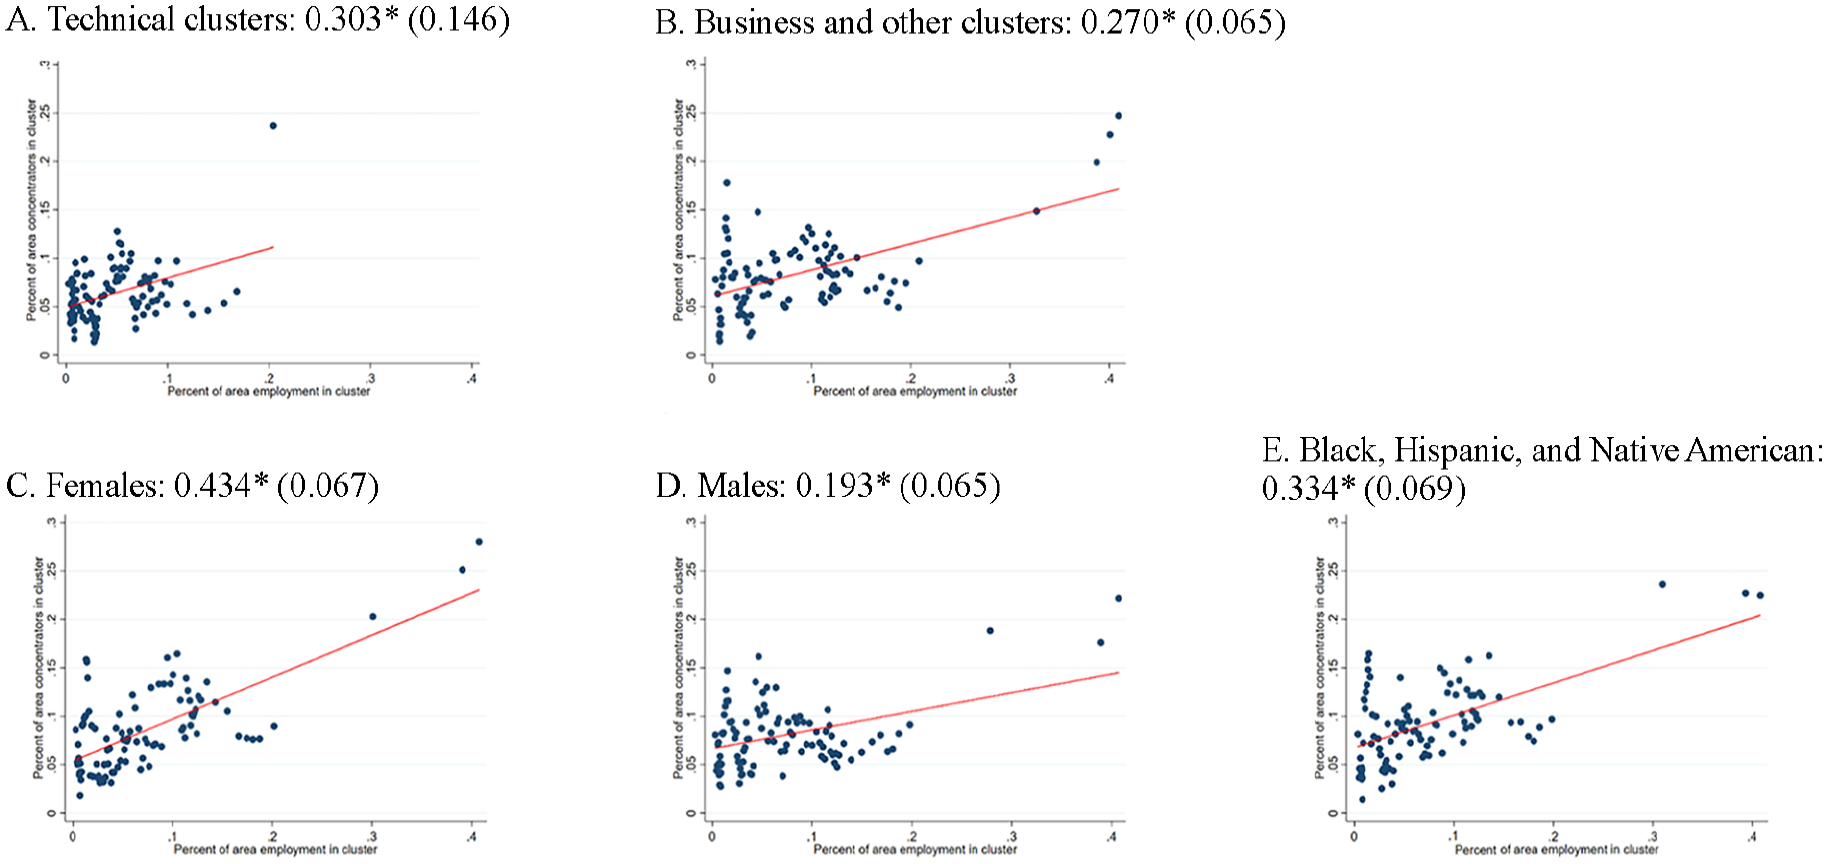
Proportional alignment by supercluster, gender, and race/ethnicity.
Panels (c) through (e) of Figure 3 depict proportional alignment for demographic subgroups: females, males, and racial and ethnic minority students. To generate these figures and subgroup regression results, we first compute the total number of concentrators meeting each demographic criteria in a given metro and cohort, and then the share of each demographic subgroup of concentrators who were in a particular cluster in that metro and cohort. Using Equation (1), we then associate each subgroup’s concentration shares with aligned employment shares in their metro and cohort. For example, Panel (c) reports Equation (1) estimates when
Results indicate that females and racial/ethnic minority students are notably more aligned than males. Returning to an earlier example, if City A has 12% of area employment in Health Science and City B has 2%, female concentrators in City A would be 4.3% more likely to concentrate in Health Science than in City B, on average, Black, Hispanic, or Native American concentrators would be 3.3% more likely, whereas males would be just 1.9% more likely. Omitting metro-year-clusters with missing or suppressed concentrator counts may overstate proportional alignment for all three demographic groups, because total concentrator counts are more likely to fall under the 10-student threshold when we divide state-specific samples into demographic subsets. In results not shown, we find that results for proportional alignment by demographic subsets are very similar if we assume that suppressed metro-year-cluster-demographic cells had 5 concentrators.
Females and non-White students are more aligned with local labor markets due to their better representation in clusters that correspond with the largest parts of the workforce in our five-state sample. Specifically, females and non-White students are two to four times as likely to concentrate in Education & Training, Health Science, and Hospitality & Tourism as males, and those three clusters account for about 30% of total workforce in a typical metro area. Females and non-White students are also 11% to 24% more likely to concentrate in Business, which typically accounts for another 25% of area employment. These fields have a sizable presence in all metro/nonmetro areas across these five states. At least 10% of the workforce is employed in the Business field in every metro area and every year of our panel, and at least 5% of the workforce is employed in Health Science or Hospitality. That is to say, female and non-White CTE concentrators tend to select fields where there are aligned jobs everywhere, while males are more likely to select fields where relevant jobs are more geographically isolated. Information Technology, for example, tends to be a male-dominated CTE field, but only 1 of the 61 metro/nonmetro areas in our sample (Seattle) consistently has at least 5% of its workforce in Information Technology jobs.
Table 3 reports Equation (1) proportional alignment results by supercluster and entry-level education. For comparison, Figure 2 findings for overall alignment and alignment with HS-level and college-level jobs are repeated in the first block of results (“All Clusters”). Turning to the technical/applied supercluster and the middle block of results, we find that concentrators in these fields are more aligned with HS-level jobs than with college-level jobs. In fact, concentrator shares in these fields do not significantly rise with college-level employment shares in aligned occupations. By contrast, concentrators in the more college-oriented supercluster spanning business, service, and other occupations (third block of Table 3 results) are much more aligned with college-level jobs in the area than with HS-level jobs. The
Proportional Alignment by Supercluster and Entry-Level Education

Note. The table reports results from Equation (1) regressions of the proportion of local concentrators in a given cluster against the proportion of local employment in occupations aligned with that cluster. Each model follows the baseline specification described in Table 2, Column 1, but for a subset of clusters. The Column 1 model describes proportional alignment with respect to all area occupations. Column 2 describes proportional alignment with respect to jobs where the typical entry-level education is a high school diploma or less. Columns 3 describes proportional alignment with jobs where the typical entry-level education is some college or a degree. All Equation (1) estimates are weighted by metro size. Standard errors, in parentheses below coefficients, allow for correlated errors within metro areas.
Signifies statistical significance at 95% confidence or greater.
Table 4 results explore demographic trends from Figure 3 in more detail, breaking out proportional alignment by demographic subgroup and entry-level education. Findings reported in the first block of results indicate that females are proportionately one-for-one aligned with local college-level jobs. The
Proportional Alignment by Entry-Level Education and Gender, Race/Ethnicity
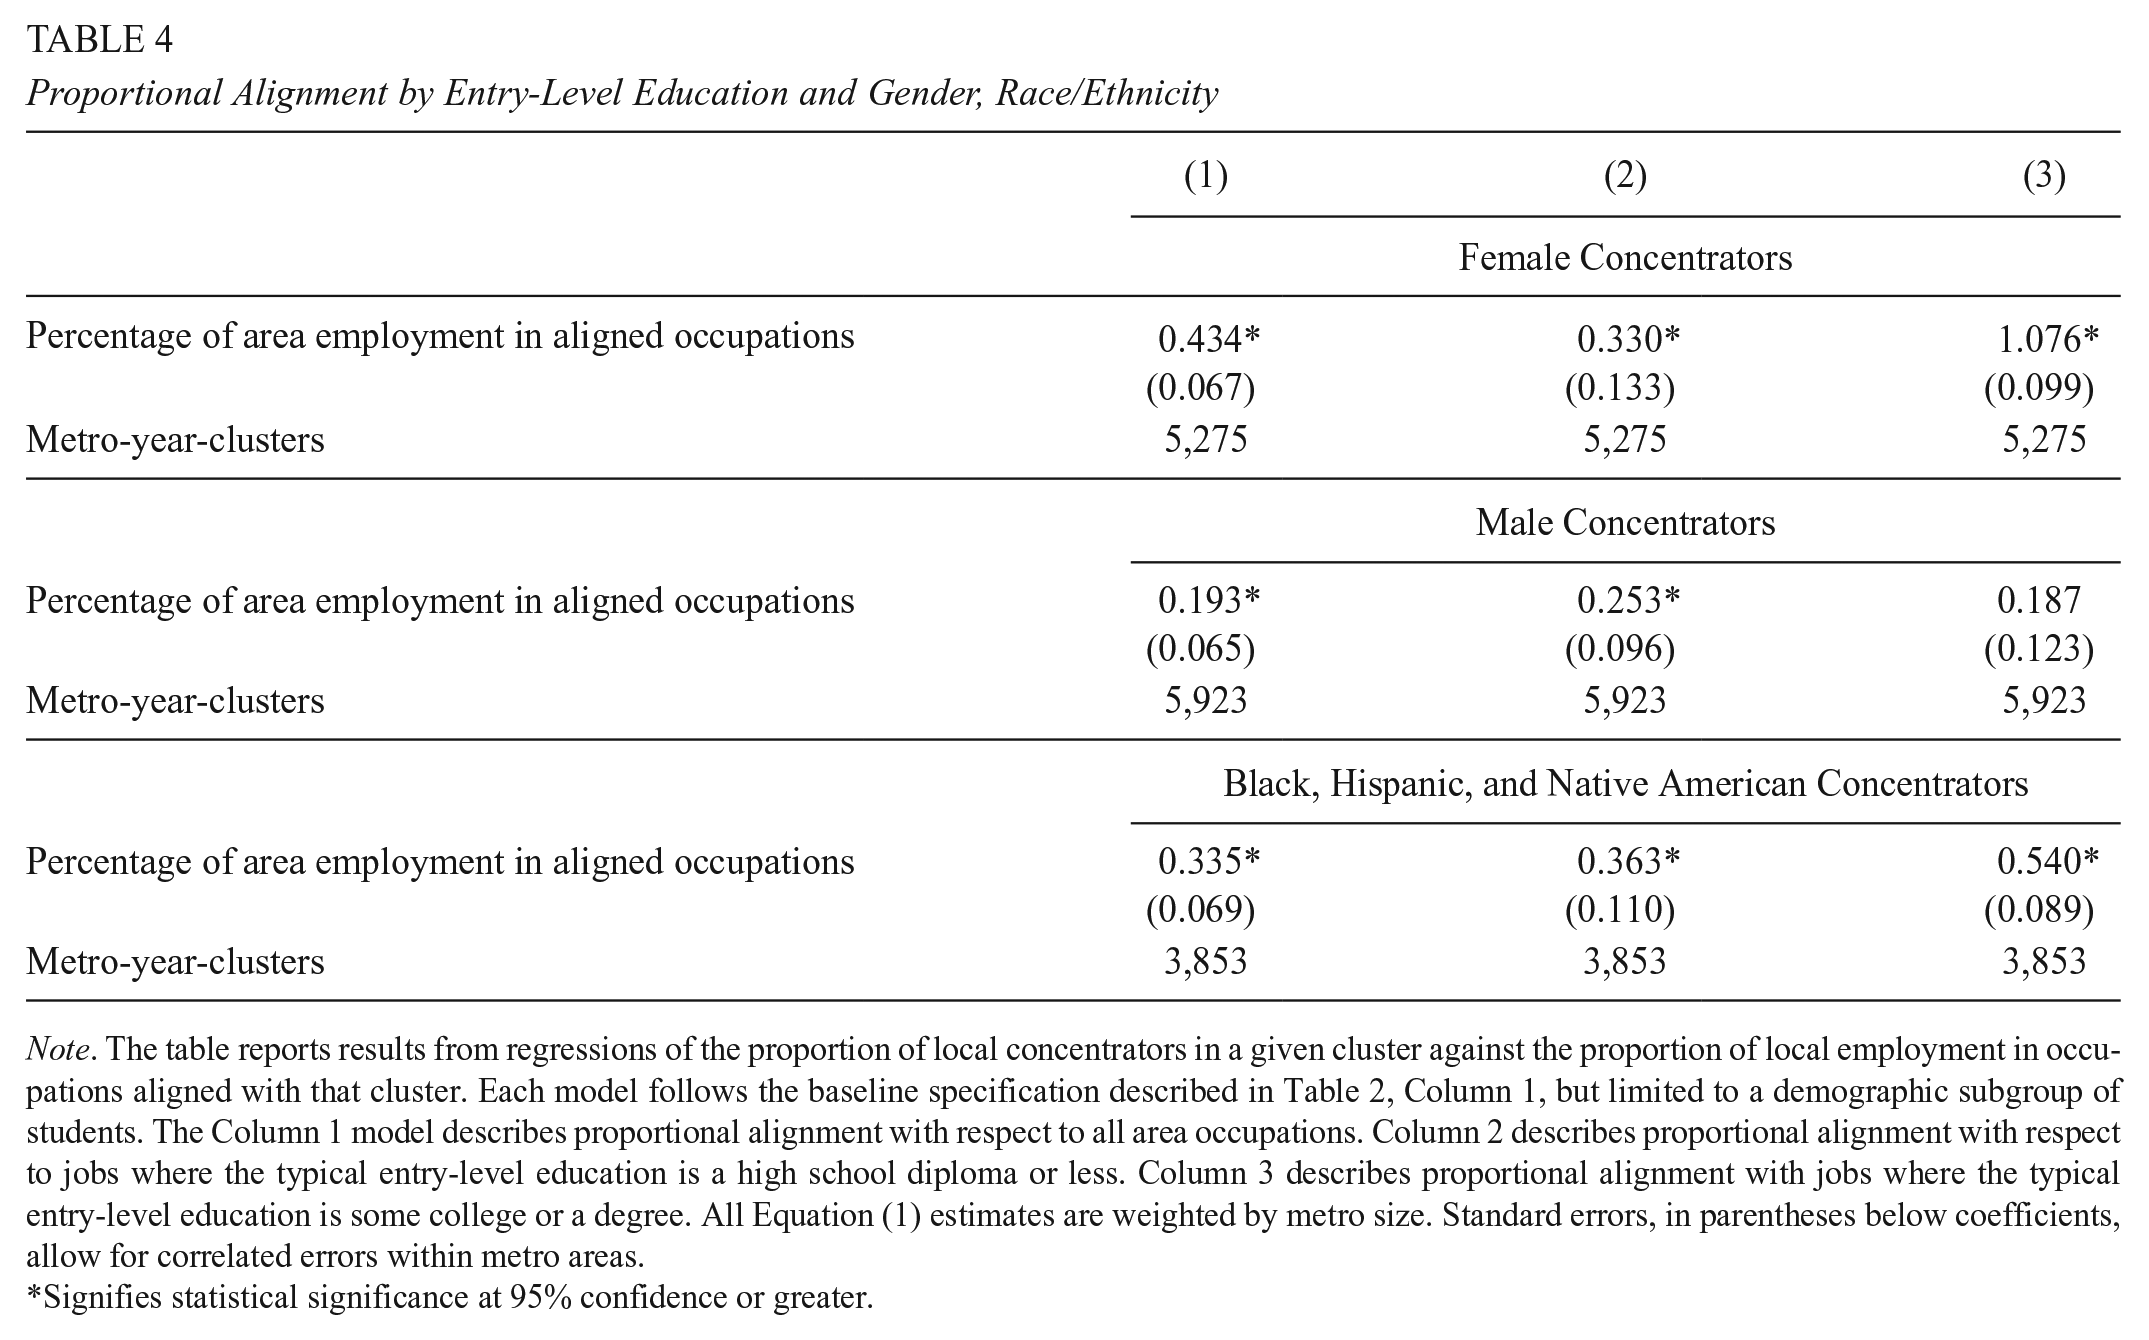
Note. The table reports results from regressions of the proportion of local concentrators in a given cluster against the proportion of local employment in occupations aligned with that cluster. Each model follows the baseline specification described in Table 2, Column 1, but limited to a demographic subgroup of students. The Column 1 model describes proportional alignment with respect to all area occupations. Column 2 describes proportional alignment with respect to jobs where the typical entry-level education is a high school diploma or less. Column 3 describes proportional alignment with jobs where the typical entry-level education is some college or a degree. All Equation (1) estimates are weighted by metro size. Standard errors, in parentheses below coefficients, allow for correlated errors within metro areas.
Signifies statistical significance at 95% confidence or greater.
Dynamic Alignment
The extent of CTE-workforce alignment at a point in time is interesting regardless of the causal channels connecting one to the other. Results discussed so far indicate that there is a significant degree of similarity, in proportion and scale, between CTE student concentrations and area employment. But the industrial and occupational makeup of a place changes over time, and it is unclear if CTE students and their schools undergo similar shifts, away from declining fields or toward growing fields.
Figure 4 depicts our first look at dynamic alignment across these five states, plotting the 3-year change in each area’s total concentrators in a given field (vertical axis, in log scale) against the 3-year change in each area’s total employment in that field (horizontal axis, in log scale). In order to smooth out noise from year-to-year fluctuations in concentrator counts and employment, the beginning and end of each 3-year period are computed as the average of the current and prior year. Most points in the figure fall in the top-right quadrant, meaning that growing employment in a field is associated with a growing number of concentrators in that field. The slope of the fitted line indicates that for each 10% increase in a field’s employment level in an area, concentrators in that field grow by about 1%.

Overall dynamic alignment between CTE concentrators and area employment.
Figure 5 plots 3-year changes in concentrator shares by field against 3-year changes in employment shares. There is no significant relationship between the two. Results in the previous section consistently pointed to proportional alignment at a given point in time, but Figure 5 shows that CTE concentrators’ proportional alignment does not shift simultaneously with the area labor market.

Proportional dynamic alignment between CTE concentrators and area employment.
Even though the 3-year windows depicted in Figures 4 and 5 would have accounted for most of a student’s time in high school, it is possible that student and school responses to area changes in the workforce take more time to manifest as changes in concentrator counts or shares. CTE program and cluster offerings go through district and state approval processes that would hinder an immediate realignment with the area workforce, and knowledge about labor market changes might not be immediately apparent. Even with perfect insight into local labor market dynamics and the ability to adjust course offerings in real time, students and schools might prudently wait to judge if employment shifts are going to be long-lasting. In order to examine dynamic alignment in more detail, we estimate the following:

where
Table 5 reports Equation (2) results for all occupations, HS-level occupations, and college-level occupations, and for different lags of
Dynamic Alignment, by Entry-Level Education and 0- to 4-Year Lagged Employment

Note. The table reports results from Equation (2), specifically the correlation between lagged or current employment (measured as a rolling two-year average, in logs) and the number of 12th graders concentrating in aligned fields. Controlling for area-by-cluster and year fixed effects, coefficients quantify the extent to which within-area changes in lagged employment in particular fields is associated with within-area changes in the number of concentrators in those fields. Estimates are weighted by metro size. Standard errors, in parentheses below coefficients, allow for correlated errors within metro areas.
Signifies statistical significance at 95% confidence or greater.
The middle block of Table 5 results focuses on dynamic alignment with HS-level jobs. Estimates for
CTE Availability
Static and dynamic alignment results discussed so far represent a mix of student-level decisions about which CTE classes to take as well as school, district, and state decisions about which CTE fields to offer. We can begin to get a sense of whether CTE supply plays a role in enrollment-employment alignment by associating the likelihood that a metro-year-cluster surpasses our threshold measure of enrollment (i.e., 10 students) with employment shares in aligned jobs. Specifically, we estimate the following to characterize the static alignment of access to a CTE cluster c with area jobs in cluster c.

where
Table 6 reports Equation (3) results for aligned cluster availability overall, by technical or service supercluster, and with respect to HS-level and college-level employment. Overall, we find evidence to suggest that a cluster is more likely to be available in metro areas where a larger share of the workforce is employed in jobs aligned with that cluster. Specifically, each 1-percentage-point increase in a cluster’s local employment share corresponds with a 0.76-percentage-point higher likelihood that the area offers that cluster and has at least 10 potential concentrators. Cluster availability is even more likely in areas with more employment in aligned college-level jobs. Table 6 also shows that access to technical and applied clusters is not more or less likely in areas with more employment in aligned jobs, whereas business, service, and other clusters are much more likely to be available in metros with more jobs in those areas.
Alignment Between CTE Cluster Availability and Local Employment.

Note. The table reports results from Equation (3) regressions of the availability of a given CTE cluster, proxied by having at least 10 potential concentrators in a metro area and cohort, against the proportion of local employment in occupations aligned with that cluster. The Column 1 model describes proportional alignment with respect to all area occupations. Column 2 describes proportional alignment with jobs where the typical entry-level education is a high school diploma or less. Column 3 describes proportional alignment with jobs where the typical entry-level education is some college or a degree. The second and third rows of results are from Equation (3) specifications limited to a subset of clusters. Standard errors, in parentheses below coefficients, allow for correlated errors within metro areas.
Signifies statistical significance at 95% confidence or greater.
Finally, Equation (4) estimates the dynamic relationship between changes in area employment in metro m, cluster c, and the availability of cluster c to students.

Table 7 reports Equation (4) results, where we show that cluster availability exhibits little to no association with aligned employment fluctuations. If anything, growth in a particular field’s total employment is followed by a small decrease in the likelihood that field has at least minimal CTE enrollment one year later. There is a very limited amount of year-to-year variation in the number of clusters offered in a given area, so it is perhaps not surprising that we find no evidence of dynamic alignment with respect to cluster availability. Just 20% of metro areas in our five-state sample offer a different number of clusters over time. Looking across Tables 5 and 7, it seems that both CTE availability and CTE enrollment exhibit little to no perceptible change following growth in a field’s local footprint in the workforce.
Dynamic Alignment Between CTE Cluster Availability and Local Employment
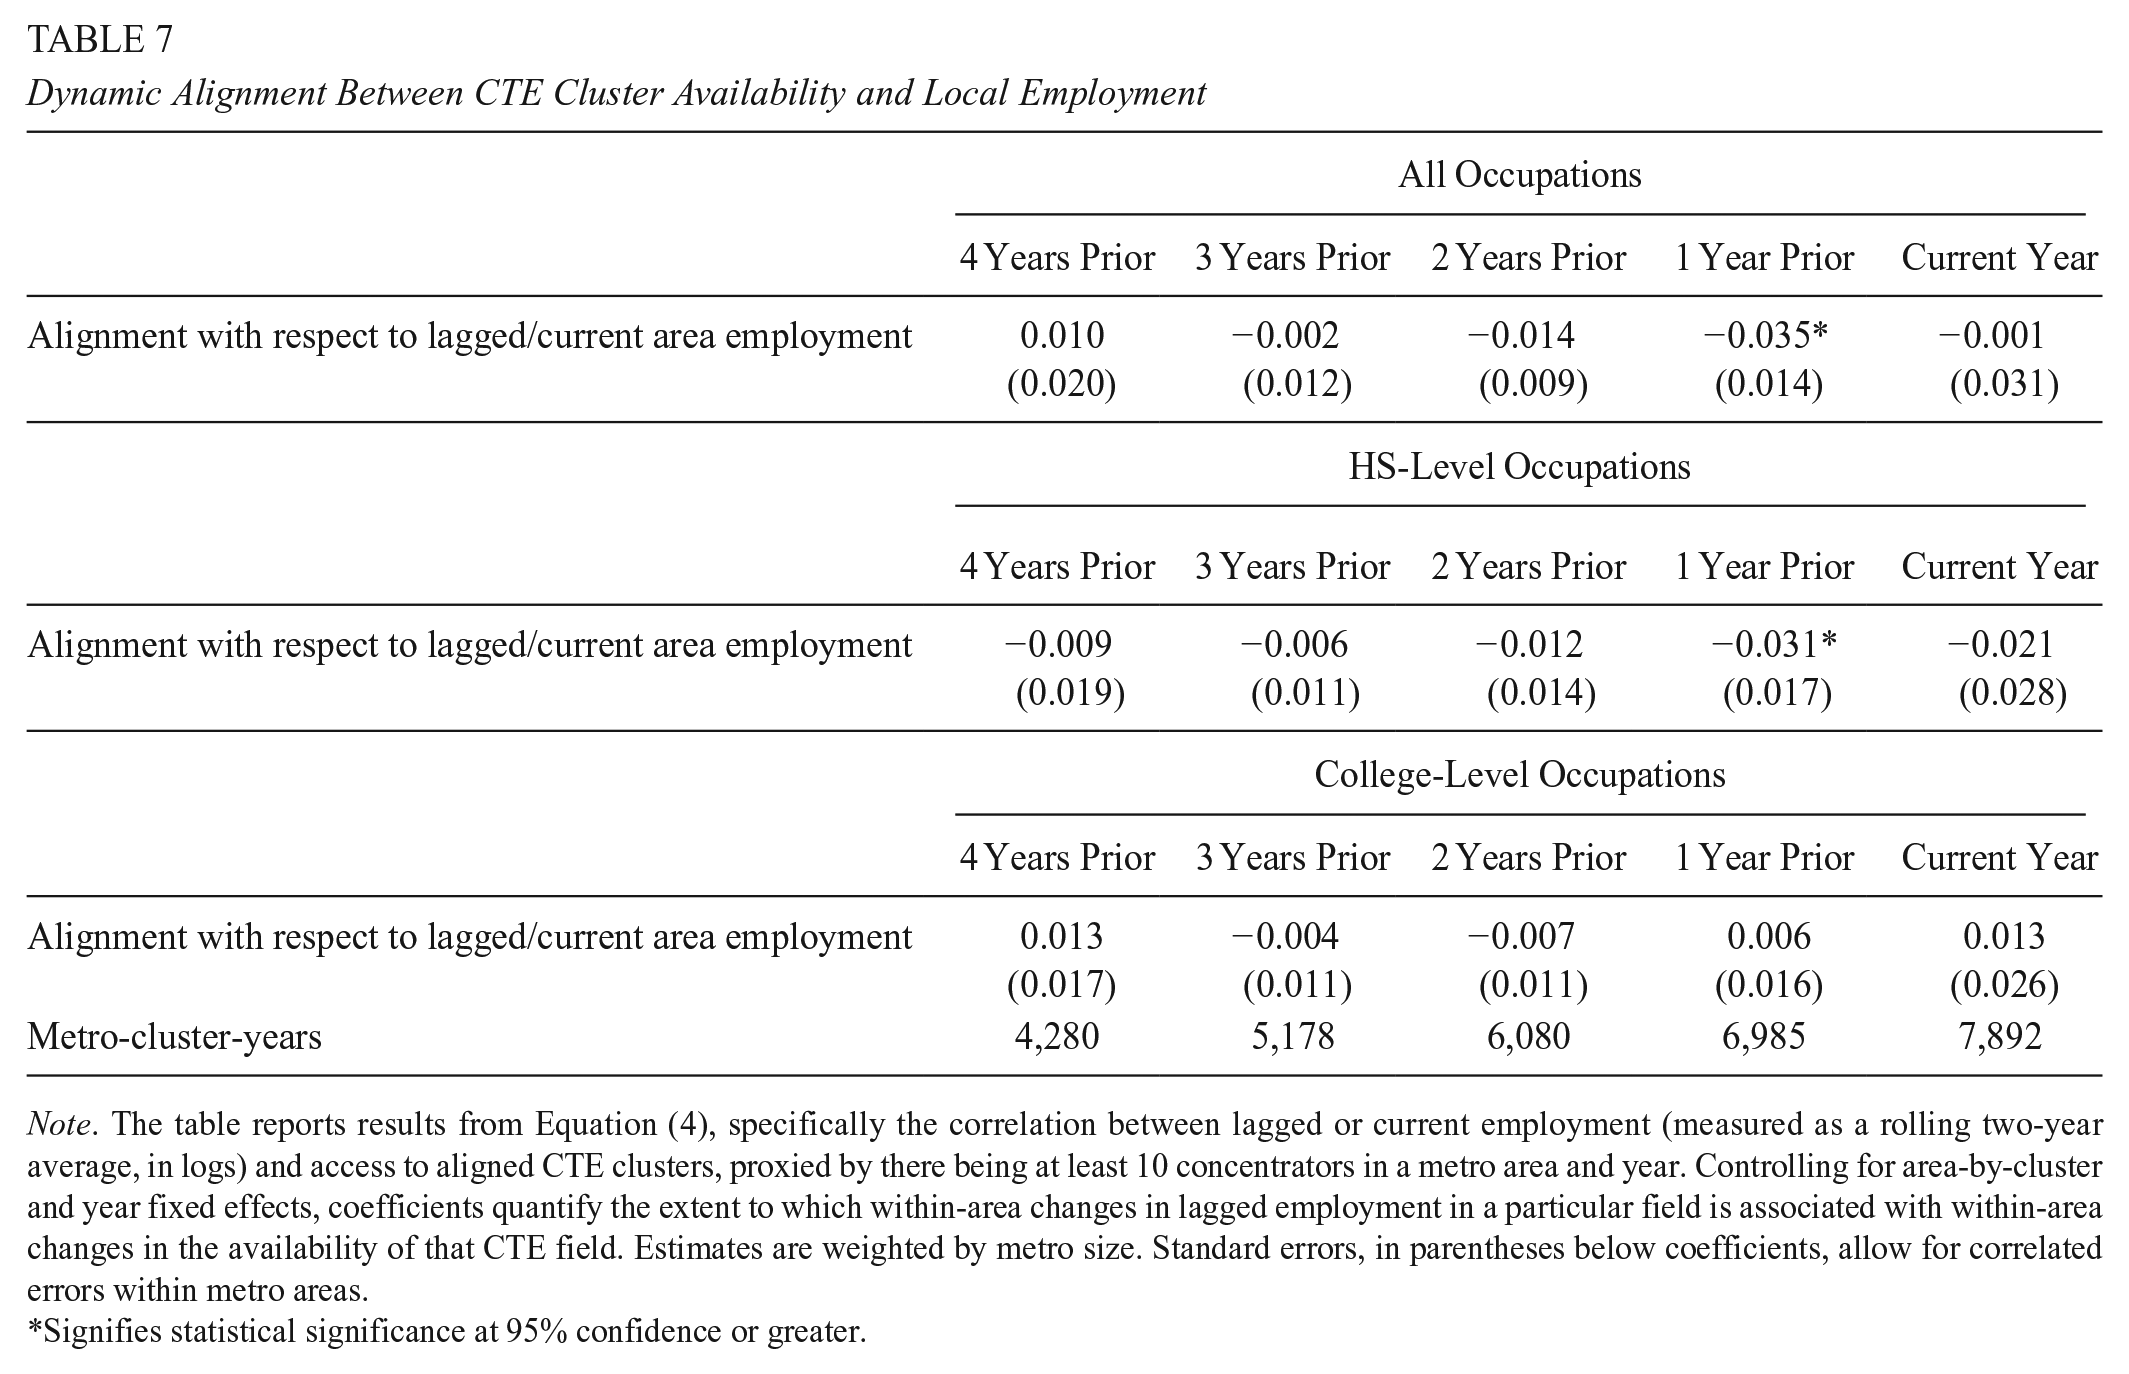
Note. The table reports results from Equation (4), specifically the correlation between lagged or current employment (measured as a rolling two-year average, in logs) and access to aligned CTE clusters, proxied by there being at least 10 concentrators in a metro area and year. Controlling for area-by-cluster and year fixed effects, coefficients quantify the extent to which within-area changes in lagged employment in a particular field is associated with within-area changes in the availability of that CTE field. Estimates are weighted by metro size. Standard errors, in parentheses below coefficients, allow for correlated errors within metro areas.
Signifies statistical significance at 95% confidence or greater.
Tables 6 and 7 can help to contextualize some of our earlier findings on static and dynamic alignment. For example, a positive association between college-level jobs and the availability of related CTE fields may help to explain why we observe more alignment at a point in time between college-level jobs and CTE enrollment, and in particular between college-level jobs and enrollment in business, service, and other clusters (Figure 2 and Table 3). Relative to technical, applied, and hands-on fields, CTE clusters in business, services, and other areas may be less costly to initiate or expand, in which case they could be more responsive to area labor needs. That being said, Table 7 results indicate that more access to a cluster does not tend to quickly follow growth in affiliated jobs, which likewise may help to explain why we see little evidence of dynamic CTE-workforce alignment overall. Again, we caution against making causal inferences from our descriptive findings, but we hope that they will motivate future work on the effect of labor market dynamics on access to CTE, and in turn, on aligned CTE enrollment.
Conclusions, Policy Implications, and Future Research
We offer new evidence from five diverse states that CTE systems are somewhat aligned with local labor markets, at least in a static and proportional sense. The distribution of jobs across career clusters in a metro or nonmetro area is significantly correlated with the distribution of 12th-grade CTE concentrators across those same career clusters. This static alignment is more pronounced for female and racial/ethnic minority concentrators, which we can attribute to women and non-White students having better representations in Business, Education, Health, and Hospitality, fields that consistently occupy a larger share of the workforce in all metro/nonmetro areas.
Evidence of dynamic alignment is weaker. The size of a cluster’s 12th-grade CTE cohort adjusts to changes in that cluster’s area employment, but by a small degree after 2 to 3 years. This modest readjustment is inconsistent across states and only observed following changes in college-level jobs. CTE concentrator populations do not significantly change following changes in area HS-level jobs. We likewise find evidence of static alignment between a CTE cluster’s availability and related occupations, but no corresponding growth in availability following growth in related occupations.
What might explain static without dynamic alignment? How can CTE students and workers resemble each other in a snapshot if they do not also move together over time? It may be the case that CTE adjustments move more gradually than we can detect over 7 to 10 cohorts. Another possibility is that students and schools do not view year-to-year workforce fluctuations as large or long-lasting, and that they do not update their employment outlook in ways that would change their CTE choices. Our sample spans a time period with more economic expansion than contraction, and cohorts whose high school experience was largely unaffected by the 2020 pandemic and ensuing economic volatility. It is possible that larger labor market shocks, such as those following the onset of the pandemic or the opening of Tennessee’s “Blue Oval City,” might elicit more of a response from schools and students.
Our findings have implications for CTE policy and the workforce more broadly. Evidence of static alignment suggests that enrollment in a particular CTE field may signal whether or not CTE directors will be able to justify workforce demand for those fields when they complete the local needs assessments required by Perkins V. Programs with relatively more concentrators will tend to correspond with more aligned employment in the surrounding area, while less popular programs may align with a smaller share of the labor market. Dynamic alignment will be necessary to sustain CTE programming justifications over time as the workforce evolves toward some fields and away from others. Generative artificial intelligence, for example, is expected to affect industries and occupations that were insulated from previous waves of technological advancement (Kochhar, 2023). CTE will need to adapt to a greater degree than we observe if districts wish to maintain or improve measures of alignment. Almost all of our sample predated Perkins V, however, and it is not yet clear if newer CTE funding and accountability frameworks will elicit more dynamic alignment.
Our new measures of static and dynamic alignment push what we know about CTE-workforce alignment, but with a number of limitations. First, results are limited to five states and prepandemic cohorts. This advances what we might learn from a single state, but nonetheless, appending our findings with analyses from other contexts would help us understand if and why alignment differs across the United States, and in the midst of postpandemic labor shortages. Second, narrower or wider characterizations of labor markets—such as counties, commuting zones, adjacent-cohort outcomes, or states—may help us better understand the level at which the labor market is salient to students. Similarly, our characterization of alignment relies on occupation-to-cluster crosswalks that can be broadened or narrowed to connect CTE to more jobs, or only to the most related jobs.
One of our most important limitations is that results are purely descriptive. We have correlated area employment with aligned CTE populations (and changes therein), but our research design does not permit causal inferences about the responsiveness of CTE students and their schools to local labor markets, or vice versa. Limited evidence of dynamic alignment is consistent with the possibility that students are not very aware of the employment or earnings outlook for their CTE field or not very responsive to changes in the labor market environment (Baker et al., 2018; Beffy et al., 2012; Wiswall & Zafar, 2015), as well as the possibility that schools are constrained in their ability to expand or contract programs. More direct tests of these mechanisms would be a fruitful area for future research and would help to identify policy and practice levers that credibly affect CTE-to-workforce alignment.
Another self-imposed limitation, however, is that we make no inferences about whether alignment benefits students. There are wide calls for well-aligned CTE from policymakers, chambers of commerce, and academics. We have presented one way to quantify alignment that will be easy to apply to other places and times, and we have also documented levels of alignment that can serve as benchmarks. In the static sense, roughly 3% more CTE concentrators in areas with 10% more aligned jobs would match our estimated measures of alignment, and any persisting amount of dynamic alignment would exceed what we observe. But it is unclear if these or other levels of alignment are best for students or the workforce. Even if schools could identify in-demand jobs and align CTE programs to suit them very quickly, we do not know if this will serve students well over their careers. We cannot foresee if today’s in-demand skill will be obsolete in a short time. Graduates with technical skills may move seamlessly into well-paying work (Kemple & Willner, 2008) and help to address the perceived shortage of middle-skill workers. There is a risk, however, that CTE will crowd out general skills that transfer between occupations and survive technological change (Hanushek et al., 2017) or keep up with firms that can move more easily than households. There is also a risk that policy efforts in pursuit of better-aligned CTE will limit the ability of CTE, and secondary education more broadly, to drive economic change in an area by introducing new skillsets into the workforce, or by making some industries more viable. We leave to future research the causes of static and dynamic alignment, which may include student and school responses to area labor markets, and the consequences of CTE-workforce alignment for students in the years after high school.
Footnotes
Acknowledgements
The authors are grateful for productive research partnerships with state and local education agency personnel in Atlanta, Massachusetts, Michigan, Montana, and Washington. We are also grateful for thoughtful comments and suggestions from three anonymous reviewers as well as seminar and conference participants at the Association for Public Policy Analysis and Management, Southern Economic Association, New York Federal Reserve, and Tennessee Education Research Alliance.
Declaration of Conflicting Interests
The author(s) declared no potential conflicts of interest with respect to the research, authorship, and/or publication of this article.
Funding
The author(s) disclosed receipt of the following financial support for the research, authorship, and/or publication of this article: This study is a product of the Career and Technical Education Policy Exchange (CTEx, ![]() ), with support from an anonymous foundation. All errors and opinions are our own and should not be attributed to our state research partners or funders.
), with support from an anonymous foundation. All errors and opinions are our own and should not be attributed to our state research partners or funders.
Open Practices
Notes
Authors
CELESTE K. CARRUTHERS is the Fox Distinguished Professor of Economics at the University of Tennessee-Knoxville, 2280 Sutherland Ave Suite 228, Knoxville, TN 37919; and a Research Associate at the National Bureau of Economic Research;
SHAUN DOUGHERTY is a professor of education & policy at Boston College’s Lynch School of Education & Human Development, 140 Commonwealth Avenue Chestnut Hill, MA 02467;
THOMAS GOLDRING is the director of research at the Georgia Policy Labs, Georgia State University, 55 Park Place NE, Atlanta, GA 30303;
DANIEL KREISMAN is an associate professor of economics at Georgia State University, 55 Park Place NE, Atlanta, GA 30303; and research fellow at the Institute for Labor Studies (IZA);
RODDY THEOBALD is deputy director of the National Center for Analysis of Longitudinal Data in Education Research (CALDER) and managing researcher at American Institutes for Research, 3876 Bridge Way North, Suite 201, Seattle, WA 98103;
CARLY URBAN is a professor of economics at Montana State University, Linfield Hall, Bozeman, MT 59717, and a research fellow at the Institute for Labor Studies (IZA);
JESÚS VILLERO is an economist at the Penn Wharton Budget Model, University of Pennsylvania’s Wharton School, 3440 Market Street, Suite 300 Philadelphia, PA 19104;