
Abstract
Research suggests that longer commute times may increase employee turnover probabilities by increasing stress and reducing job attachment and embeddedness. Using administrative data from a midsized urban school district, we test whether teachers with longer commute times are more likely to transfer schools or exit the district. Both descriptively and in regression results employing multiple fixed effects, we find that teachers with longer commutes are more likely to transfer schools within the district. Regression results show that each 5-minute increase in one-way commute time predicts an increase in transfer probability of 0.8 to 1.0 percentage points over most of the commute time distribution. We also find evidence that teachers with the longest commutes (i.e., 40+ minutes each way) have higher district exit probabilities. Moreover, teachers with longer commute times are absent from work more frequently and receive lower observation ratings. We discuss potential implications for local human resources policy and practice.
Keywords
Numerous studies have demonstrated that teacher turnover can harm school and student outcomes. These studies have demonstrated that high teacher turnover has disruptive effects on schools (Ronfeldt et al., 2013), can negatively affect the composition of the school’s instructional staff over multiple years (Sorensen & Ladd, 2020), and may be especially detrimental in schools with already-low achievement (Hanushek et al., 2016). Understanding of the consequences of teacher turnover has fueled decades of research on its drivers (see Grissom et al., 2016; Guarino et al., 2006, for reviews). This research has established that working conditions—the factors that shape the context of a teacher’s work—play a major role in educators’ decisions to stay in their schools.
One understudied facet of educators’ working conditions is the length of their commutes to work. Research outside education links longer commutes to multiple negative work-related and personal outcomes for workers. Workers with longer commutes experience diminished subjective well-being than similar workers with shorter commutes, including more psychological stress and burnout (Amponsah-Tawiah et al., 2016; Kluger, 1998; Mouratidis, 2020), higher levels of family conflict (Bai et al., 2021; Roberts et al., 2011), less time dedicated to social activities (Besser et al., 2008; Hilbrecht et al., 2014), and lower job-embeddedness (Krausz et al., 1998; Purba, 2015). These consequences of longer commute times may push workers to leave their workplaces. They may also affect other job outcomes that are a function of working conditions, such as absenteeism, which have consequences for students (e.g., Herrmann & Rockoff, 2012).
While studies have highlighted that commute times can factor into teachers’ work decisions (e.g., Engel et al., 2014; Gershenson, 2012; Horng, 2009; Marinell & Coca, 2013; Viano et al., 2021), few studies have directly examined the potential connection between teachers’ travel time from work to home and their likelihood of turning over. Studies have examined whether commute time changes the probability of applying for a teaching position (Engel et al., 2014) and the extent to which commute time is associated with turnover intentions (Marinell & Coca, 2013), but research has not linked commute time and observed turnover across a population of full-time teachers.
Filling this gap in the literature, this study tests whether commute times predict teachers’ likelihood of leaving their jobs. As a supplement to this analysis, we examine whether longer commutes predict being absent from work and job performance, as measured by classroom observations. Specifically, we ask, first, to what extent does travel time for teachers vary by school and teacher characteristics? Second, to what extent does travel time predict a teacher’s likelihood of transferring schools or exiting the district? And finally, to what extent is increased travel time associated with teacher absences and effectiveness?
To answer these questions, we draw on human resources and other administrative data from Metropolitan Nashville Public Schools, a countywide urban school district in the southeastern United States that serves approximately 85,000 students. The data include home and work addresses for teachers, which we use to estimate typical commute times with traffic mapping software. The data permit us to observe teacher turnover and contain direct measures of teacher absences and performance.
We begin by describing teacher commute times overall and conditional on teacher and school characteristics. We then take a two-step approach to linking turnover, absences, and job performance to commute times. First, we show the relationships descriptively. For district and school leaders, these descriptive relationships have practical value because they point to likely outcomes of hiring teachers with different commute lengths. Second, we estimate models of each outcome as functions of commute time and other observable factors, employing school and home zip code fixed effects to compare teachers in the same school environment and living in similar neighborhoods. Although they do not necessarily produce causal estimates, these models help account for many other factors that might drive both a teacher’s commute time and the outcomes we consider.
We find that teachers with long commutes are substantially more likely to transfer to another school in the district and to exit the district. Descriptively, transfer probabilities are approximately twice as large for teachers with one-way commutes of more than 45 minutes than for teachers with 5-minute commutes, and are 3 times as large when comparing observably similar teachers in the same school. Exit probabilities are higher among teachers with commutes greater than 40 minutes than for teachers with shorter commutes. Teachers with the shortest commutes are absent about 1.5 days fewer per year, on average, than teachers with the longest commutes, and teachers with shorter commutes receive observation ratings that are somewhat higher. These results underscore the importance of teacher commute times for our understanding of teacher working conditions and the teacher labor market more generally.
How Commutes Can Drive Workplace Satisfaction and Turnover
In this section, we explore potential mechanisms through which commutes can affect worker turnover. We adapt a conceptual framework from Calderwood and Mitropoulos’s (2021) review of commuting spillover. In this adapted framework, which we depict in Figure 1, characteristics of a worker’s commute produce stressors that lead to physiological or emotional strains on the worker. These strains spill over into their work and personal lives, creating pressures to turn over to mitigate these negative impacts. In what follows, we develop this framework in more detail for workers in general, then apply it to the case of teachers.

Conceptual framework.
Commute Characteristics, Stress, and Strain
Our framework highlights how characteristics of the commute can result in adverse outcomes. Following Calderwood and Mitropoulos (2021), we distinguish among the characteristics of the commute, commuting stressors, and commuting strain (shown to the far left of Figure 1). Characteristics of the commute are, simply, objective factors that describe the commute, such as the time, length, and mode of the commute. These characteristics can produce commuting stressors, to the extent that they are subjectively perceived by commuters to create stressful commuting experiences (Koslowsky, 1997). These stressors can lead to commuting strain: the physiological and emotional responses to commuting stress (Novaco et al., 1979).
Before explaining this framework, we observe that, to some degree, workers choose their commutes, within the constraints of residential and job availability. Residential selection is associated with the mode and length of commutes workers make, and workers will choose neighborhoods based on their desired commute length and type, conditional on their ability to afford living in a given neighborhood (see reviews by Cao et al., 2009; Schirmer et al., 2014). Workers tend toward making choices that maximize their satisfaction regarding proximity to work, preferred neighborhood characteristics, and their ability to find alternative work that is proximal to their homes (Blumenberg & Ong, 2001; Morris & Zhou, 2018). This bidirectional relationship between residential choice and commutes presents methodological problems in accounting for the impact of residential choice on other outcomes (Bruch & Mare, 2012; Mokhtarian & Cao, 2008)—a challenge we address later.
The primary characteristics of a worker’s commute we consider are distance, time, and mode. We are interested in these elements insofar as they connect to commute stress.
The connection between distance and stress is perhaps obvious. Intuitively, a longer commute is more stressful than a shorter commute. Yet a commute’s distance alone does not mechanically result in increased stress for workers. Novaco et al. (1979) claim that the impedance of a commute increases stress; that is, that commuting stress is a function of a commute’s time. For example, a clear commute that is long in distance will be less stressful than one that is short in distance but for which traffic intensity increases its time. The authors theorize that impedance leads to commute stress because commuters on high-impedance commutes experience a loss of personal control, a predictor of increased stress. Time-intensive commutes thus may be especially stressful when work start (or end) times are inflexible, forcing workers to commute at high-traffic times of day (Lucas & Heady, 2002).
The mode of commute can also impact commute stress. Active commute types, such as walking and biking, lead to less stress than driving, which is both physically inactive and mentally demanding (Besser et al., 2008; Hilbrecht et al., 2014; Susilo & Dijst, 2009). Public transportation is similarly less stressful than driving, as it allows riders to devote attention to other activities (Lyons & Chatterjee, 2008; Olsson et al., 2013; Redmond & Mokhtarian, 2001; Smith, 2017).
As Figure 1 shows, these stressors can result in commuting strain. Commuting strain is the physiological and emotional response to commuting stress (Novaco et al., 1979). As a review by Murphy et al. (2023) shows, workers with longer commutes show evidence of negative responses of both types. For example, physiological strains of long commutes include less sleep, higher body mass index, and greater likelihood of illness, evidenced by increased use of sick leave. Emotionally, long commutes are associated with lower self-assessments of well-being and life satisfaction.
Commuting Spillover
Workplace
Commuting strain can spill over into the workplace. That is, the physiological and emotional responses to commuting stress can affect workplace performance and satisfaction (Calderwood & Mitropoulos, 2021). Some empirical work has linked longer commutes to decreased productivity (e.g., Ma & Ye, 2019; Van Ommeren & Gutiérrez-i-Puigarnau, 2011). The most compelling research leverages changes in the location of firms to estimate the impact of commutes on patent production, finding that the rate and quality of patent production decreases as commutes increase (Xiao et al., 2021). This work suggests that, all else equal, having a longer commute can decrease a worker’s effectiveness in the workplace.
One mechanism for this relationship identified in other research is diminished embeddedness, or feelings of fit with and connection and commitment to the workplace (e.g., Mathieu et al., 2016). Lower organizational embeddedness is associated with higher absence rates and a higher probability of turnover (Krausz et al., 1998). More specifically, a longer commute may leave workers less time to establish social connections with colleagues, perhaps because employees with longer commutes have less flexibility in their time use at work (Purba, 2015). This pattern has been examined phenomenologically among rural teachers; those who lived further away from the schools where they work had fewer ties to the school’s surrounding community and felt less connected with students and colleagues (Nitta et al., 2010).
Another way commuting strain can lead to lower performance is through burnout—prolonged exhaustion associated with stress—which is an important predictor of turnover (Amponsah-Tawiah et al., 2016; Mouratidis, 2020). Consistent with this view, Golden (2006) found that regular telecommuters, who often had no physical commute to work, felt less work exhaustion and were less likely to turn over than those with a physical commute. This pattern may occur because workers trade off time they would prefer to spend on personal activities towards a commute, which may impact satisfaction with their home lives. For example, during the COVID-19 pandemic, telecommuters reallocated much of their commute time to personal activities (Kun et al., 2020).
Outside the Workplace
Commuting strain can also spill over into home life. Roberts et al. (2011) examined data from a longitudinal survey of British households and found that longer commutes resulted in poorer psychological health for women but not men. They conjectured that women’s higher share of household labor explained the difference. In a similar vein, researchers have found that higher commute times may be associated with more family conflict and less time spent and connection with family (Bai et al., 2021; Purba, 2015). They also can devote less time to recreational activities that improve well-being (Besser et al., 2008; Hillrecht et al., 2014; Susilo & Dijst, 2009).
Voluntary or Involuntary Turnover
As shown in Figure 1, existing research suggests that the workplace and nonworkplace spillovers of commuting strain increases the likelihood that workers with long commutes turn over. The idea is simple. In a labor market, workers choose, among jobs available to them, opportunities that maximize their utility, which is a function of compensation and various other characteristics that affect the enjoyment or satisfaction they experience from the work (Blumenberg & Ong, 2001; Morris & Zhou, 2018). The spillovers of longer commutes reduce the overall utility of the job, making it more likely that an alternative job opportunity becomes more desirable (Grissom et al., 2016). In other words, holding other factors constant, a lengthy commute may increase the likelihood of voluntary turnover. Alternatively, if the strain of a long commute impacts a worker’s job performance—for example, if they are absent more often or if they become more disconnected from the workplace (e.g., Mathieu et al., 2016; Purba, 2015)—involuntary turnover, or turnover driven by employer decisions, may become more likely as well.
Consistent with this view, numerous studies from other fields have linked commute length to turnover intentions (e.g., Amponsah-Tawiah et al., 2016; Krausz et al., 1998). In a few cases, commute time has been linked to observed turnover as well (e.g., Connor et al., 2003).
Applying This Framework to Teachers
Given existing research from other fields and the conceptual framework this research suggests, we hypothesize that educators with longer commutes will be more likely to turn over. The connection between commuting and turnover may be stronger for teachers, in fact, than for other workers. With few exceptions, educators do not have work-from-home options, so their jobs necessarily entail a commute. Their work has inflexible start times that mean that educators often are commuting to work during peak morning traffic hours; this inflexibility may mean higher commute-to-work stress than other professionals experience (Lucas & Heady, 2002). Moreover, the vast majority of educators are women (80% in our study context), who may be especially prone to commute spillovers in the household because they have responsibility for a higher proportion of household labor than men (Roberts et al., 2011).
Commute times factor into teachers’ decisions about where they work. For example, using conjoint analysis, Horng (2009) shows that long commutes make schools less attractive workplaces for teachers and that teachers are more responsive to commute time than workplace factors such as student characteristics that often are considered in teacher turnover studies (see Grissom et al., 2016; Guarino et al., 2006). Other studies have linked longer commutes to lower likelihoods that a teacher pursues a teaching job or to greater expressed turnover intentions on surveys (Engel et al., 2014; Marinell & Coca, 2013). Yet we uncovered no studies that connect longer commutes to teacher turnover decisions in administrative data.
Data and Measures
The setting for this study is Metropolitan Nashville Public Schools (MNPS) in Tennessee, the 38th largest district in the United States. MNPS educates 85,000 students per year across 162 schools. The student population is demographically diverse, with 40% students identifying as Black, 28% identifying as Hispanic, and 32% identifying as another racial or ethnic identity. Thirty-eight percent are classified as economically disadvantaged. Although the city of Nashville makes up most of MNPS, the district covers all of Davidson County, including some smaller municipalities.
As important context for our analysis, Davidson County has relatively meager public transportation options. Among Nashville workers who work away from home, 84% travel to work alone by car, and another 11% carpool. Just 2% use public transportation, while only another 2% walk or bike (U.S. Census Bureau, 2020). Nashville regularly ranks poorly in studies of traffic congestion and driver experiences, especially among cities of its size (e.g., Hall, 2019; Sauter, 2019). Moreover, MNPS school start times nearly all range from 7:05 to 8:00 a.m., mapping closely onto American Community Survey (ACS) estimates placing the nexus of the morning commute in Nashville between 6:30 and 7:59 a.m. (U.S. Census Bureau, 2020).
We use longitudinal, deidentified administrative personnel records provided by the MNPS research and human resources teams spanning 2008–2009 to 2019–2020, which we link to ACS data from the U.S. Census Bureau. We include all teachers in traditional MNPS public schools and charter schools managed by the district. 1 Appendix Table 1 in the online version of the journal shows descriptive statistics for our analytic sample. Personnel data show each educator’s job assignment—that is, their role and the school in which they work—alongside other educator characteristics, including gender (recorded as binary), race/ethnicity, education level, and years of experience. For educator race/ethnicity, we simplify categorization to Black, Hispanic, White, or other, given than 99% of MNPS educators come from the first three groups. The district also records work absences and, after 2011–2012, observation or practice ratings from the statewide educator evaluation system. Crucially, the data also include home addresses for teachers employed in the school district between the 2008–2009 and 2019–2020 school years.
In addition, the data contain information on school characteristics (e.g., school tier or level, student demographics, average standardized test scores, and charter status). We use directory information to record the address of each school. From ACS data, we capture median income in the educator’s home zip code, which we use as a proxy for family wealth or economic advantage. A total of 162 zip codes of teacher residence are represented in the data.
Measuring Commute Time
Pairing home and school addresses, we calculated commute time using the community-contributed georoute Stata extension, which accesses the HERE API to calculate travel times between two addresses or coordinates. The HERE API uses historical street and traffic data gathered by location platform HERE Technologies to estimate the typical travel distance and travel time between two addresses or coordinates during a specific time of day, which provides a better approximation of distance and time commuters experience than straight-line distance calculations (Weber & Péclat, 2017). We estimated typical commute times from each educator’s home to their school address at 7:00 a.m. and between their school and home address at 3:00 p.m. We averaged the commute times to estimate each teacher’s average one-way daily commute. 2 The mean one-way commute time was 18.8 minutes.
The travel time measure this procedure creates is continuous; however, for our analyses we also convert this continuous variable to a categorical one using 5-minute increments, with 45+ minutes as the highest category, to look for nonlinearities in relationships between travel time and educator outcomes. We exclude educators whose addresses are outside of the state or who have commute times of longer than 2 hours because conversations with district human resources personnel suggested such travel times would indicate incorrect addresses. Overall, we can calculate commute times for 35,278 teacher-years between the 2008–2009 and 2019–2020 school years.
Dependent Variables
Turnover
We use longitudinal personnel files to infer two types of turnover among educators in the district. We observe a transfer if an educator works in one school in year t and works at another school within the district in year t + 1. 3 About 11% of teacher-year observations were coded as transfers over the study period. We observe an exit if an educator in the data in year t is not present in the data in year t + 1, which could include a move to another school district or an exit from education altogether. Teacher exit rates were 8%. 4
Absences
Personnel records include a count of the number of days each educator was absent from school during a given school year, though we cannot distinguish among different types of absences (e.g., personal, sick, vacation days). The average teacher in our sample was absent 11.3 days. In MNPS, teachers are on 9-month contracts that correspond to the school year, so absences generally correspond to lost instructional time.
Observation Scores
Tennessee law requires all school districts to rate educators’ effectiveness each year using an approved set of rubrics. MNPS uses the Tennessee Educator Acceleration Model (TEAM) system, which is employed by most districts in the state. 5 We use observation or practice scores from the district’s implementation of TEAM to measure educator effectiveness. For teachers, observation scores are given by trained observers—usually a principal or assistant principal—multiple times per year using the TEAM teacher observation rubric. The number of observations depends on the teacher’s experience level and past effectiveness; we take the average over all observations conducted that year. Ratings are assigned on a 5-point scale across multiple indicators of teacher effectiveness, with 5 representing the highest level of effectiveness. The mean teacher observation rating was 3.9. For supplemental analysis, we separately examine scores from the four domains of the teacher rubric that constitute the overall score (preparation, environment, instruction, and professionalism) and teacher-level value-added scores for teachers of tested subjects from the Tennessee Value-Added Assessment System (TVAAS). 6
Methods
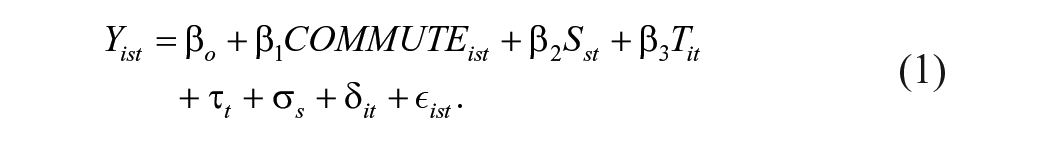
We begin by describing teacher commute times by their individual characteristics and the characteristics of their workplaces. We then describe turnover by commute time, separating turnover into transfers and exits. Next, to better isolate the turnover–commute time relationship from other factors, we estimate linear probability models predicting transfers and exits as functions of commute time, conditioning on teacher and school characteristics. Equation 1 shows our primary specification:
Our preferred models also include school (
We run supplemental analyses describing and predicting two intermediary outcomes in our conceptual framework: absences and observation ratings. The predictive models are structured similarly to Equation 1, with these measures as the dependent variables.
Finally, we investigate how educator commute times change when educators change schools or change residences. This simple model takes a form shown in Equation 2:

This model includes observations for each transferring educator in time t (the year prior to transferring) and time t + 1 (the year after transferring). The model predicts commute time (
Describing Teacher Commute Times
We begin by describing one-way commute times for MNPS teachers. As shown in Appendix Table 1, teachers have average one-way commutes of 18.8 minutes. Figure 2 shows the distribution of commutes. The modal teacher commutes between 15 and 20 minutes each way. About 88% of teachers travel fewer than 30 minutes to work each way.

Distribution of one-way commute times.
Teachers working in different schools have a wide distribution of mean one-way commute times. Figure 3 shows the distribution of commute times by school. The distribution is slightly right-skewed, centered around a median (and mean) of 19 minutes. Six schools have average commutes among teachers higher than 25 minutes. Twenty schools have average commutes among teachers that are fewer than 15 minutes.

Distribution of mean teacher one-way commute times, by school.
Commutes by Educator and School Characteristics
Table 1 describes one-way commute times by characteristics of teachers and the schools in which they work. More experienced teachers’ one-way commutes are shorter than less experienced teachers, but the differences are small—approximately 1 minute shorter between the least and most experienced teachers. 10 Male teachers have commutes that are approximately 2 minutes longer than their female colleagues. White teachers generally have similar commutes to their Hispanic and Black colleagues. Unsurprisingly, teachers who live outside the countywide school district have substantially longer commutes. Specifically, teachers who live out of county have commutes that are 12.7 minutes longer than those who live inside the county.
Teacher’s One-Way Commute Times by Educator and School Characteristics

There also are some notable differences in commute times by school characteristics. First, high school teachers have longer commutes than their elementary and middle school counterparts. These differences may reflect that there are many fewer high schools in MNPS than other school types, making average commuting distances longer. Second, teachers working in schools with the highest achievement and the fewest students from low-income households have the shortest commutes. Teachers working at schools in the highest math and English language arts (ELA) achievement quartiles have one-way commutes that are approximately 3 minutes shorter than those who work in the lowest quartiles. Similarly, teachers in schools in the lowest quartiles of proportion Black or proportion Hispanic have slightly shorter commutes than teachers in the highest quartiles.
Commute Time Predicts Teacher Turnover
Figure 4 shows how the probability that a teacher transfers among schools in MNPS (panel A) or exits the district (panel B) varies over the commute-time distribution. The figure displays simple bivariate relationships, otherwise accounting only for the year of the data. 11 Panel A shows that teachers with the lowest commute times have transfer rates of only about 7%, increasing steadily to just less than 15% for teachers with commutes of 20 to 25 minutes, then plateauing. Panel B similarly shows that exit probabilities are lower among teachers with shorter commutes, with teachers commuting fewer than 40 minutes having similar exit probabilities (8%–10%), jumping to approximately 14% among teachers with commutes of 40 minutes. Teachers with commutes of 45+ minutes have exit probabilities of about 12%.

One-way commute time predicts teacher transfer and exits. Panel A: Commute time and the probability of transfer. Panel B: Predicting probability of exit.
Table 2 shows estimates from a series of linear probability models estimating the probability of teacher turnover. Columns 1 and 4 show models conditioning on educator characteristics, columns 2 and 5 add school fixed effects, columns 3 and 6 add home zip code fixed effects. 12 To examine nonlinearities in the relationship between commute time and turnover, we show models where commute times are operationalized as categorical variables. Full results are suppressed in the main tables for parsimony but are available in Appendix Tables 2 and 3 in the online version of the journal, as are results from models where commutes are operationalized continuously. As a robustness check, we also show results for models that include teacher fixed effects in columns 5 and 10 in both appendix tables. The patterns are very similar across the models, so we focus on the school and home zip code fixed effects model in columns 3 and 6.
Teachers’ One-Way Commute Times and Transfer and Exit Probabilities

Note. Standard errors in parentheses. Standard errors clustered at school level. Time-invariant educator characteristics include teacher race/ethnicity (Black, Hispanic/Latino, other race; White is excluded), and an indicator for female educator. Time-varying educator characteristics include years of experience (1st year, 2–5 years, 16+ years; 6–16 years is excluded), an indicator for whether the educator’s home is outside of the district, and the natural log of the median income in the educators’ home zip code (the latter two are excluded from zip code fixed effects model). Time-varying school characteristics include share of Black, Hispanic, Native American, and Asian/Pacific Islander enrollment (White enrollment is excluded for collinearity) and share of economically disadvantaged students. Time-invariant school characteristics include indicators for middle, high, and other schools (elementary excluded), and an indicator for whether a school is a charter school.
p < .10, **p < .05, ***p < .01.
We first consider transfers. The models (columns 1–3) depict a roughly linear relationship between travel time and the probability of transferring schools. This linearity is apparent in the margins plot for this model (Figure 5, panel A). At the high end, teachers who have commutes that are about 40 minutes or longer each way are 13 percentage points more likely to transfer than teachers in the same school who commute for 0 to 5 minutes. This increase in turnover probability is substantial, given the overall transfer rate of 11% across our analytic sample. Our continuous models (Appendix Table 2, columns 1–5, in the online version of the journal) show a 1-minute increase in one-way commute time is associated with a 0.3 percentage point increase in transfer probability. A one standard deviation increase in commute time (10.3 minutes) is associated with an approximately 3 percentage point increase in transfer probability—a substantial increase over the 11% average rate. 13

One-way commute time predicts teacher transfer and exits (full model). Panel A: Probability of transfer. Panel B: Probability of exit.
The continuous models (Appendix Table 3, columns 1–5, in the online version of the journal) for teacher exit show that a 1-minute increase in one-way commute is associated with a 0.1 percentage point increase in exit probability. Yet columns 4 through 6 of Table 2 suggest that, unlike for transfers, the association between commute time and exit is not linear. We again focus on the models including school and home zip code fixed effects. Column 6 and Figure 5, panel B show that, conditional on other factors, teachers have similar exit probabilities across the commute time distribution except for teachers with 40- to 45-minute-long commutes. Teachers with 40- to 45-minute commutes are 5 percentage points more likely to exit than teachers with 0- to 5-minute commutes—a substantively meaningful difference in a sample in which the overall exit rate is 8%. Indeed, though not shown, teachers with a commute between 40 and 45 minutes have statistically higher (at the .05 level) exit probabilities than teachers whose commute lengths fall into any of the other ranges (with the exception of the 45+ minute range). 14
Although not the focus of our analysis, we also examined the relationships among covariates and turnover (see Appendix Tables 2–3 in the online version of the journal). One finding that stands out is that, in the transfer models without zip code fixed effects, 15 teachers who live outside of the school district are 3 percentage points less likely to transfer schools than those who live inside the district and who work in their same school, holding commute time and all other covariates constant. Furthermore, there is no association with exit probability once school fixed effects are included, which might have been the case if, for example, out-of-county teachers are more likely to be attracted to new jobs in their home counties. Yet these conclusions are different from those we would draw if commute time was not included. In models omitting commute time (not shown), living outside the county no clear association with transfer probability (β = −.008, p = .52), and the association with exit probability is positive (β = .011, p < .01). This pattern of results is consistent with the interpretation that teachers who live outside the county are 1.1 percentage points more likely than Davidson County residents to leave but that this association is driven by the fact that out-of-county teachers have systematically longer commutes. 16
Describing and Predicting Changes in Commute Time After Transfer
Table 2 showed that teachers with longer commutes are more likely to transfer. Next, we consider whether teachers who transfer move to schools that are closer to home than the schools they left. Figure 6 shows the distribution of one-way commute time changes between year t + 1 and year t for teachers who transfer schools. The distribution is roughly bell-shaped, centered roughly around zero, somewhat counterintuitively showing that transferring teachers are roughly as likely to move to schools closer to their homes as further from their homes.

Distribution of change in commute time for transferring teachers.
Table 3, column 1 shows results from analyses predicting the difference in commute time for transferring teachers. Teachers who transferred moved to schools that were just 1.1 minutes closer to their homes, on average. This difference amounts to approximately 6% of the average (pretransfer) teacher commute length. We estimate similar models for those who switch residences but do not switch schools to examine whether teachers who change residences reduce their commute times (column 2). The coefficient is negative but small—amounting to approximately a third of a minute—and not statistically significant at conventional levels.
Change in One-Way Commute Time for Educators Who Transfer or Move Homes

Note. Heteroskedasticity robust standard errors in parentheses.
p < .01.
Because educators are likely considering travel time alongside other factors when transferring schools, we examine school characteristic differences across the commute time change between the school where a teacher worked in year t + 1 and year t. Appendix Table 5 in the online version of the journal shows educator characteristics and differences in school characteristics for transferring teachers in each quintile of the commute time change distribution. Educators across the quintiles are remarkably similar with a few exceptions: Transferring teachers with the largest decreases in commute times are slightly less likely to be Black, more likely to be White, and have approximately 1 year less experience than teachers in the other quintiles. Those in the middle quintile are slightly more likely to be Black, less likely to be White, and less likely to live outside the county. Differences in school characteristics are also similar across quintiles. Teachers tend to move to schools with higher achievement, fewer Black and economically disadvantaged students, and more White and Hispanic students. Inconsistent with a hypothesis that teachers may take on longer commutes to work with more advantaged students, transferring teachers with the largest decreases in commute time actually have slightly larger decreases in the share of Black students and larger increases in the share of White students than teachers in the other quintiles. They are also more likely than teachers in the other quintiles to stay in the same school tier.
In Appendix Table 6 in the online version of the journal we show the characteristics of the schools where teachers worked before and after transferring, again disaggregated by quintiles in the commute time change distribution. The characteristics of the schools where candidates worked prior to and after transfer were similar across the commute time change distribution, but the initial commute times vary substantially. Average initial commutes decrease as commute time changes increase. This pattern is partially mechanical—a teacher can decrease their commute more substantially if their initial commute was longer—but is consistent with the pattern that similarly positioned teachers with longer commutes are more likely to turn over than those with shorter commutes.
Commute Time Predicts Teacher Absences
We now move to intermediary outcomes. We begin with absences. Figure 7 shows the simple association between teacher absences and commute time. 17 Teachers with commute times of 10 minutes or fewer are absent 10.5 days per year, on average. At 10 to 15 minutes, this value jumps by 0.8 days, then generally increases linearly, with teachers with commutes of 45+ minutes having absence rates of 12.3 days, or 1.8 more than teachers with the shortest commutes.
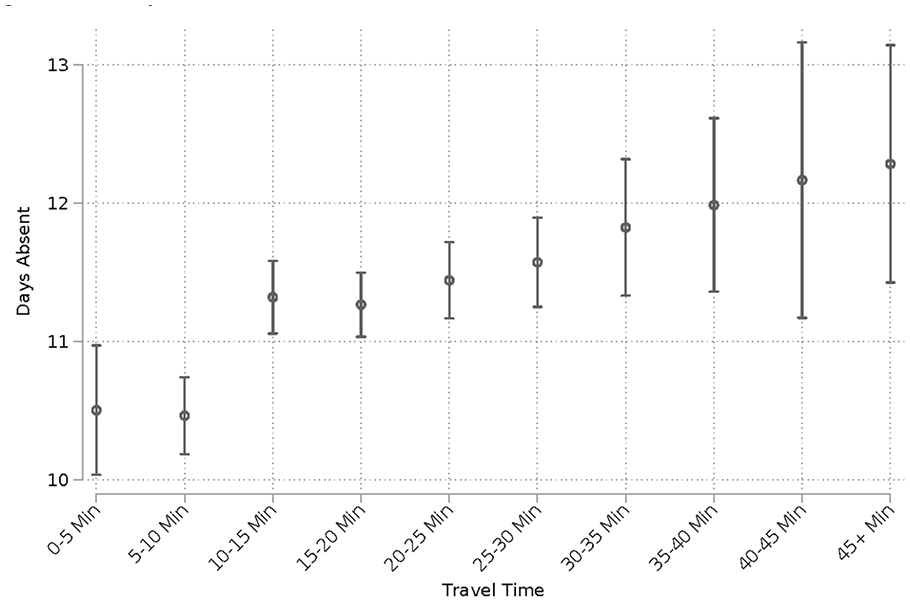
One-way commute time and teacher absences.
The lefthand side of Table 4 shows regression results. 18 As in Figure 7, results show that absences increase with commute times. Regardless of model, predicted absence rates jump at 10 to 15 minutes, then generally increase through the commute time distribution to 35 to 40 minutes. At 40 minutes, there is a slight divergence between the models that do not include zip code fixed effects, which predict that absence rates continue to climb, and the model that includes zip code fixed effects, which shows a drop in the point estimate (though predicted absence rates for 40 to 45 minutes and 45+ minutes are statistically indistinguishable from that at 35–40 minutes; see Appendix Figure 2 in the online version of the journal). This drop aside, regression results generally mirror the descriptive pattern in Figure 7.
Educators’ One-Way Commute Times and Days Absent From Work and Observation Scores

Note. Heteroskedasticity robust standard errors in parentheses. Standard errors clustered at school level. Educator characteristics include teacher race/ethnicity (Black, Hispanic/Latino, other race; White is excluded), years of experience (1st year, 2–5 years, 16+ years; 6–16 years is excluded), an indicator for female educator, an indicator for whether the educator’s home is outside of the district, and the natural log of the median income in the educators’ home zip code (the latter two are excluded from zip code fixed effects model). Time-varying school characteristics include share of Black, Hispanic, Native American, and Asian/Pacific Islander enrollment (White enrollment is excluded for collinearity) and share of economically disadvantaged students. Time-invariant school characteristics include indicators for middle, high, and other schools (elementary excluded), and an indicator for whether a school is a charter school.
p < .10, **p < .05, ***p < .01.
These findings suggest that absences could be a mediator in the relationship between commute time and turnover. Using Baron and Kenny’s (1986) method, we formally test the possibility (Appendix Table 8 in the online version of the journal). When controlling for commute time, we find that an additional day absent is associated with a 0.2 percentage point increase in the probability of transfer (p < .01) and a 0.1 percentage point increase (p < .01) in the probability of exit. Including absences in the model only minimally changes the coefficients for the commute time indicators; we see little indication that absences mediate the relationship between commutes and turnover.
Commute Time Predicts Teacher Observation Ratings
Figure 8 shows how commute time relates observation ratings. 19 Observation ratings decrease seemingly linearly over the commute-time distribution, with teachers with commutes shorter than 10 minutes receiving the highest ratings (approximately 3.95 out of 5 points) and teachers with commutes of 40 minutes or more receiving the lowest ratings (approximately 3.75), on average—a difference of approximately a third a standard deviation in the analytic sample.

One-way commute time and teacher observation ratings.
The right hand side of Table 4 shows regression results. 20 Again, results generally are very similar to those shown in Figure 8, regardless of model. Our preferred model in column 6 shows compared to other teachers in the same school or home zip code, teachers with 25- to 30-minute and 30- to 35-minute one-way commutes have observation scores that are 0.04 points lower than those with 0- to 5-minute commutes, and those with 35- to 40-minute commutes have scores that are 0.05 points lower (all significant at p < .05). Teachers with 40- to 45- and 45+-minute commutes have observation scores that are 0.15 and 0.07 points lower, respectively (p < .01). In supplemental analysis of teachers’ TVAAS scores (among teachers of tested subjects only), we find generally similar though less precisely estimated patterns (see Appendix Table 10 in the online version of the journal).
Visually (Appendix Figure 3 in the online version of the journal), there appear to be some thresholds in commute time at which observation scores decrease for teachers: moving from a 20- to 25-minute commute to a 25- to 30-minute commute is associated with a 0.03 point drop in observation scores (p < .01), and a move from a 35- to 40-minute commute to a 40- to 45-minute commute is associated with a 0.10-point drop in observation scores (p < .01). This latter difference appears substantively meaningful; 0.10 points represents a 0.17 standard deviation difference in observation scores in our analytic sample. 21
In Appendix Table 12 in the online version of the journal, we again formally test the possibility that observation scores mediate the relationship between commutes and turnover. A single point increase observation scores is associated with a 4-point decrease in the probability of turnover (p < .01), even when controlling for commute time. The coefficients for the commute time indicators change minimally, offering little evidence that observation scores mediate the relationship between commute time and turnover.
Discussion and Conclusions
MNPS teachers with longer commutes are more likely to transfer schools, and teachers with very long commutes are more likely to exit the district. These relationships are clear both descriptively and in models that compare teachers within the same school and account for a variety of potential confounding influences. Substantively, the relationship between commute length and turnover is large. A teacher with a commute of 5 minutes has an average probability of transferring of about 7%; above 20 minutes, the probability is twice as high. A teacher in the same school and home zip code commuting more than 45 minutes has a predicted transfer probability of 21%. For exits from the district, the pattern is a little different, with teachers commuting fewer than 40 minutes having relatively similar exit rates (8%–10%), and teachers above 40 minutes seeing increases of 3 to 4 percentage points. Moreover, teachers with longer commutes are absent from school more often—nearly 2 workdays between those with commutes of 10 minutes or fewer and those with the longest commutes—and are rated less effective in their classroom observations than other teachers in their schools.
These results generally are consistent with the predictions of our conceptual framework: Longer commutes create stresses that spill over into work and home in ways that make turnover more likely. There are, however, some important caveats. First, we do not find evidence that absences or job performance mediate the connection between commute time and turnover, suggesting that other unobserved mechanisms are at play. Second, our descriptive results suggest that commute times can matter for turnover but may not override other factors. For example, teachers with shorter commutes who transfer schools tend to increase their commutes after a transfer, suggesting that other school characteristics may inform their decisions. Some research based on surveys suggests that teachers attach lower importance to commute time than school-level factors such as leadership and facilities quality (Horng, 2009; Viano et al., 2021). Nevertheless, our findings indicate that teachers may prioritize a shorter commute when deciding whether to transfer to another, similar school, and that a long commute may contribute to challenges at work.
Third, interpreting our estimates as causal requires ruling out other possibilities. We are at least partially successful. Making a statistical comparison among teachers with similar observable characteristics in the same school, for example, rules out the possibility that teachers with longer commutes systematically are beginning teachers who have higher turnover propensities, or that the results are driven by the fact that some schools—perhaps ones in very low-income neighborhoods where turnover rates often are higher—simply are further away from the neighborhoods where teachers tend to live. Comparing teachers living within the same zip code means our transfer results are likely not driven by teachers who live in neighborhoods with many alternative school options close by. Including teacher effects means our results are not confounded by time-invariant characteristics of teachers that jointly may affect job location/commute time and turnover.
Still, other threats to a causal interpretation remain. We cannot rule out, for example, that teachers who are more likely to turn over also have time-varying characteristics we cannot observe that make it harder for them to find (presumably preferred) jobs close to home. Estimation strategies that leverage other sources of variation might provide additional evidence regarding the appropriateness of causal interpretation. For example, major road construction projects that disrupt or create new thoroughfares presumably would alter commutes for some teachers, offering an opportunity to observe teachers’ work responses to a more challenging or easier commute.
Yet, importantly, even if the results are not causal, they have policy and practical relevance for schools and districts. Teachers who live further away from a school are absent more often, have lower observation scores, and are less likely to stay compared to other teachers in the same school. A human resources official or school principal making a teacher hiring decision might take this descriptive fact into account. Although commute time is unlikely to be among the most important considerations in candidate selection, on the margins, schools may see benefits—at least with respect to the outcomes we examine—from choosing applicants who live closer to the school. Perhaps more relevant, teachers may not anticipate the strains that accepting a job with a longer commute may create. Making teachers aware of commute-related consequences as they are choosing among multiple teaching opportunities may result in a better long-term fit. Districts with centralized recruitment and hiring processes may be especially well-positioned to provide teachers with information about the potential tradeoffs of accepting a job closer to or further from their homes. Even in decentralized systems, information about transportation options that could make commuting more active or less onerous in other ways may lessen the negative impacts of long commutes.
Leaders also might evaluate how to best distribute noninstructional responsibilities in a school among teachers to mitigate the challenges long commutes bring to some teachers. For example, if start times coincide with morning rush hour but end times do not, a leader may try to assign morning duties to a teacher who lives closer to the school and after-school duties to one who lives further away, reducing the stress associated with the morning commute (Lucas & Heady, 2002). Remote options for meetings, professional development, and other noninstructional tasks may also reduce commute-related stress but may come at the cost of organizational embeddedness. To that end, schools may also increase opportunities during work hours for community-building to improve organizational embeddedness among those whose long commutes decrease their after-work availability.
Our results also suggest a potential mechanism through which teachers move to schools with more advantaged students over the course of their careers. Teachers with the largest reductions in commute time transfer to schools with lower shares of Black students, students who are economically disadvantaged, and lower-achieving students. Teachers may transfer to those schools over the course of their careers because they live in Whiter, wealthier neighborhoods than their students, and want to work in schools in which they would have shorter commutes. These patterns may be especially prominent in racially and economically segregated districts. Future work should map out the geography of teacher residences, with attention to the extent to which teachers from different racial and ethnic groups are sorted in relationship to the district’s schools.
Our study faces several limitations. First, it takes place in a single urban district with low public transportation availability and utilization. Future research investigating the role of commuting for educators’ work outcomes in other contexts, including those in nonurban areas and in areas with different transportation options, would help establish the degree to which the results we find here generalize. Second, the study offers but does not directly test theoretical linkages between commuting and workplace outcomes such as turnover and absences. Studies, including qualitative studies, documenting whether and how commute length affects intermediate outcomes such as job embeddedness, commitment, and stress and linking those constructs to turnover, absences, and job performance would be valuable, as would studies exploring other potential mediators.
Future work might also consider how teacher commutes and their consequences may have changed in the years following the end of our data. COVID disrupted traditional patterns of in-person and remote work in many professions, but the structure of public school teaching does not lend itself easily to alternative work arrangements. Exploring schools’ efforts to increase teacher time flexibility in the post-COVID era would be worthwhile, as would testing of the relationship between commute time and turnover in these more recent years. It is possible that commute time has become a more important consideration in teachers’ work decisions as work flexibility increases in alternative professions.
Supplemental Material
sj-docx-1-ero-10.1177_23328584241287792 – Supplemental material for A Bad Commute: Travel Time to Work Predicts Teacher Turnover and Other Workplace Outcomes
Supplemental material, sj-docx-1-ero-10.1177_23328584241287792 for A Bad Commute: Travel Time to Work Predicts Teacher Turnover and Other Workplace Outcomes by Francisco Arturo Santelli and Jason A. Grissom in AERA Open
Footnotes
Acknowledgements
The authors thank Metropolitan Nashville Public Schools for the data used in this study. We benefited from helpful feedback from audience members at the 2022 annual meeting of the Association for Education Finance and Policy.
Declaration of Conflicting Interests
The author(s) declared no potential conflicts of interest with respect to the research, authorship, and/or publication of this article.
Funding
The author(s) received no financial support for the research, authorship, and/or publication of this article.
Notes
Authors
FRANCISCO ARTURO SANTELLI is a senior research associate at Brown University’s Annenberg Institute, Box 1985, Brown University, Providence, RI 02912;
JASON A. GRISSOM is Patricia and Rodes Hart Professor of public policy and education at Vanderbilt University’s Peabody College and faculty director of the Tennessee Education Research Alliance, PMB 414—230 Appleton Place, Nashville, TN 37203;
References
Supplementary Material
Please find the following supplemental material available below.
For Open Access articles published under a Creative Commons License, all supplemental material carries the same license as the article it is associated with.
For non-Open Access articles published, all supplemental material carries a non-exclusive license, and permission requests for re-use of supplemental material or any part of supplemental material shall be sent directly to the copyright owner as specified in the copyright notice associated with the article.