
Abstract
Preschool through third grade (P–3) alignment is regularly named as a key aspect of early childhood education and the transition to formal schooling. However, little is known about P–3 alignment in practice. Using data from 265 observations of math instruction in preschool, kindergarten, first-, and third-grade classrooms in New York City public schools, we explore P–3 instructional alignment as it would be experienced sequentially, over time and across grades, by students. We examine the continuity of developmentally appropriate instructional environments and high-quality pedagogical practices, as well as the progression of P–3 mathematics content coverage. We find notable discontinuities in instructional environments and some pedagogical practices, particularly across preschool and kindergarten. We also find both progression and repetition in math content coverage. Results suggest that, on some dimensions, kindergarten may be poorly aligned with both preschool and the early elementary grades.
Keywords
The need for preschool through third grade (P–3) alignment has been highlighted for at least two decades (Bogard & Takanishi, 2005; Kauerz, 2006; McCormick et al., 2019; Phillips et al., 2017). 1 Despite consensus among early childhood education (ECE) experts regarding its importance (Phillips et al., 2017), we know surprisingly little about P–3 alignment in practice (Coburn et al., 2018; Phillips et al., 2017). Further, articulations of what P–3 alignment means vary widely, with some focusing on systems and policies (e.g., Coburn et al., 2018; Kauerz, 2018) and others focused on classrooms and instruction (e.g., Stipek et al., 2017). P–3 alignment is thought to be among the most promising means for sustaining learning gains from participation in high quality preschool and K–3 alignment is considered essential for supporting students as they progress through school (Burchinal et al., 2022; Kauerz, 2018; McCormick et al., 2019; Phillips et al., 2017).
Educational practice has seen marked improvement on some metrics of P–3 alignment that were called for by scholars who were among the first to write about the topic. Bogard and Takanishi (2005) argue that P–3 alignment should include increased access to universal preschool and mandatory full-day kindergarten, both of which have expanded substantially in recent years. For example, between the 1998–1999 and 2010–2011 school years, participation in full-day kindergarten in the United States rose by 26 percentage points, from 61% to 87% (Engel et al., 2016). Further, enrollment of 4-year-olds in state-funded preschool more than doubled across the last two decades, rising from 14% to 32% between 2001–2002 and 2021–2022 (Friedman-Krauss et al., 2023).
Other facets of P–3 alignment remain challenging or ambiguous. One aspect of P–3 alignment that poses a particular challenge is that it involves two historically distinct sectors; ECE and K–12 (McCormick et al., 2019; National P-3 Center, n.d.). Communication across these sectors remains uncommon, despite long-standing interest in the transition to kindergarten. A potential means for improving communication and collaboration across P–3 is the integration of preschool into K–12 contexts (McCormick et al., 2019). While this is increasing, the ECE sector remains incredibly diverse with a vast array of ECE programming operating outside of the K–12 system (Coburn et al., 2018).
Another challenge in studying P–3 alignment is that conceptions of alignment vary widely across studies. Some scholars have focused on definitions of P–3 alignment in educational policies related to curricula, assessment, standards, and professional development (e.g., Coburn et al., 2018; Hogan, 2011; Kauerz, 2006). While policies are likely an important means for improving P–3 alignment, children’s classroom experiences, while more difficult to measure (Vitiello et al., 2022), are the end-goal of such policies. Classroom environments and instruction are the focus of other ECE experts’ framing of P–3 alignment (Phillips et al., 2017; Stipek et al., 2017). Policies aimed at facilitating alignment, as well as the ways those policies affect practice to shape instruction and student experiences, are likely essential for creating aligned high-quality P–3 experiences for young learners. However, the extent to which students experience aligned instruction and classroom experiences in the transition to kindergarten and across the early years of formal schooling remains unclear.
Prior research suggests structural and contextual barriers to alignment between preschool and kindergarten. These include substantial heterogeneity in ECE experiences and widespread disconnect between ECE and elementary school. Evidence also documents a rapid academicization of kindergarten in recent decades (Bassok et al., 2016; Engel et al., 2016). For example, Bassok et al. (2016) find that kindergarteners were much more likely to spend more time in whole group instruction, learning reading and math, and less time on other subjects (e.g., art, music) in 2010–2011, relative to 1999–2000.
The importance of preschool and the transition to kindergarten (P–K) are widely acknowledged by parents and education practitioners and are consistently noted in theoretical (e.g., Rimm-Kaufman & Pianta, 2000; Yelverton & Mashburn, 2018) and empirical (Burchinal et al., 2022; Cohen-Vogel et al., 2021; Mashburn & Yelverton, 2019) scholarship. Some recent studies of P–K instructional alignment (Burchinal et al., 2022; Cohen-Vogel et al., 2021; McCormick et al., 2020; Vitiello et al., 2022) use measures of instructional alignment, such as teacher surveys (e.g., Cohen-Vogel et al., 2021), or varied combinations of document analysis, teacher surveys, and observational measures (Burchinal et al., 2022; McCormick et al., 2020; Vitiello et al., 2020, 2022). These studies contribute to our understanding of P–K or P–1 instructional alignment and, in some cases, the association between various constructions of alignment and child outcomes (Burchinal et al., 2022; Vitiello et al., 2022). However, they have not included observational data focused on measuring classroom environments, pedagogical practices, and content. Further, we know of no studies that have explored alignment from preschool through third grade.
The current study operationalizes P–3 alignment in terms of classroom environments, pedagogical practices, and content coverage, as developmental theory posits that proximal contexts and relationships, in this case classrooms, teachers/adults, and peers, are key for student learning and motivation (Bronfenbrenner & Morris, 2007; Vygotsky & Cole, 1978). We use data from classroom observations conducted sequentially across grades. Thus, observations capture what students would experience each year to explore these three facets of P–3 instructional alignment. The preschool classrooms we observed were housed in elementary schools, and children could continue from preschool to elementary school in all observed contexts. Thus, the current study was conducted in a setting that, at least in theory, could have facilitated communication among administrators and teachers regarding the alignment of instruction between preschool and later grades.
We focus on mathematics instructional alignment for several reasons. Levels and gains on math assessments in preschool and kindergarten are highly correlated with later academic outcomes (e.g., Claessens & Engel, 2013; Claessens et al., 2009; Duncan et al., 2007), even predicting secondary and postsecondary outcomes (Davis-Kean et al., 2022). Further, evidence suggests that indicators of instructional quality were more predictive of math outcomes than reading in a recent study using the Classroom Assessment Scoring System (CLASS) to measure quality from preschool to kindergarten (Carr et al., 2019). Research documents that less instructional time is spent on math than reading from preschool through at least fourth grade (Engel et al., 2016; Morton & Dalton, 2007; Sarama et al., 2008). For example, an extensive study of preschool and kindergarten classrooms for which data was collected in 2001–2002 found that 6% of instructional time was devoted to math in preschool, with 11% of time devoted to math in kindergarten (La Paro et al., 2009). The current study, to our knowledge, is the first to document P–3 alignment in terms of instructional environments, pedagogical quality, and mathematics content coverage. We do so using extensive classroom observational data from New York City (NYC) public schools.
Prior Theory and Evidence on P–3 Alignment
Below, we review theory and empirical evidence on instructional alignment. As noted above, both definitions of P–3 alignment and terminology used to describe it vary widely. As Stipek (2019) notes, “The terms ‘continuity,’ ‘alignment,’ ‘coherence,’ and others are used somewhat interchangeably in the literature” (p. 170). Stipek (2019) and Stipek et al. (2017) use the term continuity to encompass a broad range of P–3 alignment constructs, including policies around standards and assessment, classroom environments, pedagogy, and instructional content. That work carefully notes that continuity in the context of P–3 alignment does not mean lack of change (Stipek, 2019; Stipek et al., 2017). For the current study’s focus on P–3 instructional alignment, we consider two main constructs: (a) continuity in supportive classroom environments and high pedagogical quality, as well as (b) progression in academic content.
Consistency and Continuity in P–3 Settings
Supportive P–3 Math Instructional Environments
Children need continuity in instructional environments over an extended period to support their development. We use the terms continuity and consistency interchangeably here and in the section that follows. In their theoretical framing of the transition from preschool to kindergarten, Rimm-Kaufman and Pianta (2000) highlight both relational stability and change. Drawing on ecological developmental theories, they emphasize the importance of consistent relationships, noting that relationships change across contexts and over time, and that these relationships can either hinder or enhance the transition to kindergarten (Rimm-Kaufman & Pianta, 2000; Yelverton & Mashburn, 2018). Bioecological and sociocultural theories of development underscore the importance of proximal processes—the closest relationships (e.g., parents, teachers) have the greatest influence (Bronfenbrenner & Morris, 2007; Vygotsky & Cole, 1978). Proximal environments that enhance learning require continuity (Rimm-Kaufman & Pianta, 2000; Yelverton & Mashburn, 2018). Bronfenbrenner (1979) emphasizes the importance of consistency and continuity—repeated exposure over time to high-quality interactions—for growth and development.
Young children benefit from predictability and routines; instability can impede development (Rimm-Kaufman & Pianta, 2000; Yelverton & Mashburn, 2018). Classroom environments, including class size and student:adult ratios likely play a part in determining whether and to what extent teachers are able to implement quality pedagogical practices. For example, smaller class size and lower student:adult ratios likely provide teachers with more opportunities for positive interactions with their students and greater ease in implementing small group instruction, particularly with young children. This is important as evidence indicates that more time in small groups can facilitate higher-quality learning experiences in math for young children (Jacob & Jacob, 2018).
Evidence on the importance of continuity in instructional environments suggests that abrupt shifts in these environments (e.g., going from a class size of 15 to a class size of 25 from preschool to kindergarten) may disrupt student experiences and interfere with relational aspects of learning that are crucial for young children (Rimm-Kaufman & Pianta, 2000). For example, consistency in time on academics and child-selected activities across Head Start and kindergarten positively predicts academic and socioemotional end-of-kindergarten outcomes (Mashburn & Yelverton, 2019). Recent evidence documents an increase in time on math in kindergarten (Bassok et al., 2016; Engel et al., 2021). If this increase differs substantially from what children experienced in preschool (e.g., going from little to no math instruction to an hour per day), this could represent another discontinuity in children’s P–3 instructional experiences. Thus, consistently positive and developmentally attuned classroom environments likely facilitate higher-quality pedagogical practices.
High-Quality Pedagogical Practices
Consistency and continuity in instructional environments alone, however, are insufficient. Benefits most likely accrue with consistent exposure to high-quality pedagogical practices (Rimm-Kaufman & Pianta, 2000; Yelverton & Mashburn, 2018). For young children, from birth to age 8, National Association for the Education of Young Children (NAEYC) guidelines recommend facilitating consistent, positive, and secure relationships with teachers and opportunities for children’s active engagement in learning (Copple & Bredekamp, 2009). High-quality instruction includes opportunities for students to participate in reflective dialogue, interact regularly with their peers and teachers, and have positive social learning interactions (Herrera et al., 2021; Skinner, 2018; Stright & Supplee, 2002).
Quality math instruction involves students’ active engagement in solving problems, making interdisciplinary connections, sharing mathematical ideas, exploring multiple representations, and using tools such as manipulatives (National Council of Teachers of Mathematics, 2000). Young children need engaging, hands-on experiences for learning through playful interaction (Piaget, 1970; Sarama & Clements, 2009a; Skinner, 2018; van Oers, 2010).
Early childhood experts highlight the importance of high-quality classroom experiences and instructional practices, aligned across grades, as a potential mechanism for sustained learning gains (Grantmakers for Education, 2006; Kauerz, 2006, 2018; Rimm-Kaufman & Pianta, 2000; Stipek, 2019; Stipek et al., 2017). Instructional alignment can provide continuity and consistency for children transitioning from preschool to kindergarten and through elementary grades (Bailey et al., 2020; Bassok & Engel, 2019). This may be particularly important in math as evidence indicates little time is spent on math in many ECE settings (e.g., La Paro et al., 2009; Piasta et al., 2014; Sarama et al., 2008). Thus, limited exposure to math content and to high-quality math instructional practices in ECE could result in both a lack of continuity and consistency in the transition to kindergarten.
Progression in Content Exposure
Optimal learning environments across grades require progression through exposure to increasingly challenging content (Bronfenbrenner, 1979; Vygotsky & Cole, 1978). Learning is maximized when children are taught new content that is both challenging and within their reach (Vygotsky & Cole, 1978), with opportunities to interact in increasingly complex ways (Bronfenbrenner & Morris, 2007). Effective teaching builds on existing skills to support children’s growing capacity for understanding (Vygotsky & Cole, 1978). The importance of progression in academic content is highlighted in work on mathematical learning trajectories for young children (e.g., Sarama & Clements, 2009b).
Research suggests that math instruction should begin with procedural approaches emphasizing basic skills (e.g., counting, single digit addition) adding more conceptual methods emphasizing analytic and reasoning skills as young children’s capacity increases (e.g., Heatly et al., 2015). Clements and Sarama (2014) identify mathematical learning trajectories where children ages 3 to 8 develop increasingly complex math skills and understanding. Key topics include verbal and object counting, comparing and ordering, addition and subtraction, composing numbers, spatial thinking, shapes, measurement, patterning, and sorting. High-quality math instruction requires careful sequencing to support children’s growth along these trajectories.
Empirical evidence supports this theory. When kindergarten teachers cover math content children already know, they learn less, on average, whereas exposure to more advanced math content is positively associated with learning gains (Engel et al., 2013; Claessens et al., 2014; Engel et al., 2016). Similarly, children enrolled in Head Start for 2 years who experience the same activities across years, rather than more complex activities over time, learn less (Jenkins et al., 2016; Reynolds, 1995). In an experiment where supplemental high-quality math instructional opportunities were provided (for one treatment arm) in kindergarten and first grade to students who all experienced high-quality math instruction in preschool, the children who experienced high-quality math instruction, including a focus on mathematics learning trajectories, sustain the learning gains they made in preschool, whereas the group who received only the preschool-year intervention did not (Clements et al., 2013).
Thus, theory and research suggest that effective P–3 instructional alignment should involve consistency and continuity in positive and supportive instructional environments, exposure to high-quality pedagogical practices, and progression in academic content that aligns with children’s developmental needs and capacity. However, studies to date on P–3 alignment have focused more on understanding policies and district-level strategies aimed at fostering P–3 alignment than on what alignment looks like in the classroom.
Prior Research on P–3 Alignment
Empirical evidence on P–3 alignment is limited. Qualitative studies document district-level efforts to understand what facilitates or hinders P–3 alignment. Through site visits, observations, interviews, and document analysis, studies have identified factors that may support aligned instruction. Using implementation data and teacher interviews from contexts with funding and technical assistance to improve P–3 alignment, Geiser et al. (2013) find that efforts to align curricula were enhanced by instructional coaching where coaches with expertise in child development individualized support for teachers. Another study of an aligned P–2 curricula and professional development model finds that while teachers reported interest in instructional alignment, they often did not engage in activities, such as common planning meetings across grades, which might foster alignment (McCormick et al., 2020).
Studies document effective implementation of P–3 aligned curricula when teachers and grade level teams were able to both coordinate and backward map (Hogan, 2011; Marietta & Marietta, 2013). Hogan (2011) reports that these efforts led to teachers describing a better sense of their incoming students’ knowledge and skills. Strong data systems are also useful for P–3 alignment (Marietta, 2010). Potential barriers to implementation include limited funding for coaches and other support, time constraints, and difficulty supporting teachers in changing their practice (Manship et al., 2016; McCormick et al., 2020).
Studies have used quantitative data to explore alignment between Head Start and kindergarten. Franko et al. (2018) use the Head Start Family and Child Experiences Survey (FACES), finding most children who attend Head Start experience a decline in developmentally appropriate practices between preschool and kindergarten, with Latine children more likely to attend programs with weak transitional supports. Another study using data from the Head Start Impact Study (HSIS) finds consistency in the quantity of math instruction positively predicts end-of-kindergarten math outcomes for children who attended Head Start. Further, opportunities to engage in child-selected activities in preschool and kindergarten predict more positive end-of-kindergarten socioemotional outcomes (Mashburn & Yelverton, 2019).
Despite its likely importance for long-term development, research documenting early instructional alignment is scarce, with the exception of a handful of recent studies. One study of P–K content alignment in North Carolina used spring teacher surveys to explore content redundancy in reading and mathematics (Cohen-Vogel et al., 2021). Survey results indicate that over one-third of content (37%) in both literacy and math is redundant across P–K, and that children from households with low income experience more content redundancy.
Observational data provides a more reliable and comprehensive depiction than single point-in-time surveys (Rowan et al., 2009; Mayer, 1999). Several recent studies use classroom observational data to explore P–K alignment. One recent study of P–K alignment finds that children experienced lower quality interactions, rated by trained observers using the CLASS, with their teachers in kindergarten compared with pre-K, indicating a misalignment in quality in the transition from preschool to kindergarten. At the same time, students in the study experienced alignment in terms of progression toward more advanced content coverage in reading and math, measured using spring teacher surveys (Vitiello et al., 2020). Another recent study also used the CLASS to assess teacher-child interactions, again using spring teacher surveys to measure instructional content coverage (Burchinal et al., 2022). We know of no studies using classroom observational data to gather detailed information on P–3 instructional alignment related to instructional environments, pedagogical practices, and academic content coverage.
The Current Study
The current study addresses gaps in prior research using detailed data from classroom observations of math instruction to explore P–3 alignment in NYC, the nation’s largest urban district. We focus on math as math skills are highly correlated not only with later math achievement but also with reading and other outcomes including high school completion and college attendance (Claessens & Engel, 2013; Claessens et al., 2009; Duncan & Magnuson, 2011; Jordan et al., 2009). Historically, instruction on math content in preschool and kindergarten has received less time than literacy (Bassok et al., 2016; Engel et al., 2021; La Paro et al., 2009; Piasta et al., 2014; Sarama et al., 2008). Kindergarten teachers report spending nearly twice as much instructional time on reading than math (Engel et al., 2013), a pattern that has been documented over two decades and continues, on average, through at least fourth grade (Morton & Dalton, 2007). As such, exploring math instructional alignment is a first step toward informing policy, practice, and research with regard to P–3 instructional alignment.
Further, while recent research explores content redundancy across P–K in reading and math (Burchinal et al., 2022; Cohen-Vogel et al., 2021), the current study uses extensive classroom observations, rather than single-point-in-time teacher surveys to gain a more accurate understanding of content coverage. We also observed math instructional environments and pedagogical quality, in addition to content, as important aspects of P–3 alignment (Stipek, 2019; Stipek et al., 2017).
Using data from observations of math instruction in preschool, kindergarten, first-, and third-grade classrooms across 47 public preschools and 24 public elementary schools in NYC, this study is among the first in-depth explorations of P–3 alignment. We address the following research questions (RQs):
RQ1: Is there consistency and continuity in math instructional environments from P–3 (e.g., class size, student:adult ratios, time on math)?
RQ2: How consistent are high-quality pedagogical practices across P–3 (e.g., open-ended questions, hands-on activities, time in small group instruction)?
RQ3: What is the evidence regarding progression in instruction, with students exposed to increasingly complex math content over time, across P–3?
Methods
Data for this study come from detailed observations of math instruction conducted in NYC public preschool, kindergarten, first-, and third-grade classrooms between 2015 and 2019. In NYC public schools, like most of the nation, kindergarten is full-day. Researchers conducted 265 observations during the 4-year study. Table 1 provides a study timeline with information on the number of observations and classrooms observed by grade and year. Observers watched either a full day of instruction or the math block identified by the teacher. Math block observations lasted approximately 90 minutes, continuing until observers were certain the block had ended. All formal math activities observed during the math block are included. For full-day observations; conducted only in kindergarten, first, and third grades, just the math activities from regularly scheduled math instruction (i.e., the math block) are included.
Study Timeline, Number of Classrooms, and Observations by Year and Grade Level
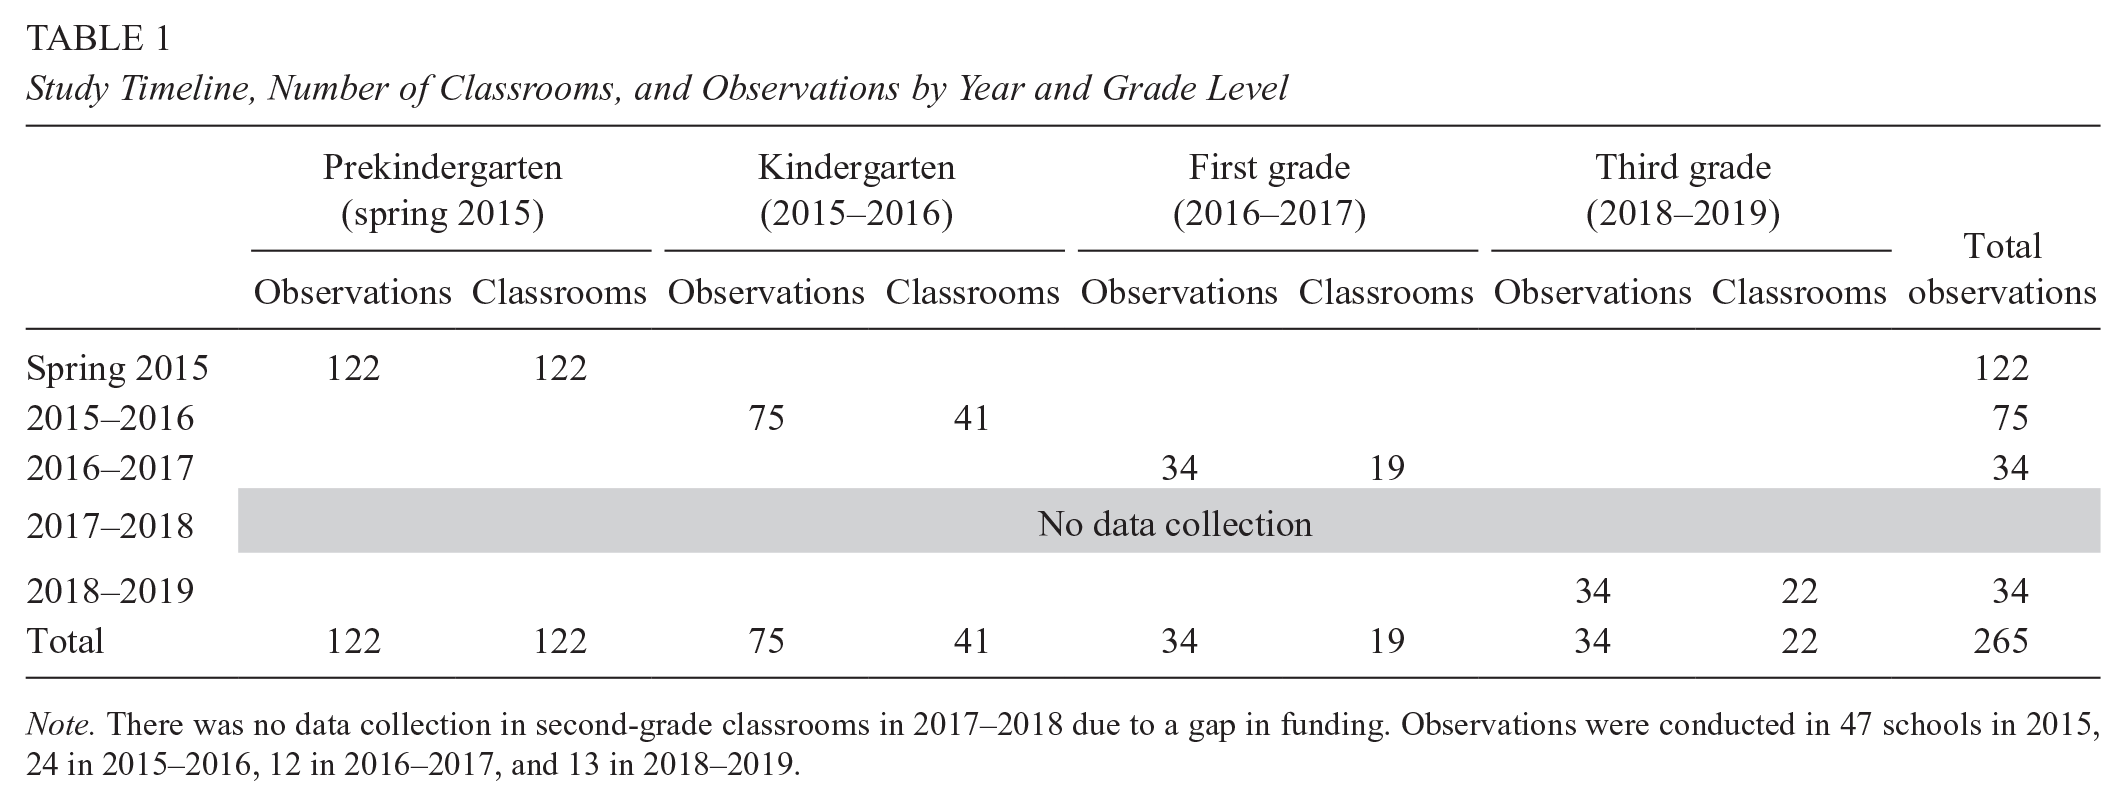
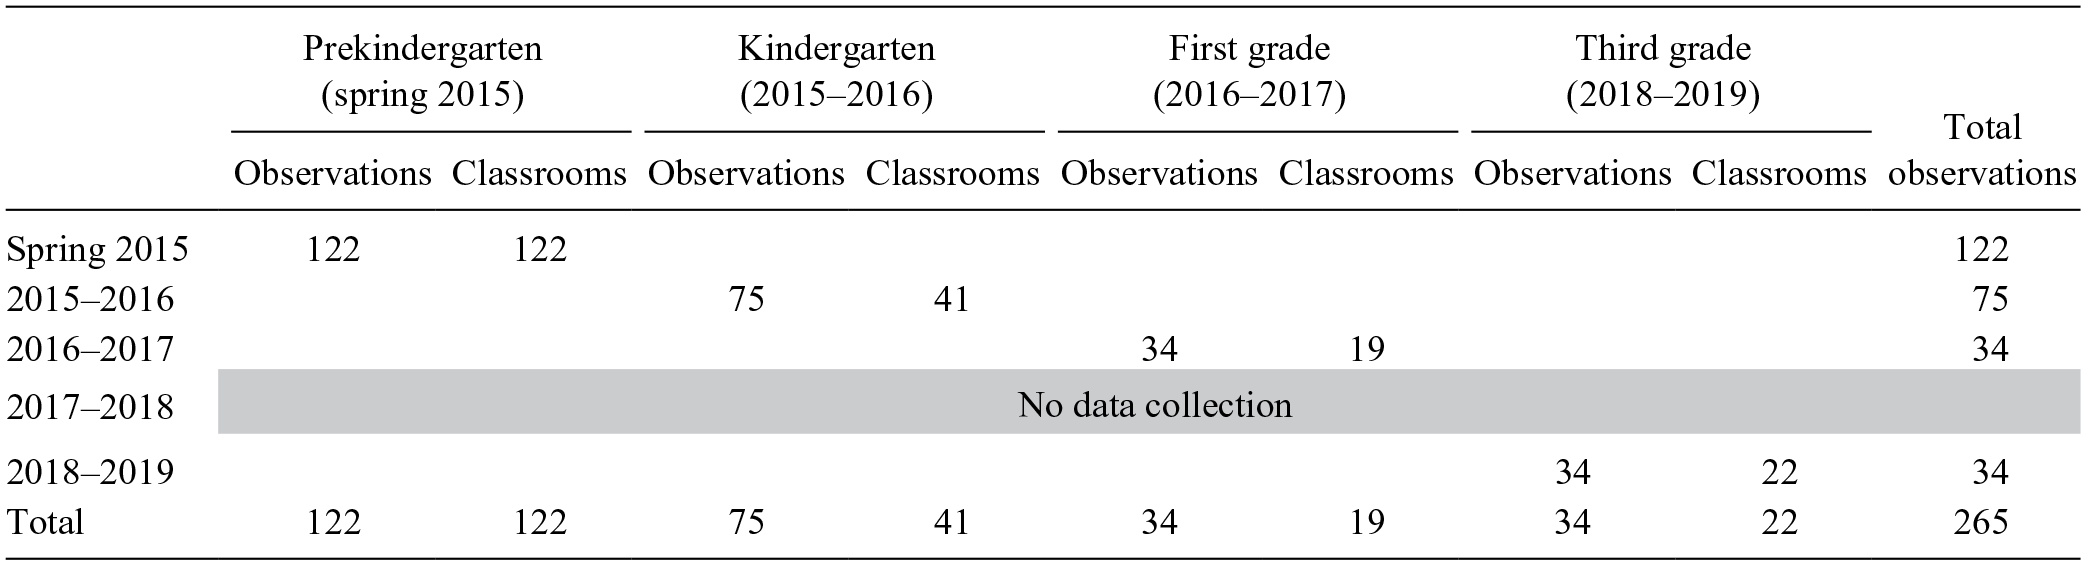
Note. There was no data collection in second-grade classrooms in 2017–2018 due to a gap in funding. Observations were conducted in 47 schools in 2015, 24 in 2015–2016, 12 in 2016–2017, and 13 in 2018–2019.
Sample
Preschools
In spring 2015, we observed math instruction in 122 NYC public preschool classrooms across 47 schools. These observations were part of a larger study, Making Pre-K Count (MPC). Selected NYC preschools serving children from households with low-income were randomly assigned to use Building Blocks, an evidence-based high-quality ECE math curriculum or to preschool-as-usual. The study team observed 61 Building Blocks and 61 preschool-as-usual classrooms (see the online supplemental appendix for details about MPC and selection of preschools).
These observations were a subset of the larger MPC study as we included only school-based pre-K MPC settings whereas the larger study included school- and community-based pre-K. Participation in the MPC study required that a minimum of 70% of a school’s students be eligible for free or reduced-price lunch (FRPL). While the current study uses classroom observations from a subsample from MPC, we note that the original study’s focus was on estimating the causal effects of Building Blocks (or Building Blocks along with participation in an aligned, high-quality after-school math programming the following year, in kindergarten) compared with preschool-as-usual in terms of both classroom practices and student outcomes. MPC found few statistically significant effects of Building Blocks, compared with preschool-as-usual, on the quality of math instruction, and no effects on student outcomes at the end of preschool (Morris et al., 2016).
Elementary Schools
Between 2015 and 2019, the study team conducted observations of math instruction in kindergarten, first-, and third-grade classrooms in the 24 schools that implemented Building Blocks in preschool, resulting in an observational data set of math instruction as it would have been experienced sequentially, across grades, by students. During summer 2015, researchers recruited the 24 schools to participate in a follow-up study of an out-of-school math club program and in kindergarten classroom observations (see the supplemental appendix for details). All 24 agreed to participate. Each subsequent study year, the study team recruited schools from the original 24 for classroom observations, with 12 schools participating in 2016–2017 and 13 in 2018–2019. 2 We note that the current study uses MPC preschool observational data, but otherwise is not related to the MPC study. While preschool teachers who implemented Building Blocks received training on implementing the curriculum, teachers in later grades did not have any professional development or exposure to the Building Blocks curriculum; nor was there notable coordination or collaboration among teachers across grade levels, including the transition from preschool to kindergarten.
All kindergarten, first-, and third-grade teachers, with the exception of classrooms designated special education and/or where instruction was conducted entirely in a language other than English, were recruited to participate. Consent rates were above 70%. As described in Table 1, in 2015–2016, we conducted 75 observations in 41 kindergarten classrooms, 34 observations in 19 first-grade classrooms in 2016–2017, and in 2018–2019 we conducted 34 observations in 22 third-grade classrooms. Due to a gap in funding, we did not observe second-grade classrooms in 2017–2018. We observed classrooms in both fall and spring, observing most, but not all teachers each semester.
School Composition
In participating elementary schools, 93% of students were FRPL-eligible on average. The vast majority were students of color; half of students in the 24 schools were Hispanic, 41% were Black, and approximately 5% were White. 3 Fewer than 2% were Asian, and under 2% indicated race/ethnicity as “more than one.” On average, 14% were English language learners.
Teacher Characteristics
Table 2 provides characteristics of observed teachers. Participating preschool teachers from the 47 schools were majority female and were diverse in terms of race/ethnicity. Nearly all had a master’s degree, and over 90% had more than 6 years of teaching experience. In kindergarten, first and third grade, teachers were predominantly female and ethnoracially diverse. Kindergarten teachers, for example, were 44% White, 28% Black, and 23% Hispanic. Over 80% held master’s degrees, and over 70% had taught for over 6 years across grades.
Teacher Demographic Characteristics by Grade-Level in Proportions (N = 265)

Observer Training
Trained observers, including study principal investigators, research associates, postdoctoral researchers, and graduate students, conducted observations. All observers completed a 2-day training that provided extensive guidance and practice using the observation protocol and were required to demonstrate 80% agreement on binary codes and 80% agreement “within 1” on Likert-scale codes with a master coder. See supplementary online materials for additional details on observer training.
Measures
Observers used adapted versions of the Classroom Observation of Early Mathematics—Environment and Teaching protocol (COEMET; Sarama & Clements, 2008). The COEMET measures quantity and quality of math instruction in preschool and elementary classrooms. In terms of content, the instrument focuses on the key mathematical learning trajectories for early mathematical development identified by Sarama and Clements (2009a). The COEMET is designed to document detailed information about Specific Math Activities (SMAs). As defined in the COEMET, SMAs are math activities lasting at least one minute with a discernible topic, goal and task. Observers recorded a new SMA each time there was a change in (a) student grouping (e.g., moving from whole group instruction to independent seatwork), (b) materials (e.g., using workbooks to no materials), or (c) topic (e.g., shifting from counting to addition). The online supplementary text provides details on each of the COEMET measures and items listed below.
Instructional Environments
To measure continuity in instructional environments, we used the following items from the COEMET:
Number of students present
Number of adults present
Time spent on mathematics
Pedagogical Practices
The COEMET also collects data on pedagogical practices and the quality of math instruction. We used the following items to measure consistency and continuity in pedagogical practices in math instruction across P–3:
Instructional grouping
Whole group
One-on-one
Small group
Hands-on activities: materials children used during math instruction including none, workbooks or worksheets, math journals, manipulatives, computers, or other
Classroom management: whether classroom management hindered instruction
Active teacher involvement: percentage of time the teacher actively engaged in math instruction
Open-ended questions (1–5 Likert scale): extent to which open-ended questions encouraging higher-order thinking and language use were asked by the teacher
Encouraged mathematical reflection (1–5 scale): extent to which the teacher encouraged students to think back on what they have learned and generalize concept(s) to other activities or their daily lives
Scaffolded instruction (1–5 scale): extent to which the teacher assisted children according to their current ability
Progression of Math Content
To measure the progression of math content, we used detailed data from the COEMET on the mathematics content that teachers covered. The primary math practice is the intended math topical focus of the math instruction. For the current study, math practices were collapsed into the following categories (see online supplementary materials for additional information):
Simple counting
Complex counting
Comparing and ordering
Simple addition/subtraction
Composing numbers
Complex addition/subtraction
Multiplication/division
Other numbers/operations
Other concepts
During observations, coders were instructed to prioritize the lead teacher’s activities, moving when needed to observe teacher-student interactions. For instance, if the lead teacher was working with a group of children, observers focused on that. See the online supplementary materials for additional details on measures, training, and the COEMET protocol.
Analysis
Data from the 122 preschool and 143 kindergarten, first-, and third-grade observations were entered and used to create quantitative data sets for descriptive analysis of time on math content, grouping, materials, and instructional delivery. As the current study used data from MPC but is not focused on treatment-control comparisons or outcomes, we do not focus on comparing Building Blocks and preschool-as-usual classrooms when reporting results from preschool observations. While preschool observations for MPC were conducted in both Building Blocks and preschool-as-usual classrooms, K–3 observations were conducted only in schools that had implemented Building Blocks in preschool (as noted above in the sample description). In the results that follow, we report pooled results for the 122 preschool observations.
For transparency (and for the interested reader), online supplementary materials include tables reporting differences between Building Blocks and preschool-as-usual classrooms for results reported below in Tables 2 through 5. As noted by Morris et al. (2016), there were few differences in mathematics instructional quality between Building Blocks and preschool-as-usual classrooms. Building Blocks teachers spent 12 more minutes on math instruction than comparison teachers, though time on math instruction in comparison schools was higher than anticipated. 4 During the study period, NYC was shifting to universal preschool and increasing the emphasis on math instruction in preschool classrooms, likely resulting in smaller-than-expected differences in math instruction, on average, between treatment and control conditions (Morris et al., 2016). We note, again, that the current study uses MPC preschool observations but is otherwise separate from the MPC study with different research questions and funding sources.
To answer RQ1 about consistency and continuity of the instructional environment, we calculated summary statistics (mean, standard deviation) for classroom characteristics and time spent on math. We also calculated the proportions of math instruction with each instructional grouping code. For RQ2, regarding consistency and continuity of pedagogical practices, we calculated the proportion of math instruction with select pedagogical practices (e.g., hands-on activities) and summary statistics for all measures coded on Likert scales (e.g., scaffolding). For RQ3 regarding progression of math content, we calculated the proportion of math instruction including each type of math content. Because neither schools nor classrooms were randomly sampled (i.e., sampling was purposive and not designed for drawing inferences regarding population parameters), we did not test for statistical significance of mean differences between grades.
Results
(RQ1) Consistency of the Instructional Environment
In exploring continuity and consistency of the instructional environment, we focus on describing spring observations (presenting results for both spring and fall in tables), noting differences from fall when relevant, as preschool was observed only in spring. Table 3 describes the classroom environment during math instruction, including the number of students and adults in the classroom, time spent on math instruction, and instructional grouping. Preschool classrooms had fewer children, 15 on average, than later-grade classrooms. Kindergarten classrooms had an average of just over 19 students, first grade around 20, and third grade just over 20. Further, from kindergarten on, there were one to two adults per classroom, compared with an average of nearly three adults in preschool classrooms.
Summary Statistics for Classroom Instructional Environment Indicators by Grade Level
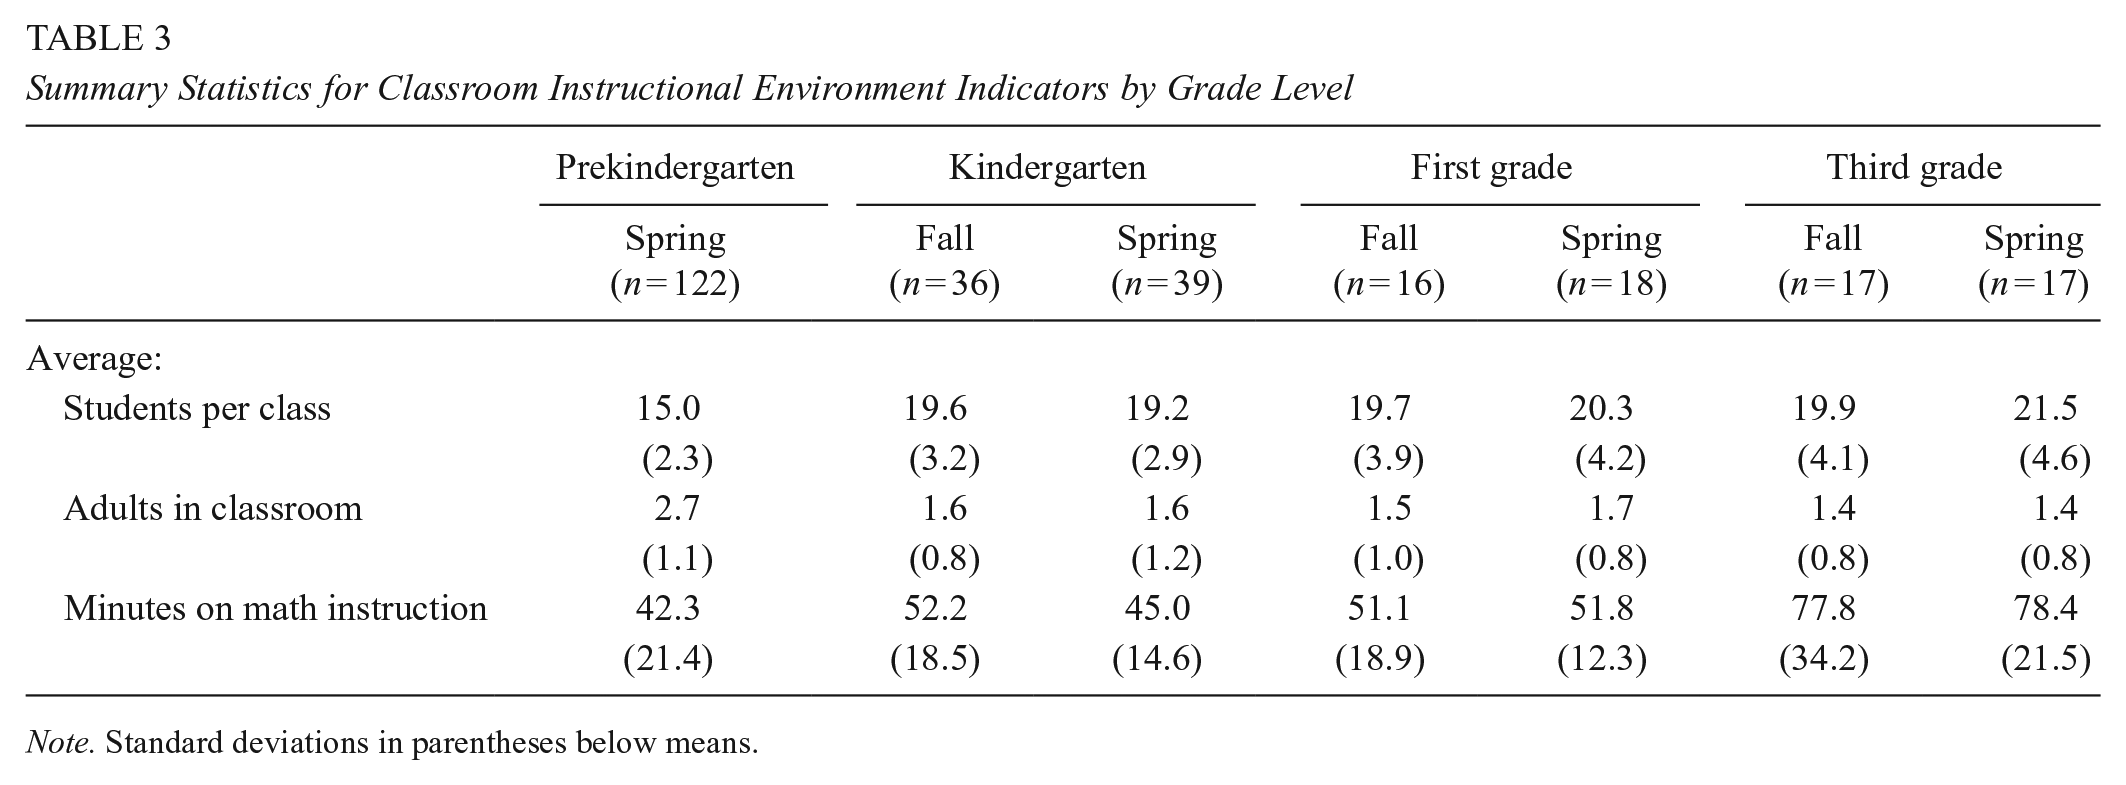
Note. Standard deviations in parentheses below means.
Class size, staffing, and student:adult ratios across grades are displayed in Figure 1. We observed differences from preschool to kindergarten including increased class size and fewer adults in the classroom, with observed preschool classrooms having an average student:adult ratio of under 6, compared with around 12 in kindergarten. The average increase of four students per class coincided with an average of one fewer adult per classroom across P–K. As shown in the figure, differences across K–3 are much smaller than those observed across P–K, with the number of students increasing slightly and number of adults per class declining slightly across grades.
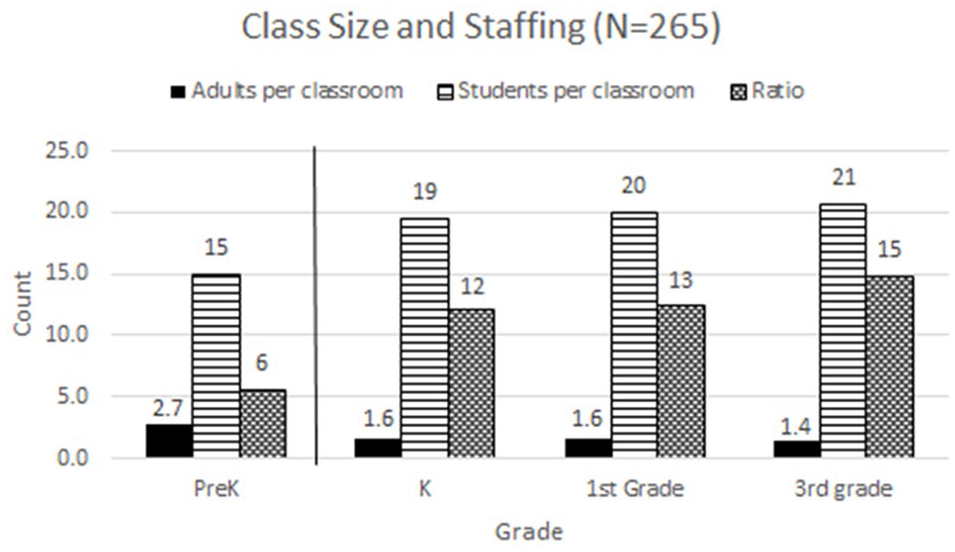
Average number of students, adults, and student: adult ratio per classroom across grades for observations (N = 265).
As Table 3 shows, total time on math increased systematically across grades, although time on math in preschool was substantial. Just over 42 minutes per observation were devoted to math in preschool, around 45 in spring of kindergarten, 52 in spring of first grade, and 78 minutes by third grade. Kindergarten is the only grade where we observe a decline in average time on math from fall (52 minutes) to spring (45 minutes).
(RQ2) Consistency of High-Quality Pedagogical Practices
Grouping
We observe a large shift in instructional grouping between preschool and kindergarten, as shown in Figure 2 and Table 4. During spring of preschool observations, children spent just over a quarter of math instructional time (26%) in small groups. In contrast, in kindergarten, approximately 8% of math activities were in small groups. This 18 percentage point decline is a 69% reduction in time in small groups during math from preschool to kindergarten.
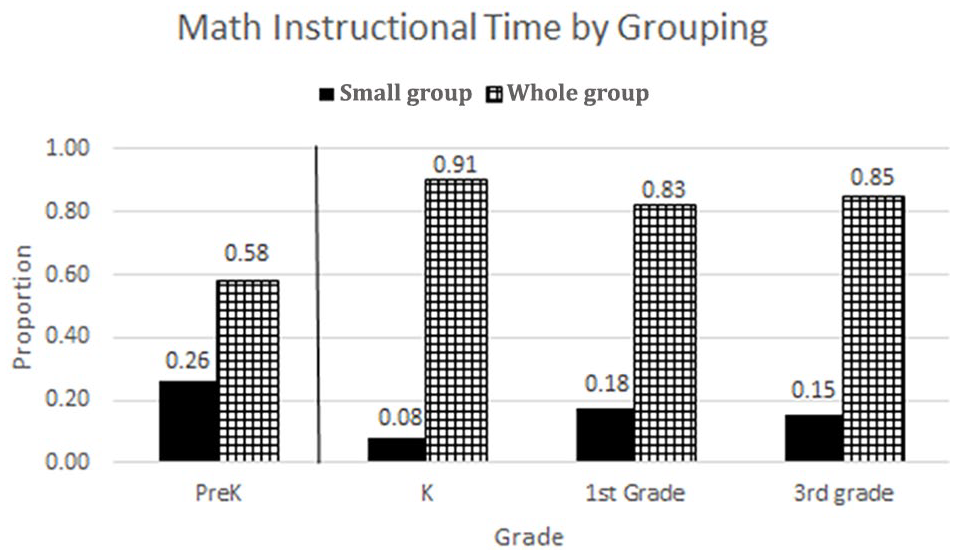
Proportion of math instructional time observed in whole group versus small group work across grades (N = 265).
Summary Statistics for Pedagogical Quality Measures (Proportions and Means) for Classroom Observations by Grade Level

Note. In kindergarten, first, and third grades, time doing individual seatwork was recorded. This was not recorded for preschool. Here, we include seatwork with whole group instruction. “Other” in PreK included “transition with teacher,” “meal with teacher,” and “other” that were not included in the K–3rd grade COEMET. Open-ended questions, scaffolding, and mathematical reflection coded on 1 to 5 Likert scale (1 = never; 5 = often). Scaffolding not rated in fall of kindergarten. Standard deviations in parentheses below means.
Notably, we observed more small group math instruction in both first- and third-grade classrooms compared with kindergarten, ranging from 18% in fall of first grade to 14% in spring of third grade. The majority of time in kindergarten, first-, and third-grade classrooms was spent in whole group instruction and seatwork. Over 90% of math instructional time in kindergarten was spent with the whole group or doing seatwork, more than we observe in any other grade across P–3. Thus, on average, students experienced close to a 20 percentage point decrease in time in small groups from spring of preschool to fall of kindergarten. The following year in first grade, students experienced substantially more small group time than in kindergarten, approximately doubling time in small group math instruction from kindergarten to first grade.
Hands-On Activities
Figure 3 shows a decline in math instruction that included hands-on activities across grades (also shown in Table 4). By far the largest shift in the use of hands-on activities occurred between preschool and kindergarten. During spring preschool observations, an average of 81% of math instruction involved hands-on activities. In contrast, 25% (fall) to 30% (spring) of kindergarten math instruction involved hands-on activities; a reduction of over 50 percentage points. While declines from kindergarten to third grade are smaller, by third grade, less than 10% of math instruction included hands-on activities.

Proportion of math instructional time with hands-on activities across grades (N = 265).
Other Measures of Quality Pedagogical Practices
As shown in Table 4, teacher involvement during math instructional time was highest in preschool, with only a small decline observed in kindergarten. In contrast, while classroom management hindered instruction only 6% of the time in preschool, we observed an increase on this measure to 17% in the fall of kindergarten, the highest level recorded across semesters and grades, with a subsequent decline to 11% in spring kindergarten observations.
We remind the reader that the degree to which the observed teacher asked open-ended questions, encouraged mathematical reflection, and scaffolded instruction was measured on a 1- to 5-point Likert scale where one means the pedagogical approach (e.g., asking open ended questions) was never observed during math instruction, three indicates that it was sometimes observed, and five indicates that the teacher engaged in the practice throughout the lesson. As Table 4 shows, average levels on these indicators of pedagogical quality were quite low, ranging from 1.62 (rarely) in preschool for “asked open-ended questions” to a high of 3.39 (sometimes) in third grade for “encouraged mathematical reflection.” Thus, on average across P–3, we did not observe math instruction that included the frequent use of high-quality pedagogical practices including asking open-ended questions, encouraging mathematical reflection, or scaffolding.
We observe an increase in teachers’ use of open-ended questions and mathematical reflection across grades, although on average these practices remain relatively infrequent. As noted above, in spring of preschool, the average observer rating of asked of open-ended questions was 1.62 on a 5-point scale (almost no open-ended questions). By spring of third grade, the average observer rating was 2.99 (sometimes asks open-ended questions). We observed a similar increase in mathematical reflection—from an average of 2.01 (little mathematical reflection) in spring of preschool to 3.01 (some reflection) in spring of third grade. In contrast, scaffolding did not change substantially from preschool through third grade in the classrooms we observed, with the highest levels, averaging 2.3 on a 5-point scale (between almost never and sometimes) in spring of kindergarten and fall of first grade, only slightly higher than other grades.
(RQ3) Progression of Math Content
In exploring the progression of math content, we note that, unlike RQs 1 and 2, we focus on both fall and spring results when available, as differences across semesters within grades are highly relevant for assessing content progression. Overall, we find both substantial progression in terms of math content coverage over time, as well as repetition of content, as shown in Figure 4 and Table 5. The math content observed most frequently in spring of preschool included simple counting (24% of math instruction) and comparing and ordering numbers (19%). There was also substantial coverage (33%) of other math concepts including shapes, patterns, sorting, and spatial sense; math topics that were observed far less frequently in kindergarten, first, and third grades. Notably, in spring of preschool, 17% of observed math instruction focused on simple addition and subtraction, a topic that received little coverage (5%) in fall of kindergarten.

Proportion of instructional time on various math topics across grades (N = 265)
Mathematics Content Coverage for Classroom Observations by Grade Level and Semester

Note. Complex counting, complex addition/subtraction and other numbers/operations were not included in the preschool observation protocol. Other numbers/operations were not included on kindergarten protocol. These items were added to reflect content likely to be covered in kindergarten, first, and/or third grade.
Kindergarten teachers introduced some new math content, relative to preschool, in fall. One-third (33%) of fall kindergarten math instruction focused on composing numbers (e.g., combining numbers to make seven), content almost never observed in preschool. In fall of kindergarten, observed math instruction also focused on simple counting and comparing and ordering numbers (23% and 22%, respectively). This content coverage was very similar to what was observed in preschool, with substantially less emphasis by spring of kindergarten (12% and 7%, respectively). By spring of kindergarten, most math instruction focused on simple (23%) or complex (22%) addition and subtraction as well as composing numbers (17%). Spring also included more complex counting (8% of math instruction compared to 1% in fall).
The most frequently observed math content in fall of first grade includes simple and complex addition/subtraction (42% and 33%, respectively), with an increased focus on complex addition/subtraction, (41% of all math activities) observed in spring. We also observed new math content—17% of math activities in spring of first grade focused on new concepts involving numbers and operations including place value and fractions.
By fall of third grade, 68% of math activities focused on multiplication and division, with an additional 18% on concepts such as writing and interpreting equations. In spring of third grade, 12% of math instruction focused on complex addition/subtraction, 18% on multiplication/division, 35% on other numbers/operations, and approximately one-third (34%) on other mathematical concepts.
We observe a substantial narrowing of content, particularly between preschool and kindergarten. Preschool teachers devoted 33% of math activities to math concepts other than numbers and operations including measurement, shapes, patterns, sorting, and spatial sense. We rarely observed any of these topics in kindergarten, first grade, or in fall of third grade. In spring of third grade, however, 34% of observed math activities were devoted almost exclusively to measurement and telling time (reported under “Other Concepts”, Table 5).
Discussion
The current study is the first, to our knowledge, to use classroom observational data to document P–3 instructional alignment. Focusing on math instruction in NYC, we conducted and analyzed 265 observations of math instruction in pre-K, kindergarten, first-, and third-grade classrooms, observing sequentially to describe math instructional alignment across grades as it would be experienced by students. We explore continuity and consistency in classroom environments and pedagogical quality, as well as the progression of math instructional content across preschool through third grade.
Continuity and Consistency
P–3 Math Instructional Environments
On a number of measures of the math instructional environment, we document what we consider to be abrupt or large changes. Children who began kindergarten in the classrooms we observed were only four months older than they were at the end of preschool. We would not anticipate substantial developmental change, on average, across those four months. However, the math instructional environment changed markedly.
Effective instruction adapts expectations, rules, and academic practices to children’s developmental needs (Kindermann & Skinner, 1992). In transitioning from preschool to kindergarten, children in the classrooms we observed experienced a notable increase in class size (going from around 15 to 19 students) coupled with a decline in the average number of adults in the room (from close to three to between one and two), resulting in a doubling of the average student:adult ratio from six to 12. Rapid and incongruous shifts in classroom environments from preschool to kindergarten are likely suboptimal for young children’s learning and development (Rimm-Kaufman & Pianta, 2000; Yelverton & Mashburn, 2018).
In contrast, we did not observe an abrupt shift between preschool and kindergarten in time on math. Preschool teachers spent an average of 42 minutes on math (nearly 47 minutes in Building Blocks classrooms and 38 minutes in preschool-as-usual classrooms, as shown in the Supplementary Table 2 in the online supplementary materials). This contrast is much smaller than that observed in previous studies of the Building Blocks curriculum, where control classrooms spent as little as 12 minutes on math in 3 hours (Sarama et al., 2008). Substantially less time on math was also observed in the Tulsa pre-K study (Johnson et al., 2016). The additional time on math we observed may reflect an increasing emphasis on math in NYC during this time period (Mattera et al., 2018). Even with relatively high levels of math time observed in preschool, teachers devoted more minutes to math instruction in higher grades, with teachers spending 45 in spring of kindergarten, 52 in spring of first grade, and 78 minutes in third grade.
While we consider results regarding time on math to be an example of continuity in instructional environments, with time increasing incrementally across grades, this was the only aspect of the P–3 instructional environment that we would describe as having continuity, given the doubling of the student:adult ratio from six to 12 between preschool and kindergarten.
Quality P–3 Pedagogical Practices
We observed far less small group instructional time in kindergarten in comparison not only to preschool, but to first and third grades as well. While preschool students spent 26% of their math time in small group activities, kindergarteners spent only 7% to 10% of math time in small groups, on average. By fall of first grade, small group instructional time was around double that observed in kindergarten, with third graders spending more time in small groups as well.
This result is important to highlight as small group instruction in mathematics is a promising means for improving math learning for young children (Jacob & Jacob, 2018; Jacob et al., 2020). Small groups create opportunities for young children to interact one-on-one with peers and adults, (Bowman et al., 2001), facilitating language development (Wasik, 2008), and providing time for students to practice socioemotional and self-regulation skills (Bodrova & Leong, 2007; Skinner, 2018). The little time for small group work we observed in kindergarten limits these opportunities.
In fact, the aspect of the MPC study, from which we use preschool observational data, that was found to be most impactful was participation in high-quality, small group math programming outside of school hours (Mattera et al., 2018, 2021). Children who participated in MPC and were assigned to Building Blocks preschool classrooms were rerandomized prior to kindergarten and assigned to either business as usual or to participate in High 5s (the high-quality math programming that was provided outside of school hours with no connection to classroom instruction). 5 High 5s participation, on its own as well as in combination with experiencing the Building Blocks curriculum in preschool, resulted in positive effects on student outcomes at the end of third grade (Mattera et al., 2021).
In addition to the substantial differences on a number of measures of the instructional environments from preschool to kindergarten in the classrooms we observed, we also observed inconsistencies in some measures of pedagogical quality, and consistently low quality across grades on other measures. Several aspects of the kindergarten math instruction we observed are concerning. Quality instruction for young children requires opportunities for social learning interactions, high levels of child participation, and high-quality instructional practice (Durden & Dangel, 2008; Nesbitt & Farran, 2021).
The marked decline in hands-on math activities between preschool and kindergarten classrooms is particularly concerning. Hands-on experiences support children in learning abstract concepts, enhancing ECE experiences (Ball, 1992; Baroody, 1989; Piaget, 1970). Concrete counting experiences—pointing, touching, or moving objects and assigning objects a number in the counting sequence—are critical for understanding one-to-one correspondence and cardinality (Carpenter et al., 2017). Hands-on experiences coupled with quality instruction enhance math learning (Uttal et al., 2009).
These observed instructional differences may be driven by school structures and organization. By kindergarten, the teacher was often the only adult in the room. Yet, in fall of kindergarten—a mere four months after preschool—students will not have matured or developed in ways that justify the differences we observe in kindergarten. This disconnect between staffing and children’s development may hinder kindergarten teachers from engaging in small group instruction and hands-on activities. When a teacher works with a small group, the other children need to be able to follow instructions independently. Kindergarteners need support in using materials. Without sufficient scaffolding and support, or other adults to assist, kindergarten teachers likely face the greatest challenge engaging in these activities.
Developmental theory highlights the importance of repeated, high-quality interactions over an extended period for facilitating children’s academic growth (Bronfenbrenner & Morris, 2007). This does not appear to occur consistently in the classrooms observed. Open-ended questions, mathematical reflection, and scaffolding were observed infrequently, particularly in preschool and kindergarten. Although frequency increased somewhat across grades, high-quality pedagogical practices were far from ubiquitous. This is consistent with prior research, finding that these practices occur infrequently, despite their positive association with student outcomes (e.g. Mashburn et al., 2008). Throughout the P–3 period, children would likely benefit from more reflective dialogue and open-ended questions and conversations in math.
Progression in P–3 Math Content
We observed substantial progression across grades in math content. Content shifted in terms of level of challenge, from a focus on counting to addition and subtraction and then multiplication/division across grades. We note that the most frequently observed primary math content focused on in fall of kindergarten was composing numbers, a practice that was almost never observed in preschool. While some of the content covered in kindergarten, especially in fall, repeated preschool content, by spring of kindergarten, teachers were typically covering new material. Whether the repetition we observed in the fall is warranted remains an open question. From one perspective, evidence suggests that excessive repetition of basic mathematics content may be associated with smaller learning gains (Engel et al., 2013). At the same time, we do not know how much repetition is excessive. Cohen-Vogel et al. (2021) estimate that 37% of content in reading and mathematics was redundant across preschool and kindergarten. Future research should explore the difference between useful repetition for reminding students of what they know and scaffolding new content versus redundancies that may constrain opportunities to learn.
We also note a marked narrowing of content across grades. In preschool, one-third of math instruction involved concepts such as patterning, sorting, measurement, and geometry. In contrast, elementary school teachers we observed devoted very little time to these topics. Time on math concepts other than numbers and operations can help build overall math proficiency (Clements & Sarama, 2014). For example, eighth-grade outcomes are predicted by early skills in both pattern recognition and measurement (Claessens & Engel, 2013). To the extent that children benefit from exposure to a range of math content, the early narrowing of content we observed may be disadvantageous, particularly as more complex math concepts are introduced in later grades.
Limitations
The current study has several limitations. First, it is descriptive in nature and was not designed for statistical inference. Further, we cannot link classroom observations to child outcomes. Thus, we are unable to test hypotheses regarding P–3 instructional alignment and fadeout of effects of ECE. Linking detailed and extensive observational data on P–3 alignment to child-level outcomes is an important next step in research on instructional alignment.
We conducted this study in a single urban district and do not know whether our findings generalize to other contexts. Others should replicate and expand on the current study. Our observations were also limited to two points in time per classroom—once in fall and once in spring. While classroom observations are better than single point-in-time surveys (Rowan et al., 2009) typically used to assess content coverage and pedagogy, with two observations per year we may have missed important aspects of instruction.
Finally, while our measures of math content are quite nuanced, our measures of pedagogical quality are coarser. As theory suggests that pedagogy may be as important as content in P–3 alignment (Bailey et al., 2020; Stipek, 2019), we encourage future researchers to conduct more comprehensive explorations of pedagogical quality across P–3 classrooms.
Conclusion
The progression of math instructional content coverage we observed across P–3 seems logical, with challenge generally increasing across grades. Of concern, however, is a lack of continuity and consistency in instructional environments and in high-quality pedagogical practices, particularly between preschool and kindergarten. The rapid shift in expectations for learning and behavior in kindergarten, compared with preschool, is not consistent with children’s developmental needs (Rimm-Kaufman & Pianta, 2000; Yelverton & Mashburn, 2018). Children benefit from stability and from environments that meet them where they are at developmentally. As researchers (e.g., Bailey et al., 2020; Stipek, 2019) and policymakers (Copple & Bredekamp, 2009) suggest, alignment should focus on classroom environments and pedagogy as well as content.
Access to affordable preschool has greatly expanded as a means to provide all children with ECE to prepare them for formal schooling. This is a promising step. However, consistent evidence on the fadeout of preschool effects (Li et al., 2020) suggests these efforts alone will be insufficient. Educators and researchers must attend to alignment of P–3 instructional experiences in addition to continued advocacy for access to high quality preschool for all.
A renewed consideration of kindergarten is a particularly important starting point for facilitating P–3 alignment. Our results suggest that kindergarten may be poorly aligned with both preschool and the early elementary grades that follow. Students would likely benefit from increased consistency in terms of both student:adult ratios and instructional grouping in the transition from preschool to kindergarten. Reducing class size in kindergarten, while costly, might allow for increased small group instruction and individualized attention for students. Ensuring kindergarten classrooms have paraprofessionals/teachers’ assistants could also facilitate more developmentally aligned activities.
In the absence of the above-mentioned options, school administrators may want to explore professional development to support kindergarten teachers in increasing small-group and hands-on activities for their young learners, despite the barriers of larger class sizes and fewer adults per classroom. Our results suggest that kindergarten teachers face the greatest challenge in enacting these practices. Kindergarten class sizes and student-teacher ratios are similar to those in first and third grades. However, the new kindergarten students teachers meet each fall are developmentally more like preschool students than first graders. Supporting the transition from pre-K to elementary school by providing a more aligned classroom experience may be an important lever for sustaining early learning gains.
Supplemental Material
sj-docx-1-ero-10.1177_23328584241281483 – Supplemental material for The Alignment of P–3 Math Instruction
Supplemental material, sj-docx-1-ero-10.1177_23328584241281483 for The Alignment of P–3 Math Instruction by Mimi Engel, Robin Jacob, Anna Hart Erickson, Shira Mattera, Danielle Shaw Attaway and Amy Claessens in AERA Open
Supplemental Material
sj-docx-2-ero-10.1177_23328584241281483 – Supplemental material for The Alignment of P–3 Math Instruction
Supplemental material, sj-docx-2-ero-10.1177_23328584241281483 for The Alignment of P–3 Math Instruction by Mimi Engel, Robin Jacob, Anna Hart Erickson, Shira Mattera, Danielle Shaw Attaway and Amy Claessens in AERA Open
Footnotes
Declaration of Conflicting Interests
The author(s) declared no potential conflicts of interest with respect to the research, authorship, and/or publication of this article.
Funding
The author(s) disclosed receipt of the following financial support for the research, authorship, and/or publication of this article: This work was funded through generous support from the Heising-Simons Foundation and the Robin Hood Foundation. Publication of this article was funded by the University of Colorado Boulder Libraries Open Access Fund. All errors and opinions are those of the authors.
Notes
Authors
MIMI ENGEL is an associate professor at the University of Colorado, Boulder, in the School of Education’s program in Research & Evaluation Methodology, Miramontes Baca Education Building, Room 400B, 249 UCB, Boulder, CO 80309;
ROBIN JACOB is a research professor at the University of Michigan’s Institute for Social Research, 426 Thompson Street, Ann Arbor, MI 48104;
ANNA HART ERICKSON is a senior project manager at the University of Michigan Youth Policy Lab, 426 Thompson St., Ann Arbor, MI 48106;
SHIRA MATTERA is a senior research associate at MDRC, 200 Vesey St., New York, NY 10281;
DANIELLE SHAW ATTAWAY is a researcher at the American Institutes for Research, 1400 Crystal Drive, 10th Floor, Arlington, VA 22202;
AMY CLAESSENS is a professor in the Department of Educational Policy Studies, School of Education, University of Wisconsin, Madison, 1000 Bascom Mall, Madison, WI 53706;
References
Supplementary Material
Please find the following supplemental material available below.
For Open Access articles published under a Creative Commons License, all supplemental material carries the same license as the article it is associated with.
For non-Open Access articles published, all supplemental material carries a non-exclusive license, and permission requests for re-use of supplemental material or any part of supplemental material shall be sent directly to the copyright owner as specified in the copyright notice associated with the article.