
Abstract
Policymakers and researchers have for many years advocated disparate approaches to ensuring teachers deliver high-quality instruction, including requiring that teachers complete specific training requirements, possess a minimum level of content knowledge, and use curriculum materials and professional development resources available from schools and districts. In this paper, we investigate the extent to which these factors, which we conceptualize as resources for teaching, predict instructional quality in upper elementary mathematics classrooms. Results show that teachers’ mathematical knowledge and their district context explained a moderate share of the variation in mathematics-specific teaching dimensions; other factors, such as teacher experience, preparation, non-instructional work hours, and measures of the school environment, explained very little variation in any dimension.
Introduction
Over the past half-century, scholars have attempted to explain why some teachers appear more effective than others in raising student test scores. A substantial body of research, some of it experimental, in the “process-product” tradition found, for example, relationships between student achievement and opportunity to learn, time spent on curricular activities, and classroom management (for a review, see Brophy & Good, 1986). Studies from the “education production function” literature indicate that students learn more from teachers who have stronger content preparation and more classroom experience (Bowles, 1970; Chetty et al., 2011; Hanushek, 1979; Monk, 1994; Wayne & Youngs, 2003). A similar line of research beginning in the 1980s suggests that teachers’ knowledge of the specific content they teach—sometimes called pedagogical content knowledge or content knowledge for teaching—predicts differences in student achievement (Baumert et al., 2010; Hill, Rowan, & Ball, 2005; Metzler & Woessmann, 2012). And over the past several years, data generated from video-based technology and lessons scored on observation instruments identified several other classroom characteristics that predict student performance: an orderly and positive environment (Bell et al., 2012), time on task (Stronge, Ward, & Grant, 2011), and the cognitive and disciplinary demand of instruction (Blazar, 2015; Grossman, Cohen, Ronfeldt, & Brown, 2014; Hill, Kapitula, & Umland, 2011).
Although it is clear that specific teacher characteristics and teaching practices can improve students’ academic achievement, little is known about factors that predict teaching itself. That is, which elements in teachers’ backgrounds and environments relate to the quality of their instructional practices? Despite the fact that teachers’ effects on student outcomes logically occur through instruction, fewer studies have examined whether and how this occurs. In fact, some have argued that teaching is the “missing variable” (Smith, Desimone, & Ueno, 2005, p. 77) in analyses relating teacher characteristics to student achievement. In this line of thinking, understanding the ways in which teacher backgrounds, teacher habits and skills, and school and district environments support instructional quality could help direct resources—interventions, broad-scale policies, and research priorities—toward factors likely to improve classroom teaching and, by extension, student test scores. These efforts are particularly important for mathematics, which is a growing focus of U.S. education policy (Johnson, 2012).
Research that does exist in this area points to relationships between instructional quality and three broad classes of teacher characteristics: background characteristics such as educational experiences and prior career experience (Leinhardt, 1989; Scribner & Akiba, 2010); knowledge, habits, and dispositions, including content and pedagogical content knowledge, and self-efficacy (Baumert et al., 2010; Hill et al., 2008; Holzberger, Philipp, & Kunter, 2013); and resources governed by the institutions teachers work in, including curriculum materials and pacing guides, test preparation practices, class size, and the distribution of students into classrooms (Correnti & Rowan, 2007; Croninger, Buese, & Larson, 2012; Graue, Rauscher, & Sherfinski, 2009; Pianta, Belsky, Houts, & Morrison, 2007). However, to date, much of prior research has taken place in silos, with no large-scale comparative assessment of the many predictors of instructional quality.
In this paper, we integrate these research traditions by investigating the extent to which teacher background characteristics; teacher knowledge, habits, and dispositions; and institutional resources predict observed instructional quality in upper elementary mathematics classrooms. To measure instructional quality, we use videos of classroom practice scored by two protocols—the Mathematical Quality of Instruction (MQI), a content-specific instrument, and the Classroom Assessment Scoring System (CLASS), a general instrument. Importantly, prior research has identified relationships between both MQI and CLASS measures of teaching and students’ academic achievement (e.g., Bell et al., 2012; Blazar, 2015; Pianta, Belsky, Vandergrift, Houts, & Morrison, 2008) as well as students’ non-tested outcomes including their self-reported behavior in class, self-efficacy in math, and happiness in class (Blazar & Kraft, 2015). Thus, any relationships we identify between teacher background characteristics; teacher knowledge, habits, and dispositions; and institutional resources and instructional quality likely also work to improve student outcomes. Although we are not able to capture every possible characteristic that might relate to teachers’ instructional quality, we argue that the analyses we provide advance the field.
In the following, we describe existing literature in this arena, then present the methods of and results from our analyses.
Background
Over a decade ago, Cohen, Raudenbush, and Ball (2003) argued for a reconceptualization of educational resources, away from such resources as conventionally imagined by economists (e.g., school finance, class size, teacher experience, and degree types) and toward a model that connects resources, instruction, and student test scores. In this logic, the identification of resources follows the identification of effective instructional techniques: The first question should be: “What instructional approach, aimed at what instructional goals, is sufficient to insure that students achieve those goals?” A second question follows: “What resources are required to implement this instructional approach”? (pp. 134–135)
In particular, Cohen and colleagues (2003) advocated answering the second question by searching for resources that are more proximal to instruction than dollars, degrees, or experience. Taking intellectually ambitious teaching and student learning as the goal, the authors nominated several resources that might help achieve high-quality instruction, including teachers’ knowledge of subject matter, learners, and materials appropriate for supporting learning; teachers’ skill in motivating learners to apply themselves to classroom tasks; and the resources available within teachers’ environment, including guidance for instruction and collaboration with colleagues.
Research conducted both prior to and following Cohen et al. (2003) helps answer the authors’ first question, describing how such resources might be associated with student test scores. In a review of the literature on the effects of classroom mathematics teaching on student learning, Hiebert and Grouws (2007) noted that different features of teaching might promote skill efficiency, conceptual understanding, or both. Their review found that students’ skill efficiency was related to fast teaching pace, use of teacher-directed questioning, and smooth transitions from teacher demonstrations to student practice, while students’ conceptual understanding, and in many cases also their skill efficiency, was related to teachers’ explicit attention to concepts and students’ engagement in struggling with important mathematics. Drawing on the same data as this analysis, Blazar (2015) also found that the complexity of tasks that teachers provide for students and their interactions around the content predicted math test scores.
Focusing more broadly on characteristics of teachers themselves—rather than their classroom instruction—studies of the education production function suggested that student achievement is stronger when teachers are more experienced (Chetty et al., 2011; Hanushek, 1996; Kane & Staiger, 2008; Rockoff, 2004), more knowledgeable of the content they teach (Metzler & Woessman, 2012), and, for high school, when teachers hold a major or minor in the subject taught (Goldhaber & Brewer, 1999; Wayne & Youngs, 2003). Related studies have found that teachers’ pedagogical content knowledge (Baumert et al., 2010), content knowledge for teaching (Hill et al., 2005), knowledge of student errors and misconceptions (Sadler, Sonnert, Coyle, Cook-Smith, & Miller, 2013), high-fidelity enactment of standards-based curriculum materials (Stein, Remillard, & Smith, 2007; Tarr et al., 2008), and efficacy (Tschannen-Moran & Hoy, 2001) showed statistically significant though small associations with classroom-aggregated test scores. A markedly smaller class size also has been thought of as a classroom-level resource to improve test scores, in that teachers may have more time to spend with particular students and students may have more opportunities for active engagement (Blatchford, Bassett, & Brown, 2005; Cohen et al., 2003; Graue et al., 2009; Nye, Hedges, & Konstantopoulos, 1999).
Despite the fact that the connection between such resources and student test scores must at least partially run through instruction itself, the relationship between resources and instruction has been investigated less often. One reason may be that moderate to large-scale studies that capture both sets of measures—teachers’ resources and instructional quality—have been relatively rare until recently. Another reason may be that the contemporary emphasis on improving student test scores has eclipsed interest in the ways resources might support the provision of high-quality classroom experiences. Yet few think that student test scores, at least as measured by state standardized tests, adequately capture those classroom experiences (e.g., Darling-Hammond, Amrein-Beardsley, Haertel, & Rothstein, 2012; Kohn, 2000a); it also is of interest to policymakers to understand how resources are converted into classroom instruction, especially given financial investment in some resources (e.g., master’s degrees) over others.
We review existing research on these questions, research we found to be organized into three lines of study: the relationship between background characteristics, such as experience and coursework, and instruction; the relationship between teachers’ knowledge, habits, and dispositions, such as subject matter knowledge and self-efficacy, and instruction; and how resources governed by the institutions teachers work in, including curriculum materials, peers, and class size, may relate to instruction.
Background Characteristics
In this first category, resources for instruction were demarcated by experiences and milestones reached by teachers, then compared with observation or self-reports of instructional practice. For instance, in an analysis of the eighth-grade 2000 NAEP Mathematics Assessment teacher questionnaire, Smith et al. (2005) found that experienced teachers were more likely to report utilizing conceptual goals and strategies in their instruction, whereas those with less experience were more likely to report using procedural strategies. They further observed that teacher certification was not significantly associated with teacher-reported use of reform-oriented instructional strategies. Also using nationally representative data, Guarino, Hamilton, Lockwood, Rathbun, and Hausken (2006) showed that the number of mathematics teaching methods courses that teachers had completed was positively associated with several self-reported teaching practices, including teacher-centered demonstration and student computational practice, student-centered instruction, and mixed-achievement level grouping. Prior teaching experience also was positively associated with mixed-achievement grouping, although teacher certification status was generally unrelated to most measures of reported instructional practices. Though these studies rely on self-report data, they suggest that instructional quality may relate to some teacher background factors. However, the size of those relationships generally is small.
Research on observed instructional quality also sheds light on this point. For example, in a comparison of six preservice and cooperating teachers, Borko and Livingston (1989) found that novices planned lessons less efficiently and experienced difficulty responding to students’ questions and ideas. In a study of four expert and two novice teachers, Leinhardt (1989) found that expertise was associated with more detailed and logical lesson plans, more efficiently conducted lessons, and more complete instructional explanations. Westerman (1991) found that cooperating teachers were more likely than preservice novices to integrate knowledge of subject matter, curriculum, and students’ interests, motivations, and prior knowledge into both the planning and teaching processes and had more strategies for redirecting student off-task behavior. These findings suggest that experience may be particularly salient in helping teachers to conduct efficient lessons, prevent student off-task behavior, and respond to students’ interests and subject matter learning.
Larger-scale studies that link teacher background characteristics to teachers’ scores from standardized observation instruments are more scarce. Scribner and Akiba (2010) demonstrated that alternatively certified STEM teachers’ prior career length and subject matter relevance did not predict scores on an observational measure of standards-aligned instruction; however, prior experience in the field of education did. A reanalysis of seven early childhood studies (Early et al., 2007) suggested that neither possession of a bachelor’s degree nor possession of an early childhood education/child development major showed consistent relationships to lead preschool teachers’ observed classroom quality. Evidence from another large-scale study also is mixed; Stuhlman and Pianta (2009) found a positive relationship between classroom quality and teacher education but none between classroom quality and teacher experience among first-grade teachers, and Pianta et al. (2007) observed more experienced fifth-grade teachers working in classrooms with lower emotional climates. Notably, in the Pianta et al. report, only 4% to 6% of the variance in instructional quality was explained by teacher variables. One reason for these low estimates may be the fact that few studies tightly align the resources measured with teaching outcomes; such alignment (e.g., math content courses’ association with the clarity of classroom practice), as we do in the following, may result in stronger relationships and more variance explained.
Teachers’ Knowledge, Habits, and Dispositions
In this second category, teachers’ knowledge and dispositions are compared to instructional quality. Perhaps the largest body of literature in this arena explores the relationship between teachers’ subject matter knowledge for teaching and teaching itself. Conceptualized alternatively as pedagogical content knowledge (Wilson, Shulman, & Richert, 1987), content knowledge for teaching (Ball, Thames, & Phelps, 2008), and other bundles of knowledge and skill (see Depaepe, Verschaffel, & Kelchtermans, 2013), several projects have examined its contribution to classroom quality. In elementary (Hill et al., 2008) and middle school (Hill, Umland, Litke, & Kapitula, 2012) samples, mathematical knowledge for teaching appeared a strong correlate of the mathematical quality of instruction, including the presence of disciplinary features (e.g., mathematical explanations) and the lack of teacher errors. In a study of elementary school teachers, Charalambous (2010) found evidence of a positive association between teachers’ mathematical knowledge for teaching and the level of cognitive demand of the tasks they provided to students. Kunter and colleagues (2013) found that teachers’ pedagogical content knowledge predicted the level of student cognitive demand in their lessons. In the largest study to date to examine this relationship, the Measures of Effective Teaching (MET) project identified a positive relationship between content knowledge for teaching and the quality of teachers’ mathematics instruction (MET, 2013). However, in a study of teachers’ implementation of 2- to 3-week curriculum units from the SimCalc project, Schechtman, Roschelle, Haertel, and Knudsen (2010) did not find evidence that teachers’ mathematical knowledge for teaching was a statistically significant predictor of simpler or more complex teaching goals. Although the authors noted that their study was limited by its reliance on teacher self-report measures rather than observational measures of teacher practice, they also suggested that the effects of mathematical knowledge for teaching may be complex and mediated by other instructional factors, such as the provision of carefully organized curriculum materials (Schechtman et al., 2010). These findings generally suggest that content knowledge for teaching is related to the quality of teachers’ instruction, although the mechanisms by which content knowledge for teaching is translated into instructional outcomes are likely complex and in need of further study.
Teachers’ motivational-affective characteristics are an additional hypothesized predictor of the variability in teachers’ instructional outcomes. Prior research identified relationships between teacher characteristics such as goal orientation (e.g., Retelsdorf, Butler, Streblow, & Schiefele, 2010), enthusiasm, and self-regulatory behaviors (e.g., Kunter et al., 2013) and instructional outcomes, including the provision of challenging classroom tasks, learning support, and classroom management. Holzberger, Philipp, and Kunter (2014) found that teachers’ self-efficacy, defined as teachers’ estimate of their own ability in four areas of job performance, was positively correlated with self-reported instructional features (e.g., cognitive demand of student tasks) as well as student reports of these features. Pianta et al. (2007) similarly reported a positive relationship between teacher efficacy and classroom emotional climate. A longitudinal analysis showed that teacher efficacy was both a cause of and flowed from classroom performance (Holzberger et al., 2013). How such efficacy relates to teachers’ knowledge, which is theoretically related yet often unmeasured in these analyses, is an issue we address in the following.
Institutional Resources
In this third category, resources supplied or created by schools or districts are compared to instructional quality. For instance, curriculum may be considered an institutional resource in that it is typically chosen and provided by the district or school and can instantiate broad-scale policy expectations into material resources, such as textbooks and guides, that students and teachers utilize in the classroom. In a review of the literature, Stein et al. (2007) found that although curriculum can influence student learning, teachers’ interpretations and enactment of curriculum materials mediate the links between curriculum and instructional outcomes, and these interpretations often vary considerably. Similarly, in a series of case studies, Hill and Charalambous (2012) investigated the potential impact of standards-aligned curriculum materials on instructional outcomes, finding that materials could enable but not ensure high-quality, standards-based teaching.
Teachers’ colleagues and grade-level peers may serve as an additional institutional resource to support their instruction. In a study of teachers implementing a new curriculum in one California elementary school, Coburn (2001) found that collaboration with colleagues could facilitate teachers’ sense-making about instructional materials, encouraging them to revise and improve their practice. However, when teachers’ beliefs and practices were opposed to one another’s, peer collaboration reinforced the “status quo” of less effective teaching practices. In a study of instructional policy implementation among elementary and middle school teachers, Spillane (1999) found that teachers were more likely to change the core of their instructional practice when their “zones of enactment” allowed opportunities to discuss and practice new ideas about teaching with their peers. Using a larger but cross-sectional data set, Louis and Marks (1998) found that teachers who worked in schools where they and their peers self-reported a stronger professional community led lessons rated by external observers as having more social support and authentic pedagogy.
Schools and districts (and their associated funding streams) also govern class size, often conceived as another potential resource for teaching. Prior research demonstrates that larger class size is associated with slight reductions in fifth-grade classroom climate in large-scale data sets (Pianta et al., 2007) and no relationship to classroom quality in first grade (Stuhlman & Pianta, 2009). A smaller-scale study examining large (>31) and smaller (<25) classrooms (Blatchford et al., 2005) found more individualized teacher-student task-related contacts in smaller classes as well as more interactions between each student and their teacher. However, in one study, contextual factors and teacher ability appeared to play a key role in mediating class size and instruction; not all teachers took advantage of smaller class size to enact improved instruction (Graue et al., 2009).
Teachers’ access to professional development and professional growth opportunities, also typically provided by schools and districts, has been conceptualized as an additional institutional resource that supports instruction. Several scholars have posited theoretical models of how professional development may lead to immediate outcomes, including changes in teachers’ pedagogical knowledge, content knowledge, and attitudes and beliefs; intermediate outcomes, including changes in teachers’ practice; and long-term outcomes, including changes in students’ attitudes and achievement (Cohen & Hill, 2000; Desimone, 2009; Scher & O’Reilly, 2009). However, in a review of the literature on professional development for K–12 mathematics and science teachers, Scher and O’Reilly (2009) noted that there is very little rigorous evidence examining the impact of professional development on teacher practices. Further, much of the extant evidence regarding the association between professional development and instruction relies on teacher self-reports of changes to their practice, which may be unreliable. One exception is a large randomized trial of a middle school professional development program in mathematics that measured instructional quality through classroom observations (Garet et al., 2010). Findings indicate that this program increased the frequency of teaching behaviors aimed at eliciting student thinking. However, the program did not increase teachers’ use of mathematical representations or their focus on mathematical reasoning; neither did the program increase teachers’ knowledge or students’ test scores.
Finally, students themselves may serve as a resource for teaching (Cohen et al., 2003). Students who come to instruction with stronger prior knowledge, greater self-regulation and behavioral control, mastery-oriented mindsets, and having experienced instruction aligned to that in their current classroom may allow teachers to more easily provide higher-quality instruction. Prior research in this area suggests mixed conclusions about the extent to which students’ background characteristics relate to teachers’ observed instructional quality.
In a study of four urban districts, Whitehurst, Chingos, and Lindquist (2014) found that teachers who taught students with higher levels of prior achievement received higher classroom observation scores on average. However, Polikoff (2015) found that student demographic characteristics, including race, gender, English language learner and disability status, and prior achievement, generally did not predict year-to-year changes in teachers’ instructional quality.
Directions for Current Research
Based on the previous review, we argue that we need more evidence regarding how observed instructional quality relates to the resources identified as potentially important to teacher performance by the education production function literature (Wayne & Youngs, 2003) and Cohen and colleagues (2003). To start, variables that represent teachers’ educational and work experiences, such as degree type, subject-matter course-taking patterns, and teachers’ possession of higher degrees, have seldom been compared with observation-based measures of instructional quality. This is true despite policies that encourage subject-matter course-taking and that financially reward master’s degrees. For instance, math methods courses are required by many traditional teacher education institutions, with the goal that novice teachers would learn up-to-date pedagogical techniques aligned with the Common Core and similar reform documents (e.g., National Council for Teachers of Mathematics [NCTM], 1989, 1991, 2000). Math content courses are designed to ensure that teachers have strong content knowledge around the subject matter they teach. Teacher certification route, another contested policy choice, has been examined with regard to student test scores but not to instructional quality; yet proponents of traditional certification programs often argue that teachers learn important teaching skills and dispositions within traditional teacher certification programs (Darling-Hammond, 2012). The fact that most research on these topics relies on either teacher self-report or very small observational samples prevents the field from assessing whether claims made by proponents of different teacher educational experiences bear weight empirically.
There also are gaps in the research literature regarding how teacher personal characteristics relate to instructional quality. Although subject matter knowledge and instructional quality have been compared frequently, they often are done in isolation, without consideration of additional teacher characteristics (Charalambous, 2010; Hill et al., 2008) or more than a few characteristics (Kunter et al., 2013). There also are few studies of how resources teachers can create for themselves relate to instructional quality; for example, teachers may work to improve their knowledge of students’ thinking via grading student homework or use of formative assessments in classrooms, both of which may lead to improvements in classroom environments. Teachers’ knowledge of their students’ prior performance may similarly improve instruction by allowing a closer match between the difficulty of material and student ability.
Finally, the things district money can buy—for instance, curriculum materials or professional development opportunities—often are examined for their contribution to student test scores and, occasionally, to instructional quality itself (e.g., Garet et al., 2010). However, other key components have been excluded from this line of inquiry. School characteristics, such as collaborative peers and a respectful working environment, may affect instructional quality by providing grade-based instructional supports and freeing teachers from distractions. Districts may provide resources above and beyond curriculum materials and professional development, including instructional policies, high-quality leadership, and higher-quality peer collaborators. Some of these institutional resources may be negative: For example, recent changes toward greater school and teacher accountability (Valli, Croninger, & Buese, 2012) have led many to consider test preparation activity as a negative resource that could detract from the overall quality of instruction (Diamond, 2007).
To explore these issues, this article returns to Cohen and colleagues’ (2003) original charge. Making use of several dimensions of instruction shown to predict student test scores, we ask which background characteristics; teacher knowledge, habits, and resources; and institutional features predict teachers’ performance on those dimensions of instruction.
Methods
Sample
This study draws on data from a large-scale project titled the National Center for Teacher Effectiveness. Our sample consists of fourth- and fifth-grade teachers from four school districts (henceforth Districts 1 through 4) in the 2010–2011 through 2012–2013 school years. Districts were chosen by convenience; all were working to actively improve their mathematics instruction in line with standards published by the National Council of Teachers of Mathematics (2000), and several reported they elected to join the study to learn more about instruction in their classrooms. Within districts, schools were selected into the study based on district referrals and size; the study required a minimum of two teachers at each of the sampled grades. Of eligible teachers within these schools, 306 (roughly 55%) agreed to participate (40% in District 1, 76% in District 2, 59% in District 3, and 62% in District 4). Although a non-random sample is a limitation of this study, analysis of these same data in other work indicate that teachers who selected into the study are not different from the rest of the teachers in the district with regard to state value-added scores (Blazar, 2015). In an appendix, we also show that characteristics of teachers’ students are similar between our sample and the broader district populations (see Appendix Table 1A). Therefore, results likely generalize to the larger population within each district.
We create two restrictions on this original sample. First, we limit our analytic sample to teachers for whom we have data on all three data sources discussed in the following, resulting in 272 teachers total. In all cases, excluded teachers are missing data on some or all independent variables and not on observed measures of instructional quality. In an appendix, we compare observation scores between these two groups; we do observe that teachers included in our sample make more errors than excluded teachers (p = .024). However, teachers do not differ on any of the other four dimensions of instruction captured in our observation instruments (see Appendix Table 2A). Second, for analyses that examine the relationship between classroom composition and instructional quality, we further limit the sample to 177 teachers who were part of the study for two years. This allows us to examine how changes in classroom characteristics relate to changes in instructional quality.
Additional qualitative analyses from this same project allow us to describe important district contextual elements that may relate to observed levels of instructional quality. In particular, we focus on district-wide materials (i.e., curriculum and state tests) as well as development and evaluation efforts aimed at improving the quality of teaching. Districts 1 and 2 come from the same state and utilize the same set of curriculum materials, Investigations, that was designed to support the mathematics reforms of the 1990s–2000s. Using an adapted version of the Surveys of Enacted Curriculum framework (Porter, 2002) to code state test items, Lynch, Chin, and Blazar (2015) found that the state assessment administered in both districts contained moderately cognitively challenging items and a higher level of academic difficulty than the other two state tests in the study. Interviews with district math coordinators suggest that District 1 had a decade-long and intensive effort to provide principals, teachers, and teacher leaders with professional development and coaching around ambitious instruction. Although District 2 used similar professional development resources, the effort was not as intense and, by the time of the study, had dissipated in the face of competing priorities.
During the years of the study, District 3 focused on the implementation of a high-stakes evaluation program for teachers. Though the district employed a mathematics coordinator and many teachers reported using a reform-oriented curricular resource, Everyday Mathematics, the district mathematics coordinators reported that there was no systematic or large-scale attempt to improve mathematics instruction. Finally, District 4 was in a state with a more basic skills–oriented student assessment, used Harcourt Brace, which is considered to be a more conventional set of mathematics curriculum materials, and had more modest amounts of standards-aligned teacher professional development as compared to District 1. Although district mathematics coordinators reported strong affinity for the NCTM and, toward the later portion of the study, the Common Core State Standards (National Governors Association Center for Best Practices, 2010), they reported that this effort reached only a fraction of volunteer teachers in their district.
Though it is possible that differences in teacher labor pools and credentialing requirements and pathways into teaching existed among the four districts, our study did not collect information on these issues directly.
Data
Data for this study come from three main sources: video-recorded lessons of instruction, teacher surveys, and student demographic and test score data. These three sources capture a wide range of information on teachers, including background characteristics; teacher knowledge, habits, and dispositions; and institutional resources. Although we believe the extent of this information is more than has been captured in any other single study on elementary mathematics teachers, we were not able to measure every possible construct; because we measured many independent variables via space-constrained surveys, we also could not measure subtle variation within particular constructs, for instance, different approaches to formative assessment practice or the quality of teachers’ mathematics methods and content coursework. Instead, our data collection focused on identifying and tapping constructs that both prior research and theory suggest are related to instructional quality or student test scores and that could be measured reasonably well through observations, surveys, or administrative data. We describe our sources of data and individual constructs in turn.
Mathematics Lessons
As described by Blazar (2015), mathematics lessons were captured over a three-year period, with a maximum of three lessons per teacher per year. Capture occurred with a three-camera, unmanned unit; site coordinators turned the camera on prior to the lesson and off at its conclusion. Most lessons lasted between 45 and 60 minutes. Teachers were allowed to choose the dates for capture within a given time window and were directed to select typical lessons and exclude days on which students were taking a test. Lessons were spaced throughout the school year with an average of 58 calendar days between lessons to maximize variability in the content captured. Although it is possible that these lessons are unique from a teacher’s general instruction, teachers did not have any incentive to select lessons strategically as no rewards or sanctions were involved with data collection. In addition, analyses from the MET project indicate that teachers are ranked almost identically when they choose lessons themselves compared to when lessons are chosen for them (Ho & Kane, 2013).
Trained raters scored these lessons on two established observational instruments: the Mathematical Quality of Instruction, focused on mathematics-specific practices, and the Classroom Assessment Scoring System, focused on general teaching practices. Both instruments are thought to reasonably capture the quality of teachers’ instruction, and dimensions from each have been shown to relate to student test scores (Bell et al., 2012; Blazar, 2015; Hill, Charalambous, & Kraft, 2012; Hill, Kapitula, & Umland, 2011) and non-tested academic outcomes including their self-reported behavior in class, self-efficacy in math, and happiness in class (Blazar & Kraft, 2015). The link between these observational scores and student outcomes thus satisfies Cohen and colleagues’ (2003) first recommendation, identifying key dimensions of instruction that predict student learning. We present instrument-specific information in the following paragraphs.
The MQI instrument is designed to provide information about the quality of classroom mathematics instruction. Two trained raters watched each lesson and scored teachers’ instruction on 17 items for each 7.5-minute segment on a scale from low (1) to high (3). Analyses of data from this and other projects show that items cluster into three main factors 1 : Classroom Work Is Connected to Math, which records time spent on mathematical as opposed to non-mathematical classroom activities 2 ; Ambitious Instruction, corresponds to many elements contained within the mathematics reforms of the 1990s (NCTM, 1989, 1991, 2000) and the new Common Core State Standards for Mathematics (National Governors Association Center for Best Practices, 2010) by focusing on the complexity of the tasks that teachers provide to their students and their interactions around the content; and Teacher Errors, which captures any mathematical errors the teacher introduces into the lesson. For the first and second dimensions, higher scores indicate better instruction; for Errors, higher scores indicate that teachers make more errors in their instruction and therefore worse performance. We estimate reliability for these metrics by calculating the intraclass correlations (ICC), or the amount of variance in teacher scores on the measures that is attributable to the teacher, adjusted for the modal number of lessons and compared to the total variability in scores. This thus reports the teacher-level variance of the teacher’s measure score in our sample, rather than the teacher-level variance for the average single lesson, and can be used to calculate reliability for the observational sample. These estimates are .36 for Classroom Work Is Connected to Math, .74 for Ambitious Instruction, and .56 for Teacher Errors. We also calculate interrater agreement at .94, .74, and .86 for these three scales, respectively.
The CLASS instrument captures teaching interactions focused on students’ cognitive and social development. By design, the instrument is split into three dimensions. To reduce the number of coefficients tested for significance, we focus on the two that have the least overlap with the dimensions of the MQI. Classroom Emotional Support focuses on conditions that help foster students’ emotional development, such as warm and supportive relationships, respectful interactions, and teacher sensitivity toward student perspectives; Classroom Organization captures the presence of self-regulatory mechanisms in the classroom, including behavior management and productivity of the lesson, that lay a foundation for academic learning (Hamre & Pianta, 2010). One trained rater watched and scored each lesson on 11 items for each 15-minute segment on a scale from low (1) to high (7). For all dimensions, higher scores indicate better performance. Using the same method as discussed previously, we estimate intraclass correlations of .47 for Classroom Emotional Support and .63 for Classroom Organization. Unlike as discussed previously, we cannot calculate interrater agreement for the CLASS given that only one rater scored each lesson. However, Cronbach alphas for these scales are acceptable at .91 and .73, respectively.
For both the MQI and CLASS, ICC-estimated reliabilities are lower than conventionally acceptable levels (.70). That said, they are consistent with or greater than those generated from similar studies (Bell et al., 2012; Kane & Staiger, 2012). They also approximate the reliabilities found in at least some studies that use survey measures to gauge instructional quality (e.g., Guarino et al., 2006; Smith et al., 2005). In our conclusion, we discuss findings in light of the measurement error implied by these reliabilities.
Because lessons are a sample of the instruction produced by teachers and because teachers vary in the number of lessons they provided to the project, we utilize empirical Bayes estimation to shrink scores back toward the mean based on their precision (see Raudenbush & Bryk, 2002). To do so, first we calculate lesson-level scores for each dimension by averaging across segments, items, and for the MQI, raters. Second, we specify a hierarchical linear model that decomposes the variation in dimension scores for each lesson and teacher into a teacher-level random effect and a residual. We utilize standardized estimates of the teacher-level random effect as the final score. Most distributions of these variables are roughly normal (see Appendix 3). However, even where this is not the case (e.g., Classroom Work Is Connected to Math), post hoc analyses available on request indicate residual normality, thereby meeting the assumptions of regression analysis. 3
Teacher Survey
Information on teachers’ background, knowledge, habits, and dispositions, as well as some institutional resources, was captured on teacher questionnaires administered in the fall of each year. Given that very few teachers joined the study in the third year, the survey administered in fall of the 2012–2013 school year was an adapted version that did not include all items from the prior two years. Therefore, we generate most teacher constructs only using the first two years of available survey data. The exception was teacher content knowledge (described in the following), where the third-year survey carried a large set of items by design. When teachers participated in data collection in both years one and two, survey scores are averaged across years. Background information gleaned from the survey includes dummy variables representing novice teachers (up to two years of experience), teachers who earned a bachelor’s degree in education, teachers who earned a master’s degree (in any subject), teachers who were certified in elementary mathematics, and teachers with traditional certification, compared to alternative (e.g., Teach for America) or no certification. Two variables, the number of mathematics methods courses and number of content courses, were measured separately but combined for this analysis because of their correlation (r = .69). Both were measured on a Likert-type scale (1 = no classes, 2 = one or two classes, 3 = three to five classes, 4 = six or more classes).
The next set of variables identifies teachers’ knowledge, habits, and dispositions. First are scores from a test of teachers’ mathematical content knowledge, with 39 items from the Mathematical Knowledge for Teaching (MKT) assessment (Hill, Schilling, & Ball, 2004) and 33 released items from the Massachusetts Test for Educator Licensure (MTEL). 4 To reduce survey burden, these items were spread equally across three survey-years at the outset of the study. Though MKT and MTEL items were originally theorized to represent underlying separate constructs, a factor analysis revealed that these items could not be separated empirically (Charalambous, Hill, McGinn, & Chin, 2014). Teacher scores were generated by IRTPro software and are standardized in these models, with a reliability of .92. Second are scores representing teachers’ accuracy in predicting student performance. These scores were generated by providing teachers with student test items, asking teachers to predict the percentage of students who would answer each item correctly, then calculating the distance between each teacher’s estimate and the actual percentage of students in their class who got each item correct (for more details, see Hill & Chin, 2015). To arrive at a final scale, we averaged across items and standardized.
The next three constructs were generated from multiple items on the teacher questionnaire and refer to activities that teachers may engage in to improve both instruction and student test scores. The first is teachers’ non-instructional work hours, which asks about the amount of time each week that teachers devote to out-of-class activities such as grading, preparing lesson materials, reviewing the content of the lesson, talking with parents, and so forth (4 items per year scored on two Likert scales from 1 [no time] to 5 [more than six hours], internal consistency reliability [α] = .78 for both years of survey data combined). This scale was developed by project researchers based on findings from the economics literature on teaching, including Lavy (2004) and Muralidharan and Sundararaman (2011), which shows that the effects of merit pay may operate through teacher effort. The second construct is formative assessment, which asks how often teachers evaluate student work and provide feedback (5 items per year scored on two Likert scales from 1 [never] to 5 [daily or almost daily], internal consistency reliability [α] = .62 for both years of survey data combined). These items were developed by project researchers based on findings summarized in Black and Wiliam (1998). The third construct is teacher efficacy, which asks teachers to report on their ability to affect classroom behavior and student motivation and their ability to craft good instruction (3 items per year scored from 1 [disagree] to 7 [agree], α = .86 for both years of survey data combined). 5 These items were adapted from work by Tschannen-Moran, Hoy, and Hoy (1998). Although the estimated reliabilities for non-instructional work hours and teacher efficacy are strong, the reliability for formative assessment is less strong, leading to more tentative conclusions regarding these variables in the discussion in the following. Scores from all composites are generated by averaging across items and, where relevant, years, then standardizing.
The final set of measured variables relates to teachers’ institutional resources. Because the main study this article derives from focuses primarily on the teacher-specific resources described previously, we only gauged directly a subset of relevant variables. These include a composite measure of school environment, which captures teachers’ reports of school-provided materials and professional growth opportunities to support teaching, as well as other school-level characteristics such as school-level respect for teachers and teaching and access to extra help for students in need (9 items per year scored from 1 [disagree] to 5 [agree], α = .79 for both years of survey data combined). This scale was developed by the project but based on research on school working conditions (Hirsch, Emerick, Church, & Fuller, 2007; Tomberlin, 2014). Because this is a school-level predictor, we average scores to this level for analysis. As noted previously, we measured a negative resource, the extent to which teachers engage in test preparation activities (5 items per year scored from 1 [never or rarely] to 4 [daily], α = .77 for both years of survey data combined). Relatedly, we asked whether testing has changed instruction (7 items per year scored from 1 [not at all] to 5 [very much], α = .87 for both years of survey data combined). Items for both constructs were written by project members. 6 As described previously, these reliabilities are similar to or higher than other teacher-level constructs generated from self-report data.
Finally, we also attempt to capture additional school- and district-level resources indirectly through our analytic strategy. Specifically, the use of school random effects allows us to estimate the extent to which teaching quality clusters within schools, perhaps driven by school-level factors such as better or worse principal leadership, peer collaboration, or school-specific instructional initiatives. Use of district fixed effects enables us to examine differences in resources between districts that are left over after controlling for all of the variables listed previously. We hypothesize that district-average differences in instructional quality might relate to unmeasured factors such as local teacher labor pools, training program quality, funding, professional development quality, and teacher salaries. Because curriculum materials largely are supplied by districts, district differences may also reflect the quality of the curricula used in classrooms.
Student Information
Student information, which we use to examine how classroom composition relates to instructional quality, comes from district administrative records. Demographic data include gender, race/ethnicity, special education status, limited English proficiency status, and free- or reduced-price lunch eligibility, all aggregated to the classroom level. We also have state test scores in reading and mathematics, which are standardized across the full district in a given grade and year and aggregated similarly. Access to class rosters also allows us to calculate class size.
Analyses
In order to explore the relationship between the characteristics outlined previously and teaching quality, we conduct five sets of analyses. We begin with basic univariate and bivariate descriptive statistics. Next, we fit a series of regression models in which we predict each of our outcomes of interest using measures of teacher background—namely, teacher educational preparation and experience. Doing so allows us to identify any associations between these background characteristics and observed teaching quality before adding in potential mediators, such as teacher efficacy or mathematical knowledge. We cluster our standard errors at the school level to account for the nested structure of the data. Third, we fit another set of regression models that include all teacher- and school-level characteristics. From these regression models, we are interested in the coefficients on each individual teacher characteristic as well as how specific sets of characteristics predict teaching quality as a group. To assess the latter, we conduct a series of post hoc Wald tests. We also compare the amount of variation in our outcomes that is explained by each set of predictors as well as the full set of predictors. Fourth, we explore the extent to which schools may serve as a resource for teachers’ instructional quality by examining the amount of variation that exists across versus within schools. We describe our fifth analysis in the following.
One concern in estimating the relationship between our independent and dependent variables is the presence of omitted variables that may bias our results. That is, background characteristics as well as personal and institutional resources were not randomly assigned to teachers. Teachers select into specific education certification programs and decide how much they will prepare for teaching. Further, multiple factors—such as proximity to home, district wealth, and student composition—also influence their choice of where to teach (Boyd, Lankford, Loeb, & Wyckoff, 2005; Guarino, Santibañez, & Daley, 2006; Hanushek, Kain, & Rivkin, 2004). We attempt to account for these potential sources of bias in two ways. First, in our main regression analyses, we include all predictors in the same model, thereby accounting for many of the factors that may be related both to the set of predictors and to our outcomes. Second, in all of our analyses we control for compositional characteristics of teachers’ classrooms, including class size, gender and racial makeup, percentage of students eligible for free- or reduced-price lunch, percentage of students designated as needing special education services, percentage of students with limited English proficiency, and average achievement on state math and reading tests. 7 These characteristics likely account for many (albeit not all) sources of sorting of high-quality teachers to different types of schools and teaching environments (Clotfelter, Ladd, & Vigdor, 2006).
A second concern is the number of predictor variables relative to the sample size. As noted previously, we include all 14 teacher characteristics, 3 district dummy variables, and 11 classroom demographic characteristics in the same model in order to limit potential sources of bias. However, with 272 total teachers, we may be underpowered to detect effects for each of the 28 total regressors. Therefore, we take two approaches to address this concern. First, we categorize variables into groups of regressors and test each of these jointly. These categories align with our aforementioned descriptions—background characteristics, personal resources, and institutional resources. Second, in our most comprehensive model, we designate some variables as key predictors (i.e., the 14 teacher characteristics and 3 district dummies) and others as controls that are not interpreted substantively (i.e., the 11 classroom demographic characteristics). We leave interpretation of these classroom demographic characteristics for a second analytic approach, which we describe in the following. In light of limited statistical power, we set a slightly higher threshold for statistical significance at the .10 rather than .05 level. We refer to estimates with p values between .10 and .05 as marginally significant.
Importantly, as we argue previously, the relationships between these characteristics and observation scores also may reflect the fact that students themselves can be a resource for teaching (Cohen et al., 2003). However, in the aforementioned analyses, it is impossible to separate sorting mechanisms from the resources that students themselves bring to the classroom. Therefore, our fifth and final set of analyses focuses on the relationship between classroom composition and instruction. In order to account for the potential sorting of students to teachers, we explore changes in classroom composition that might predict changes in instruction. To do so, we regress each outcome of interest on the set of classroom characteristics and teacher fixed effects, essentially limiting variation in each of our predictors to that observed within teachers and across school years. As noted previously, this analysis is confined to those 177 teachers who have at least two years of observation and student data. Here, we recalculate observation scores for each individual school year rather than pooling across years. Final scores are standardized across school years. Given limited variation in both classroom characteristics and instructional quality across years, we interpret results cautiously.
In light of residual challenges in estimating precise and internally valid estimates with our sample size and non-experimental data, we consider these approaches as providing suggestive rather than conclusive evidence on the relationship between our set of predictors and instructional quality.
Results
Univariate descriptive statistics (Table 1) shed light into the conventional resources, such as educational background and experience, available to teachers in the sample. Although most teacher characteristics are standardized within the sample, here, we present means for all variables on their original scales for ease of interpretation. Eleven percent of the full sample were novice teachers, reporting two or fewer years of experience teaching mathematics during the first year they were part of data collection. The modal number of mathematics methods and content courses reported taken by sample teachers was one or two; a sizeable fraction of teachers who took more than three courses, however, brought the means for these variables up. Over 50% of the sample reported a bachelor’s degree in education, and 15% reported that they were certified in elementary mathematics. Eighty-six percent of the sample reported traditional certification before assuming their first teaching position. Teachers reported relatively high levels of non-instructional work hours, formative assessment in math class, and positive school environment (means of above 3 on 5-point scales); strong teacher efficacy (a mean of roughly 6 on a 7-point scale); and modest amounts of test preparation activities (a mean of 2.4 on a 4-point scale, with 2 anchored as once or twice a week for each activity).
Univariate Descriptive Statistics

In some instances, we observe differences in these resources across districts. Relative to teachers in other districts, a higher percentage of teachers in District 1 have master’s degrees (89%, compared to 70% to 79% in other districts), and a smaller fraction have bachelor’s degrees (38%, compared to 45% to 68% in other districts). District 3 teachers are also more likely to be novice teachers (28%, compared to 5% to 13% in other districts). Teachers’ mathematical knowledge was roughly comparable across districts except for District 3, which scored well below the other districts in this regard. Fourteen mathematical knowledge items were replicated from a survey used with a nationally representative sample in 2008; across these common items, the average percentage correct for the current sample was 8% higher than the nationally representative sample, suggesting that these teachers were above the national average.
In Table 2, we describe the correlations between our dependent and independent variables. Several of the dependent variables were moderately correlated, mostly within instrument. For example, the three MQI dimensions show modest correlations between .06 for Classroom Work Is Connected to Math and Teacher Errors and –.26 for Teacher Errors and Ambitious Instruction; we note that the negative correlation between these latter variables is correctly signed, as higher scores on the former indicate better instruction but on the latter indicate poorer instruction. The two CLASS dimensions are correlated at .40. Interestingly, there also were three cross-instrument correlations between .20 and .26, suggesting that lessons tended to be viewed similarly across the raters using each tool. 8
Pairwise Correlations Between Dimensions of Instructional Quality and Teacher Characteristics

Note: Sample includes 272 teachers. CWCM = Classroom Work Is Connected to Math; AMI = Ambitious Mathematics Instruction; TE = Teacher Errors; CES = classroom emotional support; CO = classroom organization.
p < .10. *p < .05. **p < .01. ***p < .001.
Tables 3 and 4 show results from regressions of the five indicators of classroom quality on the teacher attributes suggested by resource theory and literature review. Table 3 shows the relationship of background characteristics to these teaching outcomes, and Table 4 shows models that include all variables described previously. Though estimates are not shown in these tables, all models also control for classroom composition, including class size, gender and racial makeup, percentage of students eligible for free- or reduced-price lunch, percentage of students designated as needing special education services, percentage of students with limited English proficiency, and average achievement on state math and reading tests. We present results by type of teacher characteristic, presenting p values for tests for the joint significance of variables. We also interpret coefficients on individual regressors as well as consider dimension-specific patterns. All results are presented as standardized effect sizes, except in the case of dichotomous variables (e.g., bachelor’s degree in education), which we left unstandardized. For convenience and efficiency, we both describe and interpret findings from these models in this section; in our discussion, we consider broader issues stemming from these analyses.
Regressions of Domains of Instructional Quality on Teacher Background Characteristics

Note: Each column represents a separate regression model. All models include controls for student/class characteristics (i.e., class size, gender, race, eligibility for free- or reduced-price lunch, special education status, limited English proficiency status, and prior achievement in math and English Language Arts) averaged to the teacher level. Robust standard errors clustered at the school level in parentheses. Sample for all regressions includes 272 teachers. Adjusted R2 values are calculated from models that exclude student characteristics. CWCM = Classroom Work Is Connected to Math; AMI = Ambitious Mathematics Instruction; TE = Teacher Errors; CES = classroom emotional support; CO = classroom organization.
p < .05. **p < .01.
Regressions of Domains of Instructional Quality on Teacher Characteristics

Note: Each column represents a separate regression model. All models include controls for student/class characteristics (i.e., class size, gender, race, eligibility for free- or reduced-price lunch, special education status, limited English proficiency status, and prior achievement in math and English Language Arts) averaged to the teacher level. Robust standard errors clustered at the school level in parentheses. Sample for all regressions includes 272 teachers. CWCM = Classroom Work Is Connected to Math; AMI = Ambitious Mathematics Instruction; TE = Teacher Errors; CES = classroom emotional support; CO = classroom organization.
p < .10. *p < .05. **p < .01. ***p < .001.
Among background characteristics, only a few variables demonstrated any relationships to teaching outcomes. Controlling for other background characteristics and classroom composition, novice teachers scored a half standard deviation lower on classroom organization; this finding aligns with the conventional wisdom that new teachers are more likely to encounter classroom management issues in the classroom and with prior research in this area (Westerman, 1991). Holding a bachelor’s degree in education is negatively related to Classroom Work Is Connected to Math. The four other variables—number of math methods and content courses, possession of a master’s degree, certified in elementary mathematics, and traditional certification—showed no relationship to any dimension. In addition, Table 3 shows adjusted R2 statistics for all of these characteristics (excluding class compositional characteristics, which also are included in the models) of zero or near zero; the highest value is .05 for classroom organization. This suggests that very little of the variability in teachers’ instructional scores can be explained by what is known about their background.
Table 4 reports the associations between all factors—including personal and institutional resources, as well as background characteristics—and teaching quality scores. Generally, results described in Table 3 are unchanged when we include the additional predictors. In particular, even when levels of statistical significance change, signs and magnitudes do not. The fact that we only see slight changes in these coefficients when controlling for numerous other characteristics suggests that they are unlikely to suffer from large biases due to other omitted variables. Further, issues associated with statistical power may be less of a concern.
The joint tests for teacher personal resources found these variables, as a set, to be related to Classroom Work Is Connected to Math, Ambitious Instruction, and Teacher Errors on the MQI; these variables are not related to classroom organization or classroom emotional support on the CLASS. In particular, teachers’ mathematical content knowledge forms a significant support for the latter two MQI dimensions. Accuracy in predicting student performance positively predicts Classroom Work Is Connected to Math. Non-instructional work hours, formative assessment in math class, and teacher efficacy are not related to any of the components of instructional quality. Formative assessment had relatively low survey reliabilities, which may account for its lack of significance; however, point estimates are in some cases oppositely signed from expectations and in many other cases very close to zero.
The joint tests for institutional resources show that these characteristics are statistically significant predictors for all dimensions of instructional quality. Except for Ambitious Instruction (p < .001), p values are at marginal levels of statistical significance, between .05 and .10. Examining characteristics individually, we find that test preparation activities are statistically significantly related to classroom organization. However, this relationship is positive, suggesting that higher levels of engagement with test preparation activities are related to better classroom organization and productivity. By contrast, we found a marginal negative relationship between teachers’ belief that testing has changed instruction and Ambitious Instruction. This suggests that, as many report anecdotally, standardized testing activities may have crowded out mathematical depth and more cognitively demanding (but also time-consuming) instruction (Kohn, 2000b).
Although our findings in Table 4 indicate that the school environment variable is not related to any component of instructional quality, the decomposition of instructional quality scores suggests that schools overall may provide resources along some instructional dimensions. In Table 5, variance decompositions indicate a wide range of variation at the school level, from 8.3% for Classroom Work Is Connected to Math to 38.9% for Ambitious Instruction. When we control for districts, the percentage of variation among schools on the MQI measures drops steeply, suggesting that district differences explain the school effects found in the unconditional model. The same is not true for CLASS scores, where a larger percentage of the variance is retained at the school level. This suggests that schools may provide common supports for the classroom environment and organization but appear less important in shaping the mathematics-specific instructional dimensions.
Variance in Instructional Quality at the School Level

Note: Estimates are the percentage of variation that lies at the school level, as opposed to the residual. Sample for all models includes 272 teachers. CWCM = Classroom Work Is Connected to Math; AMI = Ambitious Mathematics Instruction; TE = Teacher Errors; CES = classroom emotional support; CO = classroom organization.
p < .10. *p < .05. **p < .01. ***p < .001.
In Table 4, our comparisons show a sizeable difference between districts for each instructional quality scale, even when controlling for all other variables. For instance, for the MQI scales Classroom Work Is Connected to Math and Ambitious Instruction, there exist large differences between the referent district (1) and the three others, with the referent district’s teachers scoring over a standard deviation higher on the latter dimension. Teachers in District 4 appear to make more errors in their instruction but have higher scores on classroom organization than those in the referent district. Post hoc tests also indicate that these teachers make more errors than those in District 2. Conversely, teachers in District 4 score statistically significantly higher than those in District 2 on classroom emotional support and marginally higher on classroom organization.
Across the five instructional quality dimensions, the predictor variables entered together best explain Ambitious Instruction, with an adjusted R2 of .41. Teacher Errors demonstrated the second highest R2, at .20. The relatively large amount of variance explained appears due to the teacher mathematical content knowledge and district fixed effects; without them, the adjusted R2 values for these two dimensions drop to .14 and .06, respectively. The three other dimensions have adjusted R2 values of .10 or less.
Finally, we examine whether changes in classroom composition predict changes in teachers’ instruction. In this analysis, we limit our sample to 177 for whom we have at least two years of observation scores and student information. Prior to presenting results from our regression analyses, we describe average changes in teachers’ classroom characteristics between school years (see Table 6). Although we expect that most of the variation in classroom composition lies across teachers, we also find substantive differences within teachers and across school years. For example, cross-year average change in class size is more than three students; changes in the proportion of students with differing characteristics range from 6 percentage points for percentage Asian to 12 percentage points for percentage male, percentage African American, and percentage free- or reduced-price lunch eligible; and changes in baseline prior achievement for math and reading is .31 and .31 standard deviations, respectively. We argue that this amount of variation is substantive and reasonable to examine in a regression framework.
Average Change in Class Composition Between School Years
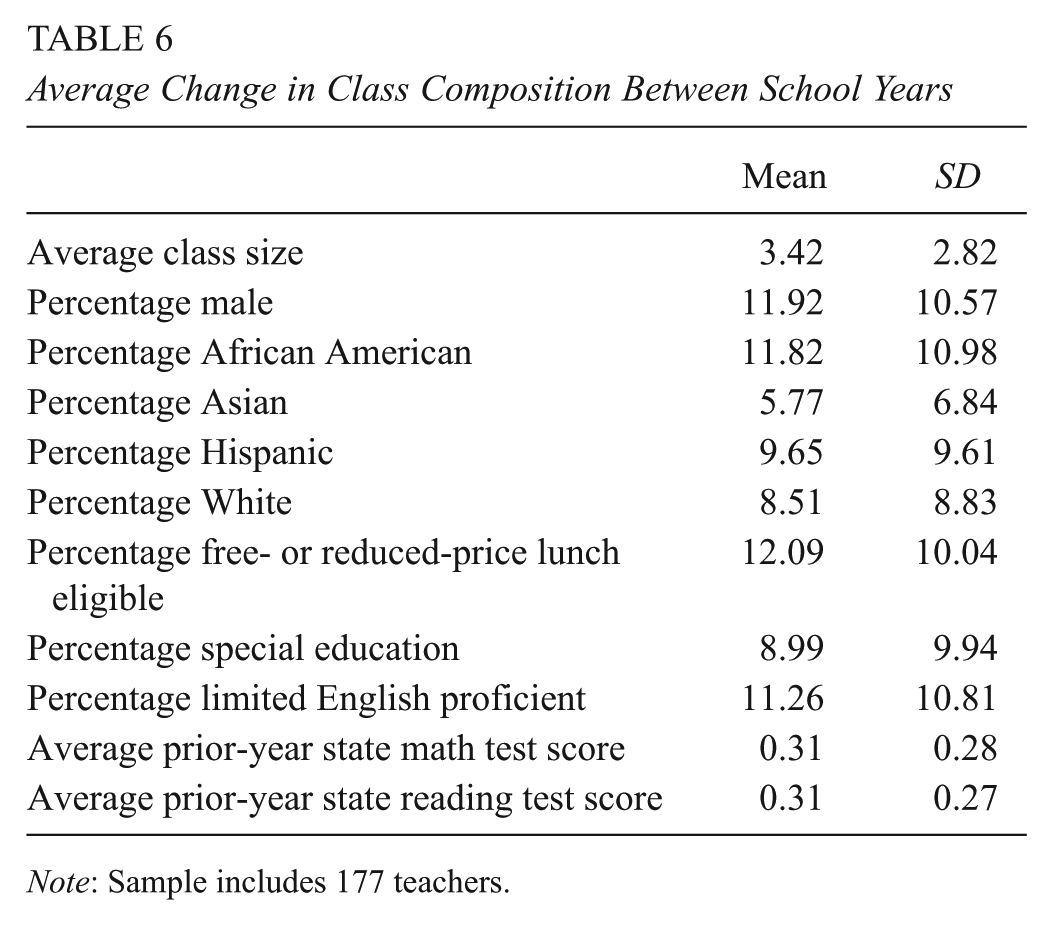
Note: Sample includes 177 teachers.
In Table 7, we present results from these regression analyses. Here, we find only a few instances in which individual classroom characteristics predict within-teacher variation in instruction. An increase of one student is associated with a decrease of –.04 standard deviations in Teacher Errors. Interestingly, this indicates fewer errors and therefore better instruction. Conversely, class size is marginally negatively related to Ambitious Mathematics Instruction; this is consistent with results from the cross-sectional analysis previously presented. In addition, a one percentage point increase in the percentage male is associated with a marginally significant increase of .01 standard deviation difference in Ambitious Instruction but a decrease of the same magnitude in classroom organization. Percentage special education is associated with the same magnitude difference in Ambitious Instruction, negatively signed. Finally, a one standard deviation increase in prior math achievement is associated with a marginally significant increase of .50 standard deviations in Teacher Errors, indicating poorer instruction. When examining all characteristics jointly, we find that changes in observable classroom characteristics only significantly predict Teacher Errors. However, these characteristics explain only 5% of the variation in changes in this dimension of teaching practice.
Relationship Between Year-to-Year Changes in Domains of Instructional Quality and Year-to-Year Changes in Classroom Composition

Note: Each column represents a separate regression model. All models include teacher fixed effects. Robust standard errors in parentheses. Adjusted R2 is change from model that only includes teacher fixed effects. Sample includes 177 teachers and 429 teacher-years. CWCM = Classroom Work Is Connected to Math; AMI = Ambitious Mathematics Instruction; TE = Teacher Errors; CES = classroom emotional support; CO = classroom organization.
p < .10. *p < .05. **p < .01. ***p < .001.
It is possible that these relationships are driven by outlier teachers who have large differences in classroom composition from one year to the next. In Table 6, we observe that the standard deviations for average differences across years are large, suggesting that the distributions have long upper tails. Therefore, we re-run this analysis excluding teachers whose change in classroom composition on any single variable falls at or beyond the 95th percentile. Results (available on request) identify the same patterns.
Discussion and Conclusion
This study is among the first attempts to, on a large scale, explain variability in observed instructional quality using a variety of teacher and institutional characteristics. We believe that this work is an important complement to the range of research linking both teacher characteristics and instructional quality to student outcomes, as our findings can provide guidance on how resources might be allocated to improve teachers’ classroom behaviors; in turn, these behaviors may improve student outcomes.
Although it does not employ a fully comprehensive set of predictor variables, it does include many found by prior research to relate to instructional quality or student test scores—and more than have been examined in any other single observational study. The study also encompasses a relatively small sample size of teachers nested within only four districts, leading to concerns about the size of the sample relative to the number of variables in the models. To address this, we test variables in predetermined groups; we also show that largely null findings for teacher background characteristics are replicated when we examine these variables in separate models. Nonetheless, this limitation suggests a need for conservatism in our interpretation. The tradeoff for the smaller sample size, in addition, was that it allowed for more intensive coding of classroom observation data that in turn led to stronger teacher-level reliabilities than found in a study that recruited a much larger sample but used a less resource-intensive scoring design (Kane & Staiger, 2012). Further, the standard errors of our parameter estimates are typically under 10% of a standard deviation in our dependent variables, suggesting that we would be able to detect effects of roughly .20 standard deviations, a relatively small effect size for instruction. Nevertheless, like other studies, ours is imperfect, and results must be construed as suggestive of the ways in which teacher and environmental characteristics are related to instructional quality rather than definitive tests of specific variables.
These results suggest that despite the low reliabilities described previously, we did find, for a subset of predictors, consistent, substantial, and for the most part sensible associations between those predictors and teacher instructional quality. For the mathematical measures, it seems logical that teachers who know more mathematics and know more about how their students apprehend mathematics appear to make fewer mathematical errors in classrooms and are also able to focus more on mathematical meaning and using students’ ideas and misunderstandings during instruction. This might reflect the alignment between the teacher knowledge and MQI metrics, a perspective also confirmed by the weak or nonexistent relationship between teacher knowledge and classroom interactions focused on students’ general cognitive and emotional development. This suggests, as Cohen and colleagues (2003) observe, that the most important predictors of instructional quality are the most proximal to the dimension of practice under study. Other, as yet unidentified teacher resources may relate to classroom emotional climate and organization; locating these resources is an important goal for future research.
Our results also suggest that districts can powerfully shape instructional quality, particularly along mathematics-specific dimensions, but in the classroom organization domain as well. Our data do not allow us to identify in a formal manner what district-level variables (e.g., curriculum materials, professional development opportunities, teacher labor markets) account for these differences. At the same time, post hoc interviews with district mathematics coordinators suggest that differences may reflect the amount of district resources available to support ambitious instruction as well as the length, alignment, and coherence of district efforts. In District 1, for instance, intensive professional development for both teachers and principals as well as teacher coaching had been available for 10 years prior to the study thanks to a Math-Science Partnership grant from the National Science Foundation directly to the district. Instructional guidance regarding mathematics, including the state assessment, curriculum materials, and teachers’ learning opportunities, was remarkably consistent and supportive of ambitious mathematics instruction; this instructional guidance persisted for over a decade and continues, to some degree, today. Math coordinators did not report these conditions in other districts, particularly Districts 3 and 4, where curriculum materials were not always aligned with ambitious instruction, high-quality professional development reached a small subset of teachers, and state assessments incented attention to students’ basic computational and problem-solving skills. These findings echo significant prior work that suggests districts play a large role in providing opportunities and incentives for teachers to take up reforms (Coburn & Russell, 2008; Spillane & Thompson, 1997; Stein, Kaufman, & Kisa, 2014). At the same time, teacher sorting and hiring outcomes given the local teacher labor markets supplying each district also may play a role, although Table 1 suggests that District 1 teachers’ backgrounds and mathematical knowledge were not consistently different from those in Districts 2 and 4.
Next, our results are notable for what did not predict instructional quality—many of the teacher background characteristics, our measure of school environment, and teachers’ activities designed to improve classroom outcomes, such as work outside of instructional time and formative assessment practices. Certification route, mathematics and math methods coursework, and advanced degrees failed to predict instructional quality along any dimension despite either claims to effectiveness or financial rewards for teachers to achieve those milestones. Even efficacy, a scale that invites teachers to self-report their effectiveness in classrooms, failed to predict instructional quality, although the reliability of this metric was just above conventional standards of acceptability (.71). Efficacy also fails to correlate significantly with teachers’ mathematical knowledge, suggesting that scholars who use this metric frequently may wish to conduct validation work to examine exactly what it measures. More generally, although these null results could have arisen because of constraints in the operationalization of the variables, small sample sizes, or measurement error, particularly in our dependent variable, the presence of the moderately strong predictors described previously suggests that in contrast, teacher background characteristics and some dispositions may carry less predictive power than previously thought. Clearly, however, these characteristics could affect student learning via pathways not captured in our instructional measures (e.g., through certification programs better preparing teachers to encourage parents to promote academic skills), limiting the conclusions we may draw.
That said, these null findings between teacher background and personal resources and instruction also may help explain the small to zero association between teacher background characteristics and student test scores in the educational production function literature (e.g., Hanushek, 1996; Kane, Rockoff, & Staiger, 2008). One exception is teacher experience, where our results may help explain the frequent finding that novice teachers have students with weaker outcomes on state tests. Our models suggest that this effect may obtain from the fact that weaker classroom management skills result in less organized and productive classrooms.
Our findings also suggest a potential explanation for the link between teacher knowledge and student test scores often seen in the educational production function literature (e.g., Hanushek, 1996; Hill et al., 2005). Our analysis indicates that this relationship may be mediated by mathematics-specific instructional quality, including the degree to which teachers offer students accurate and meaning-centered mathematics and also require students to participate in mathematical thinking and reasoning. This is a topic for future investigation with these data.
Changes in class composition between years did not predict changes in teachers’ instructional scores particularly well. This is relatively good news for the observational instruments, as some have worried that the instruction captured on those instruments may be influenced by raters’ perceptions of the students in the classroom or that teachers may adjust their instruction based on the abilities of children in the room (Polikoff, 2015; Whitehurst et al., 2014). However, it is worth noting that variation is limited here; future, larger-scale studies that use random assignment may return different results.
This study holds several implications for districts, particularly around hiring practices, early-career support, and support for efforts to transform instruction toward more ambitious standards, such as those contained in the Common Core (National Governors Association Center for Best Practices, 2010). Based on this evidence as well as that from the educational production function linking teacher knowledge to student test scores, districts may wish to screen applicants for their mathematical knowledge rather than relying on certification or degree type as proxies for quality. Districts also may wish to provide classroom management support for novice teachers, as the effect of being a novice teacher was large (SD = .50) on the classroom organization scale, and this scale has been linked elsewhere to stronger student performance (Bell et al., 2012). The best form of this support—whether it be extra training or a classroom assistant—cannot be determined from these results, but the size of this effect is remarkable. Both of these efforts may also be taken up by schools of education, who may choose to focus training on prospective teachers’ content knowledge and classroom organization skills. Finally, the district effects contained here alongside the contextual information we gleaned from interviews with district mathematics coordinators suggest that instructional quality may be responsive to district improvement efforts. At the same time, Hitch and Herlihy (in press) caution that this may only be true when instructional guidance is consistent across initiatives and across time, which seldom is seen in U.S. schools.
Lastly, we comment on the possibility of identifying additional measurable factors that may contribute to quality of teachers’ instruction, as the unexplained variance across dimensions ranges from roughly 98% (emotional support) to 60% (Ambitious Instruction). One explanation for these estimates might be measurement error in our dependent variables, which would depress the explained variance. However, there may be other, as yet unidentified teacher and school characteristics that explain instructional quality. In addition to testing obvious candidates (temperament, general intelligence), future research may also aim to identify new types of resources that contribute to teachers’ instructional quality. One way to do so may be to identify high-quality instruction along a particular domain and speak directly with these teachers about contributing factors. In addition, the current findings suggest that exploring differences across districts, such as in instructional policies, labor markets, and professional learning opportunities, may be a promising avenue for future research, offering the potential to shed light on promising practices or structural factors at play in districts where instructional quality is high. The current findings suggest that researchers may need to revisit Cohen et al.’s (2003) conceptualization of educational resources, reconsidering and perhaps broadening our view of the range and scope of resources that may contribute to high-quality instruction.
Footnotes
Appendices
Differences Between Teachers With and Without Complete Survey Data

| In sample | Out of sample | p value on difference | |
|---|---|---|---|
| Classroom Work Is Connected to Math | .45 | .05 | .102 |
| Ambitious Instruction | .27 | .03 | .192 |
| Teacher Errors | −.51 | −.06 | .024 |
| Classroom emotional support | −.03 | .00 | .861 |
| Classroom organization | .18 | .02 | .333 |
| p value on joint test | .054 | ||
| Teachers | 272 | 34 |
Acknowledgements
The research reported here was supported in part by the Institute of Education Sciences, U.S. Department of Education (Grant R305C090023) to the President and Fellows of Harvard College to support the National Center for Teacher Effectiveness. Additional support comes from the National Science Foundation (Grant 0918383). The opinions expressed are those of the authors and do not represent views of the Institute or the U.S. Department of Education.
1.
Factor analyses of combined Mathematical Quality of Instruction (MQI) and the Classroom Assessment Scoring System (CLASS) data indicate a four-factor solution when examining the MQI and CLASS items jointly (Blazar, Braslow, Charalambous, & Hill, 2015). This structure is substantially similar to the one we use here, which includes the MQI’s Classroom Work Connected to Math as a separate factor.
2.
The response scale for this item was yes/no, as gradations were difficult to implement.
3.
Some argue for using conditional measures of instructional quality that control for classroom characteristics (Whitehurst, Chingos, & Lindquist, 2014). However, we are interested in the types of instruction that teachers provide in each classroom, irrespective of student populations. In addition, we find that these scores are correlated with the unconditional scores at .92 or above. Further, in results that we show in the following, most classroom characteristics do not appear to predict year-to-year changes in instructional quality. This suggests that use of conditional versus unconditional scores is unlikely to change results.
4.
Teacher knowledge items were taken from all three teacher surveys because the third-year survey contained additional unique knowledge items and because those items improved the reliability of the knowledge metric.
5.
In the first year of the study, these three items were scored from 1 to 5. In order to make scales comparable across years, we created a linear transformation of the 1 to 5 scale to map onto the 1 to 7 scale used in the second year.
6.
Constructs generated by averaging across multiple survey items (i.e., non-instructional work hours, formative assessment, teacher efficacy, school environment, test preparation activities, and testing has changed instruction) were subject to exploratory factor analyses with rotation, with each set of items analyzed separately. In all cases, items load similarly onto a single factor, indicating one factor per set of items.
7.
We also run models that include school fixed effects and find that magnitudes of estimates and almost all patterns of statistical significance remain (results available on request). These are not our preferred models, as inclusion of school fixed effects automatically excludes our school-level predictor, school environment. Further, there are some schools with only two or three teachers included in the study, thereby substantially limiting our comparison group.
8.
For parsimony, we do not include in this table correlations between our independent variables. Results available on request indicate mostly nonsignificant relationships. Many of the variables related to coursework, degrees, and certification are correlated with each other in the range of .20. The strongest relationship is between non-instructional work hours and school environment (r = .33). Math content knowledge and accuracy in predicting student performance are correlated at .25. These relationships generally are weak and suggest little overlap between independent variables.
Authors
HEATHER C. HILL, is a Professor in Education at the Harvard Graduate School of Education. Her primary work focuses on teacher and teaching quality, and the effects of policies aimed at improving both.
DAVID BLAZAR, is a doctoral candidate at the Harvard Graduate School of Education. He studies the economics of education applied primarily to issues related to teacher and teaching quality.
KATHLEEN LYNCH, is a doctoral candidate at the Harvard Graduate School of Education. She studies education policy and strategies to reduce educational inequality, particularly in mathematics.