
Abstract
Teachers are critical to student learning, but adequately staffing classrooms has been challenging in many parts of the country. Though teacher shortages are widely reported, they are poorly understood, particularly in terms of the magnitude and variation of the shortages, and reported figures are often localized and anecdotal. To address this gap, we systematically examine news reports, Department of Education data, and publicly available information on teacher shortages for every U.S. state. We characterize the data landscape and find there are at least 39,700 vacant positions along with at least 288,000 positions being held by underqualified teachers, both of which are conservative estimates of the extent of teacher shortages nationally. We discuss the implications of our findings for improving data systems, including more specific and consistent reporting of shortage, as well as implications for teacher preparation and education policy.
Keywords
As teachers are critical to student learning, adequately staffing classrooms with highly qualified teachers has been at the forefront of concerns in education for decades (Carver-Thomas & Darling-Hammond, 2017; Ingersoll, 2003). However, recent news reports suggest that there are shortages of teachers in many parts of the country (Hall, 2021; Learning Policy Institute, 2019), especially in high-need subject areas and hard-to-staff locations (Carver-Thomas et al., 2021; García & Weiss, 2020). 1 In response to staffing difficulties, states and districts have issued emergency certificates, filled positions with substitute teachers, and left positions open throughout the school year (Aragon, 2016; Castro et al., 2018). Moreover, with the increasing staffing difficulties due to the COVID-19 pandemic, some states have substantially lowered requirements for certified and substitute teacher qualifications, called on retired teachers to return, used administrators for teaching duties, asked parents to assist, and even put the National Guard in the classroom (Jung, 2020; Poff, 2022; Sandoval, 2022; Wiedmann, 2022).
Teacher positions left vacant or filled with uncertified candidates are likely detrimental for students and schools. Schools with consistent teacher shortages are more likely to have lower levels of student achievement and less positive student outcomes (Castro et al., 2018). Additionally, since underprepared teachers are more likely to turn over (Nguyen et al., 2020), these schools are more likely to have to spend more resources to replace their short-term hires (Aragon, 2016; Ronfeldt et al., 2013).
Such detrimental impacts of teacher shortages have prompted substantial research on teacher pipelines, preparation programs, recruitment, and retention (García & Weiss, 2020; Ingersoll et al., 2019; Podolsky et al., 2016; Will, 2022). However, teacher shortages are still poorly understood. We contribute to two main strands of this literature.
First, it remains unclear whether there is a shortfall of teachers nationally or if shortages are localized—a key component of current debates about teacher shortages (Loewenberg, 2016; Sutcher et al., 2019). Some have argued there has been a long-standing national teacher shortage that is worsening over time (García & Weiss, 2020; Sutcher et al., 2016a), while others have posited that there is not a nationwide shortage but rather an imbalanced distribution of candidates across districts, states, and subject areas (Cowan et al., 2016; Goldhaber & Theobald, 2016). These disagreements matter because policy efforts will differ depending on whether they need to address a generalized teacher shortage or to target specific kinds of teachers needed in specific schools. For example, policy efforts to address a generalized teacher shortage may include increasing average starting salary or changing licensure requirements for beginning teachers (Sutcher et al., 2019). Conversely, concerns about more specific teacher shortages might motivate policy efforts to increase the supply of STEM and special education teachers specifically, for instance through differentiated salary increases or large signing or retention bonuses for those teachers (e.g., Kim et al., 2021; Theobald et al., 2023). In other words, whether scholars and policymakers should focus on increasing the overall supply of teachers to meet the rising demand or by addressing location-specific and subject-specific supply problems remains a crucial question. In what follows, we aim to shed light on existing teacher shortages to help adjudicate these disagreements.
Second, we extend a small but important body of literature exploring how the unavailability of educational data may hamper our ability to understand and address educational problems (Asson et al., 2023), including problems in the teacher labor market (e.g., Bleiberg & Kraft, 2023). One of the primary motivations of this recent work is a perceived lack of data, especially at the national level (Aldeman, 2016b). To date, neither the federal government nor most states provides much information on the extent of teacher shortages (Walsh, 2016). Some states keep track of their teaching force, but not all track how many positions are left unfilled and such information, if available, is scant and usually not available longitudinally (Education Commission of the States, 2019; Learning Policy Institute, 2017). The only existing estimate of state-by-state shortages comes from a report from the Learning Policy Institute (Sutcher et al., 2016a), but this report is outdated and includes vacancy data from just eight states. The U.S. Department of Education (2022) does report the subject areas in which states report teacher shortages, but they do not indicate the magnitude of shortages or even define “shortage” consistently. Moreover, responding to teacher shortages has become more urgent as districts seek to expand their staffs and address disrupted learning from the COVID-19 pandemic (Berman, 2021; Bisaha, 2020; Chacko, 2021; Martin, 2021; Stuart, 2021). We provide the most comprehensive evidence to date about how data availability on teacher shortages varies nationwide at the state level.
In sum, even though there are many news reports of teacher shortages, these often focus on specific districts or states, and to date there has not been a concerted and systematic effort to examine what the most credible teacher shortage data looks like nationally. This both hampers research into teacher shortages and complicates potential policy efforts to address them. To address this gap, we have systematically examined news reports, Department of Education websites, and every publicly available source of information on statewide teacher shortage. We then merge these vacancy and underqualification data with the Common Core of Data and the Civil Rights Data Collection to create a unique dataset to provide a comprehensive picture of teacher shortages across the U.S. The following research questions guide our work:
1) To what extent are there teacher vacancies and underqualification 2 in each state?
2) How are teacher vacancies and underqualification distributed geographically across the United States?
In answering these research questions, we make three main contributions. First, though limited by a substantial lack of complete data, our work provides policymakers and researchers with the most complete picture to date of the extent to which states are experiencing teacher shortages. Moreover, our findings establish a plausible estimate on the extent of teacher shortages nationwide. This can inform policy discussions about how to address shortages. Second, our work also illustrates the need for robust, timely data on teacher vacancies and underqualification to provide facts to anchor policy discussions and pointing to important areas for future research. Third, the dataset that we built and are making public (www.teachershortages.com) is the very first of its kind and represents the best available nationwide data on teacher shortages. This dataset represents both a tool for policymakers and other stakeholders and a starting point for researchers seeking to deepen our collective understanding of teacher labor markets. For policymakers in particular, this work allows them to contextualize the extent to which there are teacher shortages nationwide and from state to state as well as how data infrastructure on teacher labor market needs to be improved to address ongoing challenges.
Background
The Alarm of a National Crisis
Though teacher shortages have been a topic of at least some concern for decades, their framing as a nationwide crisis began in earnest with a 2016 Learning Policy Institute (LPI) report (Sutcher et al., 2016a). Since its release, there has been intense attention to the issue of teacher shortages and related problems in the teacher pipeline, including teacher recruitment, retention, and attrition (Dee & Goldhaber, 2017; García & Weiss, 2019a). In these discussions, a teacher shortage is usually said to exist when the number of teaching positions that are available (i.e., the demand side) exceeds the number of teachers available to fill positions (i.e., the supply side). In other words, a teacher shortage occurs when there is an insufficient number of teachers available to fill open positions. For instance, by relying on historical data, projections of educational statistics, and national and local trends that drive supply of and demand for teachers, the LPI team estimated a nationwide shortage of 64,000 teachers as of the 2015–2016 school year, projected an annual shortfall of 112,000 teachers across the country by 2018, and predicted a persistent supply-and-demand gap at that level thereafter (Sutcher et al., 2016a). Following the report, researchers have examined the severity of teacher shortages in multiple ways, such as by documenting declines in teacher training program enrollments across the country (Partelow, 2019), increases in annual shares of schools reporting instructional vacancies, struggling to staff their classrooms despite active recruitment efforts, and leaving their instructional positions open throughout the school year (García & Weiss, 2019b).
Ongoing Academic and Policy Debates
While concerns about teacher shortages are widespread, they are also the subject of two broad and interrelated areas of debate. First, there are ongoing debates about how to characterize teacher shortages. For instance, some critics have argued that LPI’s teacher shortage estimates are at least potentially misleading. This in part reflects concerns that LPI’s estimates are highly sensitive to modeling assumptions (e.g., about student-teacher ratios; Antonucci, 2016; Goldhaber & Theobald, 2016; Walsh, 2016). It also reflects concerns that LPI focuses too much on the overall national teacher supply rather than distinguishing between teacher labor markets that often look very different across types of teachers, locations, and types of school (Aldeman, 2016a; Antonucci, 2016; Cowan et al., 2016; Goldhaber & Theobald, 2016). In sum, while one side of this debate focuses on factors general to the teaching profession that decrease teacher preparation enrollment and willingness to teach after being certified (García & Weiss, 2020; Sutcher et al., 2016b, 2019), the other emphasizes imbalanced distributions of teachers over geographical locations, schools with specific characteristics, perennially difficult-to-staff subject areas, and policy barriers between states and disciplines that impede teacher movement and constrain the labor market (Aragon, 2016; Loewenberg, 2016; Walsh, 2016).
A second and related area of ongoing debate is over what to do about teacher shortages. On the one hand, many stakeholders and policymakers concerned about generalized teacher shortages argue for policies that aim to increase the overall supply of teachers. For instance, federal policymakers have recently advocated policies to promote nationwide minimum teacher salaries (Goldstein, 2023). On the other hand, other policymakers concerned more about more specific teacher shortages have promoted policies tailored for certain types of school or teacher. For instance, a recent statewide grant in Illinois sent new money to address shortages to the small minority of school districts in the state that represented the large majority of unfilled teaching positions (Smylie, 2023).
These two areas of ongoing debate are closely related, because evaluating whether targeted or untargeted policies are likely to be more efficient or more equitable depends on understanding the distribution and magnitude of teacher shortages across the country. However, recent literature highlights that adjudicating these debates is difficult because there is scant evidence on teacher supply problems across the country, and the evidence that exists is often difficult to interpret. For instance, Bleiberg and Kraft (2023) find that a lack of detailed, timely, and nationwide data systems makes it difficult to fully understand how and why the teacher labor market changed over the course of the COVID-19 pandemic. As one example of why this might be, consider that, according to the U.S. Department of Education (2022), 41 states and D.C. are reporting teacher shortages in at least one subject area or grade level. However, there is no information on the magnitude of each state’s shortage, or even how “shortage” is defined, only that some agencies report a shortage of teachers in a given area. Similar considerations and definitional ambiguity complicate our understanding of teacher shortages in the U.S. To address this, we discuss the main definitions of “teacher shortage” and how we operationalize shortages in our study.
Defining Teacher Shortage
As defined by the U.S. Department of Education (2017), a teacher shortage area can be operationalized in two main ways: (1) unfilled positions; and (2) positions filled by teachers who are certified by irregular, provisional, or emergency certification, or by teachers who are certified but teaching in academic subject areas other than their area of preparation. These definitions refer to the status of teaching positions after the start of a school year. For example, a teaching position that is vacant after the school year has begun is an unfilled position.
Our main approach focuses on the first definition of teacher shortage (i.e., unfilled positions) for three reasons. First, we want to take a conservative approach to examine teacher shortages, so unfilled teaching positions give us a baseline estimate of teacher shortages in the U.S. Second, since credential requirements vary across states, the numbers for the second definition (i.e., relying on teacher certifications) are less comparable across states relative to unfilled positions. Third, some states, such as Louisiana and Alaska, can fill vacant positions in various alternative ways, including with less-than-fully certified teachers, teachers teaching out-of-field, or by importing teachers from overseas (Louisiana Department of Education, 2021; State of Alaska Office of the Governor, 2022). The inability to fill teacher positions even with non-standard certification corresponds perhaps the most clearly to the idea of “shortage.” From this definition of teacher shortage, we can then attempt to estimate the number of vacant teaching positions for every state in the United States. Our estimate is a conservative estimate that puts a lower bound on the number of teacher vacancies nationwide for three reasons: (1) states and districts may underreport; (2) districts may not try to open and fill a position due to low supply, or perception of low supply, of teachers with specific expertise (e.g., math, science, special education); and (3) a lack of high-quality teachers may mean that positions are filled with low-quality candidates.
We are agnostic as to what precisely constitutes a “national teacher shortage,” particularly given the ongoing debates discussed above. From our perspective, the “national” teacher shortage is simply the sum of teacher shortages from every state. We also consider the second definition of teacher shortage (i.e., underqualification) in separate analyses as teacher underqualification is also an important issue facing public education. We take care to distinguish between vacant positions and those that are filled by teachers who are underqualified.
Data and Method
The key challenge in measuring teacher shortages at the state and national levels is that there is not a database of teacher vacancies. This lack of nationally representative data contributes to the difficulty in reaching consensus as to whether teacher shortages exist nationwide. We endeavor to address this challenge by attempting to determine the number of vacant teaching positions for every state in the United States and D.C. To do so, we take on two concurrent internet searches: (1) using a common search string to retrieve vacant teaching positions as reported by the news or by the state using Google search; and (2) using information provided by state departments of education (DOEs) or other government agencies (e.g., boards of education, legislative offices) for every state provided that they exist, either on their websites or via correspondence directly with state officials.
In our first approach, we used the following search string: “state name” AND (“teacher vacancies” OR “teaching vacancies” OR “teaching positions to fill” OR “teacher shortage”) with Google Search to seek reported numbers of vacant teaching positions in the state. We conducted this search for every state between January 2021 and February 2022. For example, to search for California data, we used the string “California” AND (“teacher vacancies” OR “teaching vacancies” OR “teaching positions to fill” OR “teacher shortage”). When Google returned search results, we went over as many sites and news reports as possible until we found the state’s vacant teaching positions in the current school year. As this information was not always available, we also collected the state’s vacant teaching positions in previous years. In instances where a total number was not provided, we calculated it from the reported vacancies, such as by summing across school district or sometimes by subject area. We also searched for estimated figures of the state’s annual teacher supply and demand, either aggregated or by subject area, and any information that was relevant to the state’s teaching force. As part of our consideration for the search string, we did use other phrases such as “teacher openings,” but these results did not return specific information on teacher vacancy as teacher openings do not necessarily indicate that these are unfilled positions or underqualification. We iterated on several search strings and phrases to generate the common search string that provided us with information on teacher shortages.
This Google search approach did not generate results for every state. For instance, even if a news report suggested there was teacher shortage in a state, sometimes no specific numbers were provided. We therefore took the second approach: examining the official government education website for every state to find documents and reports that provide estimates of vacant teaching positions. If no such document was found, we contacted one or more of the officials in charge of vacancy and shortage data. If we did not receive a reply, we followed up after a few weeks. For states where news reports were the initial source, such as the case for Alabama or Delaware, we also examined state department websites and other government documents to verify the reported information. If the DOE or government agency documentation was found, we used the official document as the primary source; otherwise, we noted that news reports were their primary source.
With our two-prong approach, we were able to find estimated vacant teaching positions for all but fourteen states. To ensure the estimates are valid, we developed a systematic data verification procedure and conducted it for every state. The development and uses of this procedure are described below, while details for each state along with data sources can be found in Appendix Table 1 and Appendix References. As there has been substantial interest in teacher shortages in the news and among policymakers, we have also endeavored to make this timely work available through a website (https://www.teachershortages.com/). On this website, we provide a brief summary of this work and provide a state-by-state interactive map of the most current raw numbers of reported teacher vacancies as well as a vacancy rate map where we divide the number of reported vacancies by the number of students in the state to provide a more apples-to-apples comparison among states. Despite the limitations of this work, which we detail below, to the best of our knowledge our work presents the most up-to-date and comprehensive data on the extent of teacher shortage for every state and nationally. We will also update our website and maps on a regular basis to provide the most recent data on these issues for interested stakeholders.
Finally, we used the Common Core data to retrieve student and teacher populations and the Civil Rights data to retrieve state-level teacher qualifications. We acknowledge potential discrepancies between federal and state-specific data (i.e., our searched results) and that our state data do not all come from the same year. Nevertheless, being analogous to last-available data imputation, and given the critical need of interpreting shortage data in context, this is the best possible method to provide a comprehensive picture of the nation’s teacher shortages.
Data Verification
We developed a systematic data verification procedure to alleviate limitations in data availability, reliability, and validity. The development of this procedure took place in 2021–2022 and was continuously refined. After obtaining the common search string, we repeatedly and independently conducted the search for each state, and reconciled discrepancies for data needing verification. One of the most important verification components from this process was addressing discrepancies among the ways states and other entities define and measure teacher vacancies. The outcome of this lengthy effort was the first full-search result of state vacancy counts and, more importantly, the data verification procedure. We then set out to conduct an additional full search of state vacancy counts, and we replicated the process once more toward the end of the search. Overall, we conducted four iterations of the complete search process (see Appendix Table 2). Each of these iterations was the result of a complete process from independent searching to data verification, curation, and reporting. The third iteration, which ended in February of 2022, became the dataset during initial journal submission. The fourth iteration, taking place during the revision process of peer review, ended in November 2023 and contributed to the final dataset. We note that we were able to substantially improve the number of states where we can verify vacancy and underqualification data to an official report using administrative data to 20 states from 11 in the previous round. For instance, data for D.C. and Hawaii that came from news reports previously have now been updated and verified against DOE reports. Below, we provided more specific details about the key steps in this data verification process.
The verification procedure consisted of three main components of the searched data: time/scale, source, and content. Specifically, time referred to the point of time when the vacancy data were recorded, commonly a school year and sometimes a month within a school year (e.g., Maryland State Board of Education, 2022), and in a few cases a specific date such as October 1 (e.g., Hayashi, 2022; Illinois State Board of Education, n.d.). Scale referred to the geographical scope/region within which the vacancies were counted, usually state totals, but sometimes a sum of some large districts: New Jersey (Lahoud, 2022; Wall, 2021) and Texas (Lopez, 2021). In the case of New Jersey, we found two different sources reporting district-total vacancy counts: Wall (2021), with 120 vacancies for Newark Public Schools—the largest school district in the state—as of September 2021, and Lahoud (2022), with 28 vacancies for Camden City School District by January 2022. We were cognizant that the data from Newark might have changed by January 2022. However, it was reasonable to assume that, for the 2021–2022 school year, New Jersey had at least 148 reported vacant teacher positions given these two data points.
The second component examined the source of the searched data. We not only inspected the information source where we found the data, but also what the source itself cited as references. In other words, if we found a piece of data from a secondary source, we followed up, using its references, to find the original source of information. For example, we found that the state of Utah reported news about their 2021–2022 teacher workforce (e.g., Reed, 2021a, 2021b; Scott, 2021; Utah Policy Staff, 2021), without any working link to their statements or official reports. As we verified this information, we found the data came from the State of Utah Office of the Legislative Auditor General (2021a, 2021b). As a result, instead of the news outlets—now verified secondary sources—we reported the legislative office as the source for Utah in our final dataset.
The third component of the verification procedure focused on the content of the searched vacancy data, specifically what counted as a “vacancy” within the source and how the numbers were produced. This was the most challenging and laborious part of the verification. For every piece of information found, we thoroughly examined the reported information. Since we aimed to find the number of teacher positions that districts and schools were not able to fill after the start of the school year, we did not include positions filled with less-than-fully certified teachers as “vacant positions,” and excluded non-teaching positions such as school counselors or support staff. We used data reports from every state and calculated and verified the sums of vacant teacher positions. For example, the Florida Department of Education (2022a) reported that the state had a total of 4,489 educator vacancies statewide. However, as shown in Exhibit 4 (pp. 5–6), this figure included some non-teaching positions (e.g., school guidance/counselors, pathologists, specialists). Excluding these positions, we arrived at 3,911 teacher vacancies for Florida in 2021–2022. In another example, the Kansas State Department of Education (2022) reported 1,253 teacher vacancies as of October 2021, including positions filled by underqualified teachers, and the number of positions that were not filled at all was 558. When the reporting document did not provide detailed data sufficient for verification, such as Colorado (Colorado Department of Education, 2022a), we conducted further searches while concurrently inquiring with state officials via email about how their vacancy totals were calculated. In the Colorado case, we sought and obtained the disaggregated data for their reported number of 440 educator vacancies (Colorado Department of Education, 2022b). The recalculation yielded 373 teacher-only vacancies and was incorporated into our final data set. Other examples of this work include Kentucky, Maine, Maryland, Missouri, Nebraska, North Carolina, Pennsylvania, and Utah. Often, the recalculated vacancy counts were slightly different from the state’s reported sum, and the primary reason was that these reports had included non-teaching positions or counted positions filled with less-than-fully certified teachers into vacancy. The more detailed verification and the specific decisions made during the process for each state are provided in Appendix Table 1.
It is critically important to emphasize that none of these three inspections weighed heavier than others in the data verification. While we generally prioritized timely information, we prioritized more dated and valid pieces of information over more recent numbers that could not be substantiated. One example of this prioritization was the case of Kentucky. We found from the University of the Cumberlands that Kentucky would need about 2,200 educators a year starting from 2021 (University of the Cumberlands, n.d.). However, no details were provided along with this estimate, and we found no supporting information for it from other searches. As a result, we did not retain this information in our final dataset and reported instead the older data (2020–2021) from the Kentucky Council on Postsecondary Education (2021).
Another example was Connecticut, for which we considered both the Connecticut Data Bulletin released in 2015 (Connecticut State Department of Education, 2015) and the 2019 teacher workforce report by the Rockefeller Institute of Government (Gais et al., 2019). The DOE report provided a clear explanation of how they measured vacancies, as well as multiple data tables that presented the data in different ways that could be used to verify against each other. The Rockefeller Institute’s report, despite being more recent, did not provide quantifiable information regarding teacher vacancies, nor clear evidence that there were no vacancies. We therefore used the DOE’s data (Connecticut State Department of Education, 2015) for Connecticut in our third iteration despite its outdatedness relative to the Rockefeller Institute’s report (Appendix Table 2). In the fourth and current iteration, we have 29 states with the most recent 2021–2022 vacancy data, while the few dated data points included six states from 2018–2019 to 2020–2021 and two states from 2017–2018. This heavily skewed distribution of the data years made the 2014–2015 data from Connecticut an outlier relative to rest of the updated data set. As a result, we decided to no longer incorporate the Connecticut data within the final reporting of the fourth iteration. 3
In other instances, the verification procedure, primarily the inspections of time/scale and content, allowed us to detect contradictory data and arrive at more robustly reported information. One example was the state of Florida. Initially, we found an article from CNN, citing the Florida Education Association (FEA), reporting that the state was in short of 5,000 teachers at the beginning of the 2021–2022 school year (Stuart, 2021). In contrast, another article from the Huffpost, citing the state’s education commissioner office, reported 3,541 teacher vacancies for the state within that same time frame (Golgowski, 2021). Our verification returned that the number 5,000 was a sum of openings among teacher positions in Florida the week before schools started (Golgowski, 2021), while the number 3,541 was 2020–2021 vacancy data coming out of the state’s official report Identification of Critical Teacher shortage Areas for 2021–22 (Florida Department of Education, 2021). In the latest report, this vacancy number was further updated to 3,911. As the state report provided more detailed information on how they accounted for teacher vacancies and their numbers were verifiable, we retained their sum. The Florida vacancy data in our final dataset (Iteration 4) came from the 2022 update of this state report (Florida Department of Education, 2022a).
Finally, to ensure that the final dataset was of high quality, we examined the correlation among the last four full-search results. We report correlation coefficients among the iterations in Appendix Table 3. As we built upon the first iteration for data collection, and importantly, data verification, the correlation coefficients among the second, third, and fourth iterations were very high (over .89), indicating a high degree of consistency in the process. In addition, the sums of reported teacher vacancies by state from the last three iterations show very similar results across iterations (Appendix Table 2), reaffirming the consistency of our baseline estimate for the national total of teacher vacancies.
Limitations
As mentioned, the first limitation of our study is data availability. We cannot find the numbers of vacant teacher positions for every state in the most recent school year. We also do not have evidence to confirm that no vacancies exist in states where such data were unavailable. For these reasons, we chose to use the most recent available information on the teacher workforce of each state to gain insights regarding its teacher shortages, though vacancy numbers may have evolved in subsequent years. We also reviewed and cross-verified multiple sources of information, including state departments of education, independent institutions, and media outlets to determine whether there are vacant teacher positions or positions filled by underqualified individuals.
Another limitation of the study is the inconsistency between the ways teacher vacancies are defined across sources. This was one of the motivations for us to establish the data verification procedure and strictly follow it for every state. As an example, the Nebraska Department of Education (2020), in their teacher vacancy survey report, used the term “unfilled” for “a position that was filled by someone other than a fully qualified teacher or a position that was left vacant,” while the term “vacant” referred to “a position that was not filled at all” (p. 7). In contrast, the Kansas Department of Education (2022) defined a vacancy as any position that was (1) “not filled,” or (2) “filled, but the person does not have an appropriate license.” In many cases, the reporting states counted into their vacancy measure not only teacher positions but also a variety of non-teaching personnel such as administrators, school counselors, and other support staff. These include the states that we described in the “content” data verification discussion above. In another case, the University of Maine System Board of Trustees (Kimball et al., 2019) estimated that Maine was short of 599 teachers for the 2017–2018 school year. However, this figure was calculated by subtracting the total size of teacher demand by that of supply, which might effectively obscure shortages in some areas or schools behind surpluses in others. Excluding the surpluses and non-instructional positions, we arrived at 689 vacancies for Maine in 2017–2018. Finally, not all sources of information define their terms or indicate how their numbers have been generated. This is typically the case with news reports that provide an estimate of teacher vacancies without a documented source for their information and is another motivation for our data verification.
Other challenges arise when trying to compare numbers across states, over and above the fact that data for different states come from different years. There are at least two general types of challenge for comparing—or combining—teacher shortages across states. First, data are collected in different ways, in different times of year (e.g., before or after the school year has begun), via different mechanisms (e.g., survey vs. administrative records), and by different parties (e.g., state offices vs. research institutions). Second, different data sources define “vacancy” and “underqualification” in different ways. For instance, states not only differ in the circumstances in which they grant certification waivers, but their requirements for “full” certification also vary. This makes characterizing teachers’ “qualifications” across states complex at best. Similarly, what constitutes a “vacancy” may vary depending on whether vacancies are defined only as officially existing positions or if they include positions that administrators would create if they believed they could fill them. So, while we generally find that individual states provide consistently high-quality or consistently low-quality data year after year, differences in data quality between states are substantial. Lastly, prior work has illustrated that shortages are concentrated in some fields, such as STEM or special education (see Goldhaber et al., 2022), but our data do not permit this kind of nuance.
Results
Our systematic search returns at least some information on teacher shortages for all 50 states and D.C., the vast majority of which comes from the 2021–2022 school year. Specifically, 45 states plus D.C. have shortage information for the 2021–2022 school, three states have information for 2020–2021, and two states have data from 2019–2020 or earlier.
RQ1: Reports of Vacancies and Underqualified Teachers
We report teacher vacancies, underqualified hires, the respective school year, and the primary data source in Table 1 (Appendix Table 1 provides additional details including references, descriptions of the data, and how we resolve differences for each state). To compare differences among states, we group them into three categories. Group one consists of 20 states where vacancy and underqualification counts are found recently and in the same school year from DOE, governmental agency, or non-profit institutional reports. All but three states in this group have data from either government offices or research institutions with details on how the data have been processed, allowing us to confirm vacancy and underqualification counts. For 17 states in group two, we find a vacancy count for only certain subjects such as math and science (e.g., Alabama), or find a count that may include underqualification (e.g., Mississippi, West Virginia), or vacancy counts provided without any further details (e.g., Delaware, Georgia), or data prior to 2021–2022. Finally, group three includes 14 states where no vacancy number can be found or where the information is not sufficient to determine vacancy numbers (e.g., Alaska, California, Iowa). Additionally, some states in this group report contradictory information (e.g., New York, Wyoming).
Teacher Vacancy and Underqualification by State

Note: + denotes a subtotal of the state’s total teacher vacancies. - denotes the number of teacher openings instead of teacher vacancies, or a sum of vacancies from more than one school year. ~ denotes a rough estimate of the state’s teacher vacancies. ^ denotes underqualification counts retrieved from the Civil Rights Data Collection (2018) in supplement to data unavailability in the primary searched results. For more information, see Appendix Table 1.
Group 1: States with Recent and Clear Vacancy Data
Among these states, Florida reports 3,911 positions being unfilled for the school year of 2021–2022 (Florida Department of Education, 2022a), followed by Mississippi, Illinois, and Arizona, with 3,036, 1,703, and 1,699 vacant positions respectively in the same school year (Arizona School Personnel Administrators Association, 2021; Illinois State Board of Education, 2021; Mississippi Department of Education, 2021). Many of the other states within this group had relatively fewer vacant teacher positions. Utah and Nebraska report 37 and 58 vacancies respectively, while Colorado, D.C., Hawaii, and South Dakota report from one to five hundred vacant positions.
Group 2: States with Less Recent or Less Clear Vacancy Data
Seventeen states belong to this category. Georgia reports 3,112 positions for the 2019–2020 school year (Williams, 2020), followed by Alabama and Wisconsin with 3,000 and 2,500 vacancies respectively in 2021–2022 (Alabama Political Reporter, 2021; James, 2021; Wisconsin Policy Forum, 2021). Twelve states reported fewer than 1,000 vacancies.
Group 3: States Missing Vacancy Data
In this category, most states have some information regarding their teaching force, but no evidence about vacancies. For instance, information on Arkansas (2017–2018), California (2018–2019), Louisiana (2019–2020), Massachusetts (2020–2021), Oregon (2015–2016), Washington (2019–2020), and Wyoming (2020–2021) suggests that these states have a substantial number of underqualified teachers, ranging from under 200 to over 20,000 positions 4 (Arkansas Department of Education, 2018; California Department of Education, 2019; Louisiana Department of Education, 2021; Lovett, 2016; Washington Office of Superintendent of Public Instruction, n.d.; Wyoming 2020–21 Report Card, n.d.).
In Alaska (2021–2022), even though there are no reports of vacancies, some positions are filled by international teachers (State of Alaska Office of the Governor, 2022). News reports suggest that there are teacher shortages in New York (e.g., Chacko, 2021; Rivas, 2021), yet a 2018 report by the Rockefeller Institute of Government suggests that New York has not experienced a teacher shortage, but rather a growing imbalance between the number of teachers and that of public school students that could potentially lead to an eventual teacher shortage (Gais et al., 2019).
In general, it is unclear the extent to which these states have teacher vacancies due to lack of reporting and other strategies used to fill vacant positions.
RQ2: Geographical Distribution of Teacher Vacancies
Using the last available year of vacancy data for each state (analogous to last-available data imputation), summing up reported vacancies there are approximately 39,700 vacant teacher positions across the U.S. (Appendix Table 4), where the southern region, by U.S. Census, accounts for the highest portion: 27,000 vacancies. This is four times higher than the Midwest, in the second place with about 6,500 vacancies. We note that these estimates depend on whether there is any reported information about vacancies for each state.
While it is important to have some clarity about the vacancy numbers for each state, it is critical to put these numbers into the context of the size of the relevant school system. In other words, we recognize that the raw numbers do not account for the number of students in the state and, relatedly, the size of the teacher labor market. Without accounting for the number of students in the state, the raw counts are not a fair apples-to-apples comparison and can be misleading in terms of the severity of the vacancy or underqualification challenge. As such, rather than attempting to interpret just the raw number of vacant teaching positions, it is critically important to express that number as a rate, such as the number of vacancies per 10,000 students or a percentage of total teaching positions (Table 2). To make this more comparable analysis, we next examine vacancies relative to student population and the number of teachers in the state.
Teacher Vacancies per Teacher and Student Population
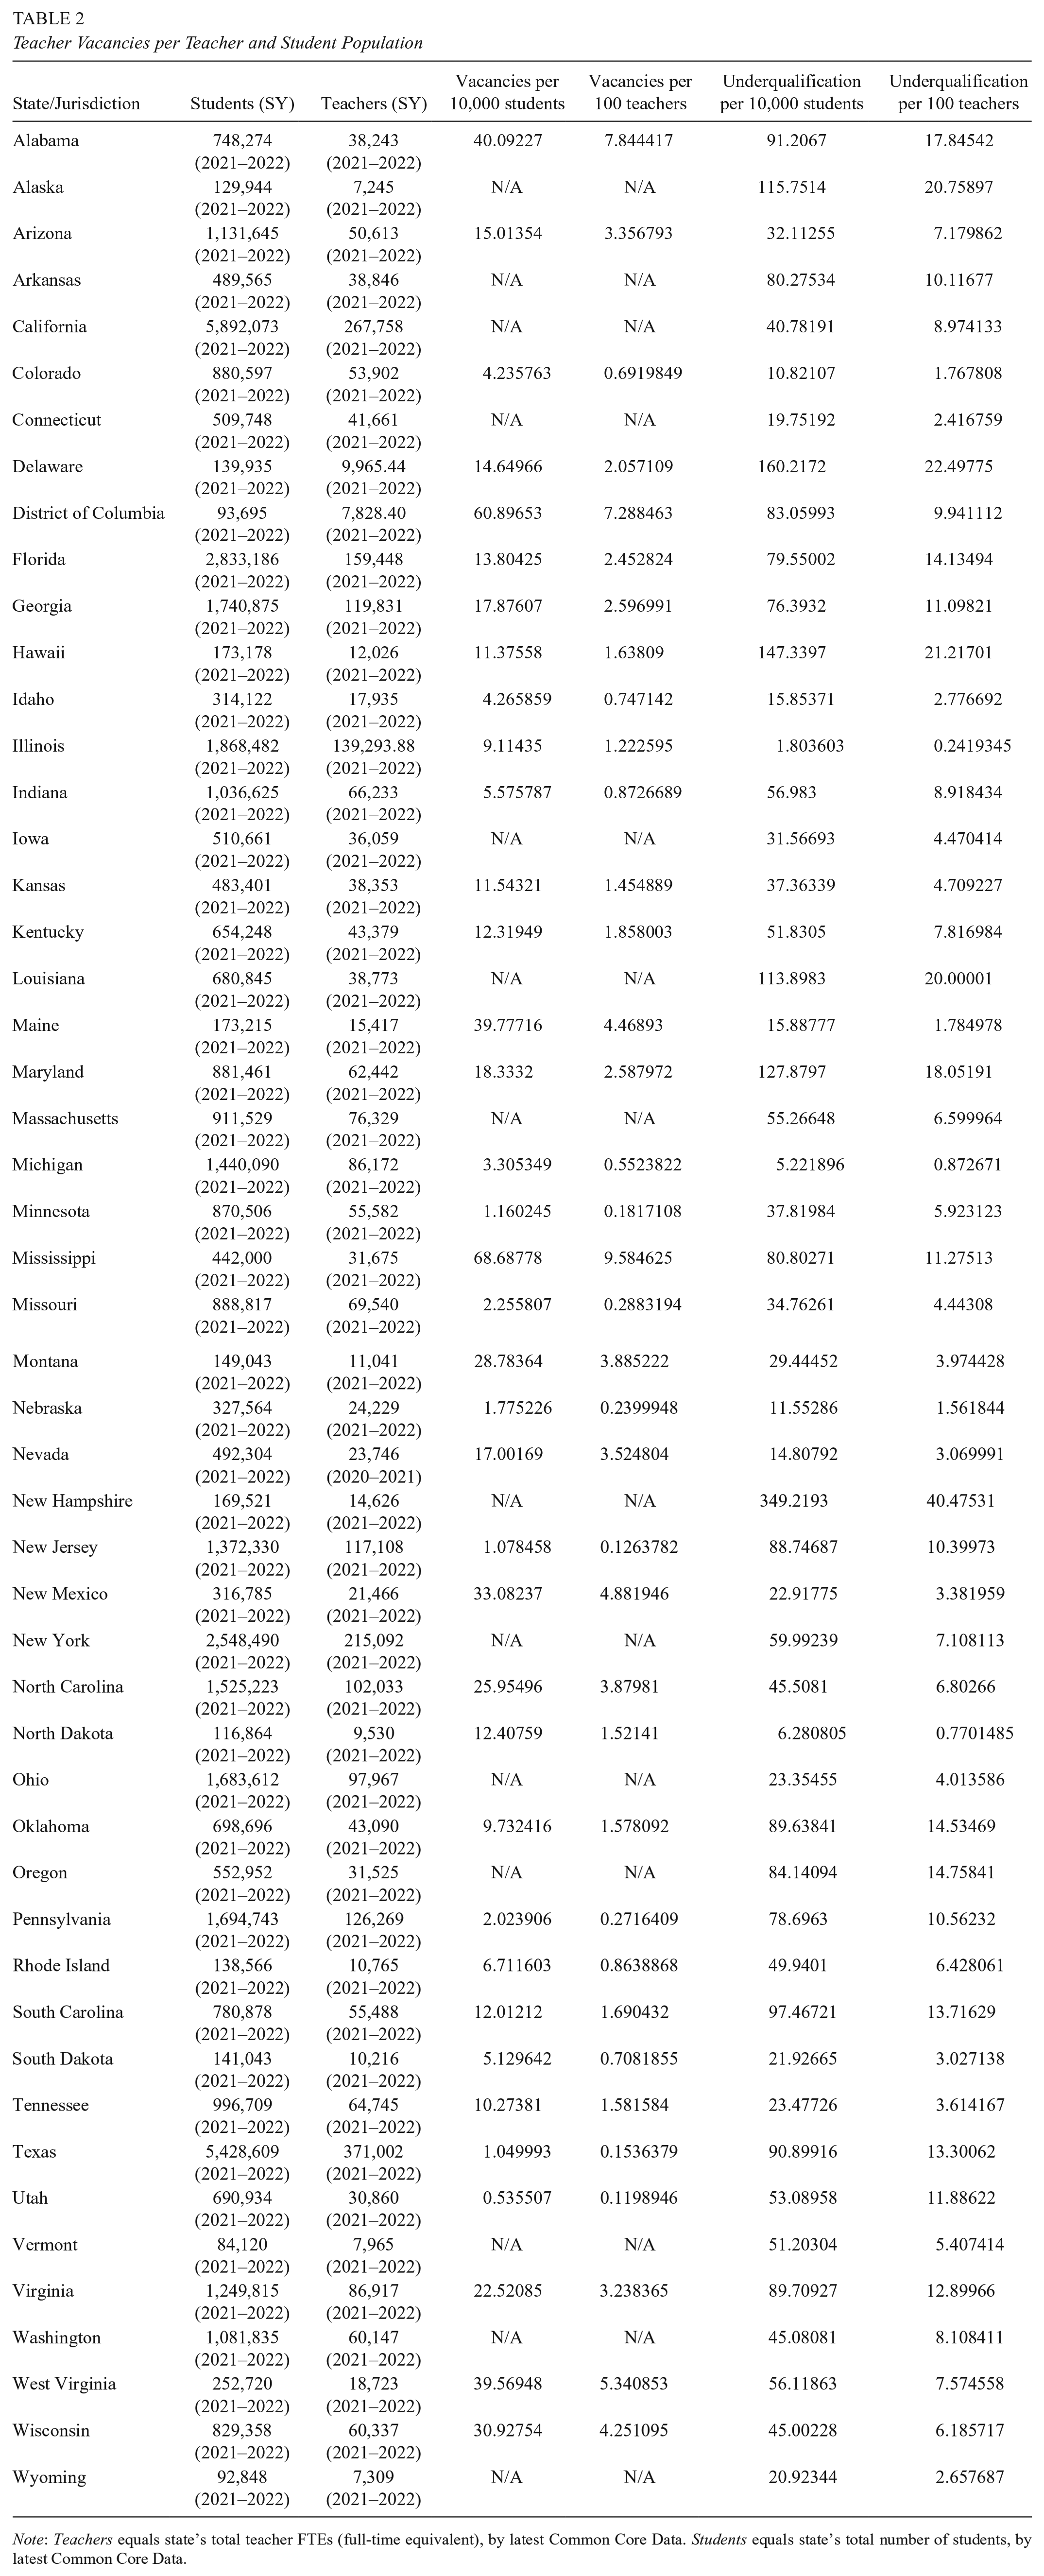
Note: Teachers equals state’s total teacher FTEs (full-time equivalent), by latest Common Core Data. Students equals state’s total number of students, by latest Common Core Data.
When student population is taken into consideration, the distribution changes substantially, and there is less of a geographical concentration of vacancies (Figure 1, and with more precise information in Table 2). In particular, there is no longer a cluster of high vacancy states in the southeastern area. Still, Mississippi is the state with the highest number of teachers needed for every 10,000 students: about 69. Expressed in terms of vacancy rate per 100 teachers, this is nearly 10% of the existing teacher workforce in Mississippi. The next highest rate of vacancy is in Alabama where there are 40 vacancies per 10,000 students, representing 8% of the teacher workforce in the state. Georgia and Florida have 18 and 14 vacancies per 10,000 students respectively. A handful of states, such as Maine, Montana, and New Mexico with “low” raw counts of vacancies actually have high per-student vacancy rates, with between 22 to 38 vacancies per 10,000 students. In other words, once we account for the size of the student population or the size of its teacher workforce, the apparent severity of teacher shortages changes substantially for some states. This indicates how different teacher shortages may look from different perspectives and underscores the importance of putting vacancy numbers into context.

Teacher Vacancies by 10,000 Students by State.
To this point, when we examine teacher underqualification (Table 1), we observe that 17 states have more than 5,000 underqualified teachers in 2021–2022 and 15 states have fewer than 1,000 underqualified teachers. Many states with low or unknown vacancy numbers, such as California, Louisiana, Texas, and New York, have high numbers of underqualified teachers. In light of the vacancy analysis, we also compare the numbers of underqualified teachers, as defined by individual state’s standards, per 10,000 students (Figure 2). Nineteen states have at least 60 underqualified teachers per 10,000 students, most of which are located in the south or southeast region. Nine states have fewer than 20 underqualified positions per 10,000 students, and 23 states have between 20 and 60 underqualified positions per 10,000 students. We observe that underqualification rate ranges from 1.17 position per 10,000 students, or 0.25% of the workforce, (Illinois) to 348.79 positions per 10,000 students or 40% of the workforce (New Hampshire). Utah has the second highest underqualification rate at 58.27 positions per 10,000 students. Interestingly, New Hampshire has not listed teacher shortage areas on federal database for at least three years (U.S. Department of Education, 2022), while Utah has recently celebrated strong staffing levels even amid COVID-19 (Reed, 2021a, 2021b; State of Utah Office of the Legislative Auditor General, 2021b). These results illustrate how we need to take the number of students, or the size of the state’s teacher workforce, into account when we compare vacancies and underqualification rates across states (or other jurisdictions). They also suggest that the apparent severity of a “teacher shortage” may vary substantially depending on how those shortages are measured or framed (e.g., in raw or per-pupil numbers, or based on how concerned one is about having “fully” certified teachers).

Underqualified Hires by 10,000 Students by State.
Discussion and Conclusion
There are several important takeaways from these analyses. First, we provide a plausible and approximate lower bound of the extent of teacher shortages nationwide. 5 By our count, at least 39,700 teaching positions are vacant nationwide. If we extrapolate the vacancy rate (i.e., on a per-student basis) to states where we were unable to find data, the national vacancy count is closer to 57,600. In the same vein, we obtain a very similar estimate when we use the number of underqualified positions and the known vacancy number for each state to extrapolate vacancy count for the fourteen states that do not have vacancy data and accounting for the number of teachers and students in the state. Under this approach, we estimate there are approximately 58,300 vacant positions across the U.S. 6 Using the Civil Rights data and reports of underqualification, we estimate there are 288,000 positions filled by underqualified teachers. Stated otherwise, some back-of-the-envelope math implies that teaching vacancies amount to 1.80 percent of positions nationwide. That is arguably not a high vacancy rate, especially in light of widespread concerns about teacher shortages. However, by the same math, approximately an additional 9.00 percent of positions are held by underqualified teachers. This latter figure is at least plausibly suggestive of more widespread teacher supply problems. Still, as we note above, teachers’ observable qualifications need to be interpreted cautiously given their weak relationship to effectiveness. Moreover, concerns about teacher shortages may themselves motivate policy changes that bring more underqualified teachers into the profession (e.g., to expand the teacher supply). Additional research on the relation between teacher qualifications and the teacher supply would be valuable. While vacancies are often discussed in the news, teacher underqualification is more pervasive than previously recognized, and we urge future research to examine this issue much more closely.
Our results also underscore the crucial point that “teacher shortages” defined in these ways vary substantially across regions and states and that it is important to consider the extent of the severity of the shortages through multiple perspectives. In particular, there is a strong need to account for the size of the student population or, relatedly, the size of the teacher labor market. For example, the vacancy rate per 10,000 students is more than 38 times as high in Mississippi as it is in Nebraska. Even this likely understates the extent of the variation since we do not have evidence about within-state variation between metropolitan areas, districts, schools, and teaching roles. Thus, efforts to characterize a “national teacher supply” or “nationwide teacher shortage” are likely to obscure considerable nuances and may confuse discussions about policy solutions.
While we present what we believe is the most comprehensive nationwide evidence to date about the scope of teacher shortages, perhaps another important takeaway from our analyses is how limited the data are. Our work is thus in line with other work pointing to the need to improve educational data systems so that educational inequities can be studied and addressed (e.g., Asson et al., 2023). Perhaps most concretely, we demonstrate that the lack of federal infrastructure for data on the teacher labor market (Bleiberg & Kraft, 2023) cannot be made up for by compiling analogous data at the state level. In contrast, other recent work has shown that when a state chooses to invest in the collection and publication of detailed, timely school staff shortage data, those data can be used both for productive analyses by researchers (Bruno, 2023) and for strategic intervention by policymakers (Smylie, 2023). Yet such data systems are rare. Indeed, there are many states for which we are unable to find credible estimates of the extent of teacher shortages at all. This includes fourteen states for which we are unable to find any estimate of vacant positions, and these states collectively represent approximately 30.47 percent of the roughly 50 million public school students in the country.
However, despite the many limitations of the data on teacher vacancies and underqualification rates, we argue that this work is much needed and that it has served to anchor the discussions on “teacher shortages.” In particular, there have been more than one hundred instances of local and national coverage of our work, especially about how our work has informed the debate regarding teacher shortages for the public and policymakers. Moreover, our website has been used by more than 30,000 unique visitors in the last year, and it has been cited in testimonies for the Senate Subcommittee on Economic Policy, the Committee for Economic Development, and the 2023 Economic Report of the President by the Council of Economic Advisors (Committee for Economic Development, 2023; Economic Report of the President, 2023; Senate Subcommittee on Economic Policy, 2023). While there is much future work to be done to better examine this critical issue of teacher vacancy and underqualification in the U.S., we believe our work makes a significant and substantial contribution to the ongoing debate and discussion in this area.
In sum, what our data cannot tell us about teacher shortages is in many ways more important than what they can tell us. This motivates several recommendations. First, we recommend that state policymakers make school-level data on teacher qualifications readily and promptly available. This is possible because states typically already have statewide longitudinal data systems for public elementary and secondary education and already play major roles in issuing authorizations to teachers and monitoring teacher quality (e.g., pursuant to highly qualified teacher requirements introduced under the No Child Left Behind Act; Remer, 2017). Without this kind of detailed, readily-available data on which schools are experiencing shortages of which kind of teacher, state policymakers themselves are likely to struggle to make targeted investments where shortages actually exist.
To promote understanding of teaching vacancies, we also recommend that districts or other relevant regional or statewide authorities maintain and make accessible data on job postings and unfilled teaching positions. Unlike teacher certifications, which are often subject to considerable regulations, this may not be information that education agencies currently maintain in a consistent format. However, without this kind of information it is challenging to know how difficult it is for schools to hire teachers. For instance, the employment of teachers who lack a standard certification is sometimes taken as evidence of the existence of a teacher shortage, and it may very well be, especially when teachers need to be issued certification waivers that can only be obtained after administrators demonstrate they were unable to fill a position with a fully certified teacher. Yet in other cases, choices to hire “underqualified” teachers may be harder to interpret, for example because administrators prefer a “less qualified” candidate. Data on positions administrators would like to fill but cannot may be increasingly available as districts use electronic job boards to post openings and solicit applications. States may also find it worthwhile to bolster district capacity to collect these data because additional evidence on local teacher labor markets could be useful for developing state policy aimed at addressing teacher shortages. State data systems generally already require the reporting of school-level filled staff positions and could likely be extended to include positions that have yet to be filled, at least at a snapshot in time. Some states have done this already (e.g., Illinois).
To these points, there are recent and ongoing federal policy initiatives that are seeking to address some of these issues. For instance, the Common Education Data Standards (CEDS, n.d.) initiative is a national collaborative effort to develop common data standards and streamline accessible data within and across P–0 institutions and sectors. Similarly, the Supporting Teaching and Learning through Better Data Act aims to examine educator workforce, including shortage, and data infrastructure needed to examine these challenges (Merod, 2023). Our work suggests that these federal initiatives should consider common definitions of “shortages” (e.g., vacancy and underqualification), the granularity of the data (e.g., number of vacant STEM teacher positions or number of underqualified special educators for district X in state Y), and how to collect and make these data readily available on an annual basis. These crucial features would provide educators and policymakers with data that they can act on.
As more detailed and timely data on teaching vacancies and credentials becomes available, we make two general recommendations to help interpret data pertaining to teacher shortages. First, it will typically be useful and important to put teacher shortage data into a specific schooling context, which can take numerous forms. One good general strategy is to put teacher numbers into the context of the size of the relevant school system. For instance, it may be helpful to also examine vacancy rates, such as the number of vacancies per 10,000 students or a percentage of total teaching positions (Table 2). As we show above, the apparent severity of teacher shortages can vary considerably depending on whether numbers are expressed as raw counts or relative to the size of the school system. Additionally, it will also be useful to compare the resulting figures in the context of current staffing levels, like the current student-to-teacher ratio.
Second, we recommend that discussions of teacher shortages be as precise as possible about how “shortages” are being defined and measured. As we document above, even the question of whether a teaching position is “unfilled” can be ambiguous because it could refer either to a vacant position or a position filled by someone lacking some qualification. Similarly, some parties (e.g., economists) might use the term “shortage” to refer to a situation where the number of applicant teachers is insufficient to fill available positions, while others (e.g., school administrators) might use “shortage” to refer to situations where they wish there were more or better applicants. Similarly, ambiguity can plague discussions about what we refer to broadly as “underqualified” teachers, another common indicator of teacher shortages. Not only is a vacant position potentially a different problem than hiring an underqualified teacher, but different types of underqualification might also matter to different degrees. For instance, whether a position is filled by a teacher earning an alternative certification or one with an emergency waiver might have different implications for students, though both might be considered “underqualified.” Indeed, given generally weak or counterintuitive relationships between teachers’ observable qualifications (e.g., credentials) and their effectiveness (e.g., An & Koedel, 2021; Chingos & Peterson, 2011; Rockoff et al., 2011), it is important to differentiate qualifications and effectiveness. Precision in discussions of teacher shortages might also facilitate comparisons across states—or make it clearer when such comparisons should not be made—by drawing attention to the specific implications of shortages for teachers and schools and to specific regulatory differences across jurisdictions. From our perspective, we believe that the construction of these shared definitions should be a combined effort among important stakeholders, including researchers, state and federal officials, and professional organizations, such as the Governors’ Association, since they have key roles to play in this work.
Supplemental Material
sj-docx-1-ero-10.1177_23328584241276512 – Supplemental material for What Do We Know About the Extent of Teacher Shortages Nationwide? A Systematic Examination of Reports of U.S. Teacher Shortages
Supplemental material, sj-docx-1-ero-10.1177_23328584241276512 for What Do We Know About the Extent of Teacher Shortages Nationwide? A Systematic Examination of Reports of U.S. Teacher Shortages by Tuan D. Nguyen, Chanh B. Lam and Paul Bruno in AERA Open
Footnotes
Acknowledgements
We thank Kate S. Nelson, Susan K. Patrick, Allison Gilmour, and Christopher Redding as well as anonymous reviewers and the AERA Open editors for their helpful comments and suggestions. Any errors remain our sole responsibility.
Declaration of Conflicting Interests
The author(s) declared no potential conflicts of interest with respect to the research, authorship, and/or publication of this article.
Funding
The author(s) received no financial support for the research, authorship, and/or publication of this article.
Notes
Authors
TUAN D. NGUYEN is an associate professor in the Department of Educational Leadership and Policy Analysis at the University of Missouri. He applies rigorous quantitative methods (quasi-experimental designs and meta-analysis) to examine 1) the teacher labor markets, particularly looking at the factors that drive teacher attrition and retention, and 2) the effects and implications of teacher policies and education policies intended for social equity and school improvement. Email:
CHANH LAM is a PhD student and Data Analyst in Teacher Education and Accreditation at the College of Education, Kansas State University. His research interests include teacher policies, educational technology, and educator preparation. Email:
PAUL BRUNO is an Assistant Professor of Education Policy, Organization, and Leadership in the College of Education at the University of Illinois at Urbana-Champaign. He studies personnel administration, school finance, and school choice. Email:
References
Supplementary Material
Please find the following supplemental material available below.
For Open Access articles published under a Creative Commons License, all supplemental material carries the same license as the article it is associated with.
For non-Open Access articles published, all supplemental material carries a non-exclusive license, and permission requests for re-use of supplemental material or any part of supplemental material shall be sent directly to the copyright owner as specified in the copyright notice associated with the article.