
Abstract
Prior research documented disproportional representation across racial, ethnic, and socioeconomic lines within the population of students identified as gifted and talented (GT). Less research has focused on what predicts improved representation for English learners (ELs) or students with disabilities (SwDs), or how state GT policies facilitate such representation. This paper attempted to fill that void by analyzing data from the Civil Rights Data Collection and Stanford Education Data Archive along with original coding of state GT policies. We found that while ELs and SwDs are disproportionately underrepresented within the population of students identified as gifted, state mandates for schools to offer GT, requirements for formal gifted education plans, and regular audits for compliance were correlated with higher rates of GT service availability and greater representation among ELs and SwDs. We further describe the characteristics of the top 5% of schools with the highest GT representation for ELs and SwDs.
Keywords
Gifted and talented (GT) programs and services have received substantial attention regarding the unequal representation of students of color and those from low-income families. For example, Peters et al. (2019) documented that at least since 2000, African American students have been roughly 55% as represented in GT populations nationally as they were in the overall K–12 student population. Fewer studies have examined what state policies, if any, improve the availability of GT services in schools with larger populations of minoritized students (i.e., whether they are even made available at a given student’s school), or the racial, ethnic, language, or disability demographics of the GT populations identified therein. In fact, in their 2017 article, Plucker et al. emphasized that more research is needed on the actual outcomes of policies, specifically calling out the need to examine whether GT identification and service mandates improve the demographic proportionality of GT student populations.
A similar gap exists regarding the disproportional GT identification of students with disabilities (SwD: for our analyses, defined as students served under the Individuals with Disabilities Education Act [IDEA] or under Section 504) or who are English learners (ELs 1 ). Recent scholarship has highlighted the intersection of disabilities and multilingualism (e.g., Cioè-Peña, 2017; Umansky et al., 2017) and of disabilities and race/ethnicity (e.g., Dever et al., 2016; Thorius, 2019). Despite equity being the dominant topic of discussion within the field (Peters, 2022), most research on equity within GT has focused on students of color or those from low-income families (e.g., Grissom et al., 2019, Hamilton et al., 2018) without any attention to potential concurrent exceptionalities or the intersectionality of race, ethnicity, disability, and home language. This is understandable given the United States’ long history of racism and discrimination, but it has resulted in a dearth of information on what factors, especially at the state policy level, predict lower or higher levels of GT identification for students who are ELs or SwDs.
The Effect of State Policies on Gifted Education
The National Association for Gifted Children’s (NAGC) biannual State of the States Report (Rinn et al., 2020) as well as other surveys and publications (e.g., Callahan et al., 2017; McClain & Pfeiffer, 2012; Plucker et al., 2015) have shown that states vary in their policies toward GT. Rinn et al. (2020) found that in some states (e.g., North Carolina, Iowa, Florida), identifying and serving GT students in schools is legally mandated, funding is provided, and the state conducts proactive enforcement. Other states, such as New York, South Dakota, or Massachusetts, have no statewide policy regarding GT services or related state funding. Many states fall in between these two extremes. The effects of these diverse policy approaches on the availability of GT services and the demographic makeup of GT students at the school level are not well understood.
Baker and Friedman-Nimz (2004) examined how state funding rates and mandates correlated with whether a school offered GT services (what we refer to as “service availability”) and found the following. First, in states with mandates, schools were 2.0 to 2.7 times as likely to make GT services available, but that within those states, the level of funding did not have any additional influence. Second, schools in states with mandates served a larger proportion of their students in GT. Conversely, the larger the proportion of students from low-income families, the lower the probability that the school would offer GT services. The one silver lining was that in a state with a mandate, a school with 100% of students from low-income families still had a 23% higher probability of offering GT services compared to the average across all states. This suggests that state mandates for GT services can increase the availability of GT services in schools, including in the schools with the largest proportion of students from low-income families. If true, this points to state mandates and as a powerful policy lever for ensuring GT is available to all students, regardless of the school they attend.
The existing evidence of the outcomes of state GT mandates is complicated. For example, Peters et al. (2019) examined data from the 2015–2016 U.S. Office of Civil Rights Data Collection (CRDC) and compared the availability of GT (whether a school identified at least one student as GT—the same operating definition we use in the present analyses) and the demographic make-up of GT populations for states that did and did not mandate GT. On average, schools in states with mandates showed higher rates of school-level GT availability. In states that mandated schools make GT services available, 58% of schools identified one or more students for such a service compared to 42% in states with no mandate. However, regarding demographic proportionality, there were few patterns. The authors relied on a representation index (RI) as a metric of demographic proportionality. An RI is simply the ratio of a group’s representation in a school’s GT population and the group’s representation in the overall student population. As a result, an RI of 1.0 means a student group is as represented in GT as it is in the overall student population (e.g., if Black students were 14% of the overall student population and 14% of the GT population). Values less than 1.0 signify underrepresentation, and those greater than 1.0 signify overrepresentation. Peters et al. (2019) found that Black students were more proportionally represented in GT in states with mandates (RIs around .60) compared to those with no mandates (RI = .48). However, for Latinx students, RIs were similar regardless of mandate (around .60), and RIs were actually lower for students who were ELs or SwDs (not including 504) in states with mandates (RIs = .23 and .25, respectively) than in those without (RIs = .34 and .38, respectively). This suggests that mandates might have a greater effect on GT identification rates for some groups than others or that greater availability of GT does not also translate to greater equity within GT.
Peters and Carter (2022) took a similar approach to Peters et al. (2019) and Baker and Friedman-Nimz (2004). The authors used multiple federal datasets to understand what school and district characteristics predicted the availability of GT at the school level and the proportion of students so identified. In their model that controlled for average school achievement, the school-level proportions of Asian and Hispanic students were positive predictors of GT availability while the school-level proportions of Black or low-income students were negative predictors. Socioeconomic (SES) factors such the average SES of the school and the percent of adults in the community who had a college degree stood out as strong predictors of GT service availability even after controlling for school-level average achievement. This is concerning since it suggests that factors other than school or district achievement profile predict GT availability and that these factors contribute to lower RIs for certain demographic groups. It also highlights the importance of evaluating the relationship between policies, GT availability, and demographic proportionality alongside other school and district factors.
McBee et al.’s (2012) study on Florida’s identification policy is among the best of its kind. Starting in 2002, Florida school districts were allowed to propose alternative identification pathways for students from low-income families or who were classified as ELs. Up until that point, students needed to score two standard deviations above the mean on an individually administered intelligence test to be identified for GT. McBee et al. found that if a randomly selected Florida school district were to adopt one of these alternative pathways, the identification rate for students from low-income families would more than double. For Black students, the increase was by two-thirds, even though the Plan B policies would not apply to all Black students—only if they were also ELs or from low-income families. Again, this confirms that specific state policies can influence GT identification rates for students from certain demographic groups.
Existing Research on English Learners and Students With Disabilities in Gifted Education
Peters et al. (2019) reported on the RIs for various student subgroups in GT for every state, by racial/ethnic group and for students who were ELs or served under IDEA. Nationally, GT RIs for ELs and students served under IDEA were .27 and .21, respectively. This means that ELs and students served under IDEA were 27% and 21% as represented in the nation’s gifted and talented populations as they were in the overall K–12 student population. When the authors examined these same RIs at the state level for 2012, 2014, and 2016, the only states that came close to proportional GT identification for these subgroups were states with small proportions of ELs (e.g., West Virginia and Vermont) or in states where GT is part of special education (e.g., West Virginia and Tennessee). To our knowledge, no prior research has examined whether including GT as part of special education influences the availability of GT services or whether SwDs are more proportionally represented in GT populations in such states.
Regarding how to identify ELs or SwDs for GT, there is conflicting information in the literature, particularly on the use of “nonverbal” ability tests. These tests are referred to as nonverbal because they involve reduced linguistic demand (e.g., the items include no written prompts) or are 100% text-free (even the directions). In a comparison of three common nonverbal tests, Lohman et al. (2008) found that ELs still scored substantially lower than their non-EL peers on all of them (by roughly one-third of a standard deviation). Giessman et al. (2013) found similar mean score gaps between EL and non-EL students on two nonverbal tests (of approximately two-thirds of a standard deviation). Carman et al. (2020) collected data from one large school district (n = 15,724 for a single grade level) using both the Naglieri Nonverbal Test of Ability (NNAT) and the CogAT Nonverbal battery (CogAT-NV). SwDs scored about one-third of a standard deviation lower on CogAT-NV and about one-half of a standard deviation lower on NNAT than their non-SwD peers. This suggests that simply removing language from an assessment does not result in equal mean scores across student groups. Instead, the field needs a better understanding of what factors are associated with more proportional representation in GT (i.e., RIs closer to 1.0), specifically for ELs and SwDs.
Gubbins at al. (2020) conducted site visits and in-depth evaluations of 16 schools across three states that had proportional representation of ELs among their GT populations. All 16 schools were majority low income and enrolled from 384 to 1,747 students. The goal was to understand each school’s identification process and how or why it appeared to be working so well for ELs. One of the first themes to emerge was that despite using common assessments for identification, all schools implemented universal screening in one or more grade levels. This means that rather than rely on teacher referrals, the school proactively screened all students. School-based teams then used screener score data to seek out students’ strengths rather than focus on deficits. A second theme related to creating alternative pathways. Observed in 9 of the 16 schools, this involved using first-language assessments or pre-identification talent development programs. In practice, ELs were more likely to be identified where GT, special education, and EL staff collaborated.
Studying the appropriateness or effectiveness of identification systems for students with dual exceptionalities or who are twice-exceptional (a diagnosed disability as well as a designation as gifted) is more complicated than it is for other underrepresented groups. This is because the most common disability (specific learning disability) has historically required performance in an area that is substantially below expectations (McCoach et al., 2001), even though this is no longer a requirement under more-contemporary approaches such as response to intervention (Fuchs et al., 2010). For example, a student may perform at the 90th percentile on a test of quantitative reasoning but at the 30th percentile on a test of math achievement. Her math achievement is lower than expected given her demonstrated ability. Such disparate scores are often disqualifying in GT identification. Like Gubbins et al. (2020), Maddocks (2018) suggested that a common barrier to SwDs being identified as GT is focusing on areas of relative weakness as opposed to areas of strength. For example, traditional GT identification criteria focus on composite ability scores inclusive of a range of domains and subscales or consistent high performance across multiple domains of achievement (Callahan et al., 2017). By definition, such approaches will identify few students with learning disabilities, who typically score lower in at least one area due to their specific disability.
Despite being the groups least demographically represented in GT compared to the overall student population, SwDs and ELs have received less attention in GT identification discussions than students of color or those from low-income families. To be sure, there is substantial discussion in the research community (e.g., Dai et al., 2011) and among practitioners on the topic of twice-exceptionality (e.g., Fugate et al., 2020; Kaufman, 2018; Speirs Neumeister, 2024). There has also been research on best practices for serving GT students with specific disabilities (e.g., Foley-Nicpon et al., 2012) and similar work on how to best identify (e.g., Harris et al., 2009; Hertzog et al., 2023) and serve (e.g., Pereira & de Oliveira, 2015) GT students who are developing English proficiency. However, to date, little is known about what school factors, district factors, or state policies correlate with greater availability of or proportionality in GT services for ELs or SwDs. We seek to address that gap in the present paper.
Methods
Research Questions
What school and district demographic (e.g., total enrollment, proportion EL) or achievement (e.g., district average achievement) characteristics are correlated with the availability of GT in schools with ten or more students who are ELs or SwDs?
What is the relationship between state GT policies (e.g., state mandate for GT, treating GT as part of special education), availability of GT services, and the GT RIs for ELs and SwDs?
How are schools with the highest GT RIs for ELs or SwDs different from the rest of the nation’s schools?
Data and Exclusion Criteria
To answer these research questions, we merged data from three sources: (a) the 2017–18 CRDC; (b) the Stanford Education Data Archive (SEDA, Reardon et al., 2021); and (c) our own coding of individual state’s policies toward GT (see later discussion). We retained regular public, charter, and magnet schools in the 50 states for our analyses. While they are included in the CRDC, we excluded Puerto Rico because SEDA did not include their data in the most recent release available at the time. Similarly, we excluded students in Washington D.C. because none of their schools were reported as having GT students in the CRDC. Finally, we excluded vocational, alternative, and virtual schools because of likely inconsistencies over whether school instructional standards (like GT mandates) applied to them in the same ways as traditional public schools. We used unique school identification numbers from the National Center for Education Statistics (NCESID) to link datasets; as a result, a small number of schools with missing or duplicate NCESID (1%) were excluded.
We accessed the data through the Urban Institute’s Education Data Portal (n.d.). Of the 97,632 schools in the CRDC data, we first filtered those that successfully merged with the SEDA data. This reduced our samples to 66,040 for EL analyses (Table 1) and 66,024 for the SwD analyses (Table 2). Primarily, this reduction was due to SEDA including achievement data for students and schools in grades three through eight. Thus, all high schools and schools only serving primary grades (for which average achievement was not calculated by SEDA) were dropped from our analyses. This was not especially concerning since GT services tend to start in grades two or three and are rare in high school (Callahan et al., 2017). Next, we filtered any schools that enrolled fewer than 10 students who were ELs or SwDs. This was a difficult, if necessary, decision. Retaining all schools, including those with total EL or SwD enrollments of one or two students, would have resulted in some of them appearing highly successful in terms of RI simply because a single student was identified. The result would have been some schools appearing successful when, in reality, their high RI was due to one family’s decision of where to live. We had to make a choice regarding what enrollment distinguished having a critical mass of either ELs or SwDs and chose 10 simply because it’s a common cutoff for reporting summary statistics. We acknowledge more of the limitations resulting from this choice in the limitations section.
Descriptive Statistics for Overall SEDA Sample and EL Subsamples

Note. EL = English learner; GT = gifted and talented; SD = standard deviation; Rep index = representation index calculated using Equation (1); FRPL = free or reduced-price lunch; SPED = special education; SES = socioeconomic status; BA = bachelor’s degree. School enrollment and GT enrollment are the authors’ calculations using Civil Rights Data Collection 2017–2018 data; other school and district characteristics are from the Stanford Education Data Archive.
Descriptive Statistics for Overall SEDA Sample and SWD Subsamples

Note. SWD = students with disabilities and includes those served under IDEA and Section 504; GT = gifted and talented; SD = standard deviation; Rep index = representation index calculated using Equation (1); FRPL = free or reduced-price lunch; EL = English learner; SPED = special education; SES = socioeconomic status; BA = bachelor’s degree. School enrollment and GT enrollment are the authors’ calculations using Civil Rights Data Collection 2017-2018 data; other school and district characteristics are from the Stanford Education Data Archive.
Removing schools with fewer than 10 EL or SwD students resulted in a total analytic sample of 40,489 schools for our EL (Table 1) and 63,532 schools for our SwD (Table 2) analytic samples. Not surprisingly, far more schools enrolled 10 or more SwDs than 10 or more ELs. Compared to the entire U.S. public school population, our EL analytic sample had larger EL enrollment (60 vs. 40 students), smaller overall enrollment (500 vs. 600 students), and a slightly lower GT enrollment rate for all students (6% vs. 7%). The SwD analytic sample had smaller SwD enrollment (80 vs. 100), smaller overall enrollment (500 vs. 600), and a slightly lower overall GT enrollment rate (6% vs. 7%).
Variables used were school total enrollment (Total N Enrolled 2 ), EL/SwD enrollment (N EL / SwD Enrollment), GT program availability (GT = 1 if yes, = 0 if no), and for schools that reported having a GT program (i.e., GT = 1): total students enrolled in GT and EL/SwD enrollment in GT (N EL / SwD in GT). Schools with zero total enrollment, missing total enrollment, or missing EL/SwD enrollment, and schools with GT enrollment counts, EL counts, or SwD counts greater than total school enrollment were dropped (<0.3%). This is reflected in the school counts presented in the prior paragraph. We also included covariates such as school proportion EL (Proportion EL), district proportion special education (Proportion SPED), school and district proportion receiving free or reduced-price lunch (FRPL: Proportion FRPL), and average achievement test scores. For test scores, we followed SEDA documentation recommendations and used ordinary least squares estimates of scores pooled over grades, subjects, and years.
Tables 1 and 2 show descriptive statistics for schools in the full CRDC-SEDA matched dataset by EL (Table 1) and SwD count (Table 2). Of the approximately 66,000 regular, charter, or magnet schools with unique NCESIDs and complete data, 61% enrolled at least 10 EL students (Table 1); of these schools, 72% identified at least one student as GT. Table 2 shows analogous data for SwDs: 96% schools enrolled at least 10 SwDs and 68% of those identified at least one student as GT. This is why the analytic sample for SwDs is so much larger.
Calculating Enrollment and Gifted Program Participation
For each school, we calculated EL and SwD enrollment as percentages of total enrollment, total students identified for GT as a percentage of total student enrolled, and the GT RI for ELs and SwDs as follows:

Note this is mathematically equivalent to the RIs calculated elsewhere (e.g., Peters et al., 2019).
Modeling State Policy
As part of this study, we hoped to understand the effects various state policies might have on the availability of GT services in schools with meaningful numbers of ELs or SwDs. Past reports (e.g., Plucker et al., 2015) and NAGC State of the States reports have included information related to state policies and requirements of schools and districts related to GT. Unfortunately, there was no State of the States data collection that would apply most directly to the 2017–2018 school year—the most recent year for which our outcome data are available. The two closest were conducted during the 2014–2015 and 2018–2019 school years.
To identify the state policies in place for the 2017–2018 school year, we started by comparing the 2014–2015 and 2018–2019 State of the State reports. For each of the variables related to state policy, we compared responses for each state from both years. If the responses agreed, we felt confident that such a policy was or was not in place for the 2017–2018 school year. For example, the state of Alabama was categorized as conducting audits of district compliance with GT policies in both the 2014–2015 and 2018–2019 school years. As such, we felt comfortable that similar audits were conducted in the 2017–2018 school year. However, for several of the states and several of the policy variables, the two years did not agree or one year was missing data. For example, in 2014–2015, Texas was categorized as not requiring a plan be submitted to the state while in 2018–2019 it was categorized as requiring a plan. Similarly, in one year Utah was listed as requiring districts to have formal GT plans in place while in the other year it did not. In these cases, we first reviewed state education agency websites for additional information specifically related to the 2017–2018 school year. In many cases this provided clarity on which policy was in effect in 2017–2018. For example, Wisconsin only conducted audits following a complaint or report of noncompliance. As such, we coded Wisconsin as not regularly auditing districts for compliance with the state mandate. In several cases, state websites did not provide clarity. When this happened, we reached out to GT directors at the state education agencies (e.g., Alabama, Nebraska, Indiana), members of the state GT associations (e.g., New Jersey, Pennsylvania), faculty members at universities within the state (e.g., Texas, Kansas), or even veteran school district administrators (e.g., Georgia, Utah). In all such cases, we received helpful clarification. However, this did create a limitation as it is possible that one or more of our informants were mistaken or characterized a policy differently than another person might have. Luckily, the vast majority of states fell cleanly into the category of having a state policy or not and did not require much subjective interpretation.
As a result of this work, we assigned dummy codes related to five GT policies for the 2017–2018 school year for all 50 states. These can be seen in Table A1 on our project OSF page. Specifically, these dummy codes related to the following:
Did the state mandate GT student identification (labeled “State Mandate”)? Importantly, we only coded a state as mandating GT identification if the mandate applied to all school districts. For example, states like Nevada and Missouri provided guidance for GT, but these guidelines were only required to be followed if a district chose to offer GT services or apply for funds. Districts were not required to do so. In those cases, we coded the state as not having a mandate. This resulted in 36 states coded as having a mandate.
Did the state regularly audit school districts regarding compliance with state rules for GT (labeled “State Audit”)? States were coded as conducting audits of school district compliance if they conducted proactive, regular check-ins with school districts. For example, Indiana districts were only eligible for audits if they applied for and received grant funding to offer GT. Similarly, Wisconsin districts were only audited following a complaint of district noncompliance. Because these do not represent “regular” or “proactive” audits, the states were both coded as not auditing district compliance. Alternatively, Oklahoma audited 25 districts every year at random. As a result, we coded them as conducting proactive audits. This operational definition resulted in 21 states coded as conducting audits.
Were districts required to create, maintain, and/or submit GT program plans to the state (labeled “State Plan Req”)? This code indicated if districts were required to have written plans for GT identification and/or services. We did not look for the content of such plans—only whether they were required to be on file or submitted to the state. For example, districts in Maine must have such a plan on file with the state absent an active waiver. Similarly, North Carolina required districts to update their plans every three years. Both states were coded as mandating GT plans for districts. In total, 26 states were coded as mandating district GT plans.
If districts were required to have such plans, were they required to be approved by the state (labeled “State Plan Approval”)? This code represented whether states exercised any kind of approval authority over district GT plans. While a state might require that a plan be in place, some states went further by reviewing and/or requiring changes to plan drafts. This was challenging to code, as some states provided feedback even though districts were not always required to incorporate such feedback or gain the state’s approval. Still, because there was engagement with districts by the state, we saw such actions as similar to approval. For example, Iowa districts were required to address their GT identification criteria, budget, and other factors as part of their school improvement plans. Similarly, all Florida districts had their approved GT policies and procedures posted on a central state website, including a notation for state approval. In the end, we coded 14 states as requiring district plans to be approved by the state.
Our final state policy code differs from the others in that it represents a qualitatively different approach to GT in a state, whereas the other four can be seen as degrees of GT mandate or services in the states’ schools. The fifth code asked the following: is GT considered an exceptionality under the state’s special education laws or rules (labeled “State GT as SPED”)? Some states mandated GT students to be served under the broader umbrella of special or exceptional education. We coded these separately as the systems of implementation and accountability appeared qualitatively different from other states that mandated GT. We coded seven states as operating GT within exceptional or special education. For example, in Pennsylvania, “children with exceptionalities” included those with a disability or those who are GT. Similarly, the section of New Mexico administrative code addressing special education (6.31.2 NMAC) also defined a GT child and described how an Individual Education Plan (IEP) team needed to identify such students. Of course, these states still varied in terms of how they apply federal special education law and its procedural safeguards to GT students, but in general they all approached GT as a form of exceptionality alongside SwDs. We chose to investigate this policy given it could plausibly influence GT identification rates for SwDs.
Distilling complex state policies into dichotomous codes inevitably results in an imperfect approximation of reality. However, our goal here, at least with the first four state policy codes, was to obtain a metric of degree of GT policy within each state. In other words, if a state was coded as having a mandate, requiring plans, approving of plans, and conducting audits, we saw that state as doing more to implement GT than a state that had a mandate on paper but did little to enforce it in schools. Thus, while there is certainly variance in policy even within states similarly coded in each category, we felt comfortable that the first four codes, when included together in a model, served as a decent approximation of GT implementation in the state. We saw the fifth code (GT as SPED) as an indicator of a qualitatively different approach to gifted education in a state rather than an additional degree of implementation. However, because we thought it would be relevant for SwDs, we included it. Further, if we learn of mistakes we made or if new information comes to light, we will update Table A1 as well as our findings on the project OSF site (https://osf.io/q8trm/).
Data Analysis
We used four two-level linear and linear probability models (LPM) with schools nested within districts. The dependent variables were (a) whether GT services were available at a school and (b) the GT RI of students who were ELs or SwDs in each school. For the binary outcome variable (a), we also ran logistic regressions to verify that the findings were similar to the LPM. We describe only the LPM findings in the rest of this paper for ease of interpretation.
For each dependent variable, models are organized in a stepwise manner, with subsequent models adding new predictors to the previous one. Model 1 only included an intercept and district random effects. Model 2 added school-level covariates: average achievement, proportion EL, proportion FRPL, and codes for being a charter, magnet, city, suburban, and town school (with rural being the omitted locale). Model 3 added district-level covariates: proportion FRPL, average SES, proportion of adults with a bachelor’s degree or above, proportion of students who were EL, proportion of students who were eligible for special education services, and district average achievement. Covariates in Models 2 and 3 were grand-mean centered, and proportions were scaled to represent the association for every 10 percentage points. Finally, Model 4 (shown below for EL) added the five state policy dummy codes: mandate, audit, plan required, plan approval, and GT as special education.
Model 4:


where
Results
Table 1 presents school-level descriptive statistics for the full set of SEDA schools, our analytic sample of schools with 10 or more EL students, and the sample of schools that had fewer than 10 students who were ELs. Table 2 presents the same but for our SwD analytic sample. Both tables show some clear differences between our analytic samples (10 or more ELs or SwDs). For example, schools with 10 or more SwDs are more likely to make GT services available (.68) compared to schools with fewer than 10 SwDs (.26). Schools with fewer than 10 SwDs are also more likely to be charter schools (.12 vs. .05). Our analytic sample of 10 or more ELs was also more likely to be suburban schools than the full set of SEDA schools (.36 vs. .29) or the schools with fewer ELs (.19). Additional descriptive statistics for our samples, including disaggregating schools by GT service availability and 10 or more ELs or SwDs, can be found in Tables A2 and A3 on our project OSF page (https://osf.io/q8trm/).
School and District Predictors of Availability of Gifted Services
Research question 1 examined what variables were associated with the availability of GT services in schools that enroll 10 or more ELs or SwDs. Table 3 presents the results of our four models for ELs, and Table 4 presents the results for SwDs.
Predicted Probabilities of 10+ EL Schools Offering Gifted and Talented Services
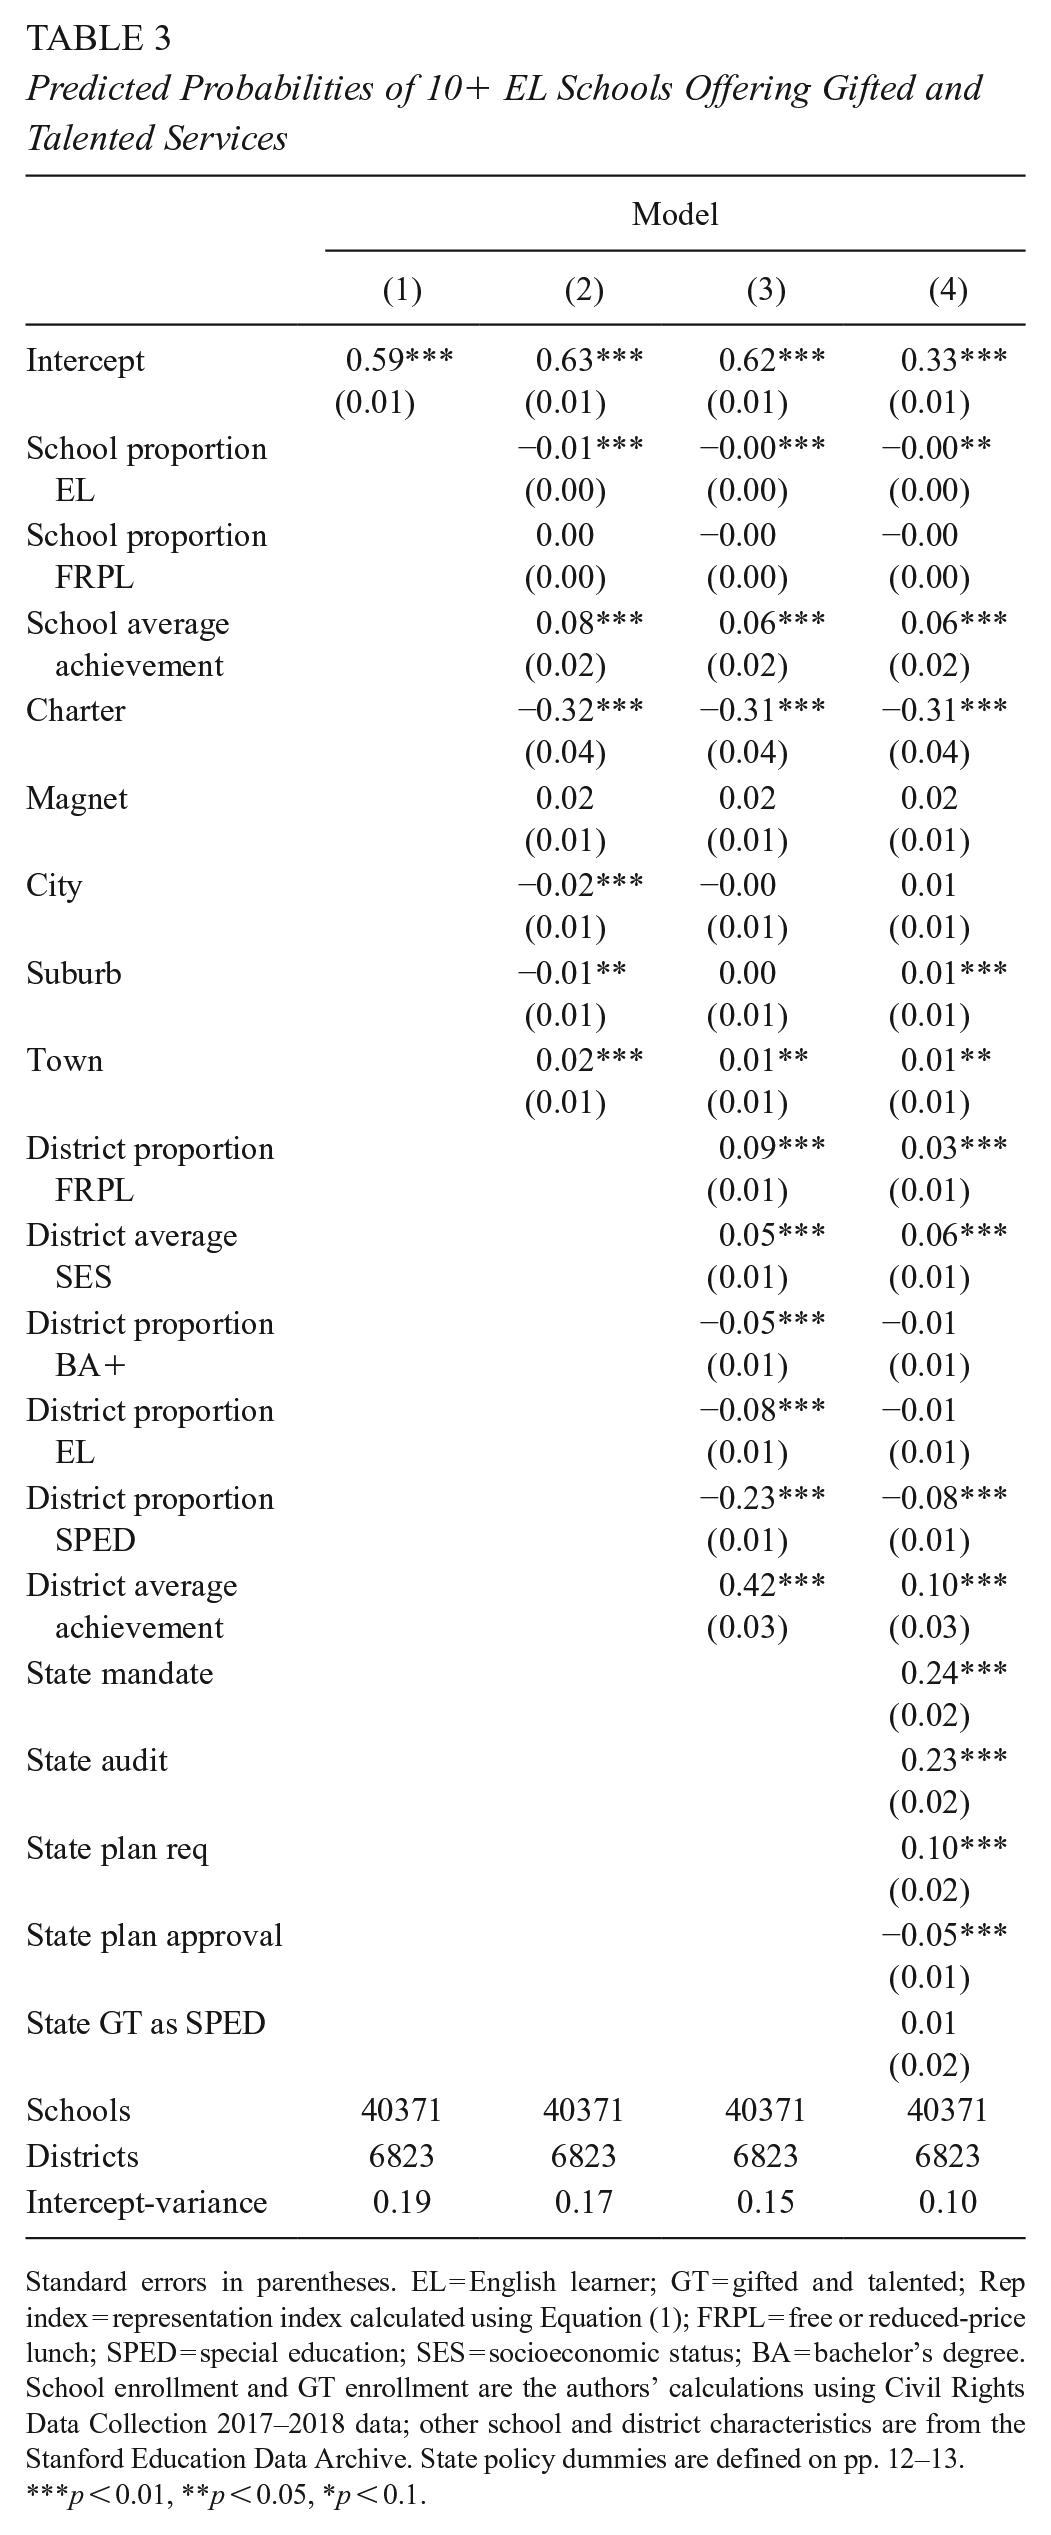
Standard errors in parentheses. EL = English learner; GT = gifted and talented; Rep index = representation index calculated using Equation (1); FRPL = free or reduced-price lunch; SPED = special education; SES = socioeconomic status; BA = bachelor’s degree. School enrollment and GT enrollment are the authors’ calculations using Civil Rights Data Collection 2017–2018 data; other school and district characteristics are from the Stanford Education Data Archive. State policy dummies are defined on pp. 12–13.
p < 0.01, **p < 0.05, *p < 0.1.
Predicted Probabilities of 10+ SWD Schools Offering Gifted and Talented Services

Standard errors in parentheses. SWD = students with disabilities and includes those served under IDEA and Section 504; GT = gifted and talented; Rep index = representation index calculated using Equation (1); FRPL = free or reduced-price lunch; EL = English learner; SPED = special education; SES = socioeconomic status; BA = bachelor’s degree. School enrollment and GT enrollment are the authors’ calculations using Civil Rights Data Collection 2017–2018 data; other school and district characteristics are from the Stanford Education Data Archive. State policy dummies are defined on pp. 12–13.
p < 0.01, **p < 0.05, *p < 0.1
The Model 1 intercept shows that for this sample of schools (n = 40,371), 59% made GT services available—at least one student was identified. The variance for this intercept among districts was .19. Model 2, after adding school demographics, shows that school proportion EL is negatively associated with school availability of GT, if weakly. For every 10 percentage-point increase in school proportion EL, there is a 1 percentage-point decrease in the probability of a school providing GT services. However, in Model 4, which includes state policies and district demographics, school proportion EL has a near-zero estimate, and district proportion EL is no longer a significant predictor. Table 3 also documents that charter schools with 10 or more ELs are 32 percentage points less likely to make GT services available compared to schools of average achievement, with an average proportion of FRPL and an average proportion of EL. Although the charter estimate might be expected given the greater flexibility charter schools often have over services and curriculum, it also means that students in charter schools are less likely to receive GT services.
Models 3 and 4 document several other notable relationships. District SES is positively associated with GT availability in Models 3 and 4 (.05 and .06). This can be understood as schools that have a 1 standard deviation higher on the SEDA composite SES variable, being 5 percentage points more likely to make GT services available. However, district proportion FRPL is also positively associated with GT availability (.09 and .03), which can be understood as schools that are 10 percentage points higher on the proportion of students eligible for FRPL, being 9 percentage points more likely to have GT services available. The reason for these seemingly conflicting relationships is not clear. It is possible that the dichotomous nature of FRPL, as opposed to the continuous and normative nature of SES, resulted in these differing estimates. FRPL eligibility is based on an income threshold, while the SES variable includes parental employment and education and is normed across all the SEDA districts.
SwDs
Turning to the schools with 10 or more SwDs (Table 4: n = 63,294), the Model 1 intercept shows 54% made GT services available. The variance for this intercept among districts was .19. In Model 2, which added school predictors, school proportion SwD is negatively associated with GT availability, with every 10 percentage-point increase in school proportion SwD associated with 1 percentage-point decrease in the probability of the school providing GT. As was seen in the 10 or more EL sample, charter schools with 10 or more SwDs are much less likely to make GT services available to their students (−.29).
In Model 3, which added district predictors, the district proportion of special education (SPED) is also negatively associated with GT availability (−.19). For every 10 percentage-point increase in the proportion of special education at the district level, the availability of GT services goes down by 19 percentage points. Also consistent with the 10 or more EL schools, district proportion FRPL and average district SES were positively associated with GT availability (.09 and .03). Finally, Models 3 and 4 also show strong relationships between average achievement and GT availability with both being positively associated (.07 and .08 in Model 4). As both average school and district achievement increase by 1 standard deviation, the probability of a school providing GT services goes up by 7 or 8 percentage points.
The Effect of State Gifted Education Policies on Availability of Gifted Services
Research question 2 sought to understand what effect common state policies for GT had on GT service availability in schools with 10 or more students who were ELs or SwDs. Model 4 in Tables 3 and 4 added the five state policy codes to Model 3. These include the effect of state mandates, state audits of district compliance, plan requirements, plan approval requirements, and whether the state was classified as housing GT under special or exceptional education. For both EL (Table 3) and SwD (Table 4) samples, state mandates are positively associated with service availability. For the EL analytic sample, compared to the average school in states without any GT regulation, having a mandate and audit are associated with 24 and 23 percentage-point increases in the probability of a school providing GT services, respectively. Estimates for the SwD sample are similar in magnitude (.27 and .28).
Likewise, the requirement of districts to have and maintain formal GT plans was a positive predictor of a school making GT services available in both samples (.10 for EL and .08 for SwD). Somewhat surprisingly, requiring districts to get their plans reviewed and/or approved by the state was a negative (if weak) predictor of service availability (−.05 for EL and −.03 for SwD). And finally, operating GT under special or exceptional education appeared to have little effect. The estimate was small but positive for service availability in the SwD sample and nonsignificant in the EL sample. Despite this final finding, greater levels of state mandate and enforcement in the form of mandate plus plan requirement and audits appeared to greatly increase the chance a school made GT services available.
Predictors of Higher Gifted Representation Indices for Students With Disabilities and English Learners
To address research question 3, we replaced availability of GT with RIs for ELs and SwDs as the dependent variable and re-ran all four models. In this way, we directly tested which variables predicted more-proportional enrollment (i.e., GT RI closer to 1.0) of EL students and SwDs. Tables 5 and 6 present all four models for EL and SwD RIs, respectively.
Predicted Probabilities of EL RI for 10+ EL Schools

Standard errors in parentheses. EL = English learner; Rep index = representation index calculated using Equation (1); FRPL = free or reduced-price lunch; SPED = special education; SES = socioeconomic status; BA = bachelor’s degree; GT = gifted and talented. School enrollment and GT enrollment are the authors’ calculations using Civil Rights Data Collection 2017–2018 data; other school and district characteristics are from the Stanford Education Data Archive. State policy dummies are defined on pp. 12–13.
p < 0.01, **p < 0.05, *p < 0.1
Predicted Probabilities of SwD RI for 10+ SwD Schools

Standard errors in parentheses. SWD = students with disabilities and includes those served under IDEA and Section 504; GT = gifted and talented; Rep index = representation index calculated using Equation (1); FRPL = free or reduced-price lunch; EL = English learner; SPED = special education; SES = socioeconomic status; BA = bachelor’s degree. School enrollment and GT enrollment are the authors’ calculations using Civil Rights Data Collection 2017–2018 data; other school and district characteristics are from the Stanford Education Data Archive. State policy dummies are defined on pp. 12–13.
p < 0.01, **p < 0.05, *p < 0.1.
The intercepts for Model 1 indicate that the average RI for schools in the samples was .16 for ELs (Table 5) and .13 for SwDs (Table 6). This means that in the average school’s GT population, both groups are demographically represented at far lower rates than they are in the larger student population. Students who were EL were only 16% as represented in GT as they were in the overall student population. Similarly, SwDs were only 13% as represented. Looking at Model 4, other relationships of note include whether the school was a charter (−.05 for EL and −.07 for SwD), state GT plan approval (−.10 for EL and −.06 for SwD), state audits of GT (.10 for EL and .05 for SwD), and whether the state operated GT under special or exceptional education (.11 for EL .27 for SwD). This final point is worth emphasizing. Compared to states that did not operate GT as part of special or exceptional education, those that did had larger RIs (controlling for the Model 4 predictors). Schools serving 10 or more SwDs showed a 27 percentage-point RI increase if they were in such a state.
Beyond these predictors, others were significant only for one group or the other. For example, for the 10 or more EL schools, a 10 percentage-point increase in district proportion EL was associated with a 4 percentage-point drop in average school EL RI. Similarly, a 10 percentage-point increase in school proportion SwD was associated with a 4 percentage-point drop in average school SwD RI. Larger numbers of the underrepresented group appeared to be negatively correlated with RI for that group. Similarly, for both groups, SES, the proportion of adults with a college degree, FRPL, and achievement variable estimates were small or nonsignificant predictors.
In addition to estimating associations between predictors and higher GT RIs, we also examined those schools that showed the largest GT RIs for ELs and SwDs. To this end, we selected a subsample of schools that represented the largest 5% of RIs (meaning the highest levels of GT representation by ELs and SwDs) across their respective analytic samples. For EL RIs, this included 1,452 schools, and for SwD, this included 2,152 schools. Tables 7 and 8 present descriptive statistics for these “top 5%” schools compared to the “bottom 95%” and the full analytic samples.
Descriptive Statistics for Top 5% of Schools With 10+ EL and GT Compared to Bottom 95% and Full Sample

Note. EL = English learner; GT = gifted and talented; SD = standard deviation; Rep index = representation index calculated using Equation (1); FRPL = free or reduced-price lunch; SPED = special education; SES = socioeconomic status; BA = bachelor’s degree. School enrollment and GT enrollment are the authors’ calculations using Civil Rights Data Collection 2017–2018 data; other school and district characteristics are from the Stanford Education Data Archive. State policy dummies are defined on pp. 12–13.
Descriptive Statistics for Top 5% of Schools With 10+ SWD and GT Compared to Bottom 95% and Full Sample

Note. SwD = students with disabilities and includes those served under IDEA and Section 504; GT = gifted and talented; SD = standard deviation; Rep index = representation index calculated using Equation (1); FRPL = free or reduced-price lunch; EL = English learner; SPED = special education; SES = socioeconomic status; BA = bachelor’s degree. School enrollment and GT enrollment are the authors’ calculations using Civil Rights Data Collection 2017–2018 data; other school and district characteristics are from the Stanford Education Data Archive. State policy dummies are defined on pp. 12–13.
The first thing to note about Tables 7 and 8 is the median RI. The median RI for the total sample of 10 or more EL schools (n = 29,051) was zero compared to 1.54 for the top 5% of RIs. This can be understood as within the top 5% of schools as defined by EL student RI, EL students are 154% as represented in GT as they are in their schools’ overall student populations. For SwD schools in the top 5%, the median RI was 1.31 compared to zero for the total sample of 10 or more SwD schools (n = 43,094). This can be understood as within the top 5% of schools as defined by SwD student RI, SwDs are 131% as represented in GT as they are in their schools’ overall student populations. But these top 5% schools differed in other ways.
Top 5% EL Schools
The schools with the largest GT RI values for ELs were smaller (enrollment median of 512) than the bottom 95% (580) or the average of the entire analytic sample (575). They also tended to have a similar proportion of EL students (approximately 10%). However, the top 5% schools were lower achieving (median achievement = −.21) than their bottom 95% peers (−.03) and had a larger proportion of FRPL-eligible students (.74 vs. .58). They also tended to be in districts that were lower achieving (−.16 vs. −.02) and had lower average SES (−.02 vs. .30). In summary, despite higher GT RI for ELs (median of 1.54 vs. 0), the top 5% schools were relatively lower achieving and had higher enrollments of students from low-income families.
There is one standout finding regarding the top 5% of schools for EL RI (see Table A2). Of the 1,452 schools, 407 were in Texas (median RI of 1.39). One might reasonably assume that this is due to Texas having a large percentage of EL students overall (median school proportion EL for Texas schools enrolling at least 10 ELs = .24), but California schools with at least 10 EL students had a similar median proportion EL (.26), as did Alaska (.29), and they only had 82 and 4 schools in the top 5%, respectively. New Mexico also had a similar proportion of EL students (.20) as well as a close geographic proximity to Texas but only had 23 schools in the top 5% with a median RI of 1.72. Table A1 shows that Texas mandated GT in its districts and that districts created and maintained GT plans and audited compliance with state rules for GT. California had none of these requirements, and while New Mexico mandated GT and required plans, it did not conduct proactive oversight in the form of audits. For these reasons, it is likely that the combination of a high average school proportion of ELs and a high level of GT policy explains the high number of top 5% schools for EL students in Texas.
Top 5% SwD Schools
The schools with the largest GT RI values for SwDs were slightly smaller than the bottom 95% of schools (enrollment median of 428 vs. 514), but they had the same proportion of SwDs (.15). They were also slightly lower achieving than the bottom 95% (−.04 vs. .01), with GT proportions only one-third the size (.02 vs. .06). On SES, FRPL, and parental education variables, there were no obvious differences. Table A2 on our OSF page reports the number of top 5% schools present in each state. California has the largest number of top 5% SwD schools at 257 (median RI of 1.24). This is perhaps unsurprising given California’s size. But second with 216 schools is Kansas (median RI of 1.0), a state one-seventh the size of California in terms of the number of schools, but one that includes GT under special education. Of the seven states coded as having GT under special education, 4 had more than 100 schools in the top 5%: Kansas, Pennsylvania (155 schools at a median RI of 1.93), Tennessee (119 schools with a median RI of 5.5), and West Virginia (125 schools with a median RI of 5.1). This might lead one to the conclusion that states that treat GT as a form of exceptionality results in better RIs for SwDs, but there were exceptions. Louisiana and New Mexico had only 6 and 48 schools in the top 5% despite also being coded as GT under special education states.
In the end, there were clearer patterns for top 5% EL schools than for top 5% SwD schools. Top 5% GT RI schools for ELs enrolled fewer students, were lower achieving, and were in districts with lower average achievement, higher rates of FRPL eligibility, and lower average SES than their bottom 95% peers. Conversely, the top 5% GT RI schools for SwDs also had smaller enrollments, were slightly lower achieving, and served a GT population only one-third as large as their bottom 95% peers. Given that some disability designations require students to score lower on measures of academic achievement, perhaps it is to be expected that there are fewer clear patterns. It is also worth emphasizing that because these top 5% schools still only enrolled 9% EL students or 15% SwD, it only required identifying three or two students, respectively, to place them in the top 5% of RI. Because of this, what got a school into the top 5% group could well have been simple demographic differences as opposed to especially successful or innovative identification methods. Several of the top 5% of schools might only be in the top 5% because they happened to identify one additional student. It may also be due, in part, to data privacy practices used in the CRDC, which we discuss at greater length in the limitations section.
Discussion
Past research has reported that students who are ELs and SwDs had the lowest GT RIs (Peters et al., 2019). Our research confirms that these students are identified at rates of one-eighth to one-sixth, respectively, of their representation in the average school’s student population. This does not appear to be an issue of service availability since school proportion EL or SwD was not a meaningful predictor of service availability (see Tables 3 and 4). Despite GT availability not being related to school EL or SwD demographics, the average GT RI for both groups was low.
State Policy Findings
Some of the clearest takeaways from the present study are the positive correlations between common state policies for GT and 1) GT service availability and 2) RIs for ELs and SwDs. Schools with 10 or more ELs are 24 percentage points more likely to offer GT services if they are in a state with a mandate, 10 percentage points more likely if they are required to have formal plans, and 23 percentage points more likely if their home state audits compliance. Similarly, schools with 10 or more SwDs are 27 percentage points more likely to make GT services available if they are in a state with a mandate, 8 percentage points more likely if they are required to have formal plans, and 28 percentage points more likely if their home state audits compliance. Although the audits were not significant for EL RI, they did predict 11 percentage points higher RI for SwDs. Conceptually, this seems to support prior research by Baker and Friedman-Nimz (2004) and McBee et al. (2012), who found that state-level policies, even when not directly targeting improved RI, can still have a positive effect on equity.
The only state policy that was a negative predictor was the requirement that district GT plans be approved by the state. This policy requirement was negatively associated with GT availability and RI for both the EL and SwD samples of schools. It is possible that in the 14 states that required such approval, RIs were already higher than states without this policy. As a result, there was less room for improvement. Relatedly, it is possible those states’ average RIs were not higher on their own, but because those 14 also had the other three policies of mandates, plan requirements, and audits, there could have been little room for further increase in RI. As a result, a better way to think of this finding is that for states that already have mandates and require districts to have and maintain GT plans and conduct audits, adding the policy of formally reviewing and approving those GT plans does not correlate with further improvements to GT availability or RI for ELs or SwDs.
Characteristics of the Schools With the Highest Representation Indices
We originally assumed that schools with the largest RIs for ELs would be those with especially large populations of ELs, often those located near urban centers or with large populations of students of color. This turned out to be wrong. On average, the schools with the largest GT RIs for ELs were smaller than the other 95% (512 vs. 580 students), had lower average SES (−.02 vs. .3), had more students eligible for FRPL (74% vs. 58%), were located in lower-achieving districts (−.16 vs. −.02), and were lower average achieving themselves (−.21 vs. −.03 see Table 7). How these differences relate to higher RIs is less clear. Perhaps, as Gubbins et al. (2020) found, these schools’ smaller, lower-income, and lower-achieving populations required them to apply less-traditional identification methods, including the implementation of identification procedures better targeted at their student populations. It is also possible that because these schools tend to be smaller, one or two additional ELs identified as GT moved their RI from the national average of .26 to 2.27, which is the average for schools in the top 5% of RIs. When a group is small, even one additional student being identified as GT can result in a large swing to RI. It is impossible to know without further study, and qualitative inquiry may be especially informative.
There were fewer consistent differences between the 5% of schools with the largest GT RIs for SwDs and the other 95% of schools. Like the top 5% RI schools for ELs, they were smaller in size (428 vs. 514) but similar to the other 95% of schools in achievement (−.04 vs. .01) and proportion of students eligible for FRPL (.57 vs. .54) and SES (.29 vs. .28). They also had smaller (2% vs. 6% of their student populations), if more demographically proportional (median RI of 2.26 vs. .13), GT populations. This might explain their large RIs. Consider an average school within the top 5% of SwD RIs. Such a school enrolled 61 SwDs out of 428 students total (14%). It also identified 2% of its students as GT (about 9 students total). If two of these 9 GT students are students with disabilities, that would result in an RI of 1.57 (2/9)/(61/428). One fewer SwD identified as GT would drop that school’s RI to .79 and move it out of the top 5%. This reinforces the point made earlier regarding ELs—in smaller schools with smaller GT populations, identifying even one more student makes a big difference in terms of RI. What makes this school different from one the next town over could simply be where one family decided to live and not some especially effective or equitable identification process. These findings suggest there is much more to investigate about schools that found success in more equitably identifying SwDs for GT.
Limitations
This study leveraged school-level CRDC and SEDA data, which present a few limitations. First, the findings may not generalize to schools that were excluded due to missing data or merge issues discussed earlier. A further limitation is the focus on schools with 10 or more students who were ELs or SwDs. This leaves out many schools with smaller numbers of ELs and SwDs, including those that have had success decreasing the number of their students identified as SwD through extensive response to intervention work or those with many former English learners who have transitioned out of such services. It is possible the relationships observed here might not apply to excluded schools.
Similarly, our study did not investigate service availability or GT RIs for ELs who were also SwDs compared to those who were ELs but not SwDs. This kind of intersectionality is important to consider. However, since CRDC data included separate counts for ELs and SwDs in each school, we were unable to examine representation in GT for ELs with disabilities. We urge future research to examine relationships between GT service availability and representation for multilingual students with disabilities and students of color with disabilities.
An important caveat to and limitation of our analyses, especially of the top 5% schools, deals with the perturbation applied to the CRDC data and is explained in the methods section. Past CRDC technical manuals (e.g., 2011–2012) stated that counts less than 10 had an approximately 5% chance of being perturbed or having one case added or subtracted from a true count value at random. This would include, for example, the counts of each school’s GT enrollment. In the technical manual for the CRDC data used in our study, no specific rate was referenced aside from “low-frequency” perturbation. This makes it likely that approximately 5% of the school GT counts and GT by EL and SwD counts in our samples do not represent the true values reported by the districts (true zeros were maintained). However, while this perturbation does have the potential to place schools in our top 5% lists even though they did not actually belong there (e.g., by having one case added at random, the schools RI reached the 95th percentile), this relatively low rate of error still left us comfortable conducting the exploratory analysis of the top 5% schools. Perturbation should have no effect on the coefficients related to RQs 1–3—only on the identification of the top 5% of schools.
Finally, our analyses were descriptive and did not speak to causal relations between state policy and whether schools made GT services available to their students. Future research might leverage quasi-experimental methods to provide credibly causal evidence. For example, as states implement or remove state policies, the downstream effects should be analyzed to determine actual effect (e.g., Warne & Price, 2016).
Footnotes
Declaration of Conflicting Interests
The author(s) declared no potential conflicts of interest with respect to the research, authorship, and/or publication of this article.
Funding
The author(s) received no financial support for the research, authorship, and/or publication of this article.
Notes
Authors
SCOTT J. PETERS is the director of research consulting partnerships at NWEA. His research work focuses on educational assessment, research design, gifted and talented student identification, equity within advanced educational programs and services, and educational policy.
ANGELA JOHNSON is a senior researcher at American Institutes for Research. Her research interests include multilingual learners, students with disabilities, and achievement growth.