
Abstract
Principal preparation programs play an important role in developing future school leaders’ skills and practices. Internships, or structured opportunities for future leaders to engage in the work of school leadership in hands-on, authentic ways, are among the most essential components of principal preparation. Using longitudinal data from 12 programs in North Carolina, this study extends research on internships by examining the pathways of interns from prior- to post-internship employment. We find that internships are highly localized around interns’ prior- and post-employment schools but not their preparation program, with wide variability in placements between programs. Interns’ demographics do not play a large role in shaping the geography of internship placements. However, we find that preparation program type is strongly related to the geography of internship placements, suggesting that differences in program structure may shape internship placements. We conclude by highlighting the limitations and discussing implications for future research.
Keywords
Decades of research supports the finding that principals play a key role in fostering productive and equitable school environments associated with positive student growth and achievement (Leithwood et al., 2004; Robinson et al., 2008). Effective school principals leverage human relations, instructional, and organizational management skills to support teachers’ instruction, organize collaboration and professional learning communities, build productive school climates, and strategically manage school personnel (Grissom et al., 2021). Importantly, the skills and practices needed to become an effective school principal are often first developed in principal preparation programs (PPPs; Darling-Hammond et al., 2022).
Research on PPPs finds internships—structured opportunities where principal candidates learn the work of school leadership in hands-on, authentic ways—are widely considered the most important component of candidates’ leadership development (Barnett et al., 2009; Reyes-Guerra & Barnett, 2016). High-quality internships are positively associated with leadership knowledge (Hafner et al., 2012), career intentions (Orr, 2011), and working in leadership roles (Braun et al., 2013; Pannell & Sergi-McBrayer, 2020). Despite its importance, internship quality varies widely between PPPs (Anderson & Reynolds, 2015). Reasons for this variation can include differences in the structural components of the internship, including the number of hours interns are required to complete; internship placement and the location of their internship school(s); interns’ role and position; the selection and preparation of interns’ principal mentors and coaches; and the types of leadership activities interns complete (Anderson & Reynolds, 2015; Clayton & Myran, 2013; Drake, 2022; Drake et al., 2023a; Fusarelli et al., 2019; Reyes-Guerra & Barnett, 2016; Thessin et al., 2020).
In this study, we focus on one important and understudied component of principal internships—the geography of internship placements. In a previous study, we found schools hosting an intern have lower values on leadership and overall environment, have higher teacher attrition rates, have lower test proficiency rates, and are no more effective, based on student achievement growth, than non-internship schools (Bastian & Drake, 2023). In this study, we extend this work by examining the pathways of interns from prior- to post-internship employment. We pay particular attention to the geography of internships—that is, where they occur in relation to the PPP and employment—and how geography may vary in ways that influence intern development. We ask:
What is the location of the principal internship site relative to the location of the PPP and the location of prior and subsequent employment for the intern?
How does the geography of the principal internship vary by characteristics of the intern and their program?
To answer these questions, we present a combination of descriptive and regression-adjusted statistics using internship placement data from 12 PPPs in North Carolina from 2015–16 through 2018–19. We find internship sites are geographically spread, with many occurring relatively far from the location of the PPP. More than half of all interns conducted their internship in the same school in which they worked immediately prior to their internship; more than one-third of principal interns stayed in the same school across prior employment, internship, and post-employment experiences. Internship sites are often near intern employment. When examining variation across interns, we found preparation program type was strongly related to the geography of internship placements. Importantly, these results highlight how differences in program structure may shape internship placements.
Literature Review
In recognition of the important role principals play in influencing student and school outcomes, school districts are focusing on developing comprehensive principal pipelines. This work centers on a range of talent management activities that fall within a school district’s scope of responsibility when it comes to school leaders (Gates et al., 2019). An evaluation of six urban school districts engaged in developing comprehensive principal pipelines found schools receiving a new principal outperformed comparison schools by 6.2 percentile points in reading and 2.9 percentile points in math (Gates et al., 2019). A key feature of this work included improving preservice preparation through stronger partnerships with university-based PPPs (Mendels, 2017).
In the mid-2000s, criticism of university-based PPPs included disconnected curricula, low admission standards, insufficient resources and attention to faculty mentorship, watered-down programs with inadequate exposure to clinical practice, and low standards for completion (Hess & Kelly, 2007; Levine, 2005). Since that time, some university-based PPPs have engaged district partners in comprehensive program redesign to improve the relevance and quality of preservice preparation. For example, descriptive evidence from surveys of U.S.-based institutions found programs have worked to align their curriculum and assessment designs to national standards, develop and implement a variety of assessment practices for formative and summative purposes, and redesign classroom assignments to better align with field-based experiences (e.g., Anderson et al., 2018; Cosner, 2019; Wang et al., 2018; Winn et al., 2016). Yet evaluating the effectiveness of these efforts is difficult. Among these challenges include disentangling selection into the PPP from graduate/program outcomes, the time lag between completing a program and becoming a school leader, and the indirect effect principals have on student achievement (Clifford et al., 2016; Grissom & Loeb, 2011).
Regarding the impact of PPPs, two studies are important to review. First, Larsen and colleagues (2016) evaluated five PPPs from the Alliance to Reform Education Leadership (AREL) program, a network of 28 innovative PPPs working together to learn from and with each other. Using information from both a comparative interrupted time series design (CITS) and fixed-effects regression, they found little consistent evidence program graduates were more (or less) effective than graduates from other programs at raising student achievement. Importantly, they also found significant variation in the principal effectiveness of both AREL program graduates and graduates from comparison programs, with some graduates performing well above the average and others well below. Second, Grissom et al. (2019) evaluated 10 years of PPP graduates’ performance over their first 3 years as principals in Tennessee. Like Larsen et al. (2016), their regression-adjusted models estimated wide variation in program graduates’ performance, with no consistent evidence supporting the effectiveness of specific programs. Rather, graduate performance depended on the outcome that was being considered, which included principal evaluation scores, teachers’ perceptions of leadership effectiveness from two statewide surveys, and administrative data on principal turnover.
Taken together, these studies highlight the wide variation in PPP graduate performance, even when comparing outcomes of graduates within a PPP. Part of this variation may be attributable to the large expansion and wide variation in PPPs. For example, Perrone and Tucker (2019) found that the number of institutions granting degrees in educational administration has increased by 70% since the start of the century. Additionally, these programs vary by the type of degree offered (i.e., master’s, certification, education specialist) and the mode of delivery (face-to-face, online, hybrid; Anderson et al., 2022). Even prior to the COVID-19 pandemic, fully online programs grew substantially in the United States, with an estimated 43% of PPPs offering a fully online pathway to principal licensure (Perrone et al., 2020). To our knowledge, no study has yet examined the nature of principal internships in online programs, though the assumption is the internship is the only component that is conducted offline (Anderson et al., 2022).
Along with variation by PPP in the type of degree offer-ed and the mode of delivery, the structure of candidates’ internships varies widely as well. A recent systematic review on PPP internships—including more than 90 studies published since 2010—found that most programs allowed interns to engage in a “traditional internship model,” where principal candidates remained in their current job while completing internship hours (Rangel et al., 2023). Less common were full-time internships or residencies where principal candidates left their prior positions to work as administrators. The range in internship hours also varied greatly, from less than 50 to over 750 hours, across a single semester to three or more semesters. Other work has highlighted differences in the mentorship interns receive (e.g., Browne-Ferrigno & Muth, 2004; Thessin et al., 2020) and the activities they engage in (Drake, 2022; Drake et al., 2023a, 2023b; Reyes-Guerra & Barnett, 2016).
An underexamined component of the principal internship is the placement process and how it might contribute to variation in candidates’ leadership growth and development. The field has long acknowledged the importance of identifying quality mentors and field sites (Pounder & Crow, 2005), including providing opportunities for interns to be exposed to a variety of contexts through school rotations (Havard et al., 2010). For example, the standards that govern principal preparation—the National Educational Leadership Preparation (NELP) Program Recognition Standards (Building level)—recommend that principal candidates receive “a variety of coherent, authentic field and/or clinical internship experiences within multiple school environments that afford opportunities to interact with stakeholders, synthesize and apply the content knowledge, and develop and refine the professional skills” (National Policy Board for Educational Administration [NPBEA], 2018, p. 30).
In practice, placement decisions are likely influenced by whether PPPs offer full- or part-time internships. Full-time internships (i.e., full-time residencies) usually require interns to move from their current position to a new school setting to work during an entire school year, a semester, or the summer (e.g., Fusarelli et al., 2019), with some programs requiring rotation among multiple school sites (Geer et al., 2014; Morten & Lawler, 2016). Other PPPs, however, allow interns to conduct their internship on a part-time basis, working in their own school to complete activities during their free time, on the weekends, or in the summer (e.g., Orr, 2011). Internship placement may also be shaped by university-district partnerships or other “grow-your-own” leadership programs, where districts work closely with universities or develop their own leadership preparation programming to select and place candidates in their internships (Brooks et al., 2010; Versland, 2013). Importantly, a national survey of university-based PPPs in the United States suggests that part-time internships are the norm, as only 18% reported offering full-time residencies, compared with 85% who offered part-time internships (Dexter et al., 2022).
Despite this understanding of program structure and internship requirements, research on the internship placement process is notably thin. In prior work, we found that interns in North Carolina were placed in school environments with lower teacher working conditions (i.e., leadership and overall environment), higher teacher turnover rates, lower student proficiency rates, and similar levels of student growth as comparison schools not hosting an intern (Bastian & Drake, 2023). Relative to principals that did not host an intern, we also found that interns were more likely to be placed with principals of color, principals with more experience, principals with slightly higher prior-year evaluation ratings, and principals who led a school in the prior year that exceeded growth. Importantly, we found that these differences in placement site and mentor principal characteristics were largely driven by differences between White interns and interns of color, even when comparing within PPPs.
An important question growing out of these results is why we might find systematic variation in the placement process, even when looking within PPPs. To explore this question, we examine the geography of the internship, specifically exploring the pre- and post-internship school pathways and how these vary by intern and PPP. To further frame this study, we turn to social cognitive theory and research on the principal labor market.
Conceptual Framework
Interns exercise varying levels of personal agency to determine their internship placement. At one extreme, interns may be free to choose their internship school(s); at the other, they are assigned a school with no input into the decision. To understand what factors influence interns’ agency, we turn to social cognitive career theory (SCCT). In Figure 1, we adapted a model of SCCT that outlines the personal, contextual, and experiential factors affecting career-related choice behavior (Lent et al., 1994). In this model, the basic building blocks of career development and the key mechanisms by which individuals begin to exercise personal agency are self-efficacy and outcome expectations, which in turn influence individuals’ interests and personal goals (Lent et al., 2002). Bandura (1999) defines self-efficacy as a person’s beliefs that “they [have the power to] produce desired effects by their actions” (p. 28) and theorizes that it is the foundation of human agency. Along with self-efficacy, individuals’ personal agency is shaped by their outcome expectations or beliefs about the consequences of performing particular behaviors (Lent et al., 2002). Both self-efficacy and outcome expectations, in turn, influence individuals’ career interests, goals, and choices.

Model of personal, contextual, and experiential factors affecting internship placement.
Importantly, research on career development suggests that self-efficacy, outcome expectations, and goals are shaped by several learning experiences, including the experience of success or personal attainment, vicarious learning, social persuasion, and physiological and affective states (Bandura, 1997). These learning experiences are shaped by person-level inputs, such as predispositions, age, gender, and race/ethnicity, as well as background contextual affordances, including prior work opportunities (Lent et al., 1994). Person-level inputs are also important in influencing more proximal contextual influences, such as job availability or sociostructural barriers (Lent et al., 2002).
The model suggests that personal and contextual factors will shape individuals’ agency and career decisions. In the context of interns’ placement decisions, we focus on a few key elements found in the literature. First, the location of the internship school relative to the interns’ prior school and PPP may play an important role in their placement. As reviewed previously, many part-time internships are conducted at the schools in which the interns work. For those interns who are placed in a new school, geographic proximity between the intern and internship school may be one of the strongest predictors of placement (Orr, 2011; Reyes-Guerra & Barnett, 2016). Research on student teaching has also found that the location of the educator preparation program is predictive of where student teachers are assigned (Krieg et al., 2020). Additionally, research on adults’ decisions to attend community college is heavily influenced by distance (Jepsen & Montgomery, 2009).
Second, interns’ personal backgrounds and prior work and educational experiences may shape internship placements. Research on the pathways of educators into and through their career suggest systematically different experiences based on personal characteristics (e.g., gender, race/ethnicity, age), teaching experience, training, and certification (White et al., 2013) For instance, teachers of color are more likely to be found teaching in schools with higher teacher turnover, lower working conditions, and higher proportions of students experiencing poverty (e.g., Carver-Thomas & Darling-Hammond, 2017). Gender may also play a significant role, as the majority of the teaching workforce is female, with a growing gap in college graduation favoring females over males (DiPrete & Buchmann, 2013). In short, these personal inputs have been found to have a direct effect on the learning experiences of interns (e.g., the types of school environments in which they have worked), which in turn may shape their choice of where they want to conduct their internship.
Finally, the PPP interns who choose to attend will have a strong influence on placement decisions. For example, some PPPs allow interns to conduct their internship in their current school and in their current position, while others require them to move schools and place them in formal leadership roles as administrative interns. Furthermore, some PPPs cultivate strong relationships with their district partners, working closely together to evaluate the strengths, experiences, and leadership needs of interns and place them accordingly (Browne-Ferrigno & Sanzo, 2011; Wang et al., 2018). The district context may also play a role in placement decisions; districts with acute staffing needs may need interns to stay in their current role or transfer to schools with higher teacher and/or leader turnover.
Study Context: Principal Internships in North Carolina
North Carolina has 100 counties with 115 school districts. Of the 100 counties, 46 counties are urban and 54 counties are rural. More than one-third of all school-aged children live in rural counties, and county size varies from 172 to 949 square miles, with a mean of 486 square miles. The student enrollment ranges from about 1,200 to 160,000 students per district. North Carolina state law requires that all candidates enrolled in a PPP complete a yearlong internship (NC Gen. Stat. §115C-284). However, “yearlong” is not defined in the law or by the North Carolina State Board of Education. As a result, PPPs vary widely in their definition of yearlong, including the number of internship hours candidates are required to complete. For example, PPPs offering a full-time Master of School Administration (MSA) degree require between 200 and 1,500 hours, whereas PPPs offering an add-on principal licensure require between 200 and 475 hours. PPPs can choose whether these internships are conducted in the same school where the principal candidate works or whether the candidate interns at a new school site. During the time of this study, North Carolina also had two competitive scholarship loan-forgiveness programs, which strongly recommend that interns conduct a full-time, yearlong internship in a different school. This wide variation in the implementation of the internship helps motivate our examination of the geography of the principal internship across the state, as well as our analyses on how variation in placements may be related to characteristics of interns and programs.
Methodology
Data Sources
We use three sources of data to examine the geography of principal internships. First, we have principal preparation and internship placement data for 12 public universities in North Carolina. 1 These data cover internships in the 2015–16 through 2018–19 academic years and include fields for intern demographics, program type, the year and term of the internship, and the district and school in which the internship occurred. In these programs, principal candidates had a single primary placement site for their internship. Programs often supplemented internship experiences with site visits and other practicum-based experiences in schools. These activities are unobserved in our study. In total, there are 1,131 principal interns in the data.
Second, we have employment data from the North Carolina Department of Public Instruction (NCDPI) for the 2013–14 through 2020–21 academic years. The data identify individuals working in North Carolina public schools and allow us to know the districts and schools in which interns work before and after their principal internship. 2 In our analyses, we focus on the school where the intern worked immediately prior to and after their internship. For example, if an individual served as an intern in 2017–18, we identify the school in which they were employed in the 2016–17 year (prior employment) and the 2018–19 year (post-employment). If an individual was employed in more than one school during the same academic year, we use the school where their full-time equivalency status was the highest. In cases where there are no employment records for the year immediately prior to or subsequent to the internship, we examine employment records from two years before or after the internship. In total, we have prior-employment data for 1,081 interns (95.6 percent) and post-employment data for 1,051 interns (92.9 percent). There are 1,025 interns (90.6 percent) who have employment data from both before and after their internship.
Finally, we have postal addresses for each K–12 public school and university in North Carolina. With these data, we generate geo-location coordinates—latitude and longitude—for the university at which the PPP is housed, the internship school, and the prior and post-employment schools. Using Google Maps API, we calculated drive times (in minutes for average traffic during a workday) and distance (in miles) between the PPP and internship site, between the prior-employment school and internship site, and between the internship site and post-employment school. For the PPP, we decided to standardize our calculations by using the drive time and distance from the main campus building for the college/school of education, though we recognize a few programs may have satellite campuses that may host their school leadership programs.
Measures of Internship Geography
We link principal internship, employment, and geolocation data to assess the geography of principal internships. We are particularly interested in the geographic relationships between the following locations: the PPP and the internship site, the prior-employment school and the internship site, and the internship site and the post-employment school.
For the geographic relationship between the PPP and the internship site, we create dichotomous indicators for whether the internship site is in the same county as the PPP, in a county contiguous to the PPP, or in a county that is farther away (neither the same nor contiguous). 3 Additionally, we examine the average driving time (in minutes) between the PPP and the internship site and measures of the drive time distribution at the 25th, 50th, and 75th percentiles. Examining the drive time distribution is particularly important given the potential skew—toward very small or large distances—in the data.
For the geographic relationship between the prior employment school and the internship site, we create dichotomous indicators for whether the internship site is the same school in which the intern previously worked, in a different school within the same school district, or in a different school district. Furthermore, we examine the average driving time (in minutes) between the prior-employment school and the internship site and measures of the drive time distribution at the 25th, 50th, and 75th percentiles. Similarly, for the geographic relationship between the internship site and the post-employment school, we specify dichotomous indicators for whether the internship site was in the same school in which the intern subsequently worked, in a different school within the same school district, or in a different school district. We also assess the average driving time (in minutes) between the internship site and the post-employment school and measures of the drive time distribution at the 25th, 50th, and 75th percentiles.
While these measures—PPP to internship site and internship site to employment schools—capture the geographic relationship between two locations, they do not follow interns longitudinally to track their trajectories from prior employment through post-employment. Therefore, we create dichotomous indicators to classify the 1,025 interns with both prior- and post-employment data into one of five groups: (1) those in the same school for prior employment, internship, and post-employment; (2) those in the same school for prior employment and internship only; (3) those in the same school for internship and post-employment only; (4) those in the same school for prior and post-employment only; and (5) those in different schools for prior employment, internship site, and post-employment.
Characteristics of Interns and Preparation Programs
With data from PPPs, we assess how the geography of principal internships varies by the characteristics of interns and their programs. Our data on interns include gender, race/ethnicity, and age at the time of internship. Table 1 shows that nearly 72 percent of interns are female, 61.5 percent are White, 32.5 percent are Black, and the average age at internship is 37.2. The youngest quartile of interns is 30 or younger; the oldest quartile of interns is 43 or older.
Characteristics of Principal Interns and Preparation Programs

Note: This table displays the characteristics of principal interns and of their preparation programs for the 1,131 interns in our analytical sample.
At the program level, we have data on the PPP interns who attend and their program type. Table 1 indicates that enrollment varies across institutions, with the smallest PPP accounting for 2.4 percent (27 interns) of our sample and the largest PPP accounting for more than 16 percent (184 interns) of our sample. Five of these PPPs are minority-serving institutions, and their enrollment of principal candidates of color is much higher—71 versus 32 percent—than the remaining seven institutions.
There are three types of programs in these data: (1) competitive scholarship loan, (2) traditional Master in School Administration (MSA), and (3) licensure only (add-on licensure). Differences in program structure and requirements may have significant implications for the geography of the principal internship. In a competitive scholarship loan program, enrollees have their tuition and fees fully paid and receive a salary and benefits during their full-time, year-long internship. Competitive scholarship loan recipients complete program requirements as a cohort—coursework during the first year of the program and full-time internship during the second year—and graduate with an MSA. Those in a traditional MSA program do not receive financial benefits and generally are not cohorted by their PPPs. These candidates take coursework as they are able and often complete internship requirements while also holding another position in schools. Their program culminates in earning an MSA degree. Finally, those in the licensure-only category are enrolled in nondegree terminal principal preparation. These individuals already have a graduate degree and simply need to complete program requirements to earn a principal license. As with the traditional MSA group, these principal candidates take coursework as they are able (rather than being cohorted) and often complete internship requirements while holding another position in schools. Among our analytical sample, Table 1 shows that more than 16 percent of interns are in competitive scholarship loan programs, nearly 58 percent are in traditional MSA programs, and 25 percent are in licensure-only programs.
Analysis Plan
To address our first research question, we provide descriptive data on the geographic relationships of the principal internship. In particular, we describe the geographic relationships between the PPP and internship site, between the prior-employment school and the internship site, and between the internship site and the post-employment school. We also track interns longitudinally to provide descriptive data on their trajectories through prior-employment, internship, and post-employment experiences. The measures we assess for these descriptive analyses are fully detailed in the Measures of Internship Geography section. Overall, these descriptive analyses provide a broad understanding of how the locations of the PPP, internship site, and employment relate to each other. Understanding this geography is key to better understanding the placement process for principal internships.
To address our second research question, we estimate a series of linear regression models to assess how the geography of principal internships varies across characteristics of principal candidates and their programs. For these regression analyses, we focus on eight outcome measures: whether the PPP is in the same county as the internship site (1/0), the driving time (in minutes) between the PPP and internship site, whether the prior employment and internship schools are the same (1/0), the driving time (in minutes) between the prior-employment school and internship site, whether the internship and post-employment school are the same (1/0), the driving time (in minutes) between the internship site and post-employment school, whether the intern completed the internship and both employment experiences (prior and post-employment) in the same school (1/0), and whether the intern completed the internship and both employment experiences in different schools (1/0). In these regression models, we include indicators for female interns (relative to male), Black interns and other interns of color (relative to White), and interns in the youngest and oldest age quartiles (relative to the middle quartiles of the intern age distribution). Likewise, we include indicators for those in competitive scholarship loan programs and those in licensure-only programs (relative to those in traditional MSA programs).

Equation 1 presents our linear regression model. Here, InternGeoipt is the dependent variable and represents a series of outcome measures for intern i in program p at time t. We prefer a linear regression model, even with binary outcomes, given the ease of coefficient interpretability and the ability to include fixed effects.
4
Internipt represents intern demographic and program type measures. We estimate a version of Equation 1 that assesses the variation in internship geography across all the interns in our analytic sample. Estimates from these models indicate whether intern demographics and program type predict variation in internship geography across PPPs. Our preferred model includes a PPP fixed effect (
Results
What Is the Location of the Principal Internship Site Relative to the Location of the PPP and the Location of Prior and Subsequent Employment for the Intern?
To address our first research question, we examine descriptive data on the geographic relationships between the PPP and internship site, the prior-employment school and internship site, and the internship site and post-employment school. Table 2 presents these data across our full sample of principal interns.
Descriptive Data on the Geography of the Principal Internship

Note: This table presents data on the geographic relationships between the PPP and internship site, between the prior-employment school and internship site, and between the internship site and post-employment school. Data are for all principal interns in our analytic sample.
The top panel of Table 2 focuses on the geographic relationships between the PPP and internship site. We find that just over 25 percent of principal internship placements are in the same county as the PPP, and approximately 33 percent of internships are in a county contiguous to the PPP. It is most common for internship placements—for 41 percent of interns—to occur in a county farther from the PPP. This point is exemplified by data on the driving time (in minutes) between the PPP and internship site. On average, the driving time between internship sites and the PPP is nearly 64 minutes, with the distribution at the 25th and 75th percentiles ranging from 24 to 78 minutes. Overall, these data highlight that internships are geographically spread, with many internships occurring far from the location of the PPP.
We display geographic relationships between the prior-employment school and internship site in the middle panel of Table 2. Here, the most striking feature of the data is the very close proximity between the prior employment and principal internship locations. We find that approximately 54 percent of internships occur in the prior-employment school, and another 36 percent occur at another school in the same district. Few internship placements—about 11 percent—are outside the district in which the intern was working. Data on the driving time between the prior-employment school and internship site further illustrate this point. On average, there is a 13-minute drive between the prior employment and internship schools, and at the 25th and 50th percentiles of the distribution, the driving time is 0 minutes. Collectively, these data highlight that the internship placement is strongly predicated by the principal interns’ employment location.
The bottom panel of Table 2 focuses on the geography between the internship site and post-employment school. As with prior-employment locations, we find that subsequent employment is near the internship site. After the internship is complete, nearly 50 percent of the interns in our sample remain employed in the internship school, with another 33 percent working in another school in the internship district. The average driving time between the internship site and post-employment school is nearly 18 minutes, with the distribution at the 25th and 75th percentiles ranging from 0 to 24 minutes.
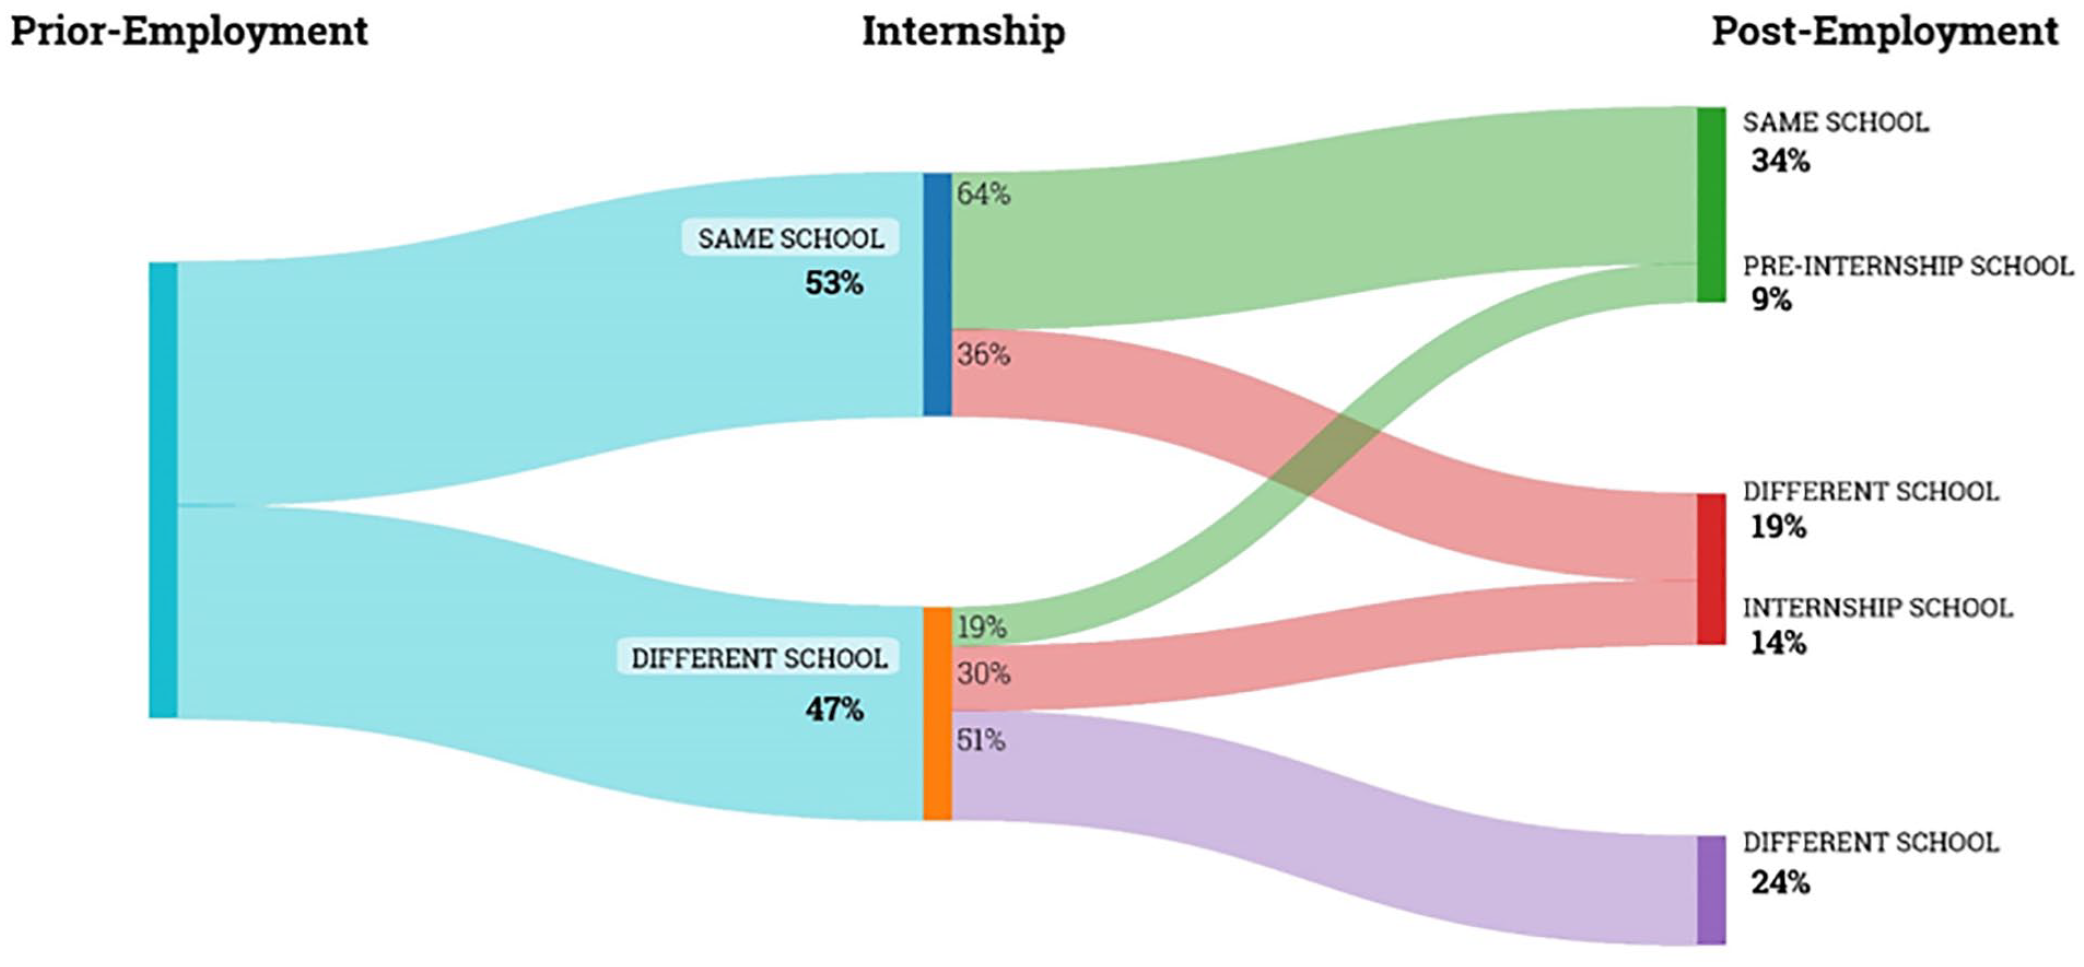
To extend our descriptive analyses, we track the trajectories of interns over time. In particular, Figure 2 presents a Sankey chart for the flow of interns from prior employment, through internships, to post-employment experiences. Rather than the geographic relationships between two locations, these data allow us to assess an intern’s path more broadly. Of the principal interns whose prior employment and internship were in the same school (53 percent of our sample), Figure 2 shows that 64 percent of these interns remain in the same school for their post-employment while 36 percent secure employment in a different school. Of the principal interns whose prior employment and internship were in a different school (47 percent of our sample), 19 percent of these interns return to their prior employment school, 30 percent remain working in their internship school, and 51 percent work in an entirely different school (i.e., neither the prior-employment nor internship school). The far-right portion of Figure 2 identifies the percentage of interns in each of our five trajectory categories. Overall, 34 percent of interns were in the same school for their prior employment, internship, and post-employment. This is the largest category of principal interns in the data. Conversely, 24 percent of interns were in different schools for all three experiences. We find that 19 percent of interns had the same prior employment and internship school with a different post-employment location; 14 percent of interns had the same internship and post-employment school with a different prior-employment location. Lastly, nine percent of interns had the same prior and post-employment schools but interned in a different location.
Geographic trajectories of prior employment, internship, and post-employment.
How Does the Geography of the Principal Internship Vary by Characteristics of the Intern and Their Program?
We estimated a series of linear regression models to assess how the geography of principal internships varies across interns and programs. To display the data, we take two approaches. For our preferred approach, we generate predicted probabilities from our regression models. These predicted probabilities allow us to display the level of outcomes for each group—for example, White and Black interns—and differences in outcomes between groups. Figures 3–6 present predicted probabilities from our preferred PPP fixed-effect models, where we denote statistically significant differences between groups. 5 As an alternate approach, we include coefficients and standard errors from all our regression models—covariate adjustment and PPP fixed effect—in Appendix Tables 1 and 2.

Geographic relationships between the PPP and internship site—predicted probabilities from PPP fixed-effect models.

Geographic relationships between prior employment and the internship site—predicted probabilities from PPP fixed-effect models.

Geographic relationships between the internship site and post-employment—predicted probabilities from PPP fixed effect models.

Geographic relationships across prior employment, internship site, and post-employment—predicted probabilities from PPP fixed-effect models.
Before focusing on findings from our PPP fixed-effect models, we briefly highlight how results differed across our covariate adjustment and PPP fixed-effect analyses. When comparing results across model types, Appendix Tables 1 and 2 show that estimates, especially those for intern demographic measures, are often larger in magnitude in covariate adjustment models. In particular, the covariate adjustment results in Appendix Tables 1 and 2 return meaningful differences in placement geography for Black interns relative to their White peers. Comparing across programs, Black interns are more likely to intern in the same county as their PPP and less likely to either have their prior-employment and internship school be the same or have their internship and post-employment school be the same. Likewise, Black interns are less likely to stay in the same school for all three experiences and more likely to be in different schools for all three experiences (Appendix Table 2). All of these results are smaller in magnitude and no longer statistically significant in PPP fixed-effect models. Overall, this pattern of results across model types suggests that Black candidates sort into certain PPPs and that the geography of internships in those PPPs differs from PPPs with fewer Black candidates.
To further explore variation in placement geography across PPPs, Appendix Table 3 presents descriptive data on the geography of internships for each PPP in our sample. These data show that the geography of principal internships varies substantially across programs. For example, (1) the average driving time (in minutes) between the PPP and internship ranges from 23 minutes (PPP 3) to 215 minutes (PPP 12), and (2) less than 10 percent of internship placements are in the prior-employment school for three PPPs (PPP 3, 6, and 7), while more than 70 percent are in the prior-employment school for four PPPs (PPPs 1, 2, 11, and 12). Appendix Table 3 strongly suggests that PPPs vary in their internship placement practices. This further substantiates our preference for the PPP fixed-effect results in Figures 3–6. 6
Regarding the geographic relationships between the PPP and internship site, Figure 3 indicates that there is little variation across intern or program characteristics. There are no statistically significant differences in geographic relationships between the PPP and internship site across gender, race/ethnicity, or program type measures. We note, however, that differences in the likelihood of having an internship in the same county as the PPP are large in magnitude for other interns of color relative to White peers in their programs. There is only one statistically significant difference in PPP and internship site geography: the driving time between the PPP and internship site is significantly longer for interns in the oldest age quartile (43 or older) relative to their peers in the middle age quartiles (31–42). Combined with the descriptive data in Table 2, these results suggest that many internship placements are reasonably far from the PPP and that variation in these PPP-to-internship measures is generally unrelated to characteristics of interns and programs.
Turning to geographic relationships between the prior-employment school and internship site, Figure 4 shows that there are no significant differences across intern demographics. Regardless of gender, race/ethnicity, or age, internship placements are near prior-employment locations, with more than half of internships occurring in the prior-employment school. There are large differences in the geography of prior-employment and internship sites based on preparation program type. Those in competitive scholarship loan programs are more than 40 percentage points less likely than traditional MSA candidates—17 to 58 percent—to have their internship in their prior-employment school. Furthermore, the driving time between the prior-employment and internship site is significantly longer—approximately 22 versus 12 minutes—for interns in competitive scholarship loan programs. Conversely, we find that interns in licensure-only programs are significantly more likely than traditional MSA peers to have an internship placement in their prior-employment school.
Figure 5 indicates that the geography of internship placements to post-employment schools modestly differs for females. In particular, female candidates are more likely to remain in their internship school and have a shorter driving time between internship and post-employment school. No other differences are statistically significant across race/ethnicity or intern age. Regarding preparation program type, we find that competitive scholarship loan recipients are less likely—31 to 49 percent—than traditional MSA candidates to secure subsequent employment in the internship school, although the result is only significant at the 0.10 level. Once again, interns in licensure-only preparation programs are significantly more likely to remain in the internship school than peers in traditional MSA programs.
Finally, Figure 6 presents predicted probabilities from models that assess whether interns were in the same school or different schools across all their employment and internship experiences. Consistent with the results in Figures 3–5, intern trajectories vary little by gender, race/ethnicity, or age. We find that females are more likely—36 to 30 percent—to remain in the same school before, during, and after their internship, though the result is only significant at the 0.10 level. No other demographic results are statistically significant. However, trajectories vary greatly by preparation program type. Over 55 percent of interns in competitive scholarship loan programs complete all three experiences in different schools; only 10 percent of these interns remain in the same school for all three experiences. Conversely, nearly half of interns in licensure-only programs remain in the same school before, during, and after their internship, and only 12 percent are in different schools for all three experiences. All these values significantly differ from those of interns in traditional MSA programs. Overall, these program-type results highlight how differences in program structure may shape internship placements. 7
Discussion & Conclusion
This paper contributes to the literature on principal internships by examining the geography of internship placements across 12 public universities in North Carolina from 2015–16 through 2018–19. Using SCCT to frame our understanding of how interns’ placement choices may be influenced by a variety of personal and school-level factors, we found three key findings.
In some ways, these findings are similar to work on student teaching, which finds that teacher candidates tend to accept jobs close to their home and student teaching placement (Krieg et al., 2016, 2020). In other ways, these findings differ, as student teachers are far more likely to be placed in a school near their teacher preparation program (Boyd et al., 2005; Reininger, 2012), a difference that may reflect the number of online school leadership programs in the state (Anderson et al., 2022). Additionally, compared with teacher candidates, principal interns are more likely to be full-time employees with deeper connections to a particular location, making relocation for graduate school more costly. It is perhaps for this reason that we observe that the percentage of principal interns who stayed in the same school before, during, and after their internship is higher than those who were found at different schools. This finding may be a cause for concern, as the NELP standards and research on exemplary PPPs highlight the value of placing interns in a new school setting where they can learn to cultivate leadership skills and build relationships (Darling-Hammond et al., 2007; NPBEA, 2018).
We also found that interns’ program type was associated with variation in the geography of the internship. Relative to interns in a traditional MSA program, students enrolled in competitive scholarship loan programs were less likely to intern in their prior-employment school and had longer driving times between their prior-employment and internship schools. We also found that interns enrolled in add-on licensure programs were more likely to conduct their internship in their prior-employment school than interns enrolled in a traditional MSA program. This wide variability within and across PPPs highlights the variability in delivery models that PPPs in North Carolina use (e.g., through larger online enrollment) and the different relationships PPPs may have with their district partners. These findings also suggest that interns who attend add-on licensure programs may exercise more discretion in choosing their internship placement (i.e., remaining in their current school) compared with interns enrolled in a competitive scholarship program, where programs may exercise a greater influence on internship placement.
Limitations and Future Research
There are a few important limitations to consider with these findings. First, although we examine differences by individual and program context, we do not have any information on how these placement decisions were made in practice. The wide variation in the pathways of interns both within and between PPPs suggests that the placement process may be more haphazard than systematic. Yet, the differences we found between traditional MSA interns and those in either the competitive scholarship loan or add-on licensure programs suggest that program structure can influence internship pathways. Future research could further explore placement decisions by interviewing program chairs, district-level personnel, principal mentors, and interns to better understand how placement decisions are made and the degree to which these decisions are influenced by individual interns and program context.
Second, although national standards and research support the idea of multiple internship placements (e.g., Darling-Hammond et al., 2007; NPBEA, 2018), interns in this study remained in a single primary placement throughout their internship. Of course, programs often supplement internship experiences with site visits to other practicum-based experiences that help candidates discover new contexts, engage in powerful learning experiences, and develop leadership skills (Cunningham et al., 2019; Reyes-Guerra & Barnett, 2016). In our study, these activities are unobserved. Future research should evaluate the effectiveness of internship rotations, both in terms of interns’ leadership development and in terms of the hosting schools.
Finally, this study does not evaluate the effectiveness or quality of different internship pathways. Research on principal internships finds that interns who engaged in authentic leadership opportunities and conducted full-time internships reported higher levels of satisfaction with their internship than part-time interns (Ni et al., 2019; Orr, 2011). Similarly, other studies have found that interns with leadership positions had greater access to authentic leadership work, while those who were still teachers had much more limited opportunities (Christian, 2011; Hafner et al., 2012). Though limited, research on school-related outcomes found that high schools with a full-time principal resident had higher math scores and graduation rates but also higher rates of discipline (Steele et al., 2021). Future research should evaluate the extent to which school leaders’ internship placements predict their employment and performance outcomes.
Footnotes
Appendix
Rurality and the Geography of Principal Internships

| Driving Time in Minutes: PPP to Internship | Driving Time in Minutes: Prior Employment to Internship | Driving Time in Minutes: Internship to Post-Employment | ||||
|---|---|---|---|---|---|---|
| OLS | PPP FE | OLS | PPP FE | OLS | PPP FE | |
| Intern’s prior employment in an urban/suburban area | –8.581 (8.566) |
–1.609 (7.976) |
3.740 (2.874) |
0.959 (2.041) |
0.305 (2.935) |
–1.520 (2.945) |
| Observations | 1,081 | 1,081 | 1,020 | |||
Note: This table displays regression coefficients and standard errors (in parentheses) from models focused on how an intern’s rurality in their prior-employment school is related to the geography of internship placements; +, *, and ** indicate statistically significant differences at the 0.10, 0.05, and 0.01 levels, respectively.
Declaration of Conflicting Interests
The author(s) declared no potential conflicts of interest with respect to the research, authorship, and/or publication of this article.
Funding
The author(s) received no financial support for the research, authorship, and/or publication of this article.
Open Practices Statement
The data for “The Geography of Principal Internships in North Carolina” are not publicly accessible, but information on how to obtain the data is found at ![]() . The code for this study is publicly accessible at https://www.openicpsr.org/openicpsr/project/195001/version/V1/view. There is no preregistration for this study.
. The code for this study is publicly accessible at https://www.openicpsr.org/openicpsr/project/195001/version/V1/view. There is no preregistration for this study.
1.
We possess principal internship data for 12 of the 13 public universities in North Carolina that have a principal preparation program. North Carolina has a relatively small number of private institutions that offer programs for principal licensure, though we do not have access to their data for this study.
2.
These employment data include traditional (noncharter) public schools only.
3.
North Carolina largely has countywide school districts. Specifically, North Carolina has 100 counties and 115 school districts.
4.
Our driving time measures (PPP to internship, prior employment to internship, internship to post-employment) are right skewed and, as shown in ![]() , include many values of 0 (given that the prior/post-employment school is the same as the internship school). As such, for these driving time outcomes, we also estimated Poisson models with a PPP fixed effect. Results from these Poisson models are similar to those from our linear regression models and are available upon request.
, include many values of 0 (given that the prior/post-employment school is the same as the internship school). As such, for these driving time outcomes, we also estimated Poisson models with a PPP fixed effect. Results from these Poisson models are similar to those from our linear regression models and are available upon request.
5.
We identify statistically significant differences between groups (e.g., Black vs. White interns) based on the p-values from our regression models.
6.
We are cognizant that urban versus rural locales may influence the geography of principal internships. For example, in urban locations, it may be easier to make internship placements in nearby schools because there are more K–12 schools as options. To assess how rurality may be related to placement geography, we estimated a series of models where the outcome variables were the driving time (in minutes) between the PPP and internship site, the prior-employment school and internship site, and the internship site and post-employment school. The focal variable in these models is whether the intern’s prior-employment school was in an urban/suburban area relative to a rural/town area. Results in ![]() (covariate adjustment or PPP fixed effect) show that the rurality of the intern’s prior employment is unrelated to the geography of their placements.
(covariate adjustment or PPP fixed effect) show that the rurality of the intern’s prior employment is unrelated to the geography of their placements.
7.
In additional PPP fixed-effect models, we included a control for the year of the internship to assess whether the geography of placements has changed over time. Results suggest that the drive time (in minutes) between the prior-employment and internship school and between the internship and post-employment school has lessened over time (by approximately 2 minutes per year in our 4-year internship sample). Time does not significantly predict any of our other outcome measures.
Authors
TIMOTHY A. DRAKE is an associate professor of education leadership and policy at North Carolina State University. His research focuses on the policies, practices, and environments that shape school leader effectiveness.
KEVIN C. BASTIAN is a research associate professor in the Department of Public Policy at UNC Chapel Hill and the director of the Education Policy Initiative at Carolina (EPIC). His research focuses on educator preparation, labor markets, on-the-job learning, performance, and retention.