
Abstract
In the context of continued equity gaps in student success within and beyond STEM, this paper explored the extent to which the representation of underrepresented racial minority (URM) and first-generation college students predict grades in postsecondary STEM courses. The analyses examined 87,027 grades received by 11,868 STEM-interested students within 8,468 STEM courses at 20 institutions. Cross-classified multilevel models and student fixed effects analyses of these data both support the same conclusion: the proportion of URM and first-generation students within a class is positively associated with STEM grades among all students, and these relationships are stronger among students who are members of the minoritized group. Thus, promoting the representation of students with minoritized identities in STEM courses may lead to greater equity in college outcomes.
Keywords
Racial and socioeconomic disparities in college grades and graduation rates have been long-standing concerns in science, technology, engineering, and mathematics (STEM) as well as postsecondary education in general. Underrepresented racial minority (URM) students aspire to and initially enroll in STEM majors at close to the same rate as White non-Hispanic students (Eagan et al., 2014; Riegle-Crumb et al., 2019), but substantial equity gaps exist among those who ultimately complete STEM degrees. Among students at four-year institutions, 58% of White non-Hispanic students who initially declared a STEM major ultimately earn a STEM degree, whereas only 43% of Latinx students and 34% of Black students earn a STEM degree (Riegle-Crumb et al., 2019). A similar pattern emerges when examining socioeconomic disparities: First-generation college students at two-year and four-year institutions are about 40% less likely to earn a postsecondary STEM degree than continuing-generation students (Bettencourt et al., 2020). Postsecondary grades are critical to STEM success, as these constitute the strongest collegiate predictor of retention, persistence, and graduation within and beyond STEM (Chen & Soldner, 2013; Mayhew et al., 2016; Pascarella & Terenzini, 2005). However, racial and socioeconomic inequities in STEM grades are evident and sometimes sizable (Chen & Carroll, 2005; LaCosse et al., 2020). Therefore, one critical way to reduce disparities is to identify features of postsecondary STEM courses that may contribute to higher grades among URM and first-generation students.
Although many of the factors that contribute to group disparities start well before students enter college, the college environment plays a substantial role in shaping STEM outcomes and equity (see Museus et al., 2011; Xie et al., 2015). This environment occurs at various levels within individual courses, academic departments, disciplines, and institutions as a whole; it also includes interpersonal interactions (or lack thereof) and physical surroundings. Despite the presence of a voluminous literature on college student success, one potentially important environmental factor has largely been overlooked: the representation of ingroup peers within college courses. The presence of ingroup peers may help bolster grades, especially for students whose identities are marginalized within and beyond STEM contexts more broadly. Students who hold minoritized identities are conscious of the ways in which exclusion and discrimination shape their collegiate experiences generally (Ogunyemi et al., 2020; Ward, 2013) and in STEM courses specifically (McGee, 2016; Smith & Lucena, 2016). Taken together with the social identity theories described here, this suggests that URM and first-generation students are likely attuned to the representation of their social identities in STEM courses.
The present paper explores how classroom representation of URM and first-generation college students predicts grades within STEM courses using a large, multi-institutional sample of STEM-interested students. STEM outcomes are especially important to consider given the strong career opportunities for STEM graduates and the lower levels of STEM representation and degree completion among minoritized students (Bettencourt et al., 2020; Eagan et al., 2014; Riegle-Crumb et al., 2019). This paper also considers how representation may predict grades among students who hold privileged identities, as representation may also be salient for these students to some extent. Specifically, three research questions were examined. First, to what extent are the percentages of URM and first-generation students within STEM courses associated with college grades among STEM-interested students? Second, how do these relationships between representation and grades vary as a function of students’ URM and first-generation identities? Third, if grades vary as a function of URM and first-generation student identities, are there additional student-related (e.g., gender, SAT scores) or course-related (e.g., class size, field of study) attributes that further moderate these effects?
In this essay, we discuss theoretical perspectives on the ways in which ingroup representation may enhance the grades of students with minoritized identities (i.e., initial cues about representation, connections with ingroup members, and the culture or climate of the course). These perspectives are informed by dynamics that may occur at the institutional level or within classrooms and other postsecondary contexts. We then review previous literature on whether and how institutional and course-level representation, along with opportunities for ingroup peer engagement, predict college grades and graduation.
Theory on Ingroup Representation and College Outcomes
According to the cues hypothesis (Murphy et al., 2007; Murphy & Taylor, 2012), people are vigilant to situational cues in their local environment that signal the value and treatment of those who belong to their social groups. This vigilance is especially relevant for students from underrepresented groups, such as racial minorities and first-generation students who are aware of their group’s historical exclusion from postsecondary education and the bias and discrimination they still face within STEM fields, on college campuses, and throughout society (e.g., McGee, 2016; Smith & Lucena, 2016; Ward, 2013). Numerical representation is one cue that people use to determine the value and meaning of their identity in a particular setting (e.g., Murphy et al., 2007; Sekaquaptewa & Thompson, 2002). An absence of peers who share their identity can trigger social identity threat, which is a concern that one might be devalued, mistreated, or excluded in a particular social environment due to their group identities (Spencer et al., 2016; Steele, 2010). Importantly, students can be adversely affected regardless of the nature of their interactions or even before interactions occur. For instance, college students who watched a video about an upcoming STEM conference had a lower sense of belonging and elevated heart rate when the video portrayed inequitable representation among conference participants (Murphy et al., 2007). Moreover, URM students exhibit decreased academic performance when they are numerically underrepresented within small groups (e.g., Thompson & Sekaquaptewa, 2002). Qualitative research further illustrates the discomfort that URM students and students from lower socioeconomic backgrounds experience when seeing privileged students overrepresented in courses or throughout campus at predominantly White institutions (e.g., Cushman, 2007; Guffrida, 2003).
Although no research to date has examined numerical underrepresentation as a cue to threat among first-generation students directly, qualitative research suggests that first-generation students are keenly aware of their underrepresentation and the ways in which they differ from continuing-generation students (e.g., Ellis et al., 2019). Additionally, research indicates that first-generation and URM students’ psychological experiences in STEM overlap in important ways. For example, both groups of students report reduced belonging and increased feelings of being an imposter in threatening STEM classrooms, which in turn are associated with lower STEM grades and persistence (e.g., Canning et al., 2020; Muenks et al., 2020). Underrepresentation cues for first-generation and URM students are pervasive at many colleges, manifesting in numerical representation systemically through institutional, interpersonal, and intrapersonal processes (Nadal et al., 2021). Thus, the relative presence or absence of both URM and first-generation peers in STEM classrooms may affect their STEM grades.
One way in which the representation of ingroup members may help foster a welcoming environment is through peer engagement. The culturally engaging campus environments model (Museus, 2014) offers nine indicators of college environments that may contribute to a sense of belonging and academic achievement, and these can be especially influential for students whose identities are minoritized in college and beyond. The attributes of these environments may be pervasive across the institution or specific to particular classrooms, student organizations, or other smaller-group contexts. The first indicator describes the importance of having “opportunities to physically connect with faculty, staff, and peers with whom [students] share common backgrounds” (p. 210). Cultural connections with ingroup members may help provide a sense of familiarity and understanding, thereby reducing the implicit or explicit pressure to represent one’s group or to assimilate into a college environment that may feel unfamiliar or isolating. Such experiences may take even greater importance for URM STEM students, who may be excluded from joining study groups by their White and Asian peers (Burt et al., 2018).
According to Museus’s (2014) model, these cultural connections may extend to people who hold different identities but who share and understand students’ backgrounds or experiences, such as URM students from different races who have encountered marginalization and isolation in STEM coursework. Racial identity development models (Ferdman & Gallegos, 2001) and research on coalition building among members of different stigmatized groups (Craig & Richeson, 2016) also highlight how some URM students may connect and identify with people from other racial backgrounds, particularly when their identities share a dimension of stigmatization.
Moreover, the presence of students from minoritized backgrounds may alter the broader climate and culture within those environments. Black and Latinx students who attend institutions with a larger proportion of URM students are less likely to experience discrimination (Hurtado & Ruiz, 2012), and microaggressions toward Black students are less common in classrooms with greater representation of students of color (Solórzano et al., 2000). Moreover, to serve their student populations effectively, broad-access institutions that have greater representation of racially minoritized and first-generation students are more likely to implement culturally relevant teaching practices, which are designed to validate lived experiences, knowledge, and perspectives that students bring to the classroom (Campbell et al., 2019). Providing a culturally validating environment is likely beneficial for all students, with especially positive outcomes for minoritized students (Museus, 2014).
For each of these reasons—initial cues about representation signaling the value and meaning of one’s identity, greater connections with ingroup members, and a more inclusive culture or climate of courses—ingroup representation may bolster STEM grades and, ultimately, STEM persistence.
Literature on Ingroup Representation and College Student Success
Some previous research has explored how institutional demographics predict college success outcomes; this institution-level work focuses overwhelmingly on racial composition and student retention or graduation, whereas there is a very limited inquiry about the representation of first-generation students, STEM contexts, and/or academic achievement outcomes. Associations between racial representation and graduation rates are relevant for understanding the potential role of same-race representation, but these studies offer conflicting results. For instance, Capers (2019) found that Latinx peer representation mostly had a nonsignificant relationship with Latinx graduation rate. Garcia (2013) also identified no significant link between Latinx student representation and Latinx institutional graduation rates. Examining multilevel data with student- and institution-level predictors, Cerna and colleagues (2009) found a significant relationship between Latinx student representation and bachelor’s degree attainment among female students but not among male students. Oseguera (2005) also employed multilevel data to explore these dynamics for several racial groups predicting four-year and six-year graduation. Results varied considerably across the choice of control variables and, to a lesser extent, across outcomes. When same-race representation was the only institutional attribute included in the model, it was often positively associated with graduation for Asian and Latinx students and sometimes negatively related for Black students, but same-race enrollment was generally nonsignificant when other institutional variables were included. In the most consistent positive results to date, analyses that directly explored the equity gap in graduation rates found that Black, Latinx, Asian, and international students all fared better relative to White students when their own group was better represented at the institution (Bowman & Denson, 2022).
Other studies have explored the potential impact of institutional type, such as historically Black colleges and universities (HBCUs) and Hispanic-serving institutions (HSIs), for predicting graduation rates among students of color. Although minority-serving institutions have sizable representation of students of color, such indicators may confound the historical legacy of inclusion (particularly for HBCUs) and structural diversity, making it difficult to tease apart the unique contribution of same-race representation. This research has also yielded both positive and nonsignificant relationships between graduation and attending HBCUs among Black students and HSIs among Latinx students (see Mayhew et al., 2016).
Literature on minoritized students’ engagement with ing-roup peers suggests that increased same-group representation could bolster academic success. For example, involvement in STEM-focused racial/ethnic student organizations (e.g., National Society of Black Physicists) predicted not only STEM persistence (Hurtado et al., 2010) but also post-college outcomes among STEM graduates (Garibay, 2018). First-generation students who participated in universities’ TRIO programs, which include being paired with first-generation advanced undergraduates and/or faculty mentors, earned higher GPAs and gained experiences that increased STEM persistence (Martin et al., 2020). Additionally, URM and first-generation college students in STEM living-learning programs designed to support minoritized students earned higher GPAs and had greater STEM persistence (Schneider et al., 2015). These programmatic results are promising, but it is unclear whether ingroup representation played a direct role in improving STEM outcomes.
Moreover, the few examinations of classroom-level student representation yield equivocal findings. Oliver (2020) found that the percentage of Latinx and Black students in first-semester college coursework was more positively related to course outcomes among Latinx and Black students, respectively, than among other students. Conversely, Dills (2018) observed that students of color received lower grades in Western civilization courses when they were well-represented, whereas White students received higher grades in courses with a greater representation of students of color. Within engineering, Griffith and Main (2019) found that the proportion of female students within the classroom was positively associated with all students’ success, and the proportion of URM students sometimes predicted URM students’ success. Across courses from various subjects, Herzog (2022) found no overall main effect of URM representation on college attrition, but URM and first-generation students exhibited stronger relationships than their peers, such that greater URM representation predicted a lower likelihood of attrition. Finally, among students within a business school, the proportion of female students within a teaching section simultaneously predicted female students choosing more female-dominated majors and male students choosing more male-dominated majors (Zölitz & Feld, 2020). It appears that no research to date has examined whether classroom-level or institutional-level representation of first-generation students predict college success outcomes.
It is difficult to reconcile the conflicting results within and across studies, but the significant findings are generally in the expected direction, such that minoritized student representation is more strongly related to desired success outcomes among ingroup students. In addition, minoritized student representation was occasionally associated with more favorable outcomes, even among privileged students. The classroom-based studies discussed previously were often limited to one institution or even one course, so the results may not generalize across contexts. In studies of institution-level representation, the frequent reliance on institutional data prevented researchers from considering student-level predictors and sometimes led to small sample sizes.
Present Study
This study explored the conditions under which the course-level representation of two minoritized groups—URM and first-generation students—predict grades in STEM courses. This work expands and improves upon previous literature in several ways. First, the present analyses are the most comprehensive to date, examining thousands of courses at 20 colleges and universities, whereas previous classroom-level studies have examined only one course, one school (e.g., engineering, business), or one institution. The current findings may, therefore, be generalizable across a broader range of contexts. Second, the present study explored whether and how the role of student representation may vary across different course attributes (e.g., size, discipline) and student attributes (e.g., sex, precollege academic achievement). Higher education research has increasingly taken intersectional approaches and demonstrated how the combination of multiple concurrent identities might jointly shape student experiences and outcomes (Harris & Patton, 2019; Nichols & Stahl, 2019), so the present analyses directly considered this possibility. Contextual attributes of courses may also shape this relationship; for instance, the role of representation may be most influential in STEM disciplines for which the climate for diversity is especially problematic. Third, the analyses intentionally considered the representation of one student identity that is frequently quite visible (i.e., race) as well as another identity that is somewhat less visible (i.e., social class). That said, previous research makes clear that social class can be identified with some level of accuracy via people’s speech, clothing, and other cues (Kraus et al., 2017). Therefore, we expected to obtain similar results for URM and first-generation status, especially if students are readily able to identify social class representation within classroom contexts. The similarity or divergence of these hypothesized patterns across social class and racial identities constitutes an issue of theoretical and practical importance as educators seek to design classroom environments that maximize student success. Fourth, research on STEM outcomes among first-generation students is surprisingly limited, especially given the presence of notable socioeconomic disparities in STEM outcomes (e.g., Bettencourt et al., 2020), so these data contribute to an understudied and important topic. Finally, these analyses also directly explored the link between representation and grades among students who hold both minoritized and privileged identities, thereby providing a more complete picture of how student representation may predict outcomes for all students.
Method
Data Source and Participants
This study used data from the College Transition Collaborative’s social-belonging dataset, which included students who started college in fall 2015 and fall 2016. 1 The 20 colleges and universities in this study were intentionally selected to ensure diversity in their selectivity, type, size, region, and control (public/private). Students were included in these analyses if they reported being highly interested in pursuing a STEM major upon entering college (not all institutions allowed students to declare a major upon college entry, so this approach provided a consistent inclusion criterion).
Course-level data were obtained from institutional records; courses for the 2015 cohort were available for students’ first two years of college, whereas courses for the 2016 cohort were only available for students’ first year of college. Courses were only included in the analytic sample if they (a) contained at least five students, (b) involved a meaningful group of student peers (excluding private music lessons, internships, etc.), (c) provided letter grades (not pass/no pass), and (d) were at the undergraduate level. The final analytic sample consisted of 87,027 course grades that were nested within 8,468 STEM courses and 11,868 undergraduates. Among these students, 50% were female, 26% were Asian, 13% were Latinx/Hispanic, 6% were Black/African American, 9% were multiracial or another race, and 27% were first-generation college students. Additional information about the students, courses, and institutions in this dataset, along with some of the measures discussed herein, is provided in the supplemental material.
Measures
The dependent variable of grades in each course was standardized across institutions to use the same 4.0 scale (A = 4.0, A− = 3.7, etc.). URM status was operationalized as students who identified as American Indian/Alaska Native, Black/African American, Latinx/Hispanic, Pacific Islander/Native Hawaiian, multiracial, or other race/ethnicity (0 = non-URM, 1 = URM). Asian students were indicated via another dummy variable (0 = non-Asian, 1 = Asian), with White/Caucasian students as the referent group. Binary variables were used to indicate first-generation status (0 = continuing-generation, 1 = first-generation) and sex (0 = male, 1 = female). Students’ ACT composite score was also used; for students who took the SAT instead, their verbal + math combined score was converted to the ACT metric.
Among course-level variables, the use of registrar data allowed us to include all students enrolled in each course to calculate the proportions of URM and first-generation students, regardless of whether those students participated in the study. This same procedure was used to compute the proportion of first-generation students in each course. Correlations between URM and first-generation classroom representation (r = .18) and between student-level URM and first-generation status (r = .29) were both modest in size, so there was no substantial overlap between these two minoritized identities. Dummy variables were created for students’ academic term (spring, summer, and winter, with fall as the referent group) and STEM discipline of the course (chemistry, computer science, engineering, mathematics/statistics, physical sciences, or other disciplines, with biological sciences as the referent group). The choice of STEM disciplines in this study intentionally excluded social and behavioral sciences; this approach is consistent with the STEM definitions of some organizations (e.g., Department of Homeland Security), but it is inconsistent with others (e.g., National Science Foundation, American Association for the Advancement of Science; see AAAS, 2023; Gonzalez & Kuenzi, 2012; Granovskiy, 2018). Minoritized domestic students are better represented in the social sciences (National Science Foundation, 2021), and underrepresentation is sometimes perceived to be indicative of a challenging environment (e.g., Cheryan et al., 2017). Thus, the effects of representation within the STEM fields that we considered are likely different and best examined separately. Additional control variables indicated the class size (total number of students) and the year in college in which the course was taken (1 = first year, 2 = second year). Descriptive statistics for all measures are provided in Table 1.
Descriptive Statistics for All Variables

Note. These descriptives were computed at level 1 (i.e., describing the individual grade for each student in each course), so the values may not align with the student-level demographics reported in the main text of the paper.
Analyses
Cross-classified multilevel analyses were conducted using the lmer package in R to account for the complex data structure (see Bates et al., 2015; Fielding & Goldstein, 2006). Each individual grade was nested with a particular course and a particular student; however, neither students nor courses were hierarchically nested within each other since each course within the dataset contained at least five students and virtually every student received a grade in multiple courses. This structure could be described as students and courses being nested within each other in a non-hierarchical manner. An alternative approach of modeling either students as fully nested within courses or courses as fully nested within students would result in an overestimation of between-level variance and an underestimation of within-level variance, which would lead to bias in the results.
Thus, a cross-classified multilevel approach is ideal for this particular data structure to account for the non-hierarchical relationship (i.e., students’ grades in one course may share a relationship with their grades in other courses) and understand how both student- and course-level attributes may predict college grades (e.g., Ake-Little et al., 2020). Grades were modeled at level 1, students and courses were crossed with each other at level 2, and institutions were modeled at level 3 (since every student and course was fully nested within a particular institution in this study). The grade assigned to each student in each course was the dependent variable. The independent variables included students’ race, first-generation status, sex, ACT/SAT score; the proportion of minoritized students (either URM or first-generation), total number of students, academic term, and discipline of the course; and students’ year in college in which they took the course. These analyses can be summarized via the following equation:
such that
Additional moderation analyses conducted three-way interactions between representation, student identity, and one of several variables (students’ sex, students’ test scores, class size, STEM discipline, and the race/first-generation variable that did not reflect the construct of interest in that particular analysis). To reduce multicollinearity, each of the three-way interactions was included in a separate model.
As another approach for exploring the link between course-level representation and grades, multiple regression analyses with student fixed effects were conducted using the xtreg package in Stata. The fixed effects consisted of individual dummy variables that accounted for all variation across students, so the predictors only examined within-student variation; this approach helps address concerns about student self-selection into courses with different levels of demographic representation. As a result, no student-level variables can be entered into the models as predictors, so the analyses were conducted separately for URM and non-URM students (when examining URM representation) as well as separately for first-generation and continuing-generation students (when examining first-generation representation). The predictors in these within-student models were the representation of either URM or first-generation students in the course, class size, STEM discipline, academic term, and year in college during which the course was taken. Sub-sequent analyses determined whether the regression coefficients differed significantly by group (Cohen et al., 2003), which served to establish whether students’ identities moderated the link between representation and grades.
The use of multiple analyses has the benefit of considering the robustness of the results to alternative model specifications; at the same time, doing so can increase the likelihood of committing a type I error by conducting and examining the results of various statistical tests. Therefore, the Benjamini-Hochberg procedure (Benjamini & Hochberg, 1995) was performed with a false discovery rate of 5% to account for the presence of multiple comparisons when exploring the statistical significance of the findings. This approach is designed to provide corrections within a family of tests, which broaches the sometimes difficult question of what constitutes a “family” (McDonald, 2014). It seems clear that the various three-way interactions of representation × URM/first-gen identity × other variables constitute a family of tests and a set of analyses that considered the potential of student self-selection into courses (which appears in the supplemental material) constitutes another family. This issue is trickier for the primary research questions of interest, since these involve not only the link between representation and grades but also differences in this relationship between students who hold minoritized versus privileged identities. Therefore, we used this procedure separately for those two sets of tests and for the combination of all of these tests. We present and discuss results with and without these corrections for multiple reasons: (a) this adjustment sometimes works in our favor rather than providing more conservative estimates (e.g., adjusting the supplemental analyses for the false discovery rate results in our being less likely to identify significant selection effects); (b) we conducted these across multiple types of analyses for examining our research questions of interest (thereby making this presentation of adjusted results difficult); and (c) we used these for different families of results to consider our primary research questions (so there is not a single exact set of statistical significance values for the adjusted results).
Limitations
Some limitations should be noted. We did not have measures of students’ major(s) or retention, so we could not directly examine those subsequent outcomes. However, college grades are more strongly related to student retention than any other within-college variable (Mayhew et al., 2016; Pascarella & Terenzini, 2005), and both overall GPA and STEM GPA are strongly associated with persistence in a STEM major (e.g., Chen & Soldner, 2013; Xie et al., 2015), so grades constitute a highly informative outcome. Indeed, Green and Sanderson (2018) found that differences in STEM bachelor’s degree attainment between White students and Black and Latinx students were fully explained by first-semester college grades along with three other variables (i.e., ACT/SAT scores, sex, and participation in study groups) within a nationally representative dataset.
The coding and choice of URM analyses were also limited by the available data. Specifically, we were not able to perfectly classify the URM status of all multiracial students and all students who did not identify with the available racial categories. In addition, the small sample sizes for individual URM groups (overall and as a percentage of students in STEM courses) resulted in our using the broad racial classification of URM for these analyses. As discussed previously, relevant theories highlight the potential role of both ingroup racial representation (defined narrowly) and the presence of students from other racially minoritized groups in bolstering psychological and student success outcomes. Supporting this assertion, Bowman and Denson (2022) found that the institution-level representation of one racially minoritized group (e.g., Black students) frequently predicted smaller equity gaps in graduation for another racially minoritized group (e.g., Latinx students) even when accounting for same-race representation and other factors. The URM data limitations in this study would actually make it less likely that we would observe the hypothesized relationships. These issues are discussed in more detail in the supplemental material, including the results of analyses for Latinx representation that are consistent with those presented here for URM representation.
In addition, the examination of a heterogeneous, multi-institutional sample constitutes a notable strength of this study, but it is unclear how broadly the present findings may generalize to other institutions. The sample consisted entirely of four-year colleges and universities who were willing to participate in this project; thus, the extent to which these findings may apply to two-year institutions (in particular) needs further attention.
Finally, because students are not randomly assigned to STEM courses, the findings reported here do not necessarily represent causal effects. That said, we have taken several steps to increase the likelihood that the estimates reflect a causal relationship. For instance, the inclusion of student fixed effects removed all between-student variance, and we conducted additional analyses that found students do not increasingly self-select into courses with greater ingroup representation over time (see the supplemental material). However, even with the inclusion of student fixed effects, omitted variable bias at the course level may still constitute a problem. Some scholars have discussed fixed effects analyses as one form of quasi-experimental design, but this usage is generally in the context of studying changes over time that are associated with a specific intervention (e.g., see Gopalan et al., 2020; Morgan & Winship, 2014). We consider specific alternative explanations for our findings in the discussion section.
Results
The results from cross-classified, multilevel models predicting STEM grades are presented in Table 2. The proportion of URM students in STEM courses is positively and significantly associated with STEM grades, and this relationship is even stronger among URM students, as indicated by the positive interaction between URM identity and representation (see Model 1). This same pattern of results is also evident for the numeric representation of first-generation students, meaning there is a more positive relationship between representation and STEM grades among first-generation students in Model 2. Interestingly, the representation of each of these minoritized groups is associated with higher grades among students from both privileged and marginalized identities. That said, relative to classes with low URM representation (1 SD below the mean), classes with high URM representation (1 SD above the mean) have a 27% smaller grade disparity between URM and White students after accounting for the other variables within the cross-classified model (see Figure 1). When examining first-generation status, the grade disparity between groups is reduced by over half (56%) when comparing students in low-representation versus high-representation STEM courses. These cross-classified models for URM and first-generation representation both explained more than 20% of the variation in course grades.
Unstandardized Coefficients for Cross-Classified Multilevel Analyses Predicting Grades in Postsecondary STEM Courses

Note. In these analyses, grades were modeled at level 1, students and courses were crossed at level 2, and institutions were modeled at level 3. Fall term, biological sciences, and White/Caucasian students were the referent groups for academic term, STEM discipline, and race/ethnicity, respectively. *p < .05 **p < .01 ***p < .001.

Grade disparity by underrepresented racial minority (URM) and first-generation status at low versus high representation of the respective subgroup within college STEM courses.
Table 3 presents the results of three-way interactions that examine potential moderators of these effects. Four of the 28 interactions are significant before accounting for the use of multiple comparisons; specifically, the role of URM representation in predicting equitable outcomes is less pronounced in larger classes, it is less pronounced in chemistry than in biological sciences (i.e., the reference group for those analyses), and it is more pronounced in engineering than in biological sciences. One three-way interaction is significant for the proportion of first-generation students such that the pattern toward equitable outcomes with greater presentation is stronger in students’ second year than in their first year. None of the significant interactions is replicated across the two forms of identity, and the results are always nonsignificant for students’ test scores, gender, race, and first-generation status, as well as the academic term of the course. Moreover, when incorporating the Benjamini-Hochberg procedure to adjust for the use of multiple comparisons, none of these results are statistically significant at p < .05. It, therefore, appears that the role of minoritized student representation is generally consistent across a variety of conditions.
Unstandardized Coefficients for Three-Way Interactions From Cross-Classified Multilevel Analyses Predicting Grades in Postsecondary STEM Courses
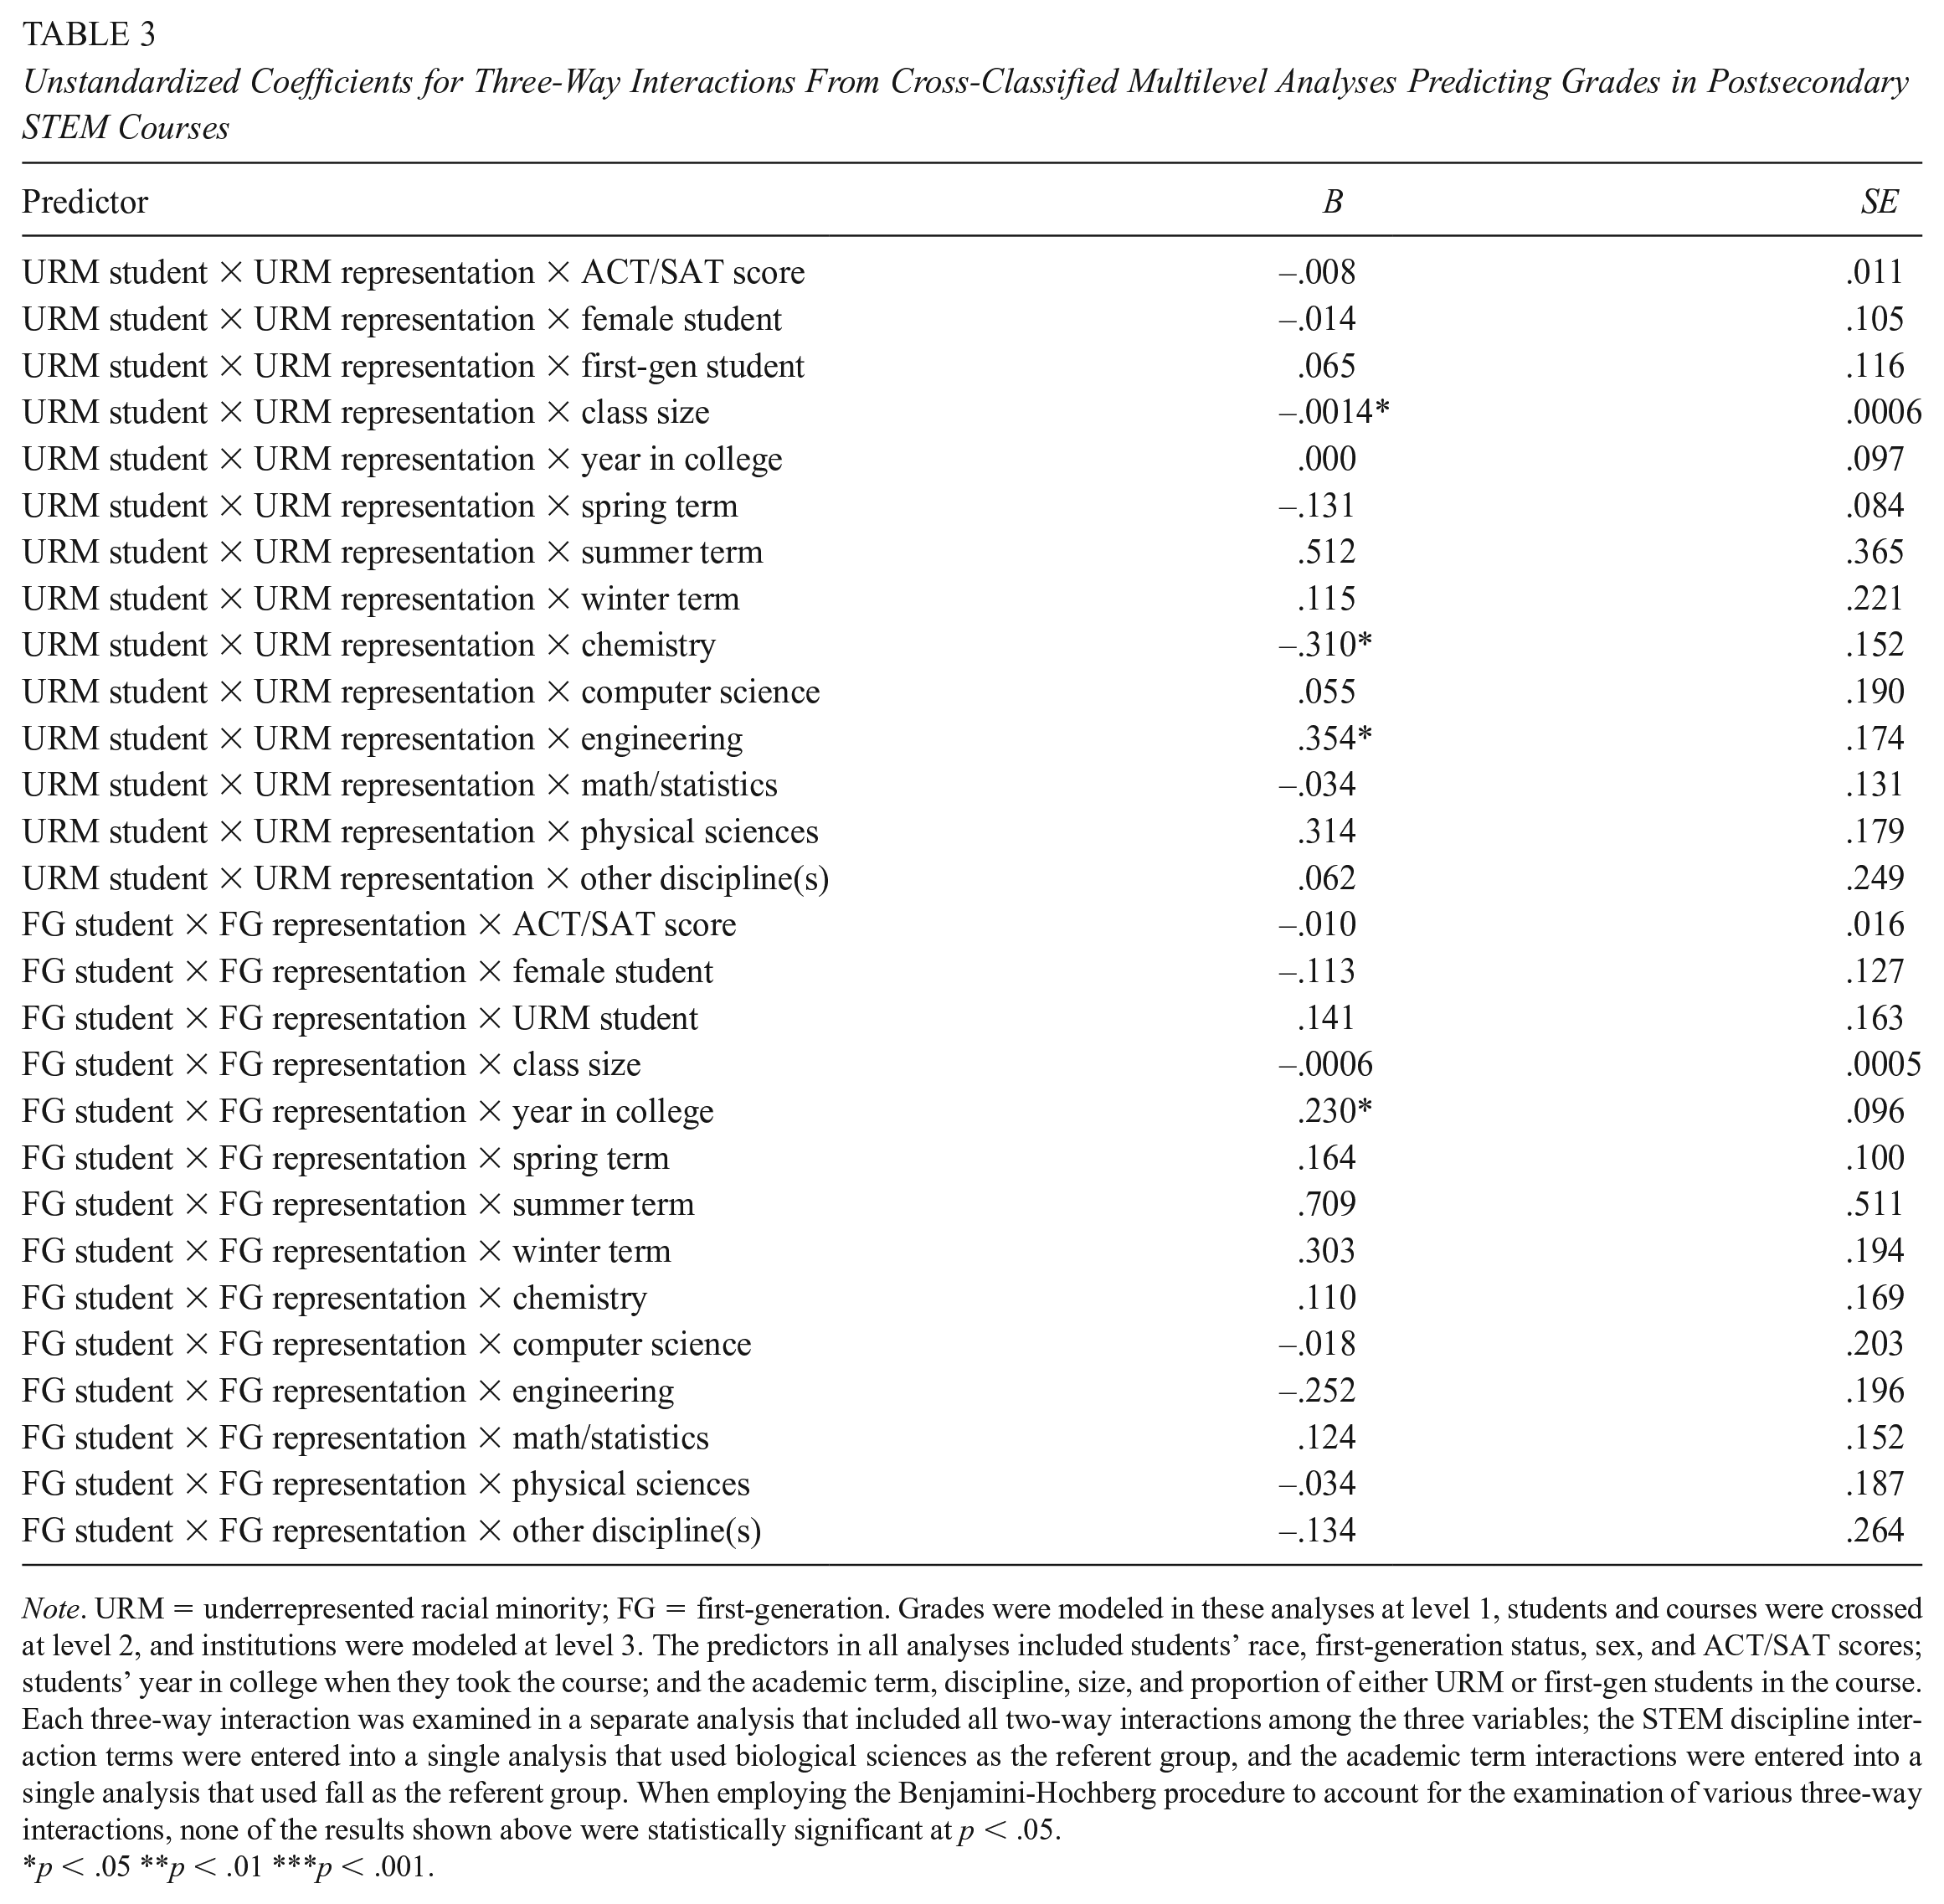
Note. URM = underrepresented racial minority; FG = first-generation. Grades were modeled in these analyses at level 1, students and courses were crossed at level 2, and institutions were modeled at level 3. The predictors in all analyses included students’ race, first-generation status, sex, and ACT/SAT scores; students’ year in college when they took the course; and the academic term, discipline, size, and proportion of either URM or first-gen students in the course. Each three-way interaction was examined in a separate analysis that included all two-way interactions among the three variables; the STEM discipline interaction terms were entered into a single analysis that used biological sciences as the referent group, and the academic term interactions were entered into a single analysis that used fall as the referent group. When employing the Benjamini-Hochberg procedure to account for the examination of various three-way interactions, none of the results shown above were statistically significant at p < .05.
p < .05 **p < .01 ***p < .001.
Table 4 displays results for student fixed effects analyses that accounted for all between-student variance. Consistent with the cross-classified analyses, URM representation in STEM courses is significantly and positively associated with grades among both URM students and non-URM students. The representation of first-generation students is also related to higher STEM grades among first-generation students and continuing-generation students (see Table 5). The within-student R-square values are reasonably modest (5–7%), but these are observed after accounting for 49% of the total variance that occurs between students. Moreover, post-hoc analyses indicate that these relationships for representation predicting grades are significantly stronger among URM than non-URM students (p < .001) and among first-generation than continuing-generation students (p < .001), providing additional confidence in the robustness of these relationships. This consistency is even more impressive when considering the variation in results for STEM discipline and academic term across the subgroup analyses.
Unstandardized Coefficients for Student Fixed Effects Analyses Predicting Grades in Postsecondary STEM Courses by Underrepresented Racial Minority (URM) Status

Note. Student fixed effects were entered in these analyses, so the coefficients represent within-student differences across courses, and the R-square values represent the proportion of within-student variance that these models explained after accounting for all between-student variance. Fall term and biological sciences were the referent groups for the academic term and STEM discipline, respectively. The coefficients for the proportion of URM students in the class differed significantly across groups (p < .001).
p < .05 **p < .01 ***p < .001.
Unstandardized Coefficients for Student Fixed Effects Analyses Predicting Grades in Postsecondary STEM Courses by First-Generation (FG) College Student Status

Note. Student fixed effects were entered in these analyses, so the coefficients represent within-student differences across courses, and the R-square values represent the proportion of within-student variance that these models explained after accounting for all between-student variance. Fall term and biological sciences were the referent groups for the academic term and STEM discipline, respectively. The coefficients for the proportion of first-generation students in the class differed significantly across groups (p < .001).
p < .05 **p < .01 ***p < .001.
Across relevant analyses, the findings for the link between representation and grades as well as the differences in this relationship by URM or first-generation student identity are unaffected by the use of the Benjamini-Hochberg procedure to account for multiple comparisons. These results all remain statistically significant at p < .05 regardless of whether these main effects and moderation effects are explored as separate families of tests or as a single broader family of tests.
Discussion
Across multiple analytic approaches, the representation of URM and first-generation students within STEM courses was positively associated with grades among students from both privileged and minoritized identities. Two different explanations, which are not mutually exclusive, may account for these findings among all students. First, a substantial literature demonstrates that intergroup interactions frequently result in learning and cognitive growth (see Bowman, 2010; Chang, 2011; Crisp & Turner, 2011). Because most of the institutions in the analytic sample enroll a majority of White and continuing-generation students, a greater proportion of URM and first-generation students provides an increased likelihood of such interactions. Thus, the present findings may be driven by learning that results from engaging with diverse peers. Second, it is possible that courses with greater representation of minoritized students may have more lenient grading practices (e.g., grading on a curve) or more effective STEM instructors. Our analyses attempted to account for these possibilities by controlling for course-level and student-level characteristics or by removing all between-student variation, but these strategies may not have fully succeeded, and they cannot provide direct evidence on whether or how each of these alternative dynamics may account for the results. As discussed later, it seems unlikely that differential grading or instructor effectiveness can explain all of this study’s findings, even though it may account for some of the overall positive relationships among all students.
Regardless of the analytic approach, the link between numeric representation and grades was strongest among students whose race- or class-based minoritized identity was increasingly represented within the course. This pattern cannot easily be explained by more lenient grading practices or by student self-selection into particular types of courses, especially given that participants who hold minoritized and privileged identities do not take STEM coursework with greater ingroup representation over time (as shown in the supplemental analyses). Easier grading within courses that have a greater proportion of minoritized students would not explain the significant identity × representation interactions observed here. The fact that these interactions persisted in the student fixed effects analyses—which means that the differences in a particular student’s grades across courses are more strongly associated with representation if that student has a minoritized identity—makes alternative explanations less likely.
Instead, the stronger results for students from minoritized groups may be attributable to the greater identity safety conferred by increased representation in these STEM classes (Murphy & Taylor, 2012; Steele, 2010). Each of the three theoretical mechanisms for minoritized students discussed previously pertain to identity safety, but this study cannot tease apart the potential relative roles of those three processes. When accounting for the other student and course-related variables, the grade disparity between URM and non-URM students is 27% smaller in high-URM representation courses than in low-representation courses, and the corresponding gap for first-generation students is reduced by over half in courses with high versus low representation of first-generation students. This finding supports the importance of college environments and the contextual cues within them in shaping success for URM and first-generation students (also see Museus et al., 2011; Xie et al., 2015).
Instructors may have played some role in shaping these processes. Prior research has sometimes found smaller group disparities in academic outcomes either within STEM courses whose instructors hold minoritized identities or at institutions with a greater proportion of minoritized STEM faculty (e.g., Bowman et al., 2022; Griffith, 2010; Price, 2010), likely because these instructors could serve as role models for similarly identified students. However, our preliminary analyses of a small subset of the present data for which instructors’ race was available identified no significant interaction between instructors’ race and students’ race in predicting STEM grades (instructors’ socioeconomic status was not available).
Through the paper, we have often used the term “grades” rather than “academic achievement,” since the latter may imply that grades reflect objective performance rather than an outcome that is a function of instructor behaviors (e.g., use of a grading curve, instructional effectiveness, potential bias). We emphasize the importance of the interactions between student identity and course-level representation because it seems unlikely that instructor characteristics or practices (along with other course-related confounding factors) could plausibly account for these significant interactions by both race and first-generation status.
The potential generalizability of the findings is enhanced by the sparsity of significant three-way interactions with additional student- or course-related factors; none of these interactions were significant when adjusting for the use of multiple comparisons. Some moderation might be expected; for example, it seemed reasonable to believe that representation of first-generation students would be more observable—and therefore more influential—in smaller courses, since cues that might signal a first-generation student identity (e.g., clothing or material objects) may be harder to detect at a distance than those for race/ethnicity. However, this pattern was not observed for first-generation students; in fact, the equity-related pattern for URM students and representation was actually more modest within larger class sizes before implementing the Benjamini-Hochberg procedure.
Conclusion and Implications
Higher education scholars, administrators, and other constituents have argued for the importance of policies that promote college access and representation among URM students to facilitate conditions that promote all students’ learning and growth as well as to overcome the effects of past and present racism (e.g., Chang, 2011). Illustrating the significance of this topic, the issue of whether and how institutions can consider race explicitly in their admissions processes has been contested in several consequential U.S. Supreme Court cases (Regents of the University of California vs. Bakke, Gratz vs. Bollinger, Grutter vs. Bollinger, Fisher vs. University of Texas, Students for Fair Admissions vs. President and Fellows of Harvard College, Students for Fair Admissions vs. University of North Carolina). The present study offers an additional argument for the need to increase both racial and socioeconomic representation; courses that contain sizable proportions of students from minoritized identities may lead to reduced disparities in postsecondary STEM grades and subsequent outcomes.
Broadly speaking, the present work highlights the importance of mitigating or removing contextual barriers that inhibit the success of students with minoritized identities. Social psychological research has tested interventions that reframe students’ interpretations of academic setbacks to foster a sense of belonging in college; recent work increasingly seeks to scale these interventions to entire cohorts of incoming students (e.g., Murphy et al., 2020; Yeager et al., 2016). Although this approach can be effective at promoting equitable outcomes, college administrators and practitioners should also focus on creating environments that reduce or eliminate the social identity threat that students from minoritized backgrounds face in educational settings (for concrete recommendations, see Dewsbury & Brame, 2019). Creating learning environments with substantial representations of URM and first-generation students constitutes one important strategy, which can be facilitated through greater recruitment and admission of underrepresented students as well as the creation of communities and supports for those students. Communities comprised mostly or exclusively of students from underrepresented backgrounds should be framed carefully as honorific and affirming (e.g., McNair Scholars Program) since programs, practices, and courses that are viewed as compensatory or remedial may backfire by conveying that these students need help or are seen as deficient (Yeager & Walton, 2011).
The present course-based findings lead to a difficult but important practical question: Given the population of currently enrolled students, should a college or university attempt to facilitate certain courses and course sections having high representation of minoritized students, distribute students somewhat evenly across courses and sections, or not work to shape course-level representation at all? Institutions have multiple opportunities to shape representation through conversations with academic advisors or by creating programs with a curricular component that primarily or exclusively enrolls students with minoritized identities. An approach that seeks to foster high-representation courses may benefit students within such classes but potentially be detrimental to students who are not taking these high-representation courses (and are therefore in lower-representation courses). Seeking to foster substantial representation in certain courses would also risk students interpreting this approach as deficit-based, especially if enrollment is tied to program participation or if students feel that advisors are pushing them into particular course sections. The best strategy may depend, at least in part, on the level of representation within STEM coursework. That is, efforts to facilitate higher-representation courses may be more useful at institutions with limited representation of URM and/or first-generation students (in which identity safety is likely an especially large concern within STEM coursework), whereas this may be less necessary or even counterproductive at institutions with high representation of students with minoritized identities.
Future research should explore the efficacy of specific approaches to maximize the potential positive effects of ingroup peers when minoritized students are substantially represented as well as how to leverage the positive effects of ingroup identities in classes in which representation is low. Instructors might hire teaching assistants from minoritized identity groups, highlight the identities of relevant researchers from minoritized groups, and include group activities that focus on students’ shared identities.
Additional research should continue to explore dynamics that contribute to the link between classroom representation and STEM student outcomes. How aware are students of ingroup representation within their courses, and is the link between representation and college success stronger among students who are more consciously attuned? Do the observed effects extend over time? In other words, is demographic classroom representation associated with later STEM persistence and graduation? If so, do grades fully explain these longer-term effects, or might other factors play key roles (e.g., sense of belonging in STEM, feelings of connection or community with peers)?
This future inquiry should also explore the potential mediating role of classroom culture and practices, especially given the positive relationships between minoritized student representation and grades among all students. Do instructors adopt more inclusive teaching strategies within courses that contain a larger proportion of students who hold minoritized identities? In addition, might students tend to be more engaged and willing to participate on average when a larger proportion of minoritized students is present? The exploration of such issues will shed light into the contextual—and potentially malleable—factors that may lead to postsecondary student success and equity in STEM.
Supplemental Material
sj-docx-1-ero-10.1177_23328584231209957 – Supplemental material for The Role of Minoritized Student Representation in Promoting Achievement and Equity Within College STEM Courses
Supplemental material, sj-docx-1-ero-10.1177_23328584231209957 for The Role of Minoritized Student Representation in Promoting Achievement and Equity Within College STEM Courses by Nicholas Bowman, Christine Logel, Jennifer Lacosse, Elizabeth A. Canning, Katherine T. U. Emerson and Mary C. Murphy in AERA Open
Footnotes
Acknowledgements
This paper analyzes data originally collected by the College Transition Collaborative (principal investigators: C. Logel, M. C. Murphy, G. M. Walton, and D. S. Yeager).
Declaration of Conflicting Interests
The author(s) declared no potential conflicts of interest with respect to the research, authorship, and/or publication of this article.
Funding
The author(s) disclosed receipt of the following financial support for the research, authorship, and/or publication of this article: The CTC Belonging Project was funded by the Raikes Foundation, the National Science Foundation (1661004), the Bill and Melinda Gates Foundation (INV-016864), the Higher Education Quality Council of Ontario (HEQCO), and Partner Schools, made possible through methods and data systems created by the Project for Education Research That Scales (PERTS) and supported by the Mindset Scholars Network. Any opinions, findings, and conclusions or recommendations expressed in this material are those of the authors and do not necessarily reflect the views of the funding agencies.
1.
The large-scale project associated with this dataset explored the impact of a social-belonging intervention. ![]() showed that the link between identity representation and STEM grades did not vary as a function of participating in the intervention’s treatment versus control condition (ps > .10). Including students’ assignment to treatment or control condition as a covariate also did not change the pattern or significance of the findings reported in this paper.
showed that the link between identity representation and STEM grades did not vary as a function of participating in the intervention’s treatment versus control condition (ps > .10). Including students’ assignment to treatment or control condition as a covariate also did not change the pattern or significance of the findings reported in this paper.
Supplemental Material
Supplemental material for this article is available online.
Authors
NICHOLAS A. BOWMAN is the Mary Louise Petersen Chair in Higher Education and Professor of Educational Policy and Leadership Studies at the University of Iowa, N438A Lindquist Center, 240 S Madison Street, Iowa City, IA 52242; email:
CHRISTINE LOGEL is associate professor of social development studies in Renison University College, affiliated with the University of Waterloo, REN 1613, 240 Westmount Road North, Waterloo, ON Canada N2L 3G4; email:
JENNIFER LACOSSE is assistant professor of psychology at the University of Michigan-Flint, 260 French Hall, 327 E Kearsley Street, Flint, MI 48503; email:
ELIZABETH A. CANNING is assistant professor of psychology at Washington State University, Johnson Tower 210, Pullman, WA 99163; email:
KATHERINE T. U. EMERSON is director of research of the Equity Accelerator at Indiana University; email:
MARY C. MURPHY is the Class of 1948 Herman B. Wells Endowed Professor and Professor of Psychology at Indiana Uni-versity, Psychology Building 348, 1101 E 10th Street, Bloomington, IN 47405; email:
References
Supplementary Material
Please find the following supplemental material available below.
For Open Access articles published under a Creative Commons License, all supplemental material carries the same license as the article it is associated with.
For non-Open Access articles published, all supplemental material carries a non-exclusive license, and permission requests for re-use of supplemental material or any part of supplemental material shall be sent directly to the copyright owner as specified in the copyright notice associated with the article.