
Abstract
The test score outcomes of major racial/ethnic groups in the United States are well documented. However, strikingly few statistical analyses investigate the academic outcomes of Native American students. This study drew on data containing >120,000 Native American student observations in grades 3–8 in Oklahoma from 2017 to 2019. Native American students’ test scores were lower than those of White and Asian students, but this difference decreased after accounting for background factors (e.g., poverty, special education status, and student mobility). Within the Native American sample, results also showed significant within-group heterogeneity based on individual background factors. Overall findings indicate that Native American students’ test score performance exceeds levels reported in prior descriptive reports.
Keywords
Introduction
More than 500,000 Native American students 1 attend public schools in the United States (U.S. Department of Education, 2021). These students represent a multitude of tribes, cultures, and homelands encompassing >400 ancestral languages and nearly 600 tribal nations in 35 U.S. states (National Congress of American Indians, 2020). Unlike other major racial/ethnic groups, Native American students are more likely to reside in rural areas. Nearly half of all Native American students are enrolled in rural public schools, whereas only a quarter of the broader U.S. student population goes to a rural public school (U.S. Department of Education, 2021).
The public education system has been touted as a key resource for supporting the success of Native American students. However, since the federal government began reporting data on Native American students in the early 1990s, the test scores of Native American students have lagged national averages (Brayboy & Lomawaima, 2018; Devoe & Darling-Churchill, 2008; Grigg et al., 2010). As a result, scholarly work has often portrayed Native American students as a struggling, low-achieving subgroup in public schools. Yet, the basis for this characterization has been limited primarily to theoretical and descriptive research that offers an incomplete account of academic outcomes (Brayboy & Lomawaima, 2018; Huffman, 2020). Without robust statistical analysis that accounts for student background characteristics, existing findings risk misrepresenting racial/ethnic differences in academic outcomes (Demmert et al., 2006).
One of the main reasons for the lack of empirical analysis is that Native American students comprise ~1% of all students in public schools (Ninneman et al., 2017), so even large national datasets contain relatively small samples of Native American students (López et al., 2013; Torres, 2017). In large-scale statistical analyses, researchers tend to exclude Native American students or combine them with other racial groups (Chain et al., 2017; Ho & Cherng, 2018; Shakeel & Peterson, 2022). There are also methodologic challenges associated with the classification of Native American students, particularly for individuals who identify by multiple racial or ethnic backgrounds (Roth, 2018). The limited amount of empirical work on Native American students is glaring because scholars have examined test score differences for major racial and ethnic groups in the United States for decades, and this research has influenced important policy decisions (Downey & Condron, 2016).
In this study, we investigated the academic achievement of Native American students in grades 3–8 in Oklahoma from 2017 to 2019. By drawing on state administrative data, we used a large student sample (n = 887,914) with >120,000 Native American student observations and an extensive set of student, school, and geographic covariates. The following question was addressed for the main analyses: Do the academic outcomes of Native American students differ from those of other racial/ethnic groups after controlling for student, school, and geographic characteristics? In subsequent analyses, the sample was restricted to Native American students to address the following question: Among Native American students, what student, school, and geographic background factors are associated with academic outcomes?
Oklahoma is one of the most important settings for exploring the academic outcomes of Native American students. It has the largest Native American student population in the United States (Ninneman et al., 2017). Native American students constitute ~14% of all students in Oklahoma, which is a much larger proportion than samples used in national research (Brayboy & Lomawaima, 2018; Devoe & Darling-Churchill, 2008; Torres, 2017). Oklahoma also has historical connections to Native American peoples. During the colonial era in the early 19th century, the Cherokee, Chickasaw, Choctaw, Muscogee, and Seminole tribes were forcibly resettled to Oklahoma in what became known as the Trail of Tears (Sturgis, 2007). Today these tribes maintain a strong presence in the state. Along with the significance of the study setting, our inquiry into Native American students’ test scores is a pressing need in the literature. Strengthening understanding of the outcomes of Native American students may help to inform future education policy and practice.
Theoretical Perspectives on Native American Student Outcomes
In 1969, the U.S. Senate released a report on Native American education, finding substantial gaps in achievement, resources, and opportunities for Native American students (U.S. Senate, 1969). The Senate committee responsible for the report declared that this situation was a national tragedy and a major indictment of the federal government (U.S. Senate, 1969). Federal reforms have since attempted to inject resources into schools to respond to these challenges (e.g., the Indian Education Act, 1972, and the Elementary and Secondary Schools Education Act, Title VII, 2001), but descriptive patterns observed in national data indicate that the test scores of Native American students have remained below national averages (Brayboy & Lomawaima, 2018).
An expansive theoretical literature seeks to explain the key mechanisms influencing Native American educational experiences and outcomes, with scholars differing in their emphasis on either socioeconomic, racial/ethnic, or cultural factors. By drawing on notions of social stratification, for example, some theorists have focused on linking educational disparities to socioeconomic inequalities, identifying poverty, human resource constraints, and rural economic decline as the main forces underlying Native American student outcomes (Bianchi et al., 2021). From this lens, it is social class hierarchies structured by access to financial and social capital that determine levels of school quality and student achievement. Low academic performance among Native American students thus is understood to stem from limited access to financial and social capital (Demmert et al., 2006).
In contrast to the social stratification perspective, critical theorists stress racial/ethnic discrimination and colonization polices as the primary factors shaping the educational experiences of Native American students (Brayboy, 2021; Huffman, 2020; Lomawaima & McCarty, 2006; Martinez-Cola, 2020). These theorists contend that public schools have perpetuated oppressive colonial policies that have sought to erase Native American identities (McKay et al., 2020). McKay et al. (2020) postulated that American institutions, including educational ones, have maintained structures that contribute to the erasure of Native American identities. They argue that erasure occurs through commonly used terminology, actions, and depictions of Native Americans. Some scholars operating from this perspective also make the case that the legacy of residential schooling has produced a negative historical memory of public education that has stymied Native Americans’ ability to thrive in state-operated schools (Fryberg et al., 2013; Whitbeck et al., 2004). Adopting tribal critical race theory, Brayboy (2005) theorized that public schools are constructed to maintain the dominance of European American worldviews in ways that delegitimize Native American identities. According to critical scholars, Native American peoples require autonomy and self-determination so that they may be liberated from institutions dominated by Eurocentric worldviews (Brayboy, 2021; Brayboy & Castagno, 2009).
Theoretical scholarship has also focused on cultural factors, with some theorists maintaining that Western-oriented schools are misaligned with the cultures of Native American peoples (Torres, 2017; Tyler et al., 2008). Native Americans who are assimilated into Eurocentric schools are thought to face barriers to academic success because of cultural mismatches related to ways of communicating, interacting, and generating knowledge. According to this reasoning, this cultural disconnect can lead Native American students to respond by taking oppositional stances to school norms. In ethnographic work attempting to illuminate this dynamic, San Pedro (2015) reported that Native American students may use silence as a form of resistance in public schools. As a proposed solution, Brayboy et al. (2009) called for culturally responsive education that grounds teaching methods, curricular materials, and school–community relationships in Indigenous culture and heritage. Transculturation theory is another prominent lens that elevates cultural influences, but it asserts that Native Americans can balance both tribal and mainstream cultural settings simultaneously (Moore, 2016; Okagaki et al., 2009). Transculturation theory views Native American students as capable of navigating schools and other mainstream institutions effectively through a process of cultural learning that does not necessarily lead to diminished connections to tribal culture (Huffman, 2020). Based on this perspective, Native American students can become biculturally competent, theoretically functioning well in schools without loss of tribal identity.
Empirical Research on Native American Student Outcomes
Theoretical perspectives point to various socioeconomic, racial/ethnic, and cultural factors that might explain the educational outcomes and experiences of Native American students (Brayboy, 2021; Huffman, 2020; Tyler et al., 2008). Empirical research can advance understanding by providing insight into the explanatory power of these theories, but research on Native American student outcomes is generally limited to either analyses drawing on small samples of Native American students or descriptive mean comparisons between Native American students and their peers (Brayboy & Lomawaima, 2018; Devoe & Darling-Churchill, 2008; Grigg et al., 2010). Several existing descriptive studies have drawn on data from the National Assessment of Educational Progress (NAEP), including its National Indian Education Study supplement (Brayboy & Lomawaima, 2018; Grigg et al., 2010; López et al., 2013). Other work has analyzed the U.S. Department of Education’s Early Childhood Longitudinal Study (ECLS; (Marks & Coll, 2007; Riser et al., 2019) as well as regional or local Native American student samples (Faircloth & Tippeconnic, 2010; Fryberg et al., 2013).
In a scholarly essay, Brayboy and Lomawaima (2018) presented racial/ethnic group comparisons from NAEP data from 2000 to 2015, showing that Native American students consistently scored lower on standardized tests than their White and Asian peers but exhibited similar or slightly higher scores than Hispanic and Black students. López et al. (2013) also analyzed NAEP data to conduct a within-group comparison of test scores among Native American students by using a sample of ~1,200 fourth grade students and 3,600 eighth grade students. The authors found that disability status, English language learner status, and eligibility for free or reduced-price lunch were strongly associated with lower reading and math test scores for Native American students. In a sample with 437 Native American children from the ECLS, Marks and Coll (2007) found that Native American children entered kindergarten with achievement levels that were largely similar to those of Hispanic and Black students. Also using the ECLS, Riser et al. (2019) performed a within-group analysis, reporting that poverty exposure was associated with reading and math scores for 600 Native American children.
In additional work, Fryberg et al. (2013) found modest evidence that culturally congruent school models support achievement in a small sample of 41 Native American students. Torres (2017) used NAEP data to explore academic achievement in a subsample of ~4,000 Native American students, finding within-group variation based on student characteristics related to poverty and disability status. Researchers have also explored graduation and attendance rates of Native American students (Dingman et al., 1995; Faircloth & Tippeconnic, 2010; Railsback, 2004). In an analysis of 12 states, Native American students had the lowest graduation rates of any racial/ethnic group in the public education system (Faircloth & Tippeconnic, 2010). While previous studies have presented important findings, there remains a pressing need for research on Native American student outcomes with larger samples using robust statistical controls. Existing scholarship is also becoming outdated, with the most recent statistical analysis being published 6 years ago. The dearth of research is striking when contrasted with the extensive bodies of literature examining test score outcomes of other major racial/ethnic groups in the United States.
Method
Study Setting
Native American students comprise ~1% of all students in the United States (Ninneman et al., 2017). However, the proportion of Native American students is much larger within certain states, such as Alaska (27%), Oklahoma (19%), Montana (11%), South Dakota (11%), and New Mexico (11%) (Ninneman et al., 2017). Estimates indicate that >40% of Native American students attend schools in rural areas and that 70% of Native American students are eligible for the National School Lunch Program (Devoe & Darling-Churchill, 2008). A higher percentage of Native American students live in poverty than all other racial/ethnic groups in the United States (Devoe & Derling-Churchill, 2008). Oklahoma is a significant location in the United States for studying Native American student outcomes. It has the largest number of Native American students of any U.S. state. Oklahoma was also a major site for the forced relocation of the Cherokee, Chickasaw, Choctaw, Muscogee, and Seminole tribes in the 1830s and 1940s. This relocation of the tribes from their ancestral lands to Oklahoma became known as the Trail of Tears (Sturgis, 2007). In a major court decision in 2020, the Supreme Court upheld the status of a 19th century treaty between the federal government and Native American tribes that gave Native Americans land rights and sovereignty in Oklahoma.
Data Sources
Student-level assessment and administrative data maintained by the Oklahoma State Department of Education from 2017 to 2019 were collected for the analysis. These data contained English language arts (ELA) and math test scores for public school students who took standardized assessments during these years. Oklahoma’s state assessment was changed starting in 2017, and the COVID-19 pandemic led the state to cancel its standardized examinations in 2020, so test scores from 2017, 2018, and 2019 were used for consistency across state assessments (Hamlin et al., 2023). The dataset contains standard student-level sociodemographic information on gender, racial background, English language learner (ELL) status, Individualized Education Plan (IEP) status, free or reduced-price lunch (FRPL) status, attendance, grade level, and school type. In Oklahoma, the State Department of Education categorizes students by race and ethnicity using standardized classifications aligned with federal guidelines (e.g., American Indian or Alaska Native, Asian, Black or African American, Hispanic or Latino/a, Native Hawaiian or Other Pacific Islander, White, and two or more races). Students are typically identified through self-reporting or parent/guardian reporting during school enrollment processes. These individual-level data cannot be publicly shared because of data-use agreements with the State of Oklahoma. The Stata syntax file used to conduct all analyses reported in this article is publicly available at https://www.openicpsr.org/openicpsr/project/243511/version/V1/view.
Positionality
The first author is not Native American and approaches this work through the lens of an educational policy researcher. As a member of a federally recognized tribe, the second author contributed direct cultural insight as well as in-depth knowledge of Indigenous scholarship that informed this study’s conceptual framing and interpretation.
Variables
The dependent variables were math and ELA test scores for students in grades 3–8. Math and ELA test scores were generated from the Oklahoma School Testing Program. These assessments are state-mandated, criterion-referenced examinations that are administered by the Oklahoma State Department of Education to students in grades 3–8. The assessments do not track achievement growth across grades. There are separate scales for each grade level that are aligned with the Oklahoma Academic Standards. Students with missing administrative data or test scores were excluded from the analysis. Along with administrative data on student background characteristics, variables were generated for geographic locale (according to school locations) and student mobility (i.e., within-year school switching).
Table 1 presents summary statistics for each variable of analysis for the full sample. Native American students comprise ~14% of all students in Oklahoma. At the school level, the average percentage of Native American students is 13%. Forty-seven percent of the state’s students reside in rural areas, whereas 21% reside in the state’s two large cities (i.e., Tulsa and Oklahoma City). Six percent of students in the full sample changed schools once within the academic year, and 1% did so more than once during the academic year.
Summary Statistics for Full Sample (n = 887,765)

Note. ELA, English language arts; FRPL, free or reduced-price lunch; ELL, English language learner; IEP, Individualized Education Plan. Summary statistics are based on the ELA sample (n = 887,765). The math sample is 887,956 students.
Table 2 presents mean differences between Native American and non–Native American students. In the Native American sample, 72% of students are FRPL status, 2% are ELLs, and 19% have IEPs. Among non–Native American students, 63% of all students are FRPL status, 9% are ELLs, and 16% have IEPs. On average, Native American students exhibited slightly lower achievement in math and ELA than non–Native American students.
Characteristics of Native American and Non–Native American Students

Note. ELA, English language arts; FRPL, free or reduced-price lunch; ELL, English language learner; IEP, Individualized Education Plan. Summary statistics are based on the ELA sample (Native American sample = 120,617; non–Native American sample = 767,148).
Table 3 compares the characteristics of schools attended by Native American and non–Native American students. There are few differences with two key exceptions. Native American students were more likely to attend schools with a higher percentage of Native American students, and they were much more likely to attend schools in rural areas—76% of Native American students compared with 43% of non–Native American students.
Comparison of Schools Attended by Native American and Non–Native American Students

Note. ELA, English language arts. Summary statistics are based on the ELA sample (Native American sample = 120,617; non–Native American sample = 767,148).
Empirical Strategy
Math and ELA test score records were examined for students in grades 3–8 over a 3-year period. Because test scores were nested in students who were, in turn, nested in schools, a mixed model was performed for ELA and math test scores. In the full model, the following mixed model was specified:

where Achievement is the academic outcome (i.e., ELA or math) for i student in school j during t school year. The term β0 is the intercept, indicating the mean achievement level for the reference group. Race represents a set of dichotomous variables for racial/ethnic group (i.e., Native American, Hispanic, Black, Asian/Pacific Islander, and multiracial). White students are the reference category. The model also includes student-level dichotomous variables for female (Sex), ELLs ( ELL), IEP status (IEP), and FRPL status (FRPL). Grade denotes grade-level dichotomous variables comparing grades 3–7 with grade 8 as the reference group. The term School_Change_Once denotes students who changed schools once within the academic year, and School_Change_Multi refers to students who changed schools more than once within the academic year.
In the model, there are several school-level variables. School_Enrollment is the total school enrollment. School_Type represents school-level predictors for school type (e.g., district-run public, charter, and virtual schools), whereas Sch_Pct_Native is the school-level percentage of Native American students. The term Geo_Locale denotes dichotomous variables indicating whether the student attends a school in a large city, midsized city, small city, suburb, or rural area. Rural is the reference category. There are dichotomous indicators for 2017 and 2018, with 2019 being the reference category. The term
To provide a more granular understanding of Native American achievement patterns, we compared the percentage of Native American and non–Native American students at each decile. In the final set of analyses, we examined within-group heterogeneity by restricting the sample to Native American students. Descriptive mean comparisons were first performed within the Native American student subsample to contrast Native American students by FRPL and non-FRPL status, IEP and non-IEP status, rural and nonrural status, those who changed schools within the academic year and those who did not change schools, and students who attended majority Native American schools and those who did not. We then estimated ELA and math achievement within the Native American subsample as well as for a subsample of baseline students defined as not eligible for FRPL, not on an IEP, not ELL students, and those who did not change schools during the academic year.
Results
Table 4 presents estimates of the relationship between Native American student status and ELA and math test scores, accounting for grade level and school year. In the first model, Native American student status was associated with lower ELA scores relative to White students. This association was estimated to be roughly half of an academic year of learning (see Hill et al., 2008). In the second model with full student, school, and geographic controls, the magnitude of the negative association between Native American student status and ELA scores decreased by 21%. The association dropped to approximately one quarter of an academic year of learning in ELA.
Mixed-effects Estimates of the Relationship Between Native American Students and Academic Outcomes

Note. ELA, English language arts; FRPL, free or reduced-price lunch; ELL, English language learner; IEP, Individualized Education Plan. Standard errors in parentheses. The reference categories were White, grade 8, rural area, and the 2019 school year. “Grade and year” were fixed effects for each grade level (3–8) and school year (2017–19).
p<0.001; ** p < 0.01. *p<0.05.
In the third model, Native American student status was associated with lower math test scores. This association amounts to approximately half of an academic year of learning in math. In the fourth model with full controls, the magnitude of the association between Native American student status and math scores decreased by 20%, an association that is about one quarter of an academic year of learning in math. Across these models, test score differences between White and Native American students became less pronounced after introducing controls for sociodemographic background characteristics.
Table 5 presents the percentage of Native American and non–Native American students at each achievement decile for ELA and math. With some minor differences, the percentage of Native American students represented at each decline was similar to that of non–Native American students, indicating that Native American students were not disproportionately clustered at the bottom or top of the test score distribution. To contextualize these results further, ~32% of Native American students in the sample scored proficient or higher in ELA, and 30% did so in math. In the non–Native American sample, 34% of students scored proficient or higher in ELA, and 35% scored proficient or higher in ELA.
Percentage of Native American and non–Native American Students at Each Decile
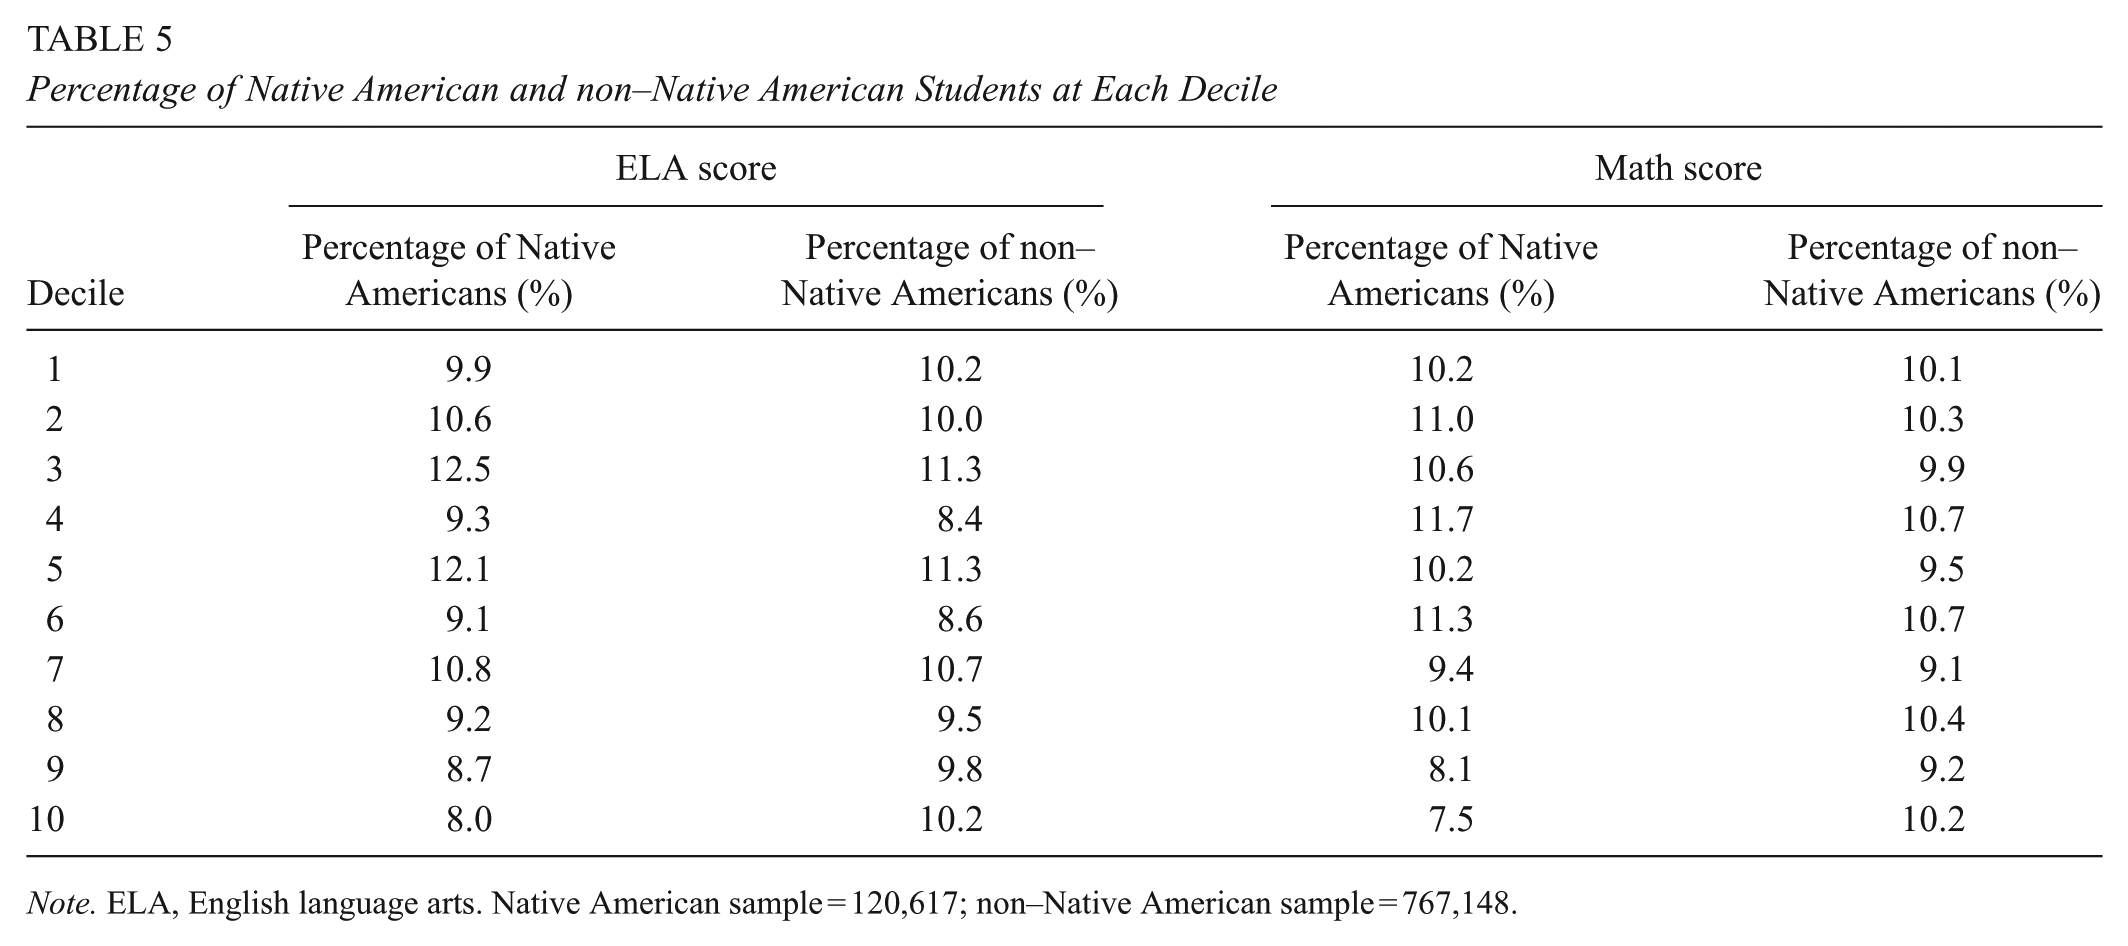
Note. ELA, English language arts. Native American sample = 120,617; non–Native American sample = 767,148.
In Table 6, descriptive mean comparisons across key background characteristics are presented with the sample restricted to Native American students only. Native American students who were not eligible for FRPL scored substantially higher in math and ELA than those who were eligible, and their achievement was above the mean in the full sample. There was a wide gulf between Native American students who had IEPs and those who did not. Strong differences were also observed for students in rural areas versus those in large cities, with Native American students attending schools in large cities scoring at far lower levels. During the academic year, Native American students who switched schools once exhibited much lower ELA and math test scores than their peers who remained in the same schools. In majority Native American schools, Native American students scored lower than their peers who did not attend majority Native American schools.
Mean Comparisons Within Native American Student Sample (n = 120,617)
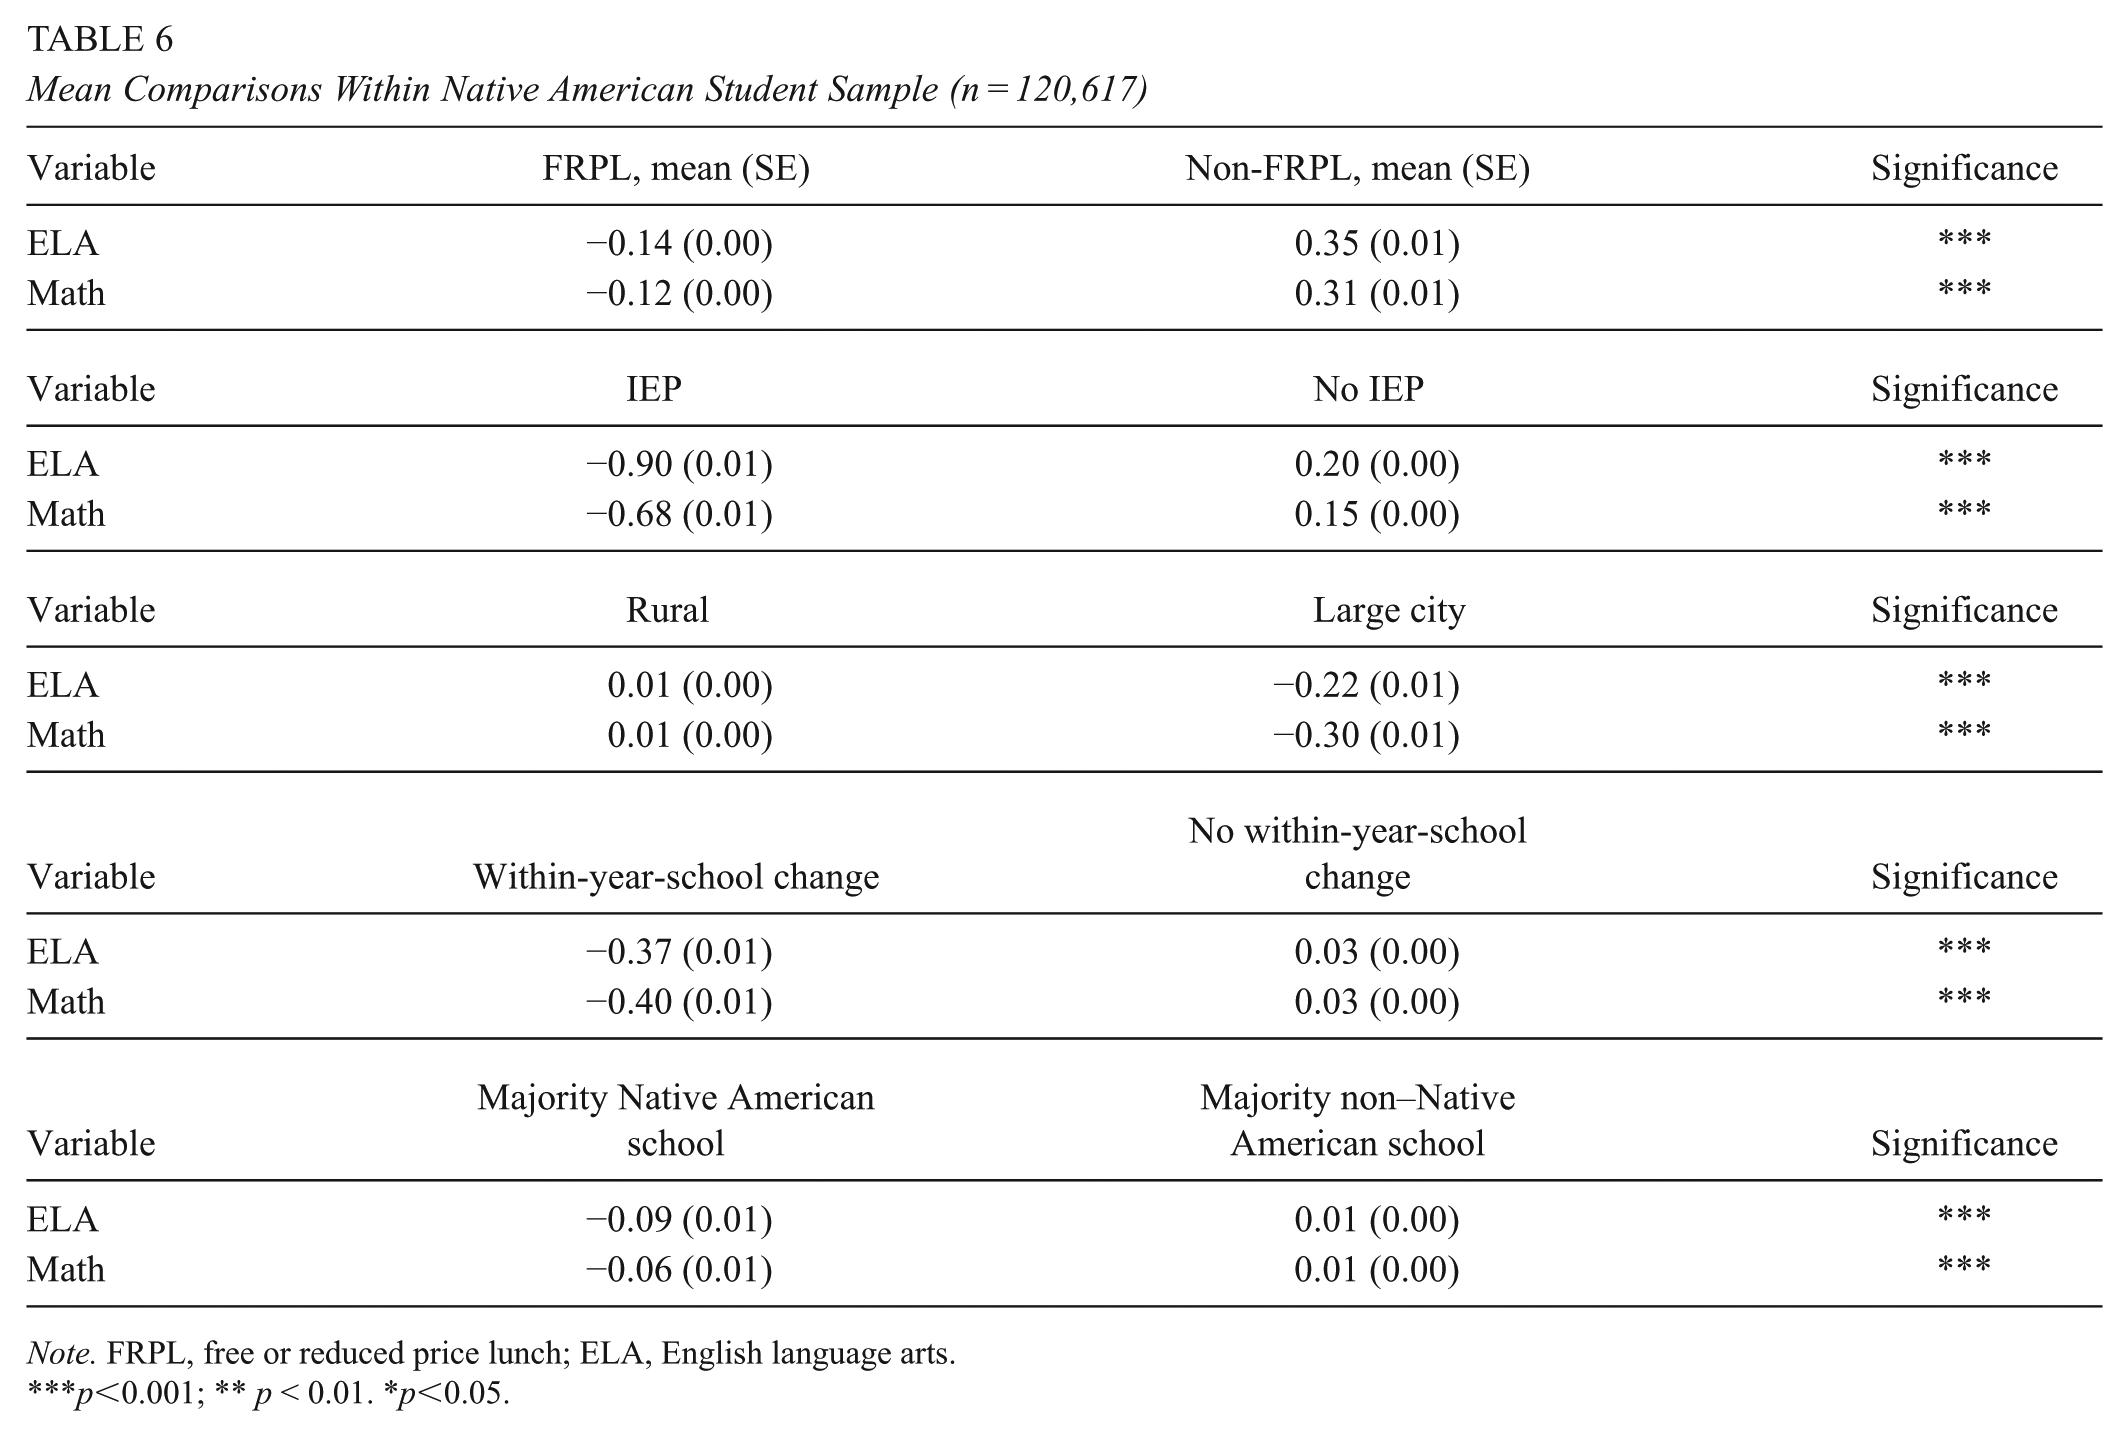
Note. FRPL, free or reduced price lunch; ELA, English language arts.
p<0.001; ** p < 0.01. *p<0.05.
Table 7 presents estimates for ELA and math scores for the Native American student sample only. Several of the estimates related to background characteristics were not only statistically significant but also large in magnitude. In the first two models, student mobility (i.e., within-year school switching) was negatively associated with ELA, amounting to about half a year of learning in ELA. The negative estimate for multiple within-year school switching amounted to about a year of learning in ELA (−0.35 SDs) for Native American students. As observed in the main models, FRPL (−0.27 SDs) and IEP (−0.90 SDs) status were strongly associated with lower ELA scores. Native American students in large cities also exhibited lower scores in ELA relative to Native American students in rural areas.
Mixed-Effects Estimates for ELA and Math Within the Native American Student Subsample
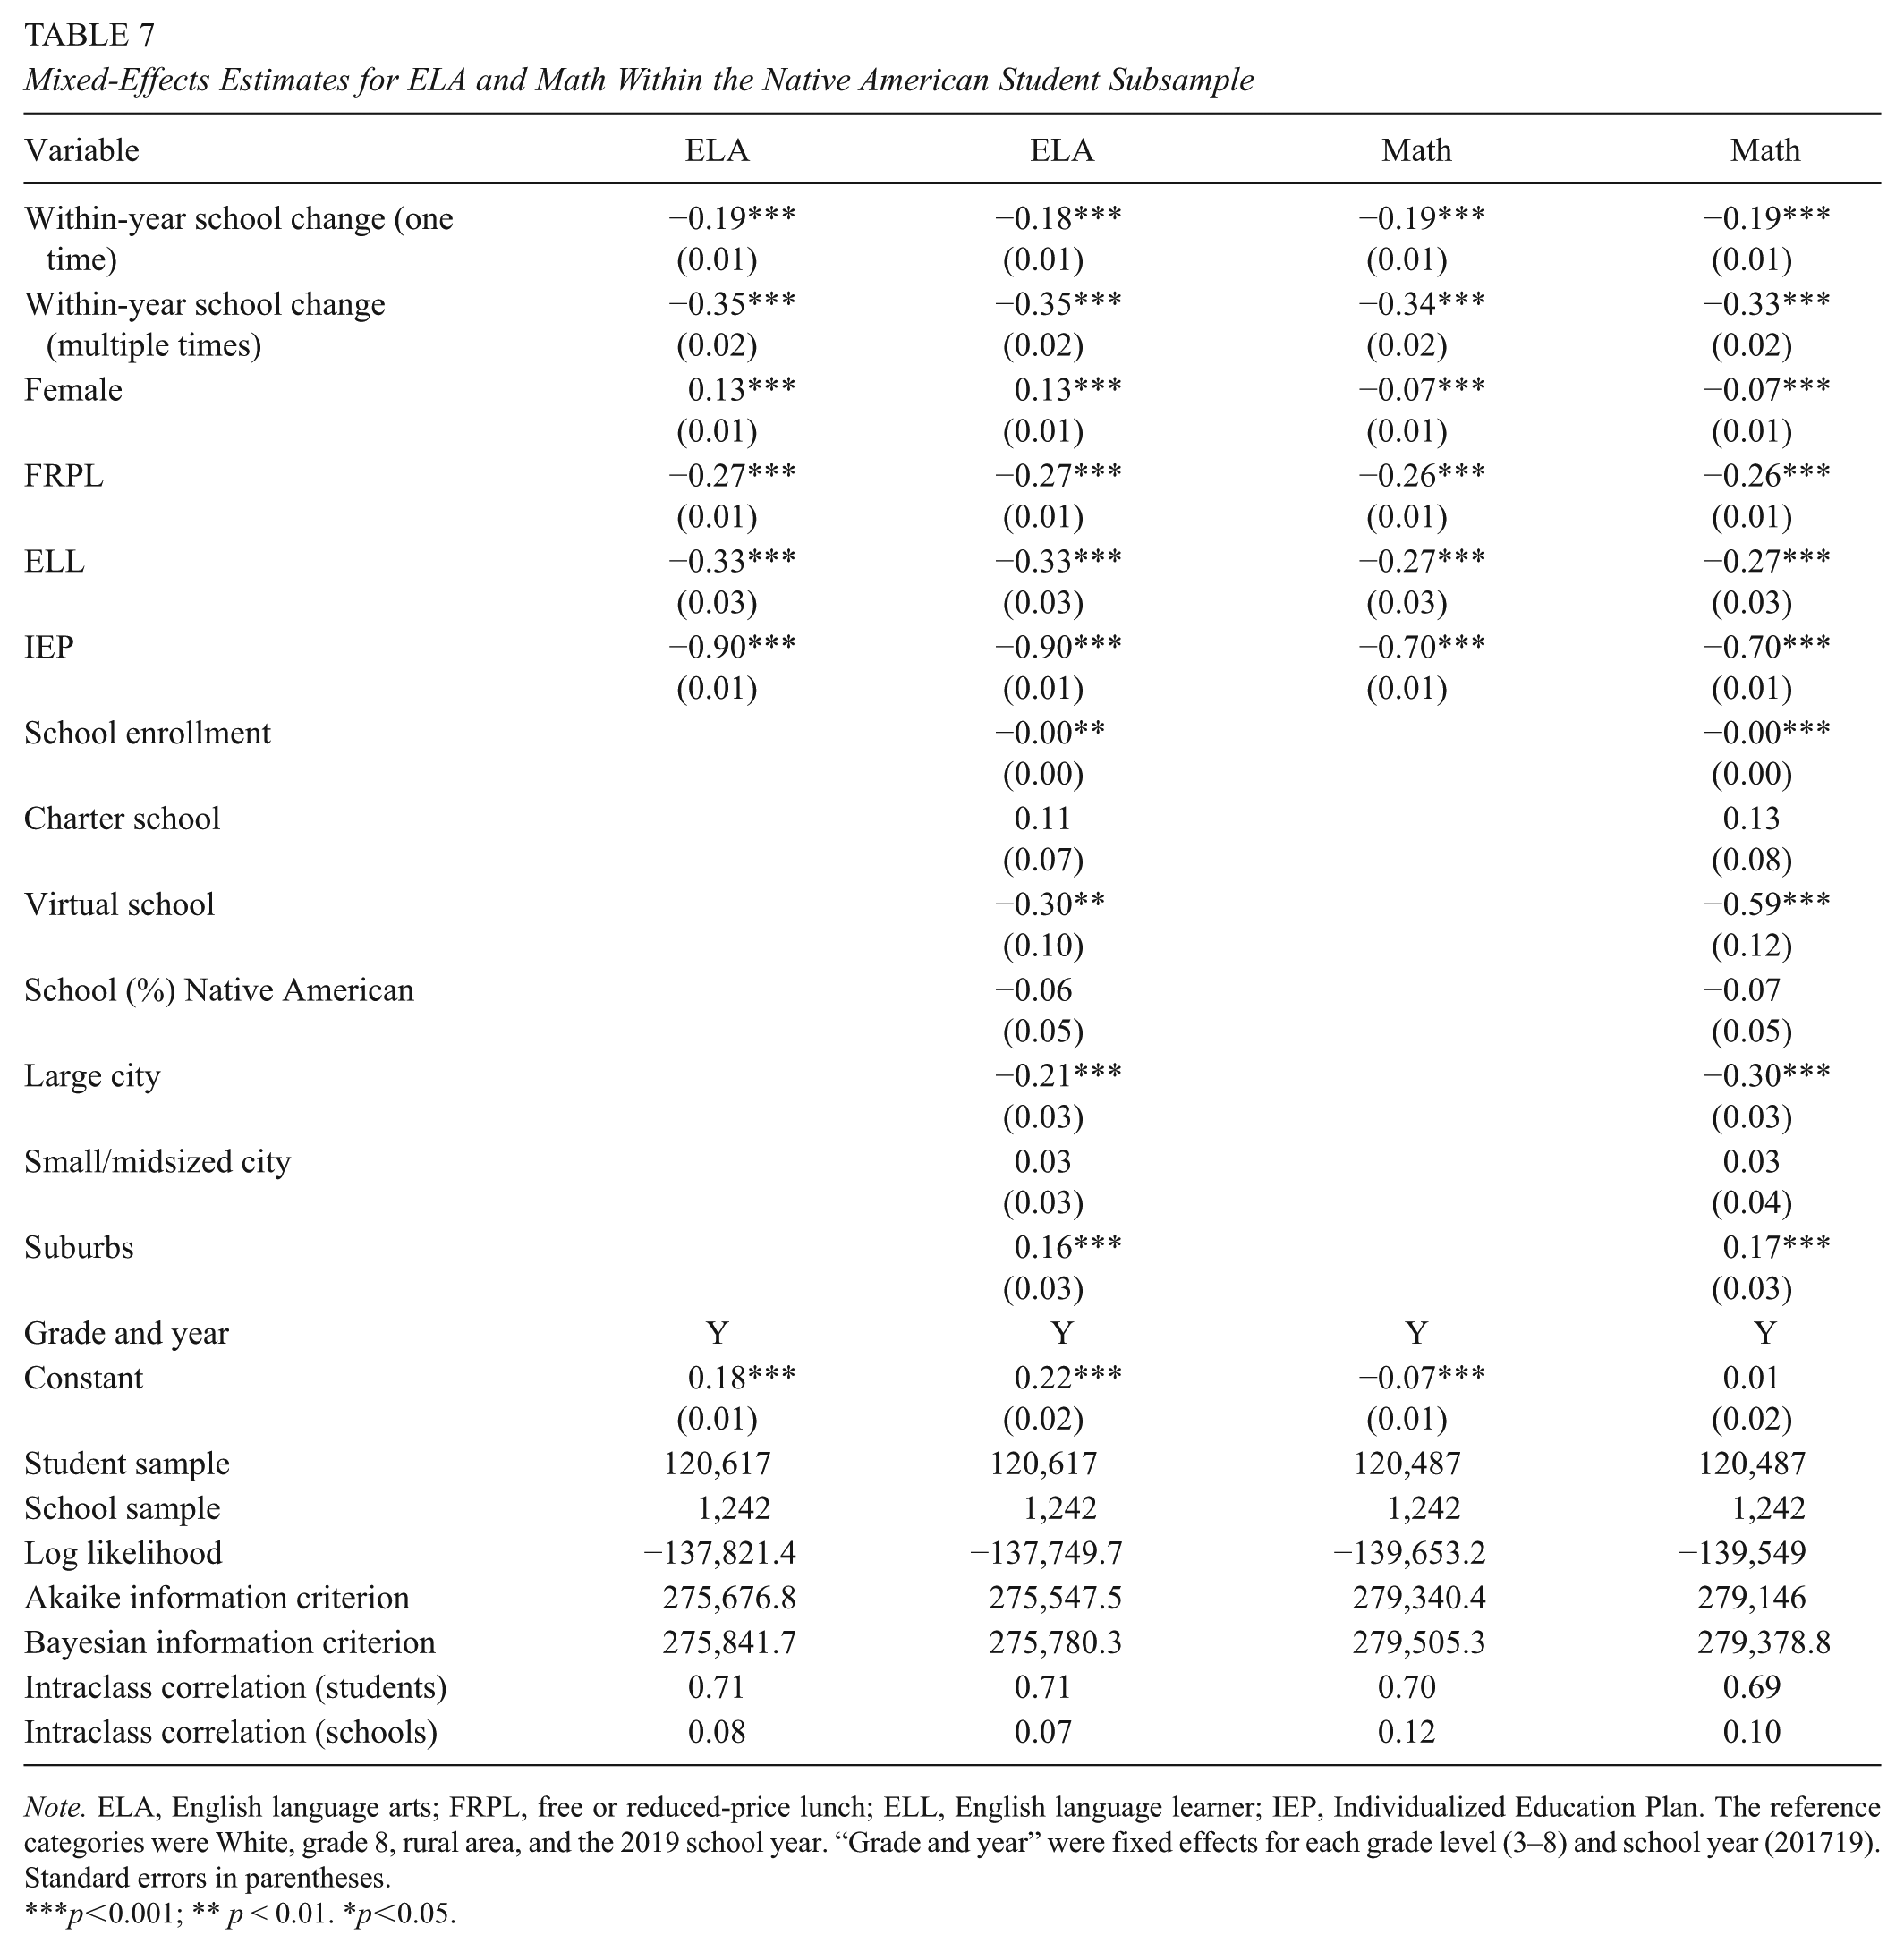
Note. ELA, English language arts; FRPL, free or reduced-price lunch; ELL, English language learner; IEP, Individualized Education Plan. The reference categories were White, grade 8, rural area, and the 2019 school year. “Grade and year” were fixed effects for each grade level (3–8) and school year (201719). Standard errors in parentheses.
p<0.001; ** p < 0.01. *p<0.05.
In the next set of models investigating math scores, the same characteristics were prominent. Within-year-school switching was negatively associated with half a year of estimated learning in math. FRPL (−0.26 SDs) and IEP (−0.70 SDs) status were strongly associated with lower math scores. Native American students attending schools in large cities exhibited lower scores in math relative to Native American students in rural areas, whereas those in suburban areas scored higher than Native American students in rural areas.
Table 8 presents results for a subsample of Native American and non–Native American students who were not eligible for FRPL, were not ELLs, were not receiving special education services (IEP), and did not switch schools during the academic year. By comparing results for this subsample of students, the racial/ethnic achievement gap for Native American students in both ELA and math test scores was slightly smaller than that of the main models in the full sample. In Models 1 and 2 in Table 8, the gap was −0.09–0.08 SDs in ELA compared with −0.11 SDs in the full sample in Table 4. In Models 3 and 4, the gap was −0.10 SDs in math, whereas the test score difference was −0.12 SDs in math in the full sample.
Mixed-Effects Estimates for ELA and Math in Subsample of Baseline Students

Note. ELA, English language arts. The reference categories are White, grade 8, rural area, and the 2019 school year. “Grade and year” are fixed effects for each grade level (3–8) and school year (2017–19). “Baseline students” were students who were not eligible for free or reduced-price lunch, were not English learners, were not receiving special education services (IEP), and did not switch schools during the academic year. Standard errors in parentheses.
p<0.001; ** p < 0.01. *p<0.05.
Discussion
More than half a million Native American students attend K–12 public schools in the United States. Yet, quantitative researchers often overlook the academic experiences of Native American students, contributing to the underrepresentation of Native American students in educational research. Existing studies tend to be either standard descriptive reports without statistical controls or analyses derived from small samples of Native American students (López et al., 2013; Riser et al., 2019; Torres, 2017). This study provides one of the most comprehensive statistical investigations of Native American student outcomes to date by using 3 years of data from Oklahoma, which has the largest Native American student population in the United States. Results demonstrated that Native American students had lower test scores than their White and Asian counterparts, but this gap decreased after controlling for student background factors related to poverty, disability status, and student mobility. In subanalyses of the large Native American student subsample, these same associations stood out, suggesting much within-group heterogeneity among Native American students. A substantial proportion of Native American students in the sample was found to score higher than what previous empirical studies relying on smaller samples of Native American students have indicated (Brayboy & Lomawaima, 2018; Marks & Coll, 2007).
Empirical Contributions
This study makes significant contributions to the literature. First, it demonstrates that while national samples of Native American students are limited (Lopez, 2020), state-level datasets can offer valuable empirical data with large samples. Second, the results of this study are partly consistent with findings from prior studies but suggest that a more nuanced interpretation may be needed. For instance, prior descriptive comparisons tended to find that Native American students scored lower on standardized tests than their White and Asian peers but exhibited largely similar or slightly higher achievement than Hispanic and Black students (Brayboy & Lomawaima, 2018; Devoe & Darling-Churchill, 2008; Grigg et al., 2010). In this study, Native American students did have lower academic outcomes than their White and Asian peers, but the magnitude of this difference decreased after accounting for other individual background characteristics. Third, based on test scores, Native American students seem to occupy a middle position among major racial/ethnic groups, reflecting a distinctive pattern in public schools.
This study’s analysis of within-group heterogeneity among Native American students also advances existing research. Our results showed that Native American students are not a monolithic group. Among Native American students, there is substantial diversity in individual, geographic, and socioeconomic characteristics that are interrelated with academic outcomes. Student mobility and family income were key differentiating factors, offering evidence that individual socioeconomic circumstances are linked to outcomes for Native American students as they often are for other racial/ethnic groups. Furthermore, a considerable proportion of Native American students exhibited relatively high test scores with students in rural areas outperforming their Native American peers in large cities. These findings for rural students, in part, complicate the idea that it is poor conditions in rural areas that are responsible for low Native American student achievement, as some have postulated (Bianchi et al., 2021).
Theoretical Considerations
Although this study does not directly test major theoretical propositions related to Native American student outcomes, it does offer suggestive evidence that can be used to consider the relevance of prominent theories and their differing emphases on either socioeconomic, racial/ethnic, or cultural factors. In the present work, individual socioeconomic characteristics (e.g., poverty and student mobility) that are commonly associated with the academic outcomes of students of different racial/ethnic backgrounds appear to have a similar influence on Native American student outcomes, which lends support to theorists who stress the importance of the relationship between socioeconomic factors and student achievement (Demmert et al., 2006).
Scholars have previously reported that home-school cultural misalignment may not be a strong predictor of academic outcomes among Native American students. For example, Torres (2017) found no link between a proxy measure of cultural discontinuity and reading and math scores among Native American students in national data. Our results showing that socioeconomic and individual characteristics are salient might be interpreted as indicating that cultural misalignment is not a major factor affecting test scores. Yet, it should be acknowledged that federal publications have called for greater cultural alignment in schools serving Native Americans (Porterfield, 2023), as have prominent Native American scholars (Brayboy et al., 2009; López et al., 2013). In Native American–serving schools, educators have sought to strengthen cultural responsiveness by integrating Native American language, arts and music classes and activities honoring tribal traditions (Hamlin, 2023). Federally funded Bureau of Indian Education tribal schools in particular represent one of the longest-standing examples of such efforts.
In this study, many Native American students exhibited above-average achievement and were represented in the upper deciles of the achievement distribution at levels comparable with those of the overall sample. These patterns could be compatible with the idea of bicultural competence emphasized in transculturation theory—a theory that posits that Native American students can navigate and succeed in schools while not losing connections to tribal identity (Huffman, 2010, 2020). In contrast, critical race theorists contend that public school structures are assimilationist in nature, pushing Native American students to adopt mainstream norms while diminishing tribal identity. As opposed to bicultural competence, assimilation forces could be operative, raising the prospect of cultural loss alongside high achievement (Brayboy, 2005). In future research, in-depth qualitative inquiry could be done to explore whether there is evidence for cultural loss or bicultural competence among Native American students in K–12 educational settings.
Study Limitations and Future Research
It is important to underscore the limitations of this study. Even though the analyses were derived from a large sample with robust controls, there may be unobserved contextual factors in our analyses that explain the relationship between Native American student status and academic achievement. Causal interpretations of this study’s findings are unwarranted. Moreover, because of classification protocols used for state administrative data, this study’s analyses used a standard categorization of Native American students, combining Native American students into a single category. Treating Native American students as a uniform group in this way may conceal within-group differences because Native American peoples comprise numerous tribes, languages, cultures, and homelands. Based on these varying characteristics, there may be heterogeneity in outcomes. We still may be masking even more granular tribal or cultural differences within the administrative category of “Native American” despite our within-group analysis. Therefore, future work might examine potential heterogeneity of this kind. Such research is also needed to disaggregate and explore results for multiracial Native American students. In U.S. Census data, ~60% of Native Americans report more than one racial/ethnic identity (Maxim et al., 2023).
Federal and state education systems also do not confirm tribal citizenship when reporting on race/ethnicity. A student may be identified as Native American based on self-identification rather than tribal enrollment. As a result, there could be a mismatch between tribal citizenship rolls and state-reported student data. In future scholarship, researchers might undertake a quantitative analysis of academic outcomes across tribal groups. This research could point to specific needs within tribal communities, helping to inform state, federal, and tribal education policy.
Policy and Practice Considerations
Our findings raise key considerations for public schools serving Native American students. To strengthen the educational experiences of Native American students, scholars have maintained that two-way communication and well-functioning partnerships with families are key. Home-school liaisons, culture nights, parent workshops, shared decision-making structures, and listening sessions are strategies that might help to create the conditions for students to thrive. It also must be noted that many Native American students score at high levels on standardized assessments, potentially indicating opportunities for schools to optimize the educational experiences of these students. School leaders may need to consider ways of extending gifted programming, advanced coursework, and early college programs for high performers, particularly if these schools are located in rural areas where opportunities for advanced academic work can be limited. Overall, strong school–family partnerships, positive school cultures, and rigorous academic opportunities may ensure that Native American students realize their full potential.
Footnotes
Appendix
Mixed-Effects Estimates for ELA and Math Within the Native American Student Subsample with School-Level Achievement

| Variable | ELA | ELA | Math | Math |
|---|---|---|---|---|
| Within-year school change (one time) | −0.19***
(0.01) |
−0.18***
(0.01) |
−0.19***
(0.01) |
−0.18***
(0.01) |
| Within-year school change (multiple times) | −0.35***
(0.02) |
−0.33***
(0.02) |
−0.34***
(0.03) |
−0.32***
(0.02) |
| Female | 0.13***
(0.01) |
0.13***
(0.01) |
−0.07***
(0.01) |
−0.07***
(0.01) |
| FRPL | −0.27***
(0.01) |
−0.25***
(0.01) |
−0.26***
(0.01) |
−0.25***
(0.01) |
| ELL | −0.33***
(0.03) |
−0.31***
(0.02) |
−0.27***
(0.03) |
−0.25***
(0.02) |
| IEP | −0.90***
(0.01) |
−0.89***
(0.01) |
−0.70***
(0.01) |
−0.70***
(0.01) |
| School enrollment | −0.00***
|
−0.00***
|
||
| Charter school | −0.06 |
−0.03 |
||
| Virtual school | −0.01 |
−0.09 |
||
| School (%) Native American | 0.18***
|
0.19***
|
||
| School achievement | 0.78***
|
0.78***
|
||
| Large city | 0.10***
|
0.04 |
||
| Small/midsized city | 0.00 |
−0.00 |
||
| Suburbs | 0.03 |
0.02 |
||
| Grade and year | Y | Y | Y | Y |
| Constant | 0.18***
|
0.17***
|
−0.07**
|
−0.01 |
| Student sample | 120,617 | 120,617 | 120,487 | 120,487 |
| School sample | 1,242 | 1,242 | 1,242 | 1,242 |
| Log likelihood | −137,821.4 | −137,095.3 | −139,653.2 | −138,842.3 |
| Akaike information criterion | 275,676.8 | 274,240.6 | 279,340.4 | 277,734.5 |
| Bayesian information criterion | 275,841.7 | 274,483.1 | 279,505.3 | 277,977 |
| Intraclass correlation (students) | 0.71 | 0.69 | 0.70 | 0.66 |
| Intraclass correlation (schools) | 0.08 | 0.01 | 0.12 | 0.02 |
Note. ELA, English language arts; FRPL, free or reduced-price lunch; ELL, English language learner; IEP, Individualized Education Plan. The reference categories were White, grade 8, rural area, and the 2019 school year. “Grade and year” were fixed effects for each grade level (3–8) and school year (2017–19). Models 2 and 4 included a variable for school-level achievement. Standard errors in parentheses.
p < 0.001; **p < 0.01; *p < 0.05.
Declaration of Conflicting Interests
The authors declare no potential conflicts of interest with respect to the research, authorship, and/or publication of this article.
Funding
The authors received no financial support for the research, authorship, and/or publication of this article.
Open Practices
Notes
Authors
DANIEL HAMLIN is a Presidential Professor at the University of Oklahoma. He examines the effects of education policies with an emphasis on academic achievement, student safety, family engagement, and school choice.
JAMESON D. LOPEZ (Quechan) is an assistant professor at the University of Arizona. His research uses quantitative methods and Indigenous statistics to investigate Native American education policy.