
Abstract
Performance-based funding (PBF) policies with research incentives have grown in popularity over the years despite little understanding regarding whether they actually work. This study leverages a novel national data set to examine the impact of PBF research incentives on the research expenditures and total state appropriations among public 4-year institutions, with a particular focus on minority-serving institutions. We find that PBF research incentives had no impact on the total amount or relative share of total research expenditures or the total amount of state appropriations allocated to treated institutions, regardless of minority-serving institution status. PBF policies that allowed institutions to self-select or opt into including research incentives as part of their PBF formula had a positive impact on the relative share of expenditures allocated to research and total state appropriations.
Keywords
Introduction
Public 4-year universities in the United States, which are subsidized by government appropriations, typically have institutional missions centered on a combination of research, teaching, and service (Rhoten & Calhoun, 2011). The research function of higher education is critically important to not only institutional prestige but also economic development (e.g., Eid, 2012; Guisan, 2005; Jongbloed et al., 2008; Volkwein & Sweitzer, 2006). State policy makers look to colleges and universities to foster research activities as a way to improve innovation and economic development within their individual states, and a growing number of states have begun to increase their financial commitment to efforts designed to expand the research capacity of their public colleges and universities (Toutkoushian & Paulsen, 2016).
Performance-based funding (PBF), which has grown in popularity and is currently used by two thirds of states, ties a portion of a public college or university’s level of state appropriations to institutional outcomes (Ortagus et al., 2020). The metrics states use to evaluate institutional performance most often include student outcomes, such as progression toward a degree and degree production, but an increasing share of PBF systems are focusing specifically on a given institution’s research activities (Rosinger et al., 2020). Research metrics for PBF-adopting states have varied over the years but often include institutions’ research expenditures from externally funded grants and broad measures of research and development (R&D) expenditures. Slightly fewer than half (19) of the 41 states that have adopted PBF over time have included research-oriented metrics within their PBF formulas (authors’ calculations). Research incentives in PBF systems encourage institutions to support research activities by tying state appropriations to research-oriented expenditures and outcomes in alignment with the institutional missions of public research universities (Burke, 1998; Miller, 2016; Snyder & Boelscher, 2018). But PBF can increase the tension between policy makers’ desire to hold institutions accountable and the financial realities of already underresourced colleges or universities (Boland, 2020; Hillman & Corral, 2018).
Due to the unequal funding distribution of public higher education, minority-serving institutions (MSIs), in particular, often receive insufficient resources to maximize their research capabilities and are left with limited financial flexibility when compared with predominantly White institutions (Boland & Gasman, 2014; Cunningham et al., 2014). Similarly, less-resourced institutions, such as MSIs, may not receive enough support from the state to substantially alter their expenditures in ways that would boost their research capacity (Leslie et al., 2012; Ryan, 2004). PBF policies typically lead to funding systems in which already-advantaged institution types receive a disproportionate share of funding and underfunded institutions, such as MSIs, are asked to continually do more with less (Hagood, 2019; Hillman & Corral, 2018; Li et al., 2018; Ortagus et al., 2020) and have a higher share of funding at stake in PBF systems (T. Jones et al., 2017). For MSIs, the unique mission of these institution types related to serving targeted student populations is often overlooked in PBF metrics (Gasman et al., 2017).
While a large body of previous research has focused on the intended and unintended consequences of PBF on students’ academic outcomes (Hillman et al., 2014; Ortagus et al., 2020; Umbricht et al., 2017), PBF policies incentivizing research activities have a substantive impact on institutional behavior but have yet to be studied in the academic literature. To examine the impact of PBF with research incentives on the behaviors of public 4-year colleges and universities with a focus on MSIs, this study is guided by the following research questions:
Literature Review
Research incentives featured less prominently than student-oriented measures of institutional performance in early PBF policies during the 1990s (now known as PBF 1.0), emphasizing states’ strategic investment in degree completion over institutional prestige indicators (Burke 1998; Dougherty & Natow, 2015; Toutkoushian & Danielson, 2002). However, PBF policies have linked a portion of state appropriations to research outcomes for certain institutions since the 1990s. Roughly two thirds of states that operated PBF 1.0 systems adopted a research metric for at least one institution (Burke & Serban, 1998; Dougherty & Natow, 2015), and states have incorporated measures of research activity into more recent PBF policies (known as PBF 2.0) at a similar rate (Rabovsky, 2012). As one example, every university in Florida’s State University System is able to choose whether or not to include research expenditures as one of its 10 performance metrics (Cornelius & Cavanaugh, 2016; Snyder & Fox, 2016). PBF policies in other states, such as Kansas, Maine, and Montana, have tied state appropriations to research activity for a small subset of 4-year institutions within each state (Boelscher & Snyder, 2019).
Research Expenditures at Public 4-Year Institutions
The level of institutional expenditures on research activities plays a pivotal role in the extent to which a college or university is able to increase its ranking or institutional prestige (Morse & Brooks, 2021; Volkwein & Sweitzer, 2006), research productivity (Dundar & Lewis, 1998; Eid, 2012), and other important outcomes related to institutional efficiency and effectiveness (Powell et al., 2012; Robst, 2001). For example, R&D expenditures in higher education in European countries were positively related to innovation (Pegkas et al., 2019). Guisan (2005) pointed out that research expenditures at universities in the United States greatly contribute to regional development and solidify a comparative advantage relative to the majority of European regions and countries.
American colleges and universities spent nearly $84 billion on R&D in Fiscal Year 2019, with more than half of all expenditures coming from federal funds (Gibbons, 2021). Most of this funding goes to support university-based research projects and facilities, but indirect cost recovery from federal grants can be an important source of general operating revenue for the largest research universities (Ledford, 2014). The level of a given institution’s reliance on research expenditures is largely dependent on its available revenue sources and stability in funding (Leslie et al., 2012). Historically, private 4-year universities have higher levels of research expenditures than public colleges and universities (Blasdell et al., 1993). Moreover, private universities have accelerated their spending on research activities and have experienced corresponding advantages in institutional prestige over the years (Lau & Rosen, 2016), including when it comes to recruiting faculty (Alexander, 2001; Rippner & Toutkoushian, 2015).
Due to the ways in which the prestige structure in American higher education emphasizes research resources (Brewer et al., 2004; Stocum, 2013), MSIs can face pressure to demonstrate traditional measures of research resources as institutional quality indicators (W. A. Jones, 2013; O’Meara, 2007). As a growing number of MSIs seek to maximize their prestige (Contreras et al., 2008; Doran, 2015), one approach is to increase their research capacity and potentially obtain a larger share of state funding. However, MSIs have been underfunded in ways that may restrict their ability to expand their research expenditures and build their research capacity (Cunningham et al., 2014; Gasman & Commodore, 2014). Prior research attributes these funding disparities to unequal state funding systems, including PBF (Hillman & Corral, 2018; T. Jones et al., 2017; Li et al., 2018) and insufficient support from federal R&D funds (Boland & Gasman, 2014; Matthews, 2011; National Center for Science and Engineering Statistics, 2021).
Due to the institutional mission of MSIs focused on empowering racially marginalized students before implementing prestige-seeking behaviors, MSI faculty often carry larger teaching and advising loads and receive lower levels of research support when compared with non-MSI faculty (Clark et al., 2016). With an increasing number of MSIs seeking to emphasize institutional prestige and become research-intensive institutions (Contreras et al., 2008; Doran, 2015; O’Meara, 2007), it is critical to understand the potential impact of state-level policies on research expenditures for MSIs. While previous research has centered around the impact of PBF on student success at MSIs (Boland, 2020; Hu, 2019), little is known regarding the extent to which PBF policies with research-oriented metrics may alter institutional expenditure patterns at MSIs or the extent to which these policies impact state appropriations these institutions receive.
Incentivizing Research Activities With Performance-Based Funding
To incentivize research activities, many European countries (e.g., Belgium, Italy, Norway, Sweden) have adopted PBF with varying provisions related specifically to research activities. In general, previous research has found that PBF adoption within European countries is positively related to research productivity for colleges and universities (Aagaard et al., 2015; Cattaneo et al., 2016; Checchi et al., 2019; Sīle & Vanderstraeten, 2018; Vanecek, 2014). However, the impact of PBF on research productivity can vary greatly depending on the academic discipline (Engels et al., 2012) and selectivity of the institution (Abramo et al., 2011), which can exacerbate already-existing inequities among colleges and universities (Mateos-González & Boliver, 2019). Because the funding mechanisms and accountability systems for higher education in European countries are fundamentally different from the ones in the United States (e.g., Cretan & Gherghina, 2015), it is unclear if PBF with research incentives functions similarly to influence institutional behaviors in the U.S. context.
In the United States, state governments currently provide funding for about 5% of all university R&D expenditures (Gibbons, 2021), and this money is generally separate from capital appropriations used to build new facilities. However, interest in tying state funding to research funding and productivity has grown over time. Indiana’s research incentive was the first metric used to measure performance in the state’s PBF program (Umbricht et al., 2017), whereas other PBF states have incorporated research-oriented metrics into existing systems. PBF policies incentivize research activity for universities by tying state funding to R&D metrics relating to the academic, economic, and research-related missions of institutions. While a common measure of research activity is externally generated research funding (e.g., Arizona Joint Legislative Budget Committee, 2012), PBF policies also incentivize nonmonetary research outcomes, such as increasing entrepreneurship and commercialization (Kansas Board of Regents, 2019), technology transfer, and licensing and patents (Board of Governors of the State University System of Florida, 2019; Board of Trustees of State Institutions of Higher Learning, 2013). PBF systems in South Dakota and Tennessee have linked research funding to educational opportunities for students (South Dakota Board of Regents, 2000; Tennessee Higher Education Commission, 2015), while research metrics in Kansas are meant to encourage R&D activity at universities that improve employment outcomes for students and support state economic priorities (Kansas Board of Regents, 2019). The amount of institutional funding tied to research metrics has ranged from roughly 1% of state funding in Mississippi (Board of Trustees of State Institutions of Higher Learning, 2013) to nearly 20% of performance funding in New Mexico (New Mexico Higher Education Department, 2018). Prior studies have examined the relationship between PBF adoption and university research activity and expenditures, despite their common drawback of not actually identifying PBF programs with research incentives.
Early PBF programs in Florida and South Carolina coincided with increases in externally funded research activity (Shin & Milton, 2004). Using spline linear modeling to explain variation in research funding at 4-year colleges and universities from 1997 to 2007, Shin (2010) determined that institutional characteristics, rather than PBF policies, contribute to institutional differences in revenue growth from federal research grants and contracts. Kelchen and Stedrak (2016) reported that PBF adoption was not related to expenditures for research for all 4-year institutions; however, PBF policies were associated with decreases in annual research spending of less than 1% for research universities specifically (Rabovsky, 2012). Spending of gift, grant, and contract revenues by research universities in PBF states was also associated with minimal decreases in state appropriations (Rabovsky, 2012).
State policy makers’ desires to measure efficiency and productivity can create tension with measures of institutional performance given the complexity of varying institutional missions (T. Jones, 2016). On the adoption of any performance-oriented programs, including PBF and other performance budgeting programs, research funding has been found to increase at flagship universities specifically, while nonflagship universities experienced decreases in both research funding and publication activity (Payne & Roberts, 2010). Forty-one states have adopted PBF over time (Ortagus et al., 2020), but 22 of those PBF-adopting states have never included research-oriented metrics in their PBF formula. Previous literature related to PBF adoption and research-related priorities offers mixed findings due in part to the misalignment between the policy lever and outcomes being examined (i.e., the metrics of PBF systems vary across states and may not incentivize research-related outcomes). Although prior work has identified numerous PBF studies with strong difference-in-differences designs to support causal inference (Ortagus et al., 2020), recent developments in econometrics literature have shown that any difference-in-differences study with time-varying policy adoption is subject to a host of methodological threats that were not addressed in previous PBF literature (e.g., Goodman-Bacon, 2021; Sun & Abraham, 2020). In this study, we offer the first evidence to date related to the direct impact of PBF research incentives and the subsequent research activities and level of state appropriations among PBF-adopting institutions.
Theoretical Framework
The theoretical framework of this study is guided by principal agent theory, which suggests that the principal (state government) pays the agent (public college or university) to carry out an objective (Jensen & Meckling, 1976; Spence & Zeckhauser, 1971). In the case of PBF policies that center research-oriented metrics, the objective relates to investing in (and ultimately producing) research in ways that can improve the prestige of the institution and a given state’s economic environment. Importantly, the logic of any principal–agent model rests on the assumption that the outcomes of the agent (e.g., investments in research activities) must be observable and measurable by both the principal and agent.
For external resource providers, such as the state government, the extent to which they can influence a public institution’s behavior depends on whether the resource being provided is deemed critical and not obtained easily by another funding source (Emerson, 1962; Harnisch, 2011). In addition, Rabovsky (2012) has reported that shifts in how states allocate resources will likely lead to the adoption of new strategies by colleges and universities seeking to enhance their performance according to the prescribed funding formula. Under a resource dependence perspective, any public colleges or universities that rely heavily on state appropriations may alter their institutional behaviors in response to changes in their state’s funding criteria, such as the introduction of a PBF metric incentivizing research activities.
PBF policies are typically created to directly tie at least a portion of public institutions’ state funding to their academic outcomes, with a particular focus on the intended outcomes of student retention and degree completion (Ortagus et al., 2020). The logical rationale of principal–agent theory coupled with a resource dependence perspective (e.g., Pfeffer & Salancik, 1978) suggests that public research universities, which rely heavily on state funding allocations, are likely to respond to the implementation of PBF in ways that will increase their ability to garner state funding by leveraging resources to improve their performance on the particular metrics states incentivize. In the case of research-oriented performance metrics, institutions may respond by reorganizing their activities in search of external resources and thereby increasing their research output and expenditures. Prior research, for example, has found that colleges in states with PBF metrics that incentivized science, technology, engineering, and mathematics (STEM) fields led to increases in STEM degree production (Li, 2020).
While PBF with STEM incentives has been effective at increasing degree production in those fields, a large body of research indicates PBF has not consistently led to improvements in overall degree production (Ortagus et al., 2020). Although principal–agent and resource dependence theories offer an explanation of how institutions may respond to state incentives, performance management research has shown that performance reform efforts frequently fail to meet their stated objectives (Radin, 2006; Thompson, 1999). This literature has noted that complex structures, organizations, and politics can limit reform efforts’ ability to improve outcomes, and in practice, can lead to unintended consequences (Radin, 2006). Prior research on PBF has noted that underresourced institutional types, such as MSIs, face capacity and financial constraints when it comes to reorganizing activities to align with PBF incentives (Hillman et al., 2014). The historic underfunding of MSIs may limit their capacity to increase research infrastructure and meet their PBF goals (Boland & Gasman, 2014; Cunningham et al., 2014; Leslie et al., 2012; Ryan, 2004), putting them at a further disadvantage when it comes to state funding linked to R&D activities. In addition, these institutions often receive a larger share of institutional revenues from state appropriations (Kelchen et al., 2020), making them simultaneously more likely to respond to state incentives but also more vulnerable if they are unable to improve on particular metrics.
Prior work has reported that traditional PBF systems disadvantage underresourced institutional types, particularly MSIs, while the same policy can considerably benefit more advantaged institutional types (Hagood, 2019; Hillman & Corral, 2018; T. Jones et al., 2017). The introduction of additional metrics in PBF programs that incentivize research and prestige-seeking behaviors may exacerbate already-existing inequities facing MSIs in PBF-adopting states. Given these dynamics, this study explores what happens after PBF policies with research incentives are introduced, focusing specifically on the institutional responses of public research universities and MSIs within these PBF systems.
Methods
Data and Sample
In this study, we use institution-level data from Integrated Postsecondary Education Data System (IPEDS), and state-level data from the Council of State Governments and the National Association of State Budget Officers. We identified every public university in the United States subject to a PBF program that includes research incentives by systematically analyzing more than 2,000 state budget or policy documents between 1997 and 2020 (Kelchen et al., 2019; Ortagus et al., 2021). These documents include state appropriation bills, state budgets, policy documents, audit reports, financial statements, higher education commission or coordinating board reports, personal communication with higher education policy makers, and other firsthand sources that provide information for the years of operation, amounts of funding at stake, sectors and institutions affected, and performance metrics of PBF policies. In addition, we leveraged the Wayback Machine when older budget or policy documents were no longer available online. These data collection procedures allowed our research team to obtain accurate information pertaining to PBF policy adoption, whether the PBF policy was actually funded, the timing of the PBF policy, and the specific PBF policy metrics. The analysis window for this study is 2002 to 2018, which is when data on research expenditures in IPEDS aligns with the years from the PBF data set.
To select institutions with comparable mission and research capacity, we restricted our sample to public 4-year universities that were classified as doctoral research universities or master’s colleges and universities based on the 2000 Carnegie classification. We included master’s institutions that annually conferred more than 40 master’s degrees because many master’s institutions are eligible to include PBF research incentives in PBF-adopting states (e.g., Tennessee and Florida). We excluded institutions that did not offer any undergraduate programs or closed between 2002 and 2018. To examine the influence of PBF with research incentives on institutional research expenditures, we excluded institutions in states that either adopted or abandoned PBF with research incentives in the first 2 years (2001–2002, 2002–2003) or the past 2 years (2016–2017, 2017–2018) as a way to ensure at least 2 years of pre- and posttreatment observations, respectively (Wooldridge, 2002). The final panel data set consisted of 17 years of observations from 374 public universities (n = 6,333), with data for some years missing for 3% of institutions.
Finally, we created an MSI indicator and created an MSI subgroup (n = 1,882) and a non–minority-serving institution (NMSI) subgroup with 263 institutions (n = 4,450) after identifying an institution’s MSI eligibility prior to 2004 defined by the Office of Postsecondary Education (2021). The 111 MSI institutions consist of 25 historically Black colleges and universities or any colleges or universities eligible to be primarily Black institutions, 49 Hispanic-serving institutions, 65 colleges or universities eligible to be Asian American and Native American Pacific Islander-Serving Institutions or Alaska Native and Native Hawaiian-serving institutions, and seven Native American-Serving Nontribal Institutions. 1 Due to the composition and size of the MSIs included in the current study, we caution the readers to interpret our findings as the average treatment effects on treated MSIs that may not be statistically generalizable to all MSIs in the United States.
Variables
The dependent variables for this study are (1) the amount of research expenditures transformed using a natural logarithm, (2) the relative share of research expenditures relative to total expenditures, (3) the annual change in the total amount of research expenditures, (4) the amount of state appropriations transformed using a natural logarithm, and (5) the annual change of total amount of state appropriations. The treatment variable is a binary indicator of an approved PBF policy that includes research incentives, with the treatment turning on or off at the institution level. By approved PBF policy, we mean a policy through which funds could be allocated based in part on institutional performance existed in state legislation or, if a state higher education agency allocated state dollars to institutions, existed in board documents. The treatment variable is coded as 1 for institutions subject to PBF policies with research incentives, and it is coded as 0 if PBF is not in place or the PBF policy does not have research incentives for the institution. Between 2002 and 2018, 64 institutions across 13 states were subject to approved PBF policies that included research incentives (see Figure 1 and Supplemental Appendix A, available in the online version of this article).

Performance-based funding (PBF) research incentives in place by state for eligible institutions.
Because the binary treatment variable only captures adoption and potentially masks the complexity of PBF policies, exploratory studies need to identify how PBF policies with varying designs affect financial outcomes of institutions, particularly those that are already underresourced (Bell et al., 2018; Ortagus et al., 2020). Thus, we used variations of the treatment indicator in additional model specifications to capture (1) if the PBF research incentives were actually funded and (2) if PBF-adopting institutions were given the option to include research incentives as part of their PBF formula (i.e., the research-oriented metric was not mandated). Among institution-year observations subject to PBF research incentives, 83.9% of the observations were actually funded and coded as 1 for the first alternative specification. Institutions with no PBF research incentive or a PBF research incentive that was not actually funded were coded as 0. The treatment variable for the second alternative specification is coded in a categorical manner, indicating whether colleges and universities are granted autonomy to choose a research-oriented PBF metric. PBF-adopting institutions that were able to opt in for research metrics (coded as 2 in this additional specification) represent 41.8% of all institution-year observations subject to PBF policies with research incentives. Institutions subject to PBF policies that mandated the use of research incentives were coded as 1. Institutions with no PBF research incentives were coded as 0.
In the outcome model examining research expenditures, we controlled for both state- and institution-level covariates that could affect the level of research expenditures or state appropriations. We included two state-level covariates: state legislative control indicating if the same party held both the legislative chamber and the governorship and the percentage of state annual appropriations allocated to higher education (Kelchen & Stedrak, 2016; McLendon et al., 2009). Institution-level variables included institutional characteristics of enrollment size and MSI status (Cunningham et al., 2014; Rabovsky, 2012), percentage of applicants admitted as a proxy for selectivity (Kim, 2018), revenues (e.g., revenue from tuition and fees per full-time equivalent [FTE] student, revenue from state appropriations per FTE student, revenue from federal, state, local/private contract and grant per FTE student, respectively; Leslie et al., 2012), and instructional cost per FTE as a proxy for competing institutional expenses (McClure & Titus, 2018). To examine the impact of PBF policies with research incentives on total state appropriations, we removed state appropriations as a control variable but instead controlled for the presence of any PBF policy for the 4-year sector (including PBF systems that did not include research incentives; Hagood, 2019). All dollar values were adjusted for inflation and online Supplemental Appendix B lists all variables and their sources used in our analyses.
Empirical Strategy
To estimate the average treatment effect of PBF research incentives on treated institutions’ institutional research expenditures and state appropriations (our first two research questions), we used a generalized difference-in-differences (GDiD) model, which allows the treatment to turn on or off for the individual institution between 2002 and 2018 (Angrist & Pischke, 2009). Specifically, the GDiD estimator (

where yij represents the outcome variables at institution i in year j.
Prior research on PBF policies has shown that PBF-adopting institutions may need to take a year or two to alter their behavior in response to policy changes (e.g., Gándara, 2019; Li & Ortagus, 2019). In practice, changes in research expenditures in particular can be lagged due to the application and award process of major grants (e.g., at least 10 months for National Science Foundation grants). To account for potential delays in institutions’ response to PBF research incentives, we estimated additional specifications modeling a 1-year lag and a 2-year lag to capture both the lagged effect under treatment and the persistent effect despite treatment suspension. Additionally, to examine whether institutional responses to PBF research incentives or level of state appropriations institutions receive differ based on an institution’s MSI status (our third research question), we estimated the equation identified above for subsamples comprised solely of MSIs and NMSIs, respectively.
To better account for the impact of PBF research incentives on institutional research expenditures and state appropriations, we selected multiple comparison groups of untreated institutions to construct counterfactual situations of institutional responses in the absence of PBF research incentives (Meyer, 1995). The first comparison group was restricted to 198 public 4-year universities that were not subject to PBF research incentives in adjacent or neighboring untreated states (Cook et al., 2008). The second comparison group was a national sample of 294 public 4-year universities that were not subject to PBF research incentives in all untreated states.
For the third comparison group, we accounted for differences across institutions by using inverse propensity score weighting (IPSW). The logic of IPSW requires researchers to leverage pretreatment covariates in order to improve balance and reduce bias by creating statistically comparable institutions in the comparison group (Guo & Fraser, 2015; Ho et al., 2007). Specifically, we estimated a logit model predicting a college’s probability of being subject to PBF research incentives conditional on all institution-level covariates and other characteristics related to the institution’s likelihood of being treated (i.e., location, affiliated hospital, medical degree conferring status; Birdsall, 2019; McClure & Titus, 2018). After removing seven institutions with extreme propensity scores (Austin & Stuart, 2015), we used the inverse of the propensity score to weight each institution based on its likelihood of adopting PBF research incentives then applied to all descriptive and regression analyses to estimate the average treatment effect of PBF research incentives on treated institutions for the third comparison group. Table 1 provides a descriptive summary of the variables for the treatment and comparison groups.
Descriptive Summary of the Variables
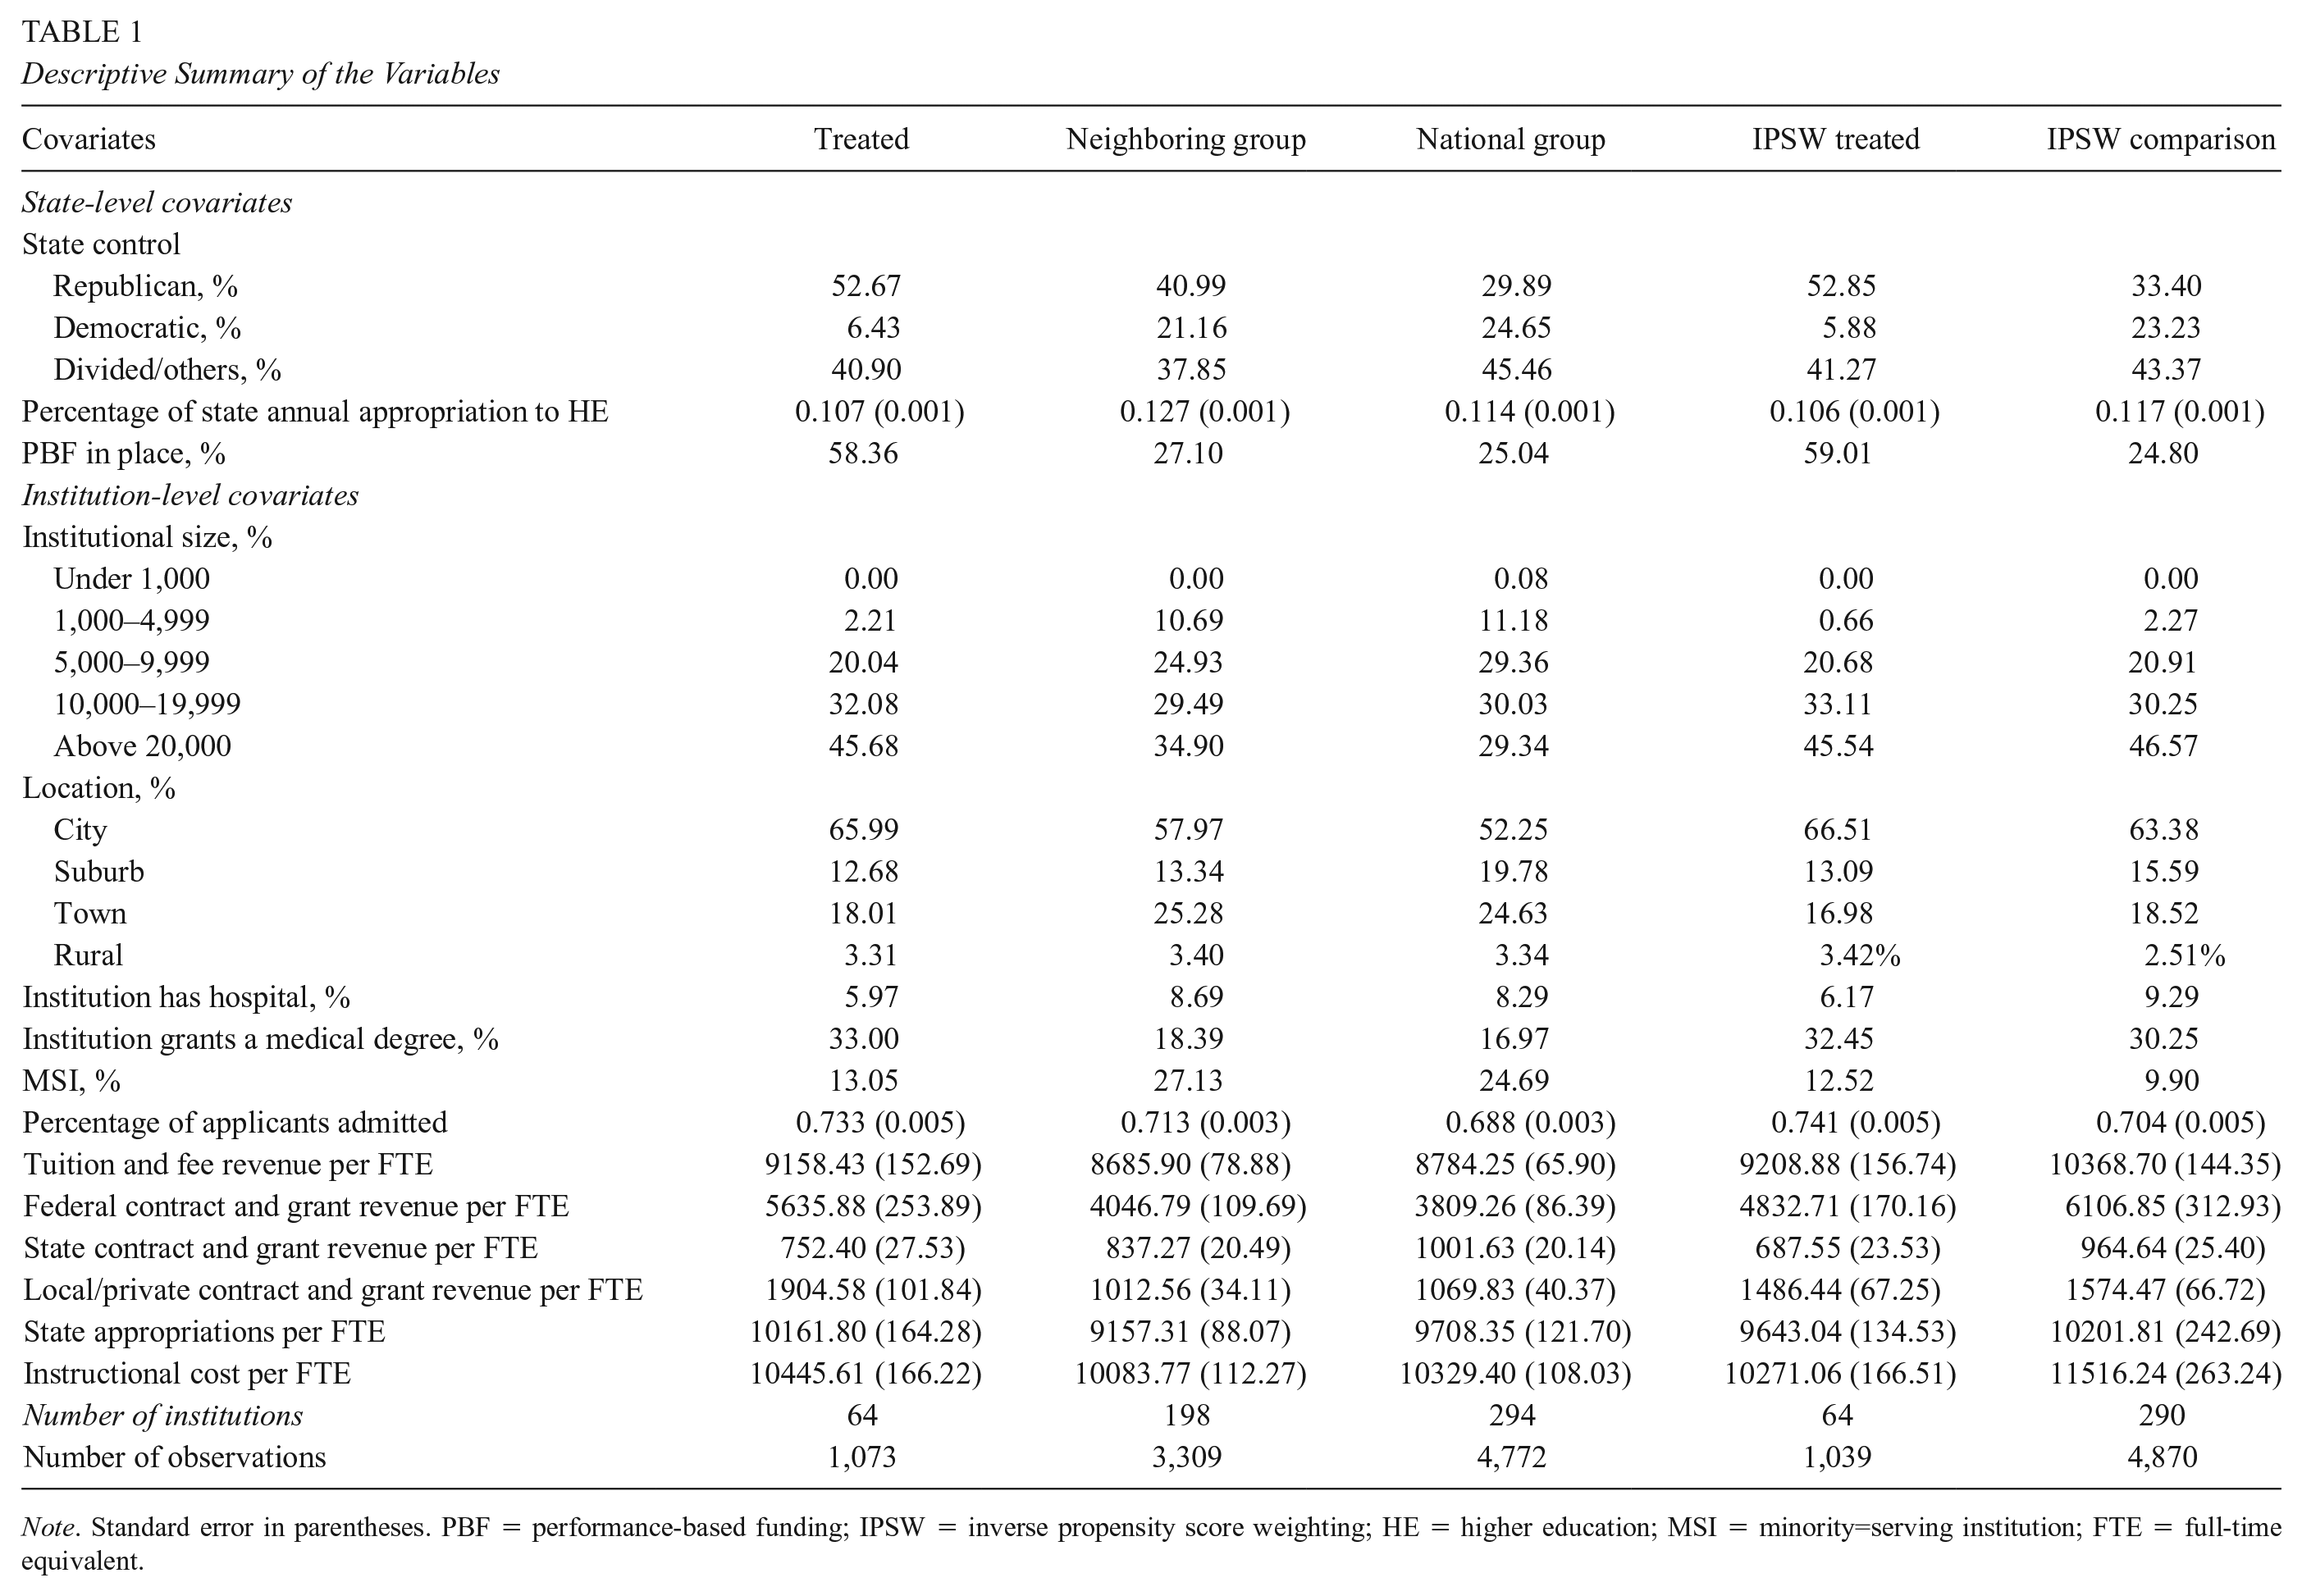
Note. Standard error in parentheses. PBF = performance-based funding; IPSW = inverse propensity score weighting; HE = higher education; MSI = minority=serving institution; FTE = full-time equivalent.
We applied the same procedure to the MSI and NMSI subsamples to create multiple comparison groups. Table 2 and Figure 2 present the balance for the unweighted and weighted groups, indicating that we met the common support assumption for the full sample and NMSI subsample. However, due to the small number of MSIs in the base year (n = 110), we did not meet the common support assumption using the IPSW approach. To create a comparison group of MSIs for the treated MSIs with PBF research incentives, we also used a coarsened exact matching (CEM) approach (see Hillman et al. [2014] and Hu et al. [2020] for examples of prior quasi-experimental work employing a CEM approach). Different from IPSW, CEM matches institutions based on select characteristics to improve balance for each variable in isolation rather than using one propensity score based on a set of covariates. In other words, CEM allows comparisons between treated and untreated observations for each variable separately without reducing balance in other covariates, and this approach is particularly appropriate given the small sample size of MSIs (King & Nielsen, 2019; Wells et al., 2013). Table 3 shows improved covariate balance after implementing the CEM procedure (Blackwell et al., 2009), including covariates based on its associated p value recommended by Rosenbaum (2002) and Rosenbaum and Rubin (1984).
Standardized Differences of the Unweighted and Weighted Sample

Note. NMSI = non–minority-serving institutions; FTE = full-time equivalent.

Estimated propensity scores pre- and postweighting.
Imbalance Measurement of the Continuous Variables Before and After CEM Procedure for MSIs
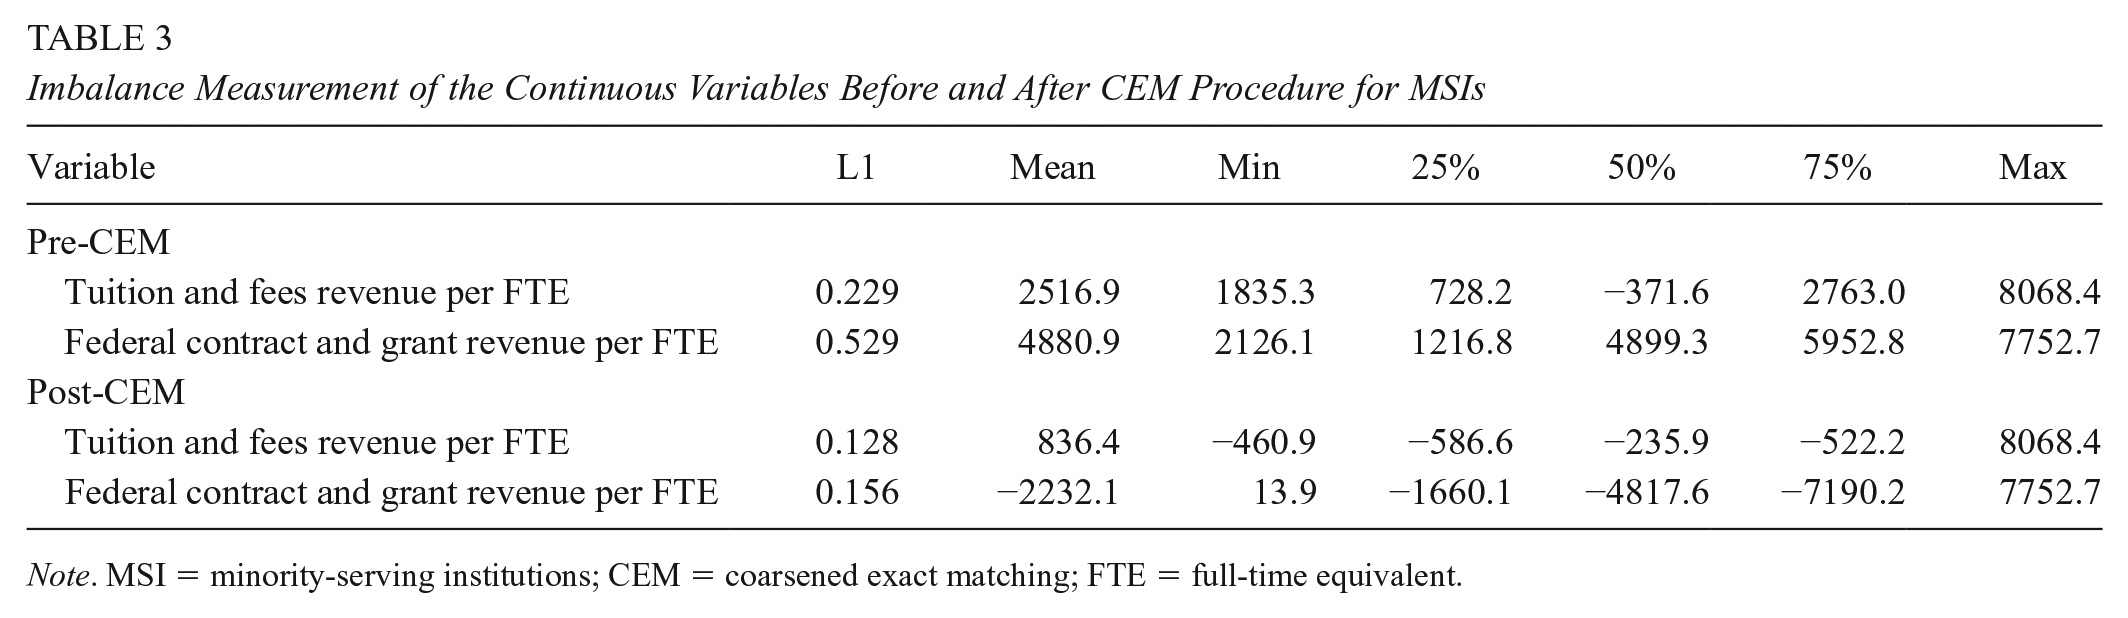
Note. MSI = minority-serving institutions; CEM = coarsened exact matching; FTE = full-time equivalent.
Robustness Checks
We used several approaches to check the robustness of our analyses. First, we included multiple comparison groups with multiple pre- and posttreatment periods (typically examining a 1- or 2-year lead and lag) to examine if the results are consistent (Furquim et al., 2020; Meyer, 1995). The lead model specifications serve as a falsification test that the treatment was largely not statistically significantly associated with the outcomes prior to the adoption of PBF research metrics for each sample. We also ran the lag model specifications for institutions that had only one adoption which stayed in effect in 2020 to address the potential difference between the lagged effect under treatment from the persistent effect despite treatment suspension. The consistent pattern across model specifications suggested that the average treatment effects of PBF research incentives on treated institutions were robust regardless of comparison samples. Additionally, we ran alternative model specifications without the institution-specific linear time trends due to the risk of overcontrolling for unit-specific trends, which can greatly reduce the power needed to detect statistical significance (Furquim et al., 2020). The results of model specifications without the institution-specific linear time trends are largely consistent with the findings of our preferred models with IPSW or CEM adjustments.
We tested the treatment effect on the treated by capturing whether the PBF research incentive was approved, whether the PBF research incentive was funded, and whether institutions have the option to opt in to including the research incentives as part of their PBF system. In additional model specifications, we controlled for the proportion of PBF funding relative to total state appropriations as a continuous variable. Specifically, nearly three quarters of treated institution-year observations (n = 799) have less than 5% of state appropriations tied to performance metrics, with the majority of treated institutions with a higher PBF dosage clustered in the state of Tennessee (n = 153). The results controlling for PBF dosage are highly consistent with the results in our preferred model specifications with IPSW or CEM adjustments.
Limitations
This study was subject to several limitations. First, according to Jaquette and Parra (2016), IPEDS finance data have inconsistencies for institutions in a parent–child reporting relationship. We excluded institutions as child records, which represents less than 1% of the sample, because their finance data were reported with the parent institutions. In all analyses, we used data disaggregated by the U.S. Department of Education’s Office of Postsecondary Education ID. We also ran model specifications including institutions in a parent–child relationship. Across alternative outcome model specifications, our findings remain highly consistent, indicating that the point estimates were not sensitive to the parent–child data limitation. IPEDS data have other inherited limitations as the survey items have changed over time, and we chose to restrict our panel data starting from 2002 to balance data consistency and sample size (Aliyeva et al., 2018; Delta Cost Project, 2011; Jaquette & Parra, 2016).
In addition, treatment with time-varying adoption between 2002 and 2018 can bias the estimator and the inclusion of institution-specific trends may not be sufficient to address potential biases (Goodman-Bacon, 2021). Unfortunately, the Goodman-Bacon decomposition test only applies to staggered treatment adoption designs in which an increasing number of institutions become treated over time. The bacondecomp command is not applicable to treatments that turn on and off with a decreased number of treated cases over time, as is the case with PBF policies with research incentives that are occasionally abandoned and readopted, so we cannot examine which comparisons are weighted the most in the aggregated treatment effect. We followed recommendations by Sun and Abraham (2020) to conduct two-way fixed-effects (TWFE) event study analyses and estimated the average treatment effects of PBF research incentives for institutions that had only one adoption between 2002 and 2018. Coupled with IPSW and CEM models, this approach allows for variation in treatment timing across multiple periods and the parallel trends assumption to hold conditional on covariates. This approach can be extremely flexible when determining control units to consider, and the treatment effect estimates do not suffer from biases associated with TWFE regressions with time-varying treatment adoption. The results for the average treatment effects on treated institutions are largely consistent with the results in our main analyses for the full sample and subgroups (see online Supplemental Appendices C and D).
Finally, the sample size in subgroup analyses is relatively small, which can lead to Type II errors (i.e., when one accepts a null hypothesis that is actually false). For example, in the subgroup of MSIs, given the existing sample size and significance level at 0.05, the statistical power of the treatment coefficient needs to be 1 to reach an effect size of 0.1 in Cohen’s f. Because it is possible that the true effect size of PBF research metrics can be smaller than 0.1 (i.e., the treatment representing less than 0.012% of variances explained, which may not be substantively meaningful from the policy perspective), the current model with existing sample size and power may not detect statistically significant results of the true effect size. Given this limitation, we urge caution in the interpretation of null results. In other words, the small number of MSIs in the sample can lead to estimation bias such that the true effect of the treatment is not detected by the current study. The specific types of MSIs included in the study should not be generalized to all MSIs as a monolith; rather, our findings should represent the average treatment effect on the treated MSIs as indicated in online Supplemental Appendix A.
Results
Descriptive Results
Table 4 presents descriptive differences in the outcome variables between the treated group and comparison groups. Before weighting, treated institutions had larger research expenditures in total ($113.9 million) relative to comparable institutions in neighboring states ($76.6 million) and comparable institutions in the national group ($67 million). Accounting for the likelihood of adopting PBF research incentives, treated institutions had lower research expenditures ($106.4 million) than comparable institutions ($117.7 million) after weighting. The relative share of total institutional expenditures allocated to research was higher for treated institutions when compared with institutions in any comparison group before and after weighting. Similarly, regardless of weighting, the average amount of state appropriations for treated institutions was consistently higher than the average amount for institutions in any of the comparison groups.
Descriptive Summary of Dependent Variable

Note. Standard error in parentheses. IPSW = inverse propensity score weighting.
GDiD Results
We report results for the full sample and MSI and NMSI subsamples, controlling for state- and institution-level covariates, institution-level and year fixed effects, and institution-specific linear time trends. Importantly, models using subsamples according to MSI status do not allow for comparisons between MSIs and NMSIs but do allow for an estimation of the treatment effect on treated institutions within the subsample of interest. Table 5 presents the treatment effect of adopted PBF research incentives on research expenditures for the treated institutions, and Table 6 presents the treatment effect of funded PBF research incentives on research expenditures for the treated institutions.
Coefficients of PBF Research Incentives on Research Expenditure

Note. Standard error in parentheses. All model specifications controlled for institution and year fixed effects, and included institution-specific linear time trends. PBF = performance-based funding; IPSW = inverse propensity score weighting; CEM = coarsened exact matching; MSI = minority-serving institutions; NMSI = non–minority-serving institutions.
p < .05.
Coefficients of PBF Research Incentives (Funded) on Research Expenditure

Note. Standard error in parentheses. All model specifications controlled for institution and year fixed effects, and included institution-specific linear time trends. PBF = performance-based funding; IPSW = inverse propensity score weighting; CEM = coarsened exact matching; MSI = minority-serving institutions; NMSI = non–minority-serving institutions.
p < .05.
Consistently, the results indicate that PBF research incentives, funded or not, are largely not significantly related to the total amount of research expenditures, the relative share of total expenditures allocated to research, or the annual change in total research expenditures for treated institutions in the full sample or MSI and NMSI subsamples. The only exception was the significantly positive relationship between treatment and the annual change in research expenditures in the 1-year lag model for the full sample. When compared with institutions in the comparison groups, the adoption of PBF research metrics is associated with a $3.11 million to $ 3.39 million increase in research expenditures, respectively (p < .05), and the funding of PBF research metrics is associated with a $2.99 million and $3.12 million increase in research expenditure, respectively (p < .05). This increase on the funding of PBF metrics seems to be driven by the annual change of research expenditures for NMSIs that treated NMSIs experienced a $2.34 million increase in research expenditure relative to untreated NMSIs in neighboring states in the 1-year lag model (p < .05). The TWFE event study analysis results are largely consistent with the GDiD findings that the adoption of PBF research metrics is not associated with institutions’ research expenditures for the treated institutions (see online Supplemental Appendix C and Figure 3). However, because of the relatively small sample size of treated MSIs, the null findings can be due to potential Type II errors such that the true treatment effect cannot be detected by this exploratory study.
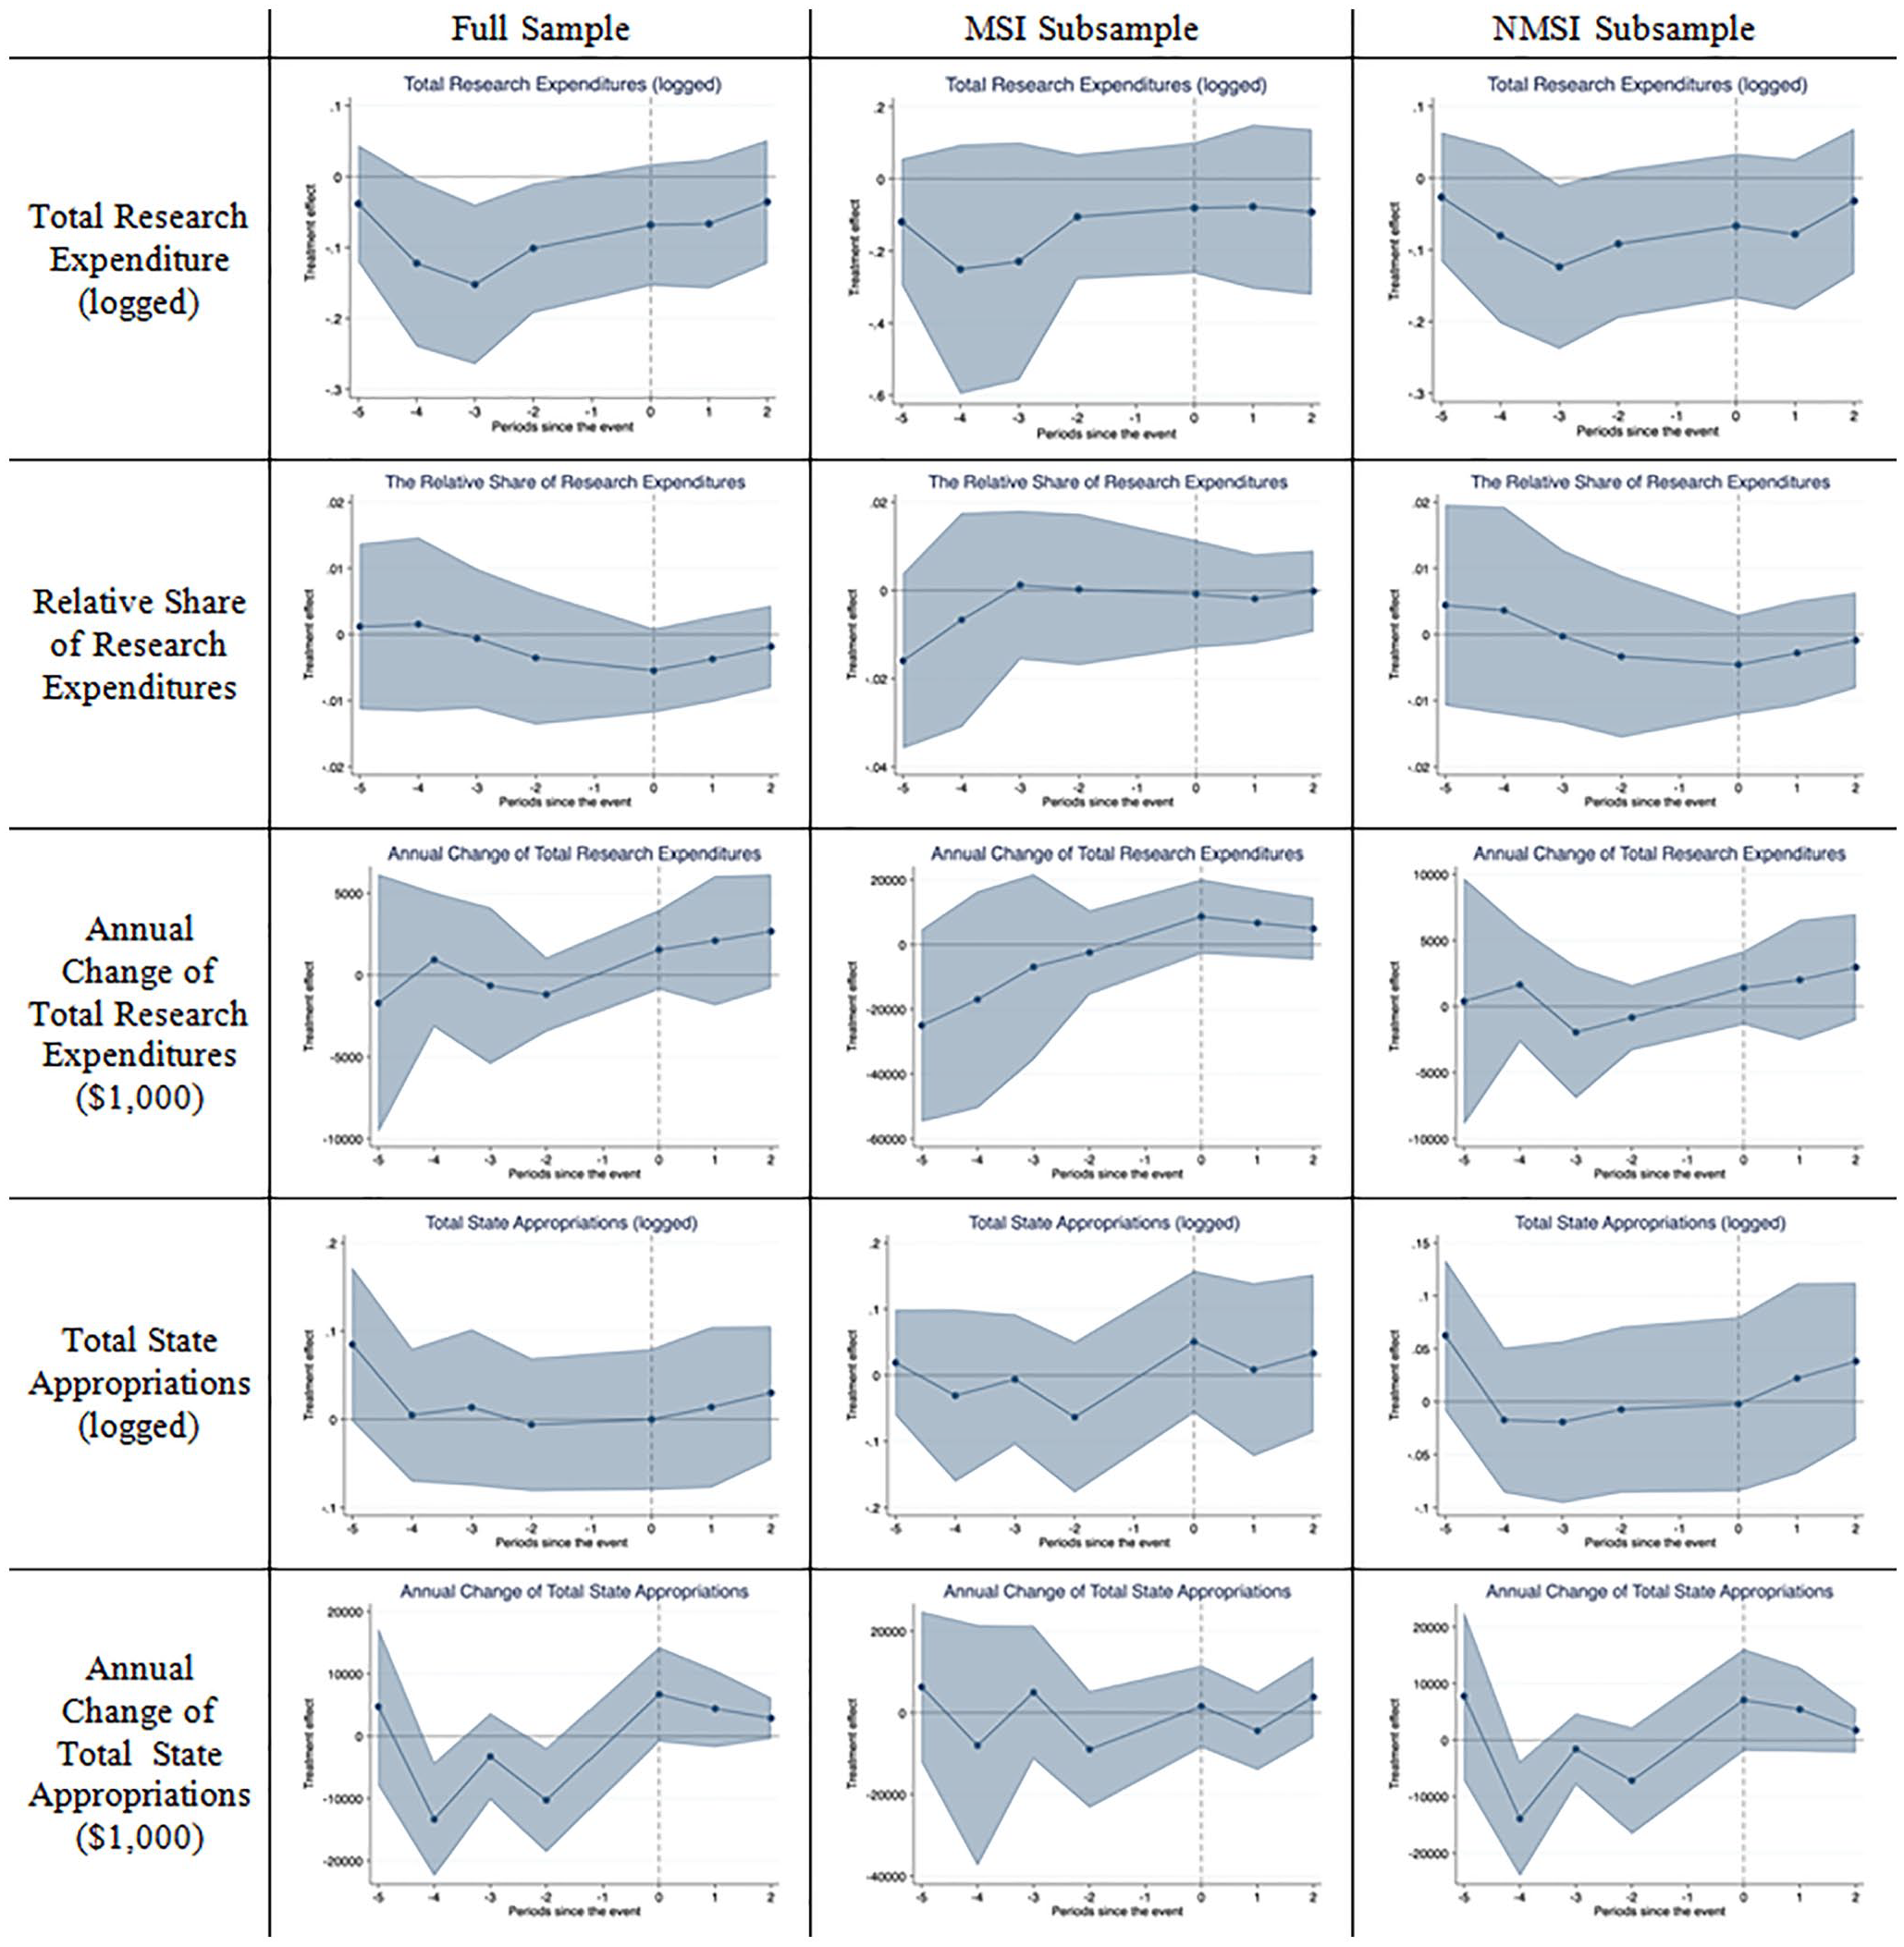
Event study of PBF research incentives for CEM/IPSW Group.
Additionally, our analysis of the total amount of state appropriations typically indicates that, funded or not, PBF research incentives are not statistically related to the total amount of state appropriations distributed to treated institutions relative to those institutions without PBF research incentives in the full sample or MSI and NMSI subsamples (Tables 7 and 8). Consistently, the TWFE event study results reveal no differences in the total amount of state appropriations between treated and untreated institutions on adopting PBF research metrics (see online Supplemental Appendix D and Figure 3). Only in one model specification, the TWFE event study results provide suggestive evidence that 2 years after the adoption of PBF research metrics, treated institutions experienced a 0.6% increase in the total amount of state appropriations received when compared with untreated institutions in the national sample (p < .05). 2 This increase appears to be driven by treated NMSIs, which experienced a 0.7% to 0.74% increase in the total amount of state appropriations received when compared with untreated NMSIs in neighboring states and the national sample 2 years after the adoption of PBF research metrics (p < .05). Similarly, though the GDiD results indicate a significant relationship between PBF research metrics and the annual change in state appropriations distributed to treated institutions for several groups, the TWFE event study results are either not statistically significant or indicate a potential violation of the parallel trends assumption. The preexisting differences in pretrends can bias the estimates, and readers should interpret the findings on the relationship between PBF research metrics and the annual change in state appropriations with caution.
Coefficients of PBF Research Incentives on State Appropriations

Note. Standard error in parentheses. All model specifications controlled for general PBF policy in place/funded, institution and year fixed effects, and included institution-specific linear time trends. PBF = performance-based funding; IPSW = inverse propensity score weighting; CEM = coarsened exact matching; MSI = minority-serving institutions; NMSI = non–minority-serving institutions.
p < .05. **p < .01. ***p < .001.
Coefficients of PBF Research Incentives (Funded) on State Appropriations

Note. Standard error in parentheses. All model specifications controlled for general PBF policy in place/funded, institution and year fixed effects, and included institution-specific linear time trends. PBF = performance-based funding; IPSW = inverse propensity score weighting; CEM = coarsened exact matching; MSI = minority-serving institutions; NMSI = non–minority-serving institutions.
p < .05. **p < .01.
Table 9 indicates the treatment effect of PBF policies with research metrics on treated institutions while accounting for specific design features of the PBF system. The results show that the option to self-select PBF research metrics as part of a PBF system is positively related to the relative share of research expenditures as well as total state appropriations for treated institutions. In other words, institutions that were able to opt into research-oriented metrics as part of their PBF system experienced a 0.8% to 0.9% increase in the relative share of research expenditures when compared with untreated institutions in the neighboring states or national samples (p < .05). The adoption of mandatory PBF research incentives, however, is associated with a decrease between 0.4% and 0.8% in treated institutions’ relative share of research expenditures when compared with untreated institutions (p < .05). The GDiD analyses also provided suggestive evidence that PBF-adopting institutions given the option to self-select PBF research incentives are positively associated with the total amount of state appropriations by 8.9% to 11.3% (p < .05) and an annual change of total amount of state appropriations between $6.2 million and $14.7 million (p < .05) relative to institutions without PBF research incentives.
Coefficients of PBF Research Incentive Types on Research Expenditure and State Appropriations

Note. Standard error in parentheses. All model specifications controlled for institution and year fixed effects, and included institution-specific linear time trends. PBF = performance-based funding; IPSW = inverse propensity score weighting; CEM = coarsened exact matching.
p < .05. **p < .01. ***p < .001.
Discussion
This national analysis of the impact of PBF research incentives provides a complex picture of what happens after a PBF-adopting state introduces research-oriented metrics, such as externally funded grants or institutional R&D expenditures. Contrary to previous research (e.g., Rabovsky, 2012), we found that PBF policies with research incentives—regardless of whether they were merely approved or actually funded—were unrelated to the total amount of research expenditures or the relative share of total expenditures allocated to research for treated institutions. This particular finding is typically robust across MSI and NMSI subsamples and event study results in alignment with recent advances in econometrics literature (e.g., Sun & Abraham, 2020).
In addition, we found that PBF research incentives are largely not related to the total amount of state appropriations allocated to treated institutions in the full sample and subsamples of MSIs or NMSIs. Although the GDiD results show some targeted increases in the annual change in research expenditures and total state appropriations for treated institutions within the subgroups of NMSIs, event study results largely indicate that no subsample of interest has statistically significant increases in research expenditures or total state appropriations, indicating that positive effects in our GDiD models and should be interpreted with caution.
One area in which there was a positive relationship between PBF research incentives and institutional research expenditures was when institutions could self-select or opt into including research incentives in their performance agreement with the state. In this case, there was an increase in the relative share of total expenditures that institutions allocated to research. On the contrary, when the research-oriented metric was mandated, institutions under the PBF research metrics policy tended to decrease their relative share of total expenditures that they allocated to research. We also found that institutions that were able to select their own research metrics saw gains in the annual change of the total amount of state appropriations as well as total state appropriations. Universities that were able to self-select or opt into being evaluated based on research performance may have done so either because they wanted to place a higher priority on research than other metrics or they knew that the research performance goals were more easily attainable for their institution than other goals. Universities that were required to use PBF research metrics may choose to prioritize other more attainable performance goals, given that their level of research expenditures can be heavily dependent on their available revenue sources and stability in funding (Leslie et al., 2012).
Although our findings do not align with prior work by Rabovsky (2012), they do align with the overwhelming majority of PBF studies suggesting that PBF policies are typically not related to their outcome of interest, such as research expenditures (Kelchen & Stedrak, 2016) and retention or degree completion (Ortagus et al., 2020). Additional work in an international context has focused to a further extent on research outcomes, suggesting that PBF adoption within European countries has a positive impact on research productivity for PBF-adopting colleges and universities (Aagaard et al., 2015; Cattaneo et al., 2016; Checchi et al., 2019; Sīle & Vanderstraeten, 2018; Vanecek, 2014). However, the funding mechanisms and accountability systems for colleges and universities in European countries are fundamentally different than those in the United States (Cretan & Gherghina, 2015), which may explain the distinctions in the present study focused on the United States and prior studies focused on international contexts.
Implications for Future Research and State Policy
These findings raise questions for future research about the effects of required versus optional metrics in PBF systems, as self-selection may occur in unintended ways when institutions are given the option to choose their own metrics. If institutions select evaluation metrics on which they are likely to excel, they may improve in these particular areas but not necessarily in other areas in which state policy makers intend. For instance, future research might examine whether institutions that select a specific set of metrics see gains in those metrics while not showing similar gains (or even showing losses) in other metrics they did not select. Prior work indicates PBF policies in some states have become something akin to a “choose your own adventure” approach to state funding with institutions selecting one or more metrics on which they will be evaluated (Rosinger et al., 2020). This study demonstrates that such an approach may lead to gains, at least in research expenditures, in the specific metrics selected but also raises questions for future research about whether improvements will happen along other metrics as well.
In the case of research metrics, research universities that are positioned to compete for federal R&D funding may stand to gain the most under PBF systems that allow institutions to select research metrics as a component of their PBF funding formula. While a growing number of universities, including some MSIs (Contreras et al., 2008; Doran, 2015; O’Meara, 2007), are engaging in striving activities that position themselves to win in competitions for research dollars, some institutions are better positioned to leverage their existing financial advantages to garner additional resources in the form of external research support (Cantwell & Taylor, 2015; Rosinger et al., 2016; Slaughter & Rhoades, 2004). Research universities with stronger political representation and external interest groups may advocate for PBF with research metrics in the policy design process (Ness et al., 2015; Tandberg, 2010). Under PBF systems with research incentives, these already-advantaged institutions are also better positioned to see gains in state resources given that a portion of appropriations is linked to research expenditures and institutional efforts to secure external R&D funds. Similarly, those same institutions may see gains in federal R&D funds as a result of their efforts, leaving a select group of well-resourced institutions that stand to potentially gain both state and federal funds under these systems.
Less-resourced institutions might reorganize activities in pursuit of external funding and, in doing so, could see gains in state support, but such efforts are not likely to yield the same returns in the form of external R&D support. After all, competition for external resources creates an environment in which some institutions are positioned to win while others are not, leading to widening inequities in resources across institutions (Cantwell & Taylor, 2015; Slaughter & Rhoades, 2004). In other words, PBF systems with research incentives offer a potential mechanism through which institutions with greater resources and prestige, which often go hand in hand, are able to have built-in advantages to pursue prestige-seeking behaviors such that their relative advantage begets further advantages (Taylor & Cantwell, 2019).
Under this scenario, PBF systems with research incentives as part of their PBF formula may widen existing funding disparities between higher education institutions, leading to yet another potential unintended consequence of PBF policies. Returning to our theoretical framework, our findings are consistent with principal-agent and resource dependence theories—that agents will respond to incentives—but also highlights how the impacts of PBF are mediated by complex structures, organizations, and politics with some institutions better positioned to leverage their greater resources to obtain more resources.
PBF systems with research incentives that institutions can opt into could serve to level the playing field for colleges and universities to be able to compete for both state funds and external research funds if lower-resourced institutions are able to reallocate resources toward prioritizing R&D activity. Since we did not find differential impacts on institutional research expenditures or state appropriations, it is possible that any institution that is able to reallocate funds toward research activities may see gains in state funding under such a policy. If so, PBF systems with research incentives that institutions can opt into could serve as one way to build research capacity of institutions within a state and thereby better position any institution to compete for both state and federal dollars.
However, findings from our study also highlight the limitations of PBF research incentives as an effective strategy for aligning institutional behavior with state workforce and economic development goals. Absent a PBF policy that allows institutions to select the metrics on which they are evaluated, we found no evidence of an impact of PBF research incentives on institutional research expenditures or state appropriations. PBF research incentives without the “choose your own adventure” option may not be an effective lever when it comes to leveraging state and institutional resources to compete for and secure external R&D funds. The limits of PBF in altering institutional behavior to improve research activities are hardly surprising given decades of empirical work demonstrating the limits of PBF policies in the higher education sector when it comes to other incentivized metrics (Ortagus et al., 2020).
Conclusion
A growing number of PBF policies have included research-oriented metrics—such as institutional research expenditures from externally funded grants and broad measures of R&D expenditures—as a way to expand the research capacity of their public colleges and universities. Although such a development can lead to improvements in innovation and economic development throughout the state, it also has the potential to exacerbate financial inequities facing underresourced institutions, such as MSIs, that may lack the financial flexibility required to build research capacity. In this study, we typically found that PBF research metrics were not related to the total amount or relative share of total research expenditures; however, PBF research incentives are positively related to the annual change in research expenditures, which captures the difference in research expenditures from the prior year. Limited and suggestive evidence of positive effects of PBF research incentives on treated institutions’ research expenditures or state appropriations appears to be driven by NMSIs, calling into question the potential for disparate impacts of PBF research incentives according to MSI status. Future research can focus on potential funding inequities among specific types of institutions (e.g., MSIs, less research-intensive, rural) to build on the current study and attempt to provide statistically generalizable findings.
In addition, exploratory analyses revealed that the specific design features of the PBF system may be an important consideration for policy makers seeking to better understand the implications of incorporating research-oriented metrics into their state’s PBF system. We showed that mandating PBF research incentives did not increase research expenditures or state appropriations, but providing the option to self-select into including research-oriented metrics had some targeted positive effects on the annual change and total amount of state appropriations for PBF-adopting institutions. Future PBF should consider the implications—for equity and effectiveness—of specific PBF policy designs to identify what works within a state policy that appears to be a firmly entrenched aspect of higher education finance throughout the United States.
Supplemental Material
sj-docx-1-ero-10.1177_23328584211071109 – Supplemental material for Disparate Impacts of Performance Funding Research Incentives on Research Expenditures and State Appropriations
Supplemental material, sj-docx-1-ero-10.1177_23328584211071109 for Disparate Impacts of Performance Funding Research Incentives on Research Expenditures and State Appropriations by Xiaodan Hu, Justin C. Ortagus, Nicholas Voorhees, Kelly Rosinger and Robert Kelchen in AERA Open
Footnotes
Notes
Authors
XIAODAN HU is an assistant professor of higher education and student affairs at Northern Illinois University. Her work has focused on the impact of state and institutional initiatives on postsecondary success of historically marginalized students, with particular attention to the community college sector.
JUSTIN C. ORTAGUS is an associate professor of higher education administration and policy and the director of the Institute of Higher Education at the University of Florida. His research examines how online education, community colleges, and various state policies affect the opportunities and outcomes of underserved students.
NICHOLAS VOORHEES is a doctoral candidate in the Higher Education Administration and Policy program at the University of Florida. His research interests include postbaccalaureate student outcomes and the impact of state policies in higher education.
KELLY ROSINGER is an assistant professor in the Department of Education Policy Studies and a research associate with the Center for the Study of Higher Education at Pennsylvania State University. Her research focuses on the barriers students face going to and through college and the impact of policies and interventions designed to improve college access and success.
ROBERT KELCHEN is a professor of higher education and the head of the Department of Education Leadership, Management and Policy at the University of Tennessee, Knoxville. His research interests include higher education finance, accountability policies and practices, and student financial aid.
References
Supplementary Material
Please find the following supplemental material available below.
For Open Access articles published under a Creative Commons License, all supplemental material carries the same license as the article it is associated with.
For non-Open Access articles published, all supplemental material carries a non-exclusive license, and permission requests for re-use of supplemental material or any part of supplemental material shall be sent directly to the copyright owner as specified in the copyright notice associated with the article.