
Abstract
We examine how teachers from two alternative preparation programs—Teach for America (TFA) and Kansas City Teacher Residency (KCTR)—contribute to the teacher labor market in and around Kansas City, Missouri. TFA and KCTR teachers are more likely than other teachers to work in charter schools and, more broadly, in schools with more low-income, low-performing, and underrepresented minority (Black and Hispanic) students. Teachers from both programs are more racially/ethnically diverse than the larger local-area teaching workforce, but only KCTR teachers are more diverse than other teachers in the same districts where they work. We estimate value added to achievement for teachers in both programs compared with nonprogram teachers, with the caveat that our KCTR sample for this analysis is small. In math, we find large positive impacts of TFA and KCTR teachers on test score growth; in English language arts also, we estimate positive impacts, but they are smaller.
Keywords
It is well documented that urban school districts have difficulty recruiting and retaining high-quality teachers (Boyd et al., 2005; Boyd et al., 2006; Lankford et al., 2002; Papay et al., 2017). Moreover, accountability policies and improved measures of teaching effectiveness have exacerbated staffing challenges in high-need schools (Bates, 2020; Cullen et al., 2021). Although policy efforts in some states designed to combat these challenges have had some success, teacher recruitment in urban areas remains difficult (Glazerman et al., 2013; Springer et al., 2016; Swain et al., 2019).
Alternative teacher preparation programs (ATPPs) can be a source of labor supply in localized labor markets that face supply-side challenges. Indeed, many ATPPs explicitly build this idea into their mission statements. A well-known example is the national Teach for America (TFA) program, which we study here. Regional programs with similar goals include the New York City Teaching Fellows, Mississippi Teaching Corps, Boston Teacher Residency, and Kansas City Teacher Residency (KCTR; which we also study), among others.
Compared with traditional, university-based preparation programs, which remain the predominant pipeline into the teaching profession nationally, some ATPPs provide an accelerated pathway into the classroom. A rationale for these programs is that rigid licensing requirements create barriers to entry that keep qualified teachers out of the classroom. By reducing these barriers, ATPPs can increase the appeal and accessibility of the profession for a broader population of teachers. There are also economic reasons to expect the expanded pool to include more effective teachers. Sass (2015) explores this possibility by studying a variety of ATTPs in Florida, and he finds that programs that require the least education-specific training yield the most effective teachers, as measured by value added to student achievement. From this, he concludes that “any benefits from preservice training are overwhelmed by the adverse selection into programs that require [more training specific to the field of education]” (p. 1).
Other ATPPs are not designed to reduce preparation time relative to traditional programs but rather shift the aspects of training that are emphasized during the preparation period. Teacher residency programs fall into this category. For example, Solomon (2009) characterizes the Boston Teacher Residency program as locating “teacher preparation in classrooms rather than in the academy” (p. 478) and writes that residency programs “[do] not question the need for preparation, but rather seek to find better ways to recruit and prepare . . . teachers” (p. 479). Guha et al. (2016) describe residency programs as offering recruits “strong content and clinical preparation specifically for the kinds of schools in which they will teach” (p. 2). Krieg et al. (2020) provide empirical evidence in support of this strategy, finding that first-year teachers are more effective when placed in classrooms with student demographics similar to their student teaching assignments.
We examine how two ATPPs—TFA and KCTR—contribute to the local teacher labor market in and around Kansas City, Missouri. TFA is an example of an “accelerated pathway” program, whereas KCTR is an example of an “intensive but alternative” program. The city school district, Kansas City Public Schools (KCPS), is a high-poverty urban district with low achievement. The surrounding districts are more advantaged than KCPS, albeit marginally in some cases, and there is a large and vibrant charter sector in the area. The study of Kansas City is useful on its own merits because Kansas City is a major urban area with a large student population. More broadly, when combined with evaluations of ATTPs in other major U.S. cities, our work contributes to an increasingly broad understanding of how ATTPs affect urban teacher labor markets.
We address two primary research questions in our study: First, how are TFA and KCTR teachers deployed in schools in and around Kansas City, and how do they affect local-area teacher diversity? 1 We show that teachers from both programs are placed disproportionately in charter schools—and more broadly in schools with larger shares of low-income, low-performing, and underrepresented minority (URM; which we define as Black and Hispanic) students. In terms of their own diversity, TFA and KCTR teachers are more diverse racially/ethnically than other teachers in the larger local-area labor market. However, only KCTR teachers are more diverse than other teachers working in the same districts, but this result is only suggestive (i.e., the differences are not statistically significant). TFA, KCTR, and the larger teaching workforce in the Kansas City area are all female dominated, although TFA and KCTR are modestly improving their diversity along the dimension of gender.
Our second research question is about the efficacy of TFA and KCTR teachers: Do teachers from these programs outperform other teachers in terms of improving student achievement? We answer this question using estimates of value added to test scores in math and English language arts (ELA) in Grades 4–8. We find that TFA teachers raise student scores by 0.11 and 0.03 standard deviations in math and ELA, respectively, compared with nonprogram teachers, on average. We similarly find that KCTR teachers increase student achievement by 0.15 and 0.05 student standard deviations in math and ELA, respectively, although a caveat to our KCTR results is that the sample of teachers for whom we can estimate value added is small.
In a final, supplementary analysis we examine teacher retention among teachers who enter the labor market via these programs. TFA teachers have higher retention after 1 and 2 years of service, but by Year 5, they are less likely to remain as teachers in the Kansas City area than nonprogram teachers. Early-career retention for KCTR teachers is far above that of other teachers in the same districts, which is consistent with the KCTR’s program structure (and the structure of similar residency programs).
Brief Program Descriptions and Prior Research
Teach for America
TFA recruits high-performing college students who commit to teach for 2 years in a low-income community where TFA has partnered with local school districts. TFA emphasizes three aspects of the ideal candidate’s mind-set: The candidate (1) shares the program’s core belief that all children deserve the opportunities afforded by a high-quality education, (2) has a leadership mind-set, and (3) has the ability to innovate in the classroom. The application process involves completing an online application and a one-on-one interview, which includes delivery of a sample lesson.
Preplacement TFA training occurs during the summer preceding placement. It varies by region but typically involves a 5- to 7-week accelerated training program, which includes teaching practice and coaching, plus a 1- to 2-week regional induction and orientation program. TFA partners with local certification programs to help corps members pursue full teacher certification during the 2-year commitment period. Donaldson and Johnson (2011) find that the majority of TFA teachers continue to teach beyond the 2-year commitment, although the TFA exit rate increases significantly from the second to the third year.
Our investigation of TFA placements follows on existing evidence showing that TFA teachers are more likely to be placed in classrooms with high percentages of low-income and URM students (Backes et al., 2019; Backes & Hansen, 2018; Kane et al., 2008). This is not surprising—as noted by Decker et al. (2004), TFA operates in “schools that serve disadvantaged students, have limited resources, and typically face substantial teacher shortages.” (p. 11). These studies also show that TFA teachers are less racially/ethnically diverse than teachers from other pathways in the same districts and schools. We provide new evidence on TFA teachers and their placements from Kansas City.
Our value-added analysis contributes to a large existing evidence base on the efficacy of TFA teachers relative to other teachers. Decker et al. (2004) use a within-school randomized research design to study the effects of TFA teachers on student achievement in math and ELA and find that TFA teachers raise student achievement in math by about 0.15 student standard deviations relative to control teachers in the same schools. Backes et al. (2019) use value-added models and data from Miami-Dade County and find that TFA teachers outperform other teachers by about 0.10 student standard deviations in math. Xu et al. (2011) study TFA effects on achievement in high school and find that TFA teachers increase math test scores by about 0.13 student standard deviations. In terms of effects in ELA, TFA value added is smaller (Backes et al., 2019; Decker et al., 2004; Kane et al., 2008), although in high school, Xu et al. (2011) find that TFA teachers have similar effects on math and English achievement.
Two studies of TFA show results that differ substantively from the findings described in the previous paragraph (Boyd et al., 2006; Kane et al., 2008). Both are from New York City and find small-to-null TFA effects in math and null-to-negative effects in ELA. 2
Kansas City Teacher Residency
KCTR is an urban teacher residency program operating in the Kansas City area. Residents are college graduates who train with a mentor, receive coaching, and enroll in a master’s program through the University of Missouri-Kansas City. KCTR participants earn credit toward their master’s (MA) degree and teach 4 days a week for a full academic year in their mentor’s classroom during the residency year. At the end of the residency year, residents become certified teachers in Missouri and agree to teach in a high-need school in Kansas City for 3 additional years. During the first postresidency year, program participants complete their MA degree. They continue to receive instructional coaching throughout the 3-year postresidency commitment.
The KCTR recruitment process emphasizes finding individuals whose mind-sets are aligned with program goals—namely, individuals who believe that teachers play an important role in student success and who are interested in personal growth. Teachers are selected into the program through a multistep process that culminates in a rigorous “selection day,” where prospective entrants are interviewed by partnering school principals and complete a teaching demonstration. The residency year is demanding as participants are required to attend class and complete their coursework while simultaneously maintaining their responsibilities at their residency schools.
The average age of entrants into KCTR is 30 years. Program staff attribute this in part to the multiyear commitment, which is less appealing to younger candidates. The extended commitment, along with supports to promote teacher improvement and retention during the full KCTR term, is a common feature of residency programs (Solomon, 2009). KCTR allows for what staff refer to as “healthy exit points” in acknowledgment that not everyone who enters the program will succeed (for a variety of reasons), although most entrants complete the program. The most common exit point for those who do leave is after the second year.
Despite the strong interest in the teacher residency model among teacher educators (Guha et al., 2016), our results for KCTR contribute to a very sparse empirical literature on the placements and efficacy of teachers from residency programs. We are aware of just two previous points of empirical evidence. First, Papay et al. (2012) find that teachers from the Boston Residency Program are more demographically diverse (by gender and race/ethnicity) than nonresidency teachers. Residency teachers have negative impacts on student achievement in math but positive performance trajectories. The other efficacy evidence is from the Memphis Teacher Residency, which is evaluated as part of Tennessee’s Report Card on the Effectiveness of Teacher Training Programs (Tennessee Higher Education Commission, 2014). The report shows that residency teachers are more demographically diverse than the statewide teaching workforce and presents mixed results on their efficacy relative to other teachers, although the evidence is more positive than negative.
Data and Methods
Data
We received comprehensive lists of the TFA and KCTR participants placed in Missouri schools from the programs themselves. The data include the year and school of each participant’s initial placement after the training. Our TFA data cover seven cohorts who received training between Fall 2011 and Fall 2017 (inclusive). KCTR is a newer program, and the first postresidency cohort was not placed until Fall 2017; from KCTR, we received program placement lists for the three cohorts that began their teaching placements in Fall 2017, Fall 2018, and Fall 2019. Hereafter, we refer to each school year by the spring year—for example, 2017–2018 as 2018.
We matched the listed participants to their employment records in administrative data provided by the Missouri Department of Elementary and Secondary Education (DESE). The DESE data provide additional information about the participants themselves, their placements, and their students. We were able to match all of the teachers on the program lists with the DESE data.
Table 1 shows the counts of program participants by the year of the first postprogram placement, again noting that school years are denoted by the spring year (a small number of TFA teachers entered the workforce with a lag, which is why there are a few TFA placements in 2019 and 2020). The table also identifies the number of participants in each program whose first placements were in teaching positions—who are the focus of our analysis. As expected, the vast majority were placed in teaching positions. Exceptions include a small number of individuals whose initial placements were not in standard teaching roles. For our descriptive analysis, we analyze all teaching placements. For our efficacy analysis based on value added to student achievement, we use teachers of math and ELA in Grades 4–8, for which sample details are provided. The value-added sample includes “self-contained” elementary teachers and subject-specific teachers in higher grades.
Teacher Counts by Program and the First Postprogram Placement Year

Note. TFA = Teach for America; KCTR = Kansas City Teacher Residency.
TFA provided placement data for cohorts through 2018. The handful of post-2018 TFA placements are teachers who completed their TFA training in an earlier year but delayed entry into the workforce. bNonteaching positions include central office positions, individuals listed as working in special centers, and teacher coaches, among other positions.
Methods: Descriptive Labor Market Analysis
We begin by describing the composition of teachers and their initial teaching placements for each program compared with other public school teachers in the Kansas City area. To define the “local labor market area” or “Kansas City area,” we retrieved the address of the central office for each local education agency (LEA) operating over the span of our data from 2012 to 2020. An LEA is a public authority within a state that has administrative control over public elementary or secondary schools; in practice LEAs consist of both traditional school districts and charter school operators. We define the local labor market area as including all LEAs with a Kansas City, Missouri, address. There are 30 such LEAs, including charter authorizers. We also include two additional LEAs with addresses in nearby Independence and Raytown (which are each about 8 miles from central Kansas City). In total, we define the area to include 32 LEAs, which combine to represent the region of effect for the programs we evaluate. 3 For ease of presentation, we use the terms “LEA” and “district” interchangeably in the text that follows.
Table 2 lists the 32 LEAs (or districts), ordered from highest to lowest by the percentage of local-area nonprogram teachers employed. Noting that the vast majority of local-area teachers are nonprogram teachers, the ordering is essentially by size. For each focal program, we report the percentage of teachers in our sample from that program placed in each district. For ease of presentation, the data are aggregated for programs over relevant years in the 2012–2020 range.
Teacher Placement Percentages Across Districts in the Kansas City Area, Combined Across All Years
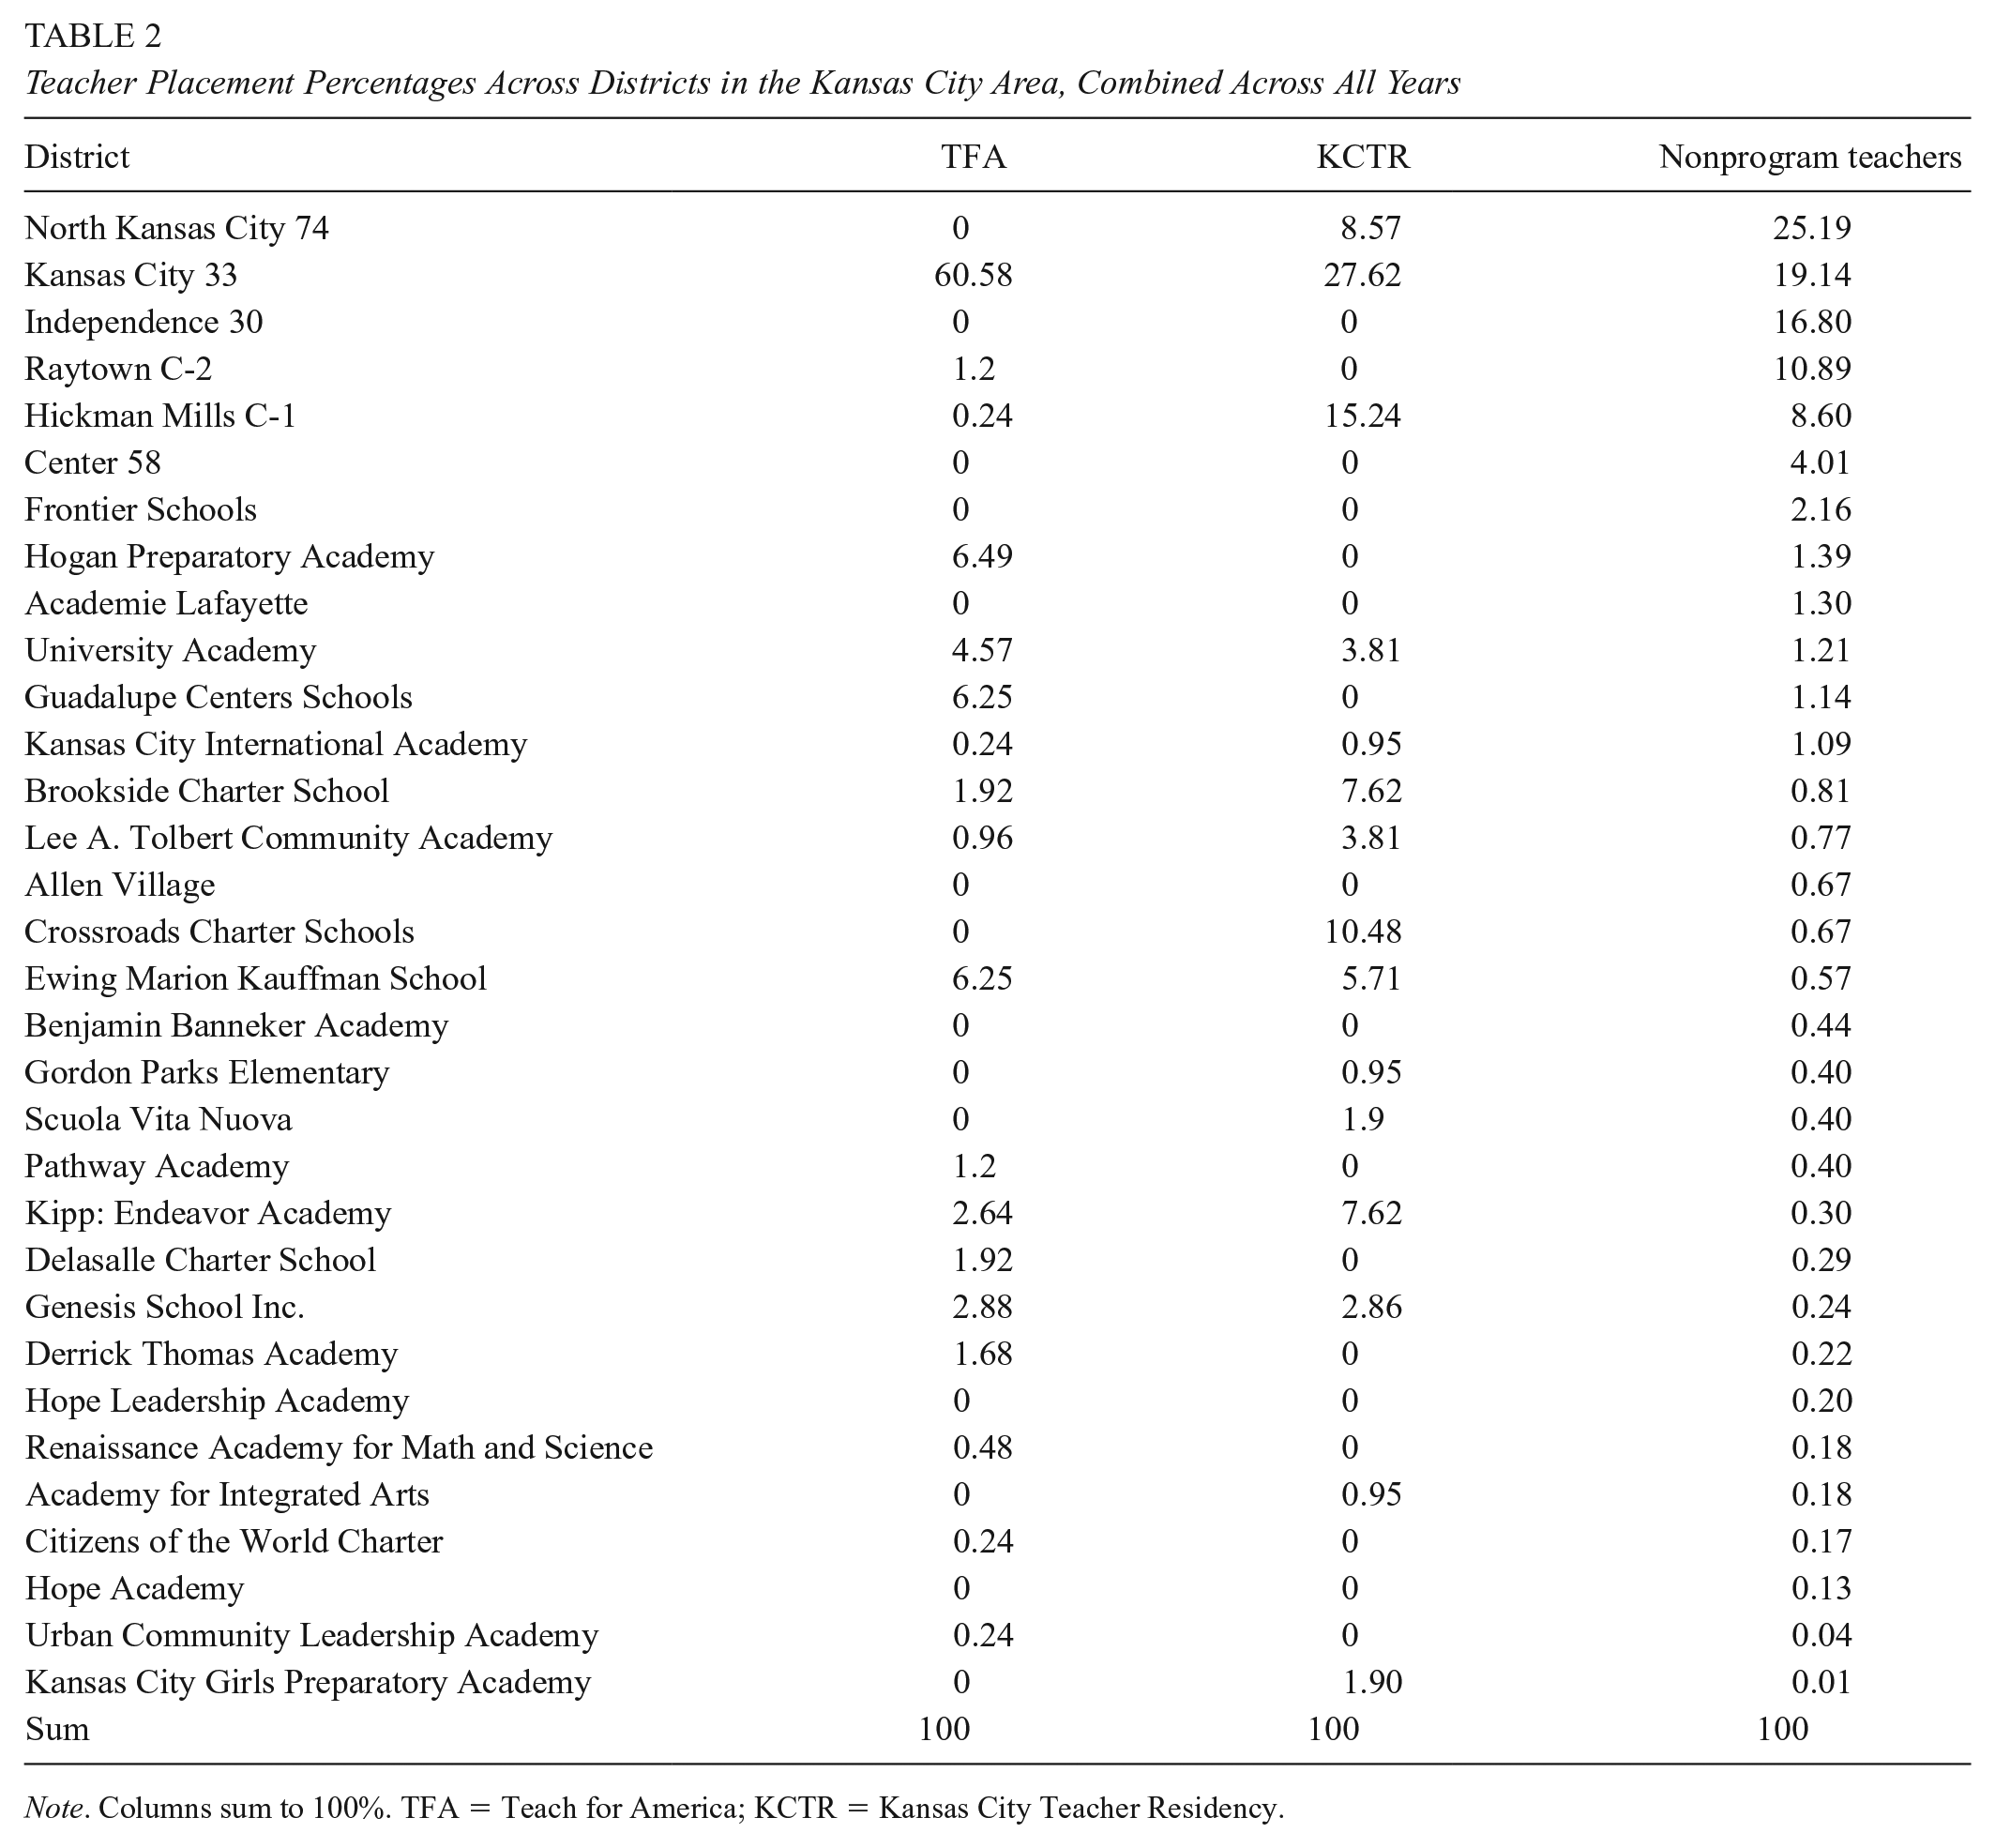
Note. Columns sum to 100%. TFA = Teach for America; KCTR = Kansas City Teacher Residency.
The primary takeaway from Table 2 for KCTR and TFA is that they disproportionately place teachers in the central city school district, KCPS. More than 60% of TFA teachers are placed in KCPS, whereas no other LEA has a double-digit share of TFA teachers. KCTR’s representation in KCPS is also large—it accounts for about 27.6% of KCTR placements—but smaller than for TFA. Other districts with double-digit shares of KCTR teachers include Hickman Mills and the network of Crossroads Charter Schools. North Kansas City is the largest school district in the region (based on total enrollment and workforce size), but it employs relatively few program teachers, all from KCTR. The North Kansas City student population is much wealthier than the neighboring KCPS population and has a lower share of URM enrollment.
We compare the composition of teachers and their placements from each program with other teachers in terms of (a) the sector (charter or not), level (elementary, middle/junior high, or high school), and subject of the placement; (b) the characteristics of students in the school; and (c) teachers’ own race/ethnicy and gender. 4 Each program is compared with the local area in two different ways. First, we compare program teachers with the teaching workforce in the Kansas City area as a whole using a simple teacher-weighted average from all 32 districts listed in Table 2 over the years 2012–2020. This tells us how teachers from each program compare with the larger teaching workforce in the area.
Second, we make program-specific comparisons using district-by-year weighted averages that are unique to each program. The district-by-year weights are program-specific teacher shares of initial placements. As an extreme (hypothetical) example, suppose that of the 32 districts we identify in the larger Kansas City Area, just two receive any TFA teachers. In this scenario, the program-specific comparison of TFA would involve just the two districts where TFA places teachers (further weighted by the TFA placement shares across the two districts), not all 32 districts. These comparisons tell us how teachers from each program compare with other teachers working in the same districts and years as the program placements. They will differ from the simple comparisons described in the preceding paragraph to the extent that the districts that employ program teachers differ from those that do not within the Kansas City area.
Formally, the district-by-year weighted-average values for the latter comparisons are constructed as follows. For characteristic X and program j, which sends teachers to districts k in years t, the weighted-average value is calculated as

The weighting variable
Both the simple-average and district-by-year-weighted comparisons are useful for understanding the ways in which the programs influence the regional labor market. For each comparison, we test whether the focal-program mean is statistically different from the comparison-group mean. The weighted comparisons are much less precise due to the weights, meaning that in some cases a substantive difference in means is not statistically detectable in these comparisons. We interpret such instances cautiously in acknowledgment of the ambiguity in their interpretation. 5
Efficacy Analysis
We estimate the effects of teachers from each program on student achievement in Grades 4 to 8 in math and ELA, on average, compared with nonprogram teachers during the period 2012–2019 using the following value-added model, structured following Koedel, Mihaly, et al. (2015):

In Equation 2,
The vector
We estimate value added for the subsample of teachers in Grades 4 to 8 in math and ELA. We exclude 2020 data from the value-added analysis because, like other states, Missouri halted 2020 testing due to the COVID pandemic (this has a disproportionate effect on our KCTR sample, per Table 1). In math, our value-added analysis includes 146 TFA teachers and 20 KCTR teachers. In ELA, the analogous teacher sample sizes are 147 and 24, respectively (some of these are overlapping—i.e., self-contained teachers in elementary schools). Due to the clustering structure of the models, the teacher sample sizes are the key determinants of statistical power. Our large TFA sample allows for fairly precise inference regarding program-level value added. Our standard errors for the KCTR estimates are larger; they are still informative, but future research on KCTR (and other teacher residency models) would benefit from analyses at greater scale. A general challenge is that teacher residency programs are often small (Guha et al., 2016) and only a fraction of teachers are placed in tested grades and subjects. For example, the sample of residency teachers in Papay et al. (2012)—the only other published study of a residency program we are aware of that estimates value added—is similarly modest in size (N ≈ 50).
Results
Descriptive Analysis
Figures 1 to 4 document the compositions of program and nonprogram teachers along the dimensions described above. The figures are structured so that there is one graph for each program in each figure. For a given characteristic, the blue bars show average values for teachers in the focal program. The orange bars show average values for nonprogram teachers in the local area—that is, simple averages across all nonprogram teachers in the districts listed in Table 2. The gray bars show district-by-year weighted-average values for nonprogram teachers as calculated by Equation 1; that is, they show values for the same district-year cells in which teachers from the alternative-certification program were placed. 11 Solid orange and gray bars indicate that the value compared with the blue bar (i.e., the focal-program mean) is statistically different at the 10% level or better. In the appendix, we provide data tables with all of the information presented in the figures (Appendix Tables A1–A3). In addition, the appendix tables show comparisons restricted to only novice teachers (0–2 years experience) and provide some additional details that we omit from the figures for ease of illustration.

Teacher placements by school type (i.e., charter or not) and level (elementary, middle/junior high, or high school).

Teacher placements by the characteristics of students attending the initial placement school.

Teacher placements by the standardized achievement level of students attending the initial placement school in math and English language arts (ELA).

Teachers’ racial/ethnic and gender designation percentages.
We illustrate the substantive difference between the orange and gray bars in the figures using TFA as an example. Returning to Table 2, note that KCPS employs 19.14% of all nonprogram teachers in our sample, and thus the orange bars in our comparisons involving TFA (implicitly) give a 19.14% weight to KCPS when setting the comparison group. However, TFA places 60.58% of its teachers in KCPS. The gray bars reweight KCPS so that it has a 60.58% weight in the TFA-specific comparison group. In other words, the orange bars are for the local area as a whole, while the gray bars are for other teachers in the districts (and years) that match TFA’s own placement profile.
Beginning with Figure 1, we document teacher placements in terms of the schooling level and whether the placement is in a charter or noncharter school. About 48% of TFA teachers in our sample were placed in elementary schools. This value is below the simple average of the local area and the TFA-specific weighted-average comparison group in the same districts and years, which are both about 55% (although the comparison with the local-area weighted average is not statistically significant due to the aforementioned reduced precision of the weighted comparisons). Thus, from the first set of bars, we conclude that TFA teachers are less likely than other teachers in the local area to teach in elementary schools. The graph shows that the underrepresentation of TFA teachers in elementary grades is made up in high schools, where TFA teachers are disproportionately likely to be placed. In contrast, the figure shows that KCTR teachers are more likely to be placed in elementary schools and less likely to be placed in high schools relative to the larger local-area labor market.
The final set of bars in each graph in Figure 1 shows the percentages of teachers across all schooling levels placed in charter schools. TFA and KCTR teachers are much more likely to teach in charter schools than the average nonprogram teacher, which highlights the charter sector’s disproportionate reliance on these programs for staffing. As indicated by the blue bars, the charter percentages for TFA and KCTR are about 38.0% and 49.5%, respectively. In comparison, just 15.5% of nonprogram teachers in the area teach in charter schools (as indicated by the orange bars). 12
Next, in Figure 2, we document average student characteristics at the teachers’ placement schools. The structure of the figure is the same as for Figure 1. We compare the program teachers’ placement schools using four school-level student characteristics: (1) the URM enrollment percentage (note that given the demographics of the local area, the URM percentage primarily captures the percentage of students who are Black), (2) the FRL-eligible enrollment percentage, (3) the percentage of students on an IEP, and (4) the percentage of ELL students. 13
Program teachers are much more likely than nonprogram teachers to work in schools with higher URM student populations. This can be seen by the large gap between the blue and orange bars in each graph corresponding to the URM percentages. However, this gap disappears when we compare the blue and gray bars (i.e., the blue and gray bars show nearly identical values). This is informative about the mechanism by which program teachers are disproportionately working with high URM populations. Specifically, it means that the sorting is all occurring at the district level. Or put another way, conditional on the district and year of the placement, teachers from the focal programs are working in schools with similar URM percentages as other, nonprogram teachers. But because the districts in which they are placed are high-URM districts, their exposure to URM students is higher than the local-area average.
With respect to student FRL and ELL percentages, a qualitatively similar pattern plays out for each program, with modest variability in the magnitude of exposure gaps between program and nonprogram teachers. There are no differences in schools’ IEP percentages between program and nonprogram teachers.
Figure 3 provides related evidence using average standardized test scores at the teachers’ placement schools. We make two notes about these comparisons. First, average test scores in all teachers’ schools, even in the larger sample of nonprogram teachers, are large and negative in both subjects. This is because we standardize scores using the state distribution. The implication is that the average student in the Kansas City area (as we have defined it) performs below the state average. Second, the test score results in Figure 3 are descriptive only. They may embody some program effects to the extent that program teachers affect test scores, about which we provide some evidence below. However, noting that nonschooling factors explain the majority of the variance in student test score levels (Nye et al., 2004), and since program teachers represent just a small fraction of the local-area workforce, our primary use of school-average test scores here, as in the previous figures, is to provide information about placement context.
Figure 3 shows that both TFA and KCTR teachers are placed in schools with substantially lower test score levels compared with other local-area teachers, as indicated by the large gaps between the blue and orange bars for these programs in Figure 3. Again, the gaps shrink and become statistically insignificant when we use the program-specific weighted averages (gray bars), although they do not completely close as in the comparisons in Figure 2. The fact that they mostly close points to district placements, and not school placements within districts, as the primary mechanism that drives the sorting of TFA and KCTR teachers into schools with lower achievement. But the suggestive evidence that the gaps do not close all the way indicates that there may be additional (albeit modest) within-district sorting of TFA and KCTR teachers that leads them to teach in lower-achieving schools compared with other teachers in the same districts and years. In Appendix Tables A2b and A2c, we show that the small, insignificant gaps that remain in the weighted-average comparisons are partly explained by teacher experience. Specifically, noting that TFA and KCTR teachers are themselves inexperienced, if we restrict the weighted comparison group for each program to include only inexperienced nonprogram teachers, the nominal achievement gaps between program and nonprogram teachers decline further. 14
We additionally note one other finding from the achievement comparisons not shown in Figure 3 but given in the appendix: The sorting patterns of program teachers in tested grades and subjects largely mirror the sorting patterns of all program teachers discussed thus far. This presents useful context for the subsequent results from the value-added models.
Finally, Figure 4 documents the racial/ethnic and gender compositions of program teachers relative to the local area. We divide teachers into the following racial/ethnic groups: Asian/Pacific Islander, Black, Hispanic, White, and Other (the Other category is suppressed in Figure 4 for ease of presentation, but results are available in Appendix Tables A3a–A3c). Compared with local-area teacher demographics overall, as represented by the orange bars, both programs are at least modestly diversifying, with generally larger percentages of Asian/Pacific Islander, Black, and Hispanic teachers, and smaller percentages of White teachers, than the local-area average. KCTR is the most diverse program, particularly with respect to the percentage of Black teachers (37%, which is about 2.5 times higher than the local-area average of about 13.6%). When we compare program teachers with other teachers in the same districts and years (gray bars), KCTR teachers are at least suggestively more diverse racially/ethnically than their nonprogram teaching peers; however, TFA teachers are a less diverse group. 15
We also examine gender diversity. Like the national teaching workforce, the workforce in the Kansas City area is female dominated, as is each focal program. That said, both TFA and KCTR are modestly diversity-improving along the dimension of gender.
Efficacy Analysis
Figure 5 shows the value-added results for teachers in Grades 4 to 8. We estimate four different models for each subject, which are all variants of Equation 2. Nonprogram teachers are the holdout group, which normalizes their (average) value added to 0. A solid bar in the figure indicates that the estimate for the program is statistically distinguishable from the average value added of nonprogram teachers at the 10% level or higher, and a clear bar indicates that the estimate cannot be distinguished from the value added of nonprogram teachers. The results underlying the figure are also available in tabular form in Appendix Tables A4 (for math) and A5 (for ELA).
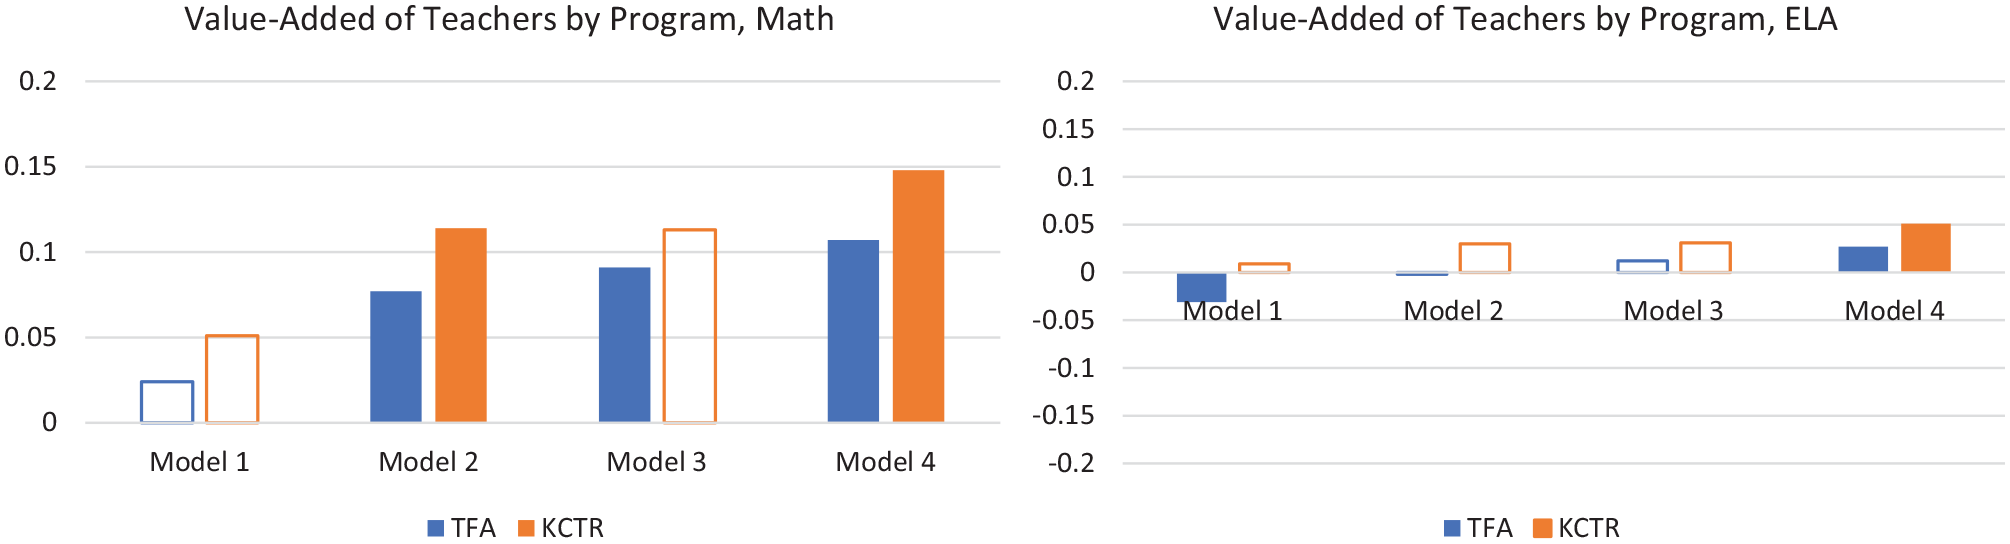
Value added to achievement in math and English language arts (ELA) in Grades 4 to 8 for program teachers compared with nonprogram teachers, using different value-added specifications as described in the text.
The four different value-added specifications are labeled as Models 1 to 4 in the figure. Model 4 is the full specification shown in Equation 2, and Models 1 to 3 are sparser variants that build up to the full model. First, Model 1 is a base specification that only controls for individual lagged achievement
Before describing the results, we first note that our value-added estimates reflect the combined effects of (a) any selection into the programs and (b) any incremental improvement in teaching caused by the programs conditional on who enrolls. A program can have high value added through either or both channels. For example, if a program recruits individuals who are predisposed to be strong teachers (i.e., positive selection) but does nothing via training to improve their performance, teachers from that program will have high value added; similarly, a program that recruits average teachers but offers exemplary training will also have high value added. While our inability to disentangle the “selection” and “training” effect mechanisms is a limitation for some research questions, the combined effect is likely of first-order policy interest for districts looking to hire effective teachers. 16
We first focus on the results from Model 4, which is our preferred specification. In math, we find that TFA and KCTR teachers substantially outperform nonprogram teachers in the Kansas City area. Their value-added estimates are 0.11 and 0.15 student standard deviations higher, on average, respectively. For ELA, the results from Model 4 suggest small positive effects of TFA and KCTR teachers on the order of about 0.03 to 0.05 student standard deviations.
Looking at the estimates for TFA and KCTR across the models in Figure 5 is instructive. Again starting with math, in the sparse model—Model 1—there are no statistically detectable differences between program and nonprogram teachers. However, once we control for student characteristics in Model 2, the differences emerge and persist as the specifications become richer. A similar but more muted pattern of modestly increasing estimates across models is present for ELA. This finding is previewed by the descriptive analysis above, which shows that TFA and KCTR teachers are more likely to be placed in schools with more disadvantaged and lower-achieving students. Model 1 does not account for these placement differences except to the extent that they are captured by students’ own lagged test scores. The more robust accounting for teaching context in Models 2 to 4 reveals important performance gaps between TFA and KCTR teachers compared with other teachers.
Another aspect of the cross-model estimates that merits attention is the difference between Models 3 and 4. These models differ only by whether we control for teacher experience. The experience-conditional comparisons in Model 4 are useful for gauging the efficacy of TFA and KCTR teachers relative to their similarly experienced nonprogram peers. However, it is also desirable to compare TFA and KCTR teachers with other teachers without conditioning on experience. Model 3 does not separately control for experience, so it implicitly makes the comparison with all nonprogram teachers, who are much more experienced on average. The estimates from both models are informative about TFA and KCTR treatment effects.
Practically speaking, our estimates change little going from Models 3 to 4 for both TFA and KCTR (although for ELA the small change is at the threshold of statistical significance). On further investigation, the reason is that the experience-efficacy gradient among nonprogram teachers is modest and effectively flat over a large range of the experience distribution after the first year (results are suppressed for brevity). While this result is not entirely out of line with what has been found elsewhere in the literature (Clotfelter et al., 2006; Wiswall, 2013), the gradient in Kansas City is especially flat. 17 Thus, whether we condition on teacher experience in our comparisons has little bearing on the findings.
Extension: Teacher Retention
We briefly extend our analysis to assess whether program teachers are more or less likely to remain in the Kansas City area compared with nonprogram teachers. For KCTR, we can perform the retention analysis for the 2018 placement cohort only—the 2019 and 2020 cohorts are too new to credibly study retention. We look to see if teachers from the 2018 KCTR cohort remain in the workforce in 2019 and 2020 (N = 31, noting that one 2018 placement was in a nonteaching position). Because we have more cohort data for TFA, we expand the retention analysis to look forward up to 5 years for TFA teachers whose initial placements were between 2012 and 2016 (inclusive; N = 340).
Retention rates in the Kansas City area for both programs compared with retention rates for nonprogram first-year teachers in the same years are reported in Figure 6. We define the Kansas City area more broadly for examining retention than in the previous analysis. Specifically, we consider a teacher as retained in the Kansas City area if they are observed teaching in a public school in the Missouri portion of the formal metropolitan statistical area as defined by the U.S. Census. We also report retention rates in the larger Missouri workforce in the appendix (which are slightly higher but similar; see Appendix Tables A6 and A7).

Retention rates for KCTR and TFA teachers relative to novice nonprogram teachers in the Kansas City Area, as defined by the Missouri portion of the metropolitan statistical area.
In the figure, retention after 1 year indicates that the teacher was observed working in the year following the initial placement (i.e., in Year 2). Retention rates after Years 2, 3, and 4 are similarly defined and cumulative (e.g., a value of 50 after Year 3 would indicate that 50% of the entering teachers were still teaching in the area into the fourth year). As in previous figures, we compare KCTR and TFA teachers with the simple average of teachers in the districts listed in Table 2 and the program-specific weighted averages based on the districts and years in which the TFA and KCTR teachers were placed. We restrict the comparison groups to new teachers only for this analysis.
For TFA, more than 99% of teachers return after the first year, which is consistent with the 2-year program commitment. However, there is a stark drop going into Year 3, with only 57% of teachers remaining beyond the second year. Retention after the fourth year—that is, the percentage of TFA teachers who are still teaching in Year 5—is just 32.35%. These retention rates are similar to the rates calculated using national TFA data (Donaldson & Johnson, 2011).
For KCTR, the 1- and 2-year retention rates are above the local-area simple average and the weighted average based on KCTR placements. The retention gaps over the first 2 years are quite large: After 1 year, KCTR teachers are more than 20 percentage points more likely to remain teaching in the area relative to nonprogram new teachers in the same districts and years. After 2 years, the gap shrinks but remains sizeable, at about 14 percentage points.
Discussion and Conclusion
We contribute to the growing evidence base on the placements and efficacy of alternative teacher certification programs by assessing two such programs—TFA and KCTR—in Kansas City, Missouri. Descriptively, we document program placements in terms of school types and levels, characteristics of students taught, and the racial/ethnic and gender diversity of the teachers themselves. Although there is some heterogeneity across the two programs, common themes are that these programs disproportionately place teachers in charter schools and, more broadly, in schools serving disadvantaged students. Teachers from both programs are also more diverse racially/ethnically than the larger local-area teaching population, although only KCTR teachers are more diverse than other teachers in the same districts in which they are placed. KCTR seems to be particularly effective as a pathway for Black teachers to enter the profession.
We also estimate the value added of program teachers relative to nonprogram teachers. We find that students in Grades 4 to 8 whose teachers are from TFA and KCTR have much higher achievement growth in math than similar students in similar schools who are taught by nonprogram teachers. To give our estimates context, the best research on teacher quality indicates that a 1-standard-deviation move in the distribution of teacher quality as measured by math value added—for example, a move from about the 50th to the 85th percentile—corresponds to a move in the student test distribution of about 0.10 to 0.15 standard deviations. Thus, our estimates of 0.11 and 0.15 for TFA and KCTR, respectively, imply that these teachers are about 0.70 to 1.50 teacher standard deviations more effective than comparable nonprogram teachers, on average, in math. We also find evidence of small, positive impacts of teachers from these programs on ELA achievement. 18 Our smaller findings in ELA for both programs are consistent with the broad empirical regularity that teacher effects in math are larger than in ELA (e.g., Goldhaber et al., 2013; Hanushek & Rivkin, 2010; Lefgren & Sims, 2012).
Our findings for TFA in math are qualitatively consistent with similar estimates using data from other TFA sites outside of New York City. Inclusive of the New York City estimates, our findings fall somewhere in the middle of the range of what has been found in previous research (as discussed above). Our result that the TFA effect is larger in math than in ELA also aligns with prior research (e.g., Backes et al., 2019; Decker et al., 2004; Kane et al., 2008). 19
Our study is the first to provide efficacy evidence on KCTR. More broadly, our estimates contribute to a very sparse literature on the efficacy of teachers from residency programs. Although our estimates should be interpreted cautiously given the relatively small sample of KCTR teachers in tested grades and subjects, our hope is that over time they can be combined with estimates from other studies of residency programs to inform our general understanding of their effectiveness. 20
It is notable that we find that teachers from both TFA and KCTR are more effective, on average, than nonprogram teachers in the local area. As described in the introduction, the training models for TFA and KCTR are quite different. The former is an example of an “accelerated pathway” program, while the latter involves lengthy and intensive training, albeit with a very different structure from what is typical of university-based programs. Our findings suggest that both strategies offer promise as alternatives to traditional teacher preparation.
Finally, we analyze teacher retention for TFA and KCTR teachers. TFA teachers are more likely be retained after the first year, but their retention rate falls thereafter. The retention rate after 4 years for TFA teachers is below the comparable rate for nonprogram teachers in the same districts but not markedly so (32% vs. 41%). As discussed by Donaldson and Johnson (2011), this suggests that the high turnover rate among TFA teachers is less about the TFA program per se and more about the difficult teaching environments faced by TFA teachers.
KCTR teachers are more likely to be retained than comparable nonprogram teachers over the first 3 years posttraining. This finding is consistent with similar evidence on Boston Residency teachers from Papay et al. (2012). The higher retention rate of KCTR teachers over our evaluation period is in line with expectations given that program residents agree to teach in a high-need school in the Kansas City area for at least 3 years. That said, it bears mentioning that no one can be forced to remain in a position (teaching or otherwise), and regardless of the mechanism driving the lower turnover of KCTR teachers, this will be an appealing feature of the program for school administrators faced with the challenge of staffing high-need urban schools.
Footnotes
appendix
TFA Teacher Retention Rates Compared With Other Teachers in the Region

| Region | TFA | All nonprogram teachers (first-year teachers only) | All nonprogram teachers (first-year teachers only, district-year weighted average) |
|---|---|---|---|
| Kansas City area 1-year retention rate | 99.12 | 78.86 | 62.95 |
| Kansas City area 2-year retention rate | 57.06 | 70.35 | 55.51 |
| Kansas City area 3-year retention rate | 41.18 | 63.37 | 46.53 |
| Kansas City area 4-year retention rate | 32.35 | 58.22 | 40.84 |
| Missouri 1-year retention rate | 99.12 | 80.94 | 65.04 |
| Missouri 2-year retention rate | 58.82 | 73.27 | 58.08 |
| Missouri 3-year retention rate | 43.24 | 66.78 | 49.49 |
| Missouri 4-year retention rate | 33.82 | 61.88 | 43.99 |
Note. TFA = Teach for America.
Acknowledgements
We thank the Missouri Department of Elementary and Secondary Education, Teach for America, and Kansas City Teacher Residency for access to data and Mark Ehlert for research support and feedback on earlier drafts. We gratefully acknowledge financial support from the Ewing Marion Kauffman Foundation and CALDER, which is funded by a consortium of foundations (for more information about CALDER funders, see ![]() ). All opinions expressed in this article are those of the authors and do not necessarily reflect the views of the funders, the data providers, or the institutions to which the authors are affiliated. All errors are our own.
). All opinions expressed in this article are those of the authors and do not necessarily reflect the views of the funders, the data providers, or the institutions to which the authors are affiliated. All errors are our own.
Notes
Authors
YANG AN received his PhD in economics from the University of Missouri-Columbia. His research interests include a variety of topics in K–12 and higher education.
CORY KOEDEL is an associate professor of economics and public policy at the University of Missouri-Columbia. His research interests include a variety of topics in K–12 and higher education.