
Abstract
Despite growing concern over teachers’ ability to live comfortably where they work, we know little about the systematic relationship between affordability and teachers’ well-being, particularly in high-cost urban areas. We use novel survey data from San Francisco Unified School District to identify the patterns and prevalence of economic anxiety among teachers and assess how this anxiety predicts teachers’ attitudes, behaviors, and turnover. We find that San Francisco teachers have far higher levels of economic anxiety on average than a national sample of employed adults, and that younger teachers are particularly financially anxious. Furthermore, such anxiety predicts measures of job performance and teacher retention—economically anxious teachers tend to have more negative attitudes about their jobs, have worse attendance, and are 50% more likely to depart the district within 2 years after the survey.
Introduction
Certain professions—including nurses, doctors, and teachers—require not only high levels of education and specialized skills but also a geographically dispersed workforce. Although the supply of professionals in rural and low-income urban areas has caused concern for some time (Continelli, McGinnis, & Holmes, 2010; Hsia & Shen, 2011; Ricketts, 2005), supply constraints have surged in urban areas with fast economic growth and escalating costs of living—areas such as San Francisco, New York City, and Washington, D.C. For professionals with middle-level incomes, such as schoolteachers, the expense of living in high-cost areas may prevent their moving to or staying in that area. For those who do stay, high costs may push them to take on lengthy commutes, accept suboptimal housing situations, and experience increased personal anxiety.
These problems are particularly concerning in the San Francisco Bay Area, where the median listing price of a home in October of 2017 was $749,000 and the median monthly rent was $3,295. In the city of San Francisco specifically, these values were approximately $1.2 million and $4,450 (Zillow, 2017). In 2016, 15.3% of the region’s commuters traveled an average of 60 minutes or more each day, relative to 8.7% nationally and up from 12.0% 3 years earlier (U.S. Census Bureau, 2016a).
Although the challenges posed by San Francisco’s financial conditions are particularly acute, it is not alone among urban areas where the cost of living is rising rapidly. Cities with the greatest cost of living increases in 2017 included Houston, Denver, Atlanta, Nashville, and a number of others not typically considered the most expensive in the nation (Olya, 2017). A recent analysis of Census and housing cost data found that the disparity between the income needed to live comfortably in a city and its respective median household income exceeds $15,000 in over 30 U.S. cities (Lisa, 2018). This gap between mid-level earnings and the affordability of urban living is indicative of broader economic trends. Since 2000, nearly all metropolitan areas in the United States have seen a reduction in the share of adults in middle-income households (Pew Research Center, 2016). As a result, a number of major American cities have increasingly polarized income distributions and growing shares of high-income households (Galka, 2017).
Increasing income polarization and cost escalations create particularly challenging economic conditions for teachers who need to live in such locations, but increasingly cannot afford to. An analysis of the nation’s one hundred largest school districts found that, in more than a quarter of districts, first-year teachers cannot afford to rent a one-bedroom apartment. In a similar number of districts, teachers with 5 years’ experience and a master’s degree would have to spend over 40% of their monthly income to own a home (Nittler, 2017). In California specifically, the share of districts where new teachers cannot afford to rent a one-bedroom apartment is nearly 40%. On the extreme end, San Francisco is one of more than 30 California districts, mostly in the Bay Area, where the cost of a one-bedroom apartment exceeds 50% of new teachers’ salaries (Lambert & Willis, 2019).
Concerns about the impact of escalating costs on the supply of teachers are mounting (Knight & Palomino, 2016; Simmons, 2017; Westervelt, 2016). The potential deterioration in quality of life that these statistics illustrate may affect not only teachers themselves but also those they teach—including the children of low-income families who live in high-cost areas. Despite growing attention to the problem of affordability generally, we know little beyond anecdotal reports about the experience of teachers and the effects it may have on the education sector.
In this article, we offer a case study of teachers’ experiences in one city with rapidly escalating housing costs, increasing wage inequality, and modestly increasing teacher salaries. It is a case that is at the leading edge of a national trend and has broad relevance to the financial challenges facing teachers in districts across the United States. Using novel survey data from San Francisco, we find evidence of high economic anxiety among teachers—considerably higher than a national sample of employed workers. Furthermore, we demonstrate that these feelings of financial insecurity are associated with behaviors that could negatively affect students. Our focus is on understanding the prevalence and patterns of economic anxiety among teachers. We also explore the potential implications, specifically examining relationships to teachers’ attendance, general regard for their job, career aspirations, and retention, suggesting potential impacts on teacher supply and student outcomes. To our knowledge, ours is the first study to focus on K–12 teachers’ financial anxiety and its implications for schools and students. The experience of teachers in San Francisco offers lessons about economic anxiety among middle-income professions that are increasingly marginalized in the face of escalating economic polarization in urban areas across the country.
Economic Insecurity in the Teaching Force
Existing research on teachers’ financial status and well-being has primarily focused on teacher pay and its connection to teacher retention (e.g., Allegretto, Corcoran, & Mishel, 2004, 2008, 2011; Hanushek & Rivkin, 2004). Teacher salaries are low relative to the salaries of other workers with bachelor’s degrees and have fallen farther behind as the U.S. labor market rebounds from the 2008–2010 recession (Allegretto & Mishel, 2016; PayScale, 2013). Low teacher salaries have consequences. Although early sociological research showed the relative importance of teaching’s intrinsic rewards compared with financial rewards (Lortie, 1975), more recent research has also shown that teachers’ decisions to stay in the profession are responsive to wages and pay incentives. Hendricks (2014) finds that increases in teacher pay reduce teacher turnover, particularly for less-experienced teachers. Clotfelter, Glennie, Ladd, and Vigdor (2008) find that annual bonuses significantly reduced teacher turnover in schools serving low-income or low-performing students. Feng and Sass (2015) find that loan forgiveness programs targeted toward teachers in “hard-to-staff” areas resulted in decreased attrition from those areas and decreased likelihood of leaving the public school sector generally, with greater effects resulting from larger payments. Pay can affect teacher sorting among districts and schools (Hough & Loeb, 2013; Steele, Murnane, & Willett, 2010) and wage increases can draw teachers to districts whose salaries are higher relative to nearby districts (Imazeki, 2005). Moreover, financial incentives can affect not only teachers but also their students, with teacher wage increases leading to reductions in high-school dropouts and increases in college attendance (Loeb & Page, 2000).
The link between teacher pay and teacher retention has become increasingly salient in light of recent trends in the supply of teachers. Nationwide, the rate of teacher turnover—inclusive of both teacher moves and attrition from the profession—increased over the past two decades. Turnover rates are generally higher in Title I schools and schools with large concentrations of non-White students (Carver-Thomas & Darling-Hammond, 2017). According to a recent survey of 25 urban, rural, and suburban school districts in California, 80% reported a shortage of qualified teachers for the 2017–2018 school year (Sutcher, Carver-Thomas, & Darling-Hammond, 2018). Earlier research by Ingersoll (2001) suggested that such shortages are driven largely by teachers’ early exit from their jobs for reasons other than retirement, rather than an inadequate pipeline of new teachers; however, more recent data have shown that enrollment in teacher preparation programs is also in decline (U.S. Department of Education, 2015).
The financial cost of teacher turnover resulting from recruitment, hiring, and training is significant at both the district and school levels (Barnes, Crowe, & Schaefer, 2007). Recent estimates indicate that turnover costs districts across the country roughly 2.2 billion dollars each year (Haynes, 2014). Moreover, research has shown that teacher turnover negatively affects student achievement, particularly in schools with high concentrations of low-performing and Black students (Ronfeldt, Loeb, & Wyckoff, 2013).
While the impacts of teacher pay and its connection to teacher effectiveness and teacher supply have been thoroughly examined, the existing literature has by and large not made distinctions between teachers’ compensation and their sense of financial well-being, which necessarily takes into account the economic context in which teachers live. An exception to this is King et al. (2016), which examines multiple dimensions of early childhood teachers’ financial well-being, including their perception of their ability to cover basic expenses, and finds that financial well-being is associated with their young students’ behaviors in the classroom. Related research from other fields suggests that financial anxiety and distress is consequential for worker productivity, as it has been shown to generally affect physical and psychological health (Catalano, 1991; Currie & Tekin, 2015) and reduce the output of innovative workers (Bernstein, McQuade, & Townsend, 2018).
Our research takes a similar approach to King et al. (2016), using measures of K–12 teachers’ economic anxiety and their ability to cover large or unexpected costs to understand their experience and the relationship it has with their behavior and attitudes toward teaching, and ultimately, their decision to remain teachers in the district. We address the following three research questions:
Research Question 1: To what extent do teachers in a high cost-of-living area face economic anxiety and how does their experience compare to the nation at large?
Research Question 2: Which types of teachers face the most economic anxiety—by demographics, specialty area, and experience, as well as by assets, financial responsibilities, and family resources?
Research Question 3: How does economic anxiety predict teachers’ attitudes and behaviors that could affect their teaching and career choices, and how does it ultimately predict teacher retention?
Data
Survey Data
This study uses survey data collected in partnership between San Francisco Unified School District (SFUSD) and Stanford University. We administered the survey online, emailing it to nearly all SFUSD traditional public-school teachers in May 2016 and offering a $15 gift card as an incentive to participate; 2,266 teachers responded—a response rate of 69%. Appendix Table A1 shows descriptive statistics of the survey’s respondents and indicates that they do not significantly differ from the district’s public-school teachers as a whole across demographics, experience, or the population of students they teach. The survey included a section addressing teachers’ financial stability and sense of economic anxiety; some of its questions were adapted from an economic survey of Americans conducted by Edison Research for the news program Marketplace in February of the same year. With a nationally representative sample, the Marketplace survey provided a contemporaneous window into the financial situations and perceptions of economic stress experienced by Americans broadly. 1 We do not utilize the Marketplace survey as a perfect comparison group for our sample of teachers—there are no subgroup responses for educators specifically, nor for employed people living in high-cost areas. However, it serves as a basis for comparing teacher responses to a national sample, which helps contextualize our findings. Amidst residual strain from the 2008 recession and a growing awareness of income inequality more broadly (Lin & Tomaskovic-Devey, 2013; Piketty, 2014), it is possible that teachers may simply reflect the prevailing sense of economic anxiety of the times.
We ask teachers three questions, modified from the national survey, that collectively form our measure of economic anxiety. Our construct of interest is closely related to economic insecurity, which Western, Bloome, Sosnaud, and Tach (2012) describe as the dynamic risk of economic loss that individuals and households face. Like Western et al. (2012), our research recognizes that economic insecurity is not necessarily tightly linked to socioeconomic level; indeed, our research context of San Francisco highlights that insecurity can exist among middle-class professionals in a booming economy. We use the terminology “economic anxiety” to encapsulate a combination of both actual and perceived economic risk. Our measure captures an abiding sense of financial precariousness—as Marketplace reported about the American public in the wake of its survey (see, e.g., Ryssdal, 2016). The first of the three questions asks teachers how frequently their financial situation makes them feel anxious; the second, how easy or difficult it is to pay their rent or mortgage each month; the third, how difficult it would be to pay an unexpected expense of $1,000. 2 As a follow-up, the survey asked whether respondents have a friend or family member they can turn to for help, were they unable to pay the $1,000 expense.
In addition to the three primary economic anxiety questions, we use other survey questions to better understand teachers’ financial situations and family background, some of which we also adapted from the Marketplace/Edison survey. These questions ask about teachers’ household income levels, sources of household income, home ownership, receipt of inheritance or other wealth, student loan repayment, and child care costs. We also ask about parental education level, free or reduced-price lunch (FRPL) eligibility as a child, and whether teachers attended primarily Bay Area schools growing up, as a measure of social and, potentially, financial capital in the community. Last, our survey asks teachers how long it takes them to commute to and from school. We use this variable as another indicator of teachers’ financial situations and quality of life, since the ability to live close to work and avoid long commutes is generally considered to be an advantage among workers (Choi, Coughlin, & D’Ambrosio, 2013; Kahneman & Krueger, 2006).
Additionally, our survey included a series of questions addressing teachers’ attitudes toward their job—including whether they like being a teacher and their feelings about entering the profession in retrospect—as well as questions about their plans for resignation and their interest in pursuing roles in instructional, school, or district leadership. We use responses to these questions as outcomes to test whether teachers’ economic anxiety and financial insecurity are predictive of greater well-being, teacher supply, and teachers’ career aspirations.
Administrative Data
We match our survey data to administrative records provided by the district in order to examine patterns of economic anxiety across teacher characteristics. We use data on teachers’ race, gender, age, experience, subject and school level they teach, as well as on racial demographics and subsidized lunch eligibility of students in their schools. Our partnership also provides unique data on teachers’ attendance and their reasons for missing work, from which we create variables for days missed and whether teachers miss more than 10 days in a school year, consistent with the definition of chronic teacher absenteeism used by the U.S. Department of Education’s Office of Civil Rights (Civil Rights Data Collection, 2016). The administrative records also allow us to track teachers’ employment in the district over time, including whether they transfer to another school, leave the district, or retire within the 2 years following the survey. These measures of teacher attendance and retention allow us to explore potential relationships between economic insecurity and both teacher supply and student outcomes.
Teachers’ Economic Anxiety
Teachers’ Perceptions
Table 1 shows SFUSD teachers’ responses to the primary economic anxiety questions. We display the frequency and percentage of teachers who selected an answer out of the subset of respondents for whom the question is applicable and who answered the question. Columns (3) and (4) provide points of comparison from the full sample of the Marketplace survey and from the employed subset, respectively. These comparisons to a national sample of adults in early 2016 demonstrate that SFUSD teachers are considerably more likely to experience economic anxiety, with nearly half experiencing frequent anxiety and a full 85% experiencing economic anxiety frequently or sometimes. Renters appear to face the most acute anxiety about covering housing costs, with SFUSD teachers who rent being twice as likely to find it very difficult to cover housing costs as SFUSD teachers who own their housing. The prospect of paying an unexpected $1,000 expense strikes 39% of teachers as very difficult.
Teacher Perceptions of Their Own Financial Insecurity

Note. Total number of San Francisco Unified School District (SFUSD) teacher survey respondents is 2,266, though the number of respondents for each survey question varies by question. The percentages shown for SFUSD teachers are based on the subgroup of respondents who answered the given question. The data from the national Marketplace/Edison Research Survey is sourced from the February 2016 survey and the total number of respondents is 1,012. The percentages shown in column (4) are for the subset of national respondents who were employed at the time of the survey.
Employed Americans are arguably a better comparison for teachers, but anxiety among SFUSD teachers exceeds that for both the employed subsample and the national sample as a whole. Although Americans generally express some level of economic anxiety, their responses tend not to fall at the extreme upper end of each question’s distribution. Far from merely reflecting a national mood of economic insecurity, SFUSD teachers are more likely to be frequently anxious about their financial situation, to find it very difficult to cover monthly rent or mortgage payments, and to find it very difficult to cover a large, unexpected expense, relative to both national samples. 3 Fewer than 5% of employed Americans find it very difficult to cover their housing costs, whereas 13% to 27% of SFUSD teachers (owners and renters, respectively) report that covering these payments is very difficult. Despite their relatively high levels of economic anxiety, however, SFUSD teachers are more likely to indicate that they have someone to turn to should they be unable to cover their expenses. While roughly half of Americans generally do not have a family member or friend they could turn to at a time of acute financial distress, only a fifth of SFUSD teachers responded this way, suggesting that they may have stronger (and more financially secure) support networks despite their financial worries.
Differences Among Teachers
Our results further reveal that these levels of economic anxiety are experienced fairly consistently across various subgroups of teachers in SFUSD, except by age. We estimate bivariate linear probability models in which the dependent variable is an indicator for a teacher selecting the most extreme option of the economic stress variables (i.e., feeling frequent financial anxiety, or saying it is very difficult to cover housing costs) and the explanatory variable is a teacher or school characteristic. We test for differences across demographic characteristics (race, gender, age), professional characteristics (experience, subject, or level taught), and teachers’ school characteristics (share of students by race, share FRPL-enrolled). We intend these models to uncover patterns of economic anxiety rather than identify primary drivers of teachers’ responses. Table 2 gives the estimated coefficients (interpreted as predicted percentage difference) from these models where each of the seven categories of covariates is a separate model for each dependent variable. We report robust standard errors in parentheses. 4
Likelihood of Financial Stress by Teacher Characteristic, Linear Probability Models

Note. Table 2 shows the results of linear probability models, where the dependent variable is an indicator for a respondent selecting the financial anxiety-related prompt shown. The subsections of Table 2 (i–viii) represent separate regression models. Robust standard errors are shown in parentheses. Missing flags for explanatory variables are used in all regressions to keep the sample size consistent across models for each dependent variable. R2 values are available on request.
p < .05. **p < .01. ***p < .001.
Most of the teacher characteristics that we assess are unrelated to expressed economic anxiety, indicating that perceived financial precariousness cuts across the district’s teachers. However, age is a strong predictor, with younger teachers more likely to express economic anxiety across all three anxiety measures. Similarly, veteran teachers are less likely to be economically anxious than their less experienced counterparts; teachers with 5 years of experience or less experience the most economic anxiety. A number of factors may contribute to this trend. Younger and less experienced teachers not only earn lower salaries than their more experienced colleagues they are also less likely to be part of a two-income household and are likely to face higher housing costs if they are new to the city or the labor market.
Other demographics are less consistent predictors. For the most part, teachers do not vary by race or gender in how likely they are to feel frequently anxious about their finances or to find it very difficult to cover housing costs. However, Black and Hispanic teachers are significantly more likely than White teachers to say that it would be very difficult to cover a $1,000 expense. The same is true for female teachers relative to males.
Although younger, less-experienced teachers tend to be concentrated in high-minority and high-poverty schools, the student population at a teacher’s school does not individually predict their economic anxiety with one exception: the share of Black students at a teacher’s school. With each additional percentage point in the share of Black students, a teacher is 0.29 percentage points more likely to be frequently economically anxious and 0.34 percentage points more likely to find it very difficult to cover an unexpected expense. 5 San Francisco’s Black student population is small for a large urban district (7% in 2017), and the schools with the largest proportions of Black students tend to be located on the outskirts of the city, relatively far from other city neighborhoods and from the region’s main public transportation system. Although location cannot completely explain these findings, it appears to be a contributing factor along with teacher race and experience. In specifications that additionally control for self-reported commute time, or for teacher experience, or for teacher race, the coefficients for share Black remain significant in models predicting difficulty covering an unexpected expense. However, in models that control for at least two out of three of these factors, the coefficients for share of Black students are reduced to nonsignificance.
In supplemental analyses, we estimate comparable models using logistic regression and find no differences in the substance or significance of our results. We also estimate models with more broadly defined dependent variables—for example, indicator variables for respondents reporting financial anxiety “frequently” or “sometimes,” or for reporting that it is “very difficult” or “somewhat difficult” to cover a cost. With only a few exceptions across models, the signs and significance of our estimated coefficients remain the same. The results of these and all other alternative models are available on request.
Teachers’ Financial Situations
Our survey data permit us to assess how the specifics of teachers’ financial situations predict their economic anxiety. As with our measures of economic anxiety, these measures also draw on teachers’ self-reports; however, we asked about broad areas of financial welfare that are straightforward to answer. We asked about teachers’ total household income levels, to understand whether higher-earning contributors might cushion educators’ relatively low salaries; we also asked about sources of household income, including whether the teacher works a second job to make ends meet. We asked about home ownership, as renting in a city with rapidly increasing rents imparts an additional aspect of insecurity to respondents’ lives. We asked about actual or expected receipt of inheritance or other wealth, financial support from family (aside from one’s partner/spouse), as well as student loan repayment and child care costs, to gauge some of the additional burdens or safety nets that may shape teachers’ sense of the precariousness of their financial situation. Table 3 shows an overview of SFUSD teachers’ financial profiles based on these variables, as well as possible indicators of their access to support networks—their parents’ level of education, their own subsidized lunch eligibility as a child, and whether they attended a K–12 school in the area, an indicator of being native to the Bay Area and potentially having family or other long-term connections in the region. As in Table 1, we make comparisons to the Marketplace survey to contextualize our results.
Teachers’ Self-Reported Financial Profile and Access to Outside Support

Note. Total number of San Francisco Unified School District (SFUSD) teacher survey respondents is 2,266, though the number of respondents for each survey question varies by question. The percentages shown for SFUSD teachers are based on the subgroup of respondents who answered the given question. The data from the national Marketplace/Edison Research Survey are sourced from the February 2016 survey and the total number of respondents is 1,012. The percentages shown in column (4) are for the subset of national respondents who were employed at the time of the survey.
Difference in question wording between teacher survey and national survey. For example, the percentage of respondents who do not live with a spouse or partner is defined for SFUSD teachers as those who did not indicate that they live with a partner or spouse; the percentage for the national survey is sum of respondents who say they are single or divorced.
SFUSD teachers tend to have higher household incomes than the national sample. The modal income category among teachers is $50,000 to $74,999 (the lower end of the salary schedule in SFUSD), while it is under $50,000 nationally. About 37% of teachers have a household income of greater than $100,000, compared with 22% of employed Americans nationally. The national survey’s highest income category is $150,000 or greater, and although the percentage earning that amount among employed respondents nationally (9%) is similar to that among SFUSD teachers (11%), a small share of these SFUSD teachers (less than 3%) reported being in the highest household income category included in our survey, greater than $250,000. That SFUSD teachers have above-average household income levels is perhaps unsurprising. Teachers have at least a bachelor’s degree, unlike the national sample, and they have to be able to afford—at least at a minimal level—living in the Bay Area, where communities surrounding San Francisco also experience relatively high costs of living. Nonetheless, SFUSD teachers do not receive the same salary premium that many other Bay Area workers do. The 2016 median individual earnings for a person with a bachelor’s but no graduate or professional degree in the Bay Area metropolitan area—around $67,000—was almost $10,000 more than that for the state as a whole (U.S. Census Bureau, 2016b). 6 However, the average SFUSD teacher salary was, at around $68,000, almost $10,000 less than the average teacher’s salary statewide (California Department of Education, n.d.).
Our survey reveals other aspects of teachers’ financial situations that indicate an economic struggle or lower quality of life. Nearly 70% of teachers report that their SFUSD salary provides the majority of their household income—even though 62% of teachers report living with a spouse or partner. Twenty percent of SFUSD teachers have a second job to help make ends meet. This prevalence of additional work is not unique to San Francisco; according to data from the 2011 to 2012 National Center for Education Statistics Schools and Staffing Survey, in 11 states at least 20% of teachers held a second job (Boser & Straus, 2014). The survey also shows that SFUSD teachers are considerably more likely to rent than own a home and are considerably more likely to rent than the national sample, a finding consistent with the high property values in the area. More than a third are paying off student loans. On average, teachers report commuting 0.56 hours (or 34 minutes) home, with times ranging from 1 minute up to 3 hours with a standard deviation of 26 minutes—similar to the 2016 San Francisco average commute time of 32 minutes (U.S. Census Bureau, 2017). Relatively small numbers report receiving financial help from family members other than a spouse/partner (17%) or inheriting wealth (7%), indicating that family assistance is a relatively rare strategy for making ends meet. Although many teachers (58%) have college-educated parents, one third recall being eligible for FRPL as a child. Last, more than a third of teachers (38%) indicated that they attended primarily Bay Area schools as a child, suggesting that a sizable share grew up in the area, consistent with research demonstrating working near “home” is common in the teaching profession (Boyd, Lankford, Loeb, & Wyckoff, 2005; Reininger, 2012).
Drawing Connections Between Teachers’ Financial Situations and Economic Anxiety
The results in Tables 1 and 3 provide evidence that SFUSD teachers face greater economic anxiety than Americans do on average, despite having higher household income and potentially stronger support networks. We find, further, that the specifics of teachers’ financial situations significantly predict their economic anxiety.
Results presented in Table 4 treat the components of teachers’ financial situations (shown in Table 3) as predictors of the economic anxiety indicators. Because our earlier findings indicate that age is a strong predictor of teachers’ economic anxiety, and because the specifics of teachers’ financial situations (e.g., whether they live with a partner or spouse, or whether they are paying off student loans) can be highly dependent on age, we control for age in these models.
Likelihood of Financial Stress, by Teacher Financial Profile and Access to Outside Support

Note. Each cell is a coefficient (with standard error in parentheses) from a separate regression, where the dependent variable is a dummy for a respondent indicating that they feel “frequently anxious” about their financial situation, that it is “very difficult” to pay their monthly rent or mortgage, or that it would be “very difficult” to cover an unexpected $1,000 expense. Missing flags for explanatory variables are used in all regressions to keep the sample size consistent across models for each dependent variable. R2s available on request.
p < .05. **p < .01. ***p < .001.
The specifics of teachers’ financial situations provide insights into their economic anxiety and its potential drivers. Teachers who are the primary or solo breadwinners are more likely to feel financially anxious and to have difficulty covering housing and unexpected expenses, as are teachers who hold a second job to make ends meet. Teachers who rent, are paying off student loans, are struggling to find affordable child care, or self-report long commutes are also more likely to indicate economic stress, with almost all coefficients statistically significant. We find no relationship between economic anxiety and financial support from family members; this result is reasonable, as receipt of family support could identify highly resourced teachers (as a result of help) or teachers whose financial instability requires help.
We also find evidence that teachers from more advantaged family backgrounds or who are more likely to have a financial support network experience less economic anxiety. Teachers whose parents have higher education levels experience less economic anxiety, although the relationship is only significant when the dependent variable is difficulty paying a $1,000 expense. Teachers who attended primarily Bay Area schools are less likely to report economic stress, although the coefficient is only significant when the dependent variable is frequently feeling financially anxious. Conversely, teachers who come from poorer socioeconomic backgrounds report greater economic anxiety across all three dependent variables. Interestingly, in models where we control for teachers’ childhood eligibility for subsidized lunch, all three coefficients for being from the Bay Area are significant and negative. This pattern suggests that it is not simply that Bay Area families tend to be more affluent, but also that having family in the area or familiarity with the region may reduce economic anxiety.
We also consider the possibility that the significant relationships found between teachers’ economic anxiety and their current financial situations—household income, home ownership, student loan status, child care costs, and commute—might be driven by teachers’ family background, especially their income levels growing up. We estimate models examining these relationships while controlling for teachers’ family background and support network (i.e., parental education, free lunch–eligibility as a child, and whether they are from the Bay Area). These results (not shown) are essentially unchanged from those of the models controlling only for age presented in Table 4, providing evidence that the relationships between teachers’ current financial situations and their economic anxiety are significant regardless of family background. For all of these results, comparable logit models produce virtually identical patterns to linear probability models.
Implications for Teacher Behavior and Retention
Our final research question considers how economic anxiety predicts teachers’ attitudes and behaviors in ways that could affect their teaching and retention. Our data provide suggestive evidence of consequences associated with teachers’ sense of economic well-being. Teachers with high levels of economic anxiety tend to have a lower regard for teaching, lower school attendance, and are more likely to both report plans to resign and ultimately exit the district. However, these teachers are also more likely to express interest in pursuing instructional, school-level, and district-level leadership roles, which are roles with higher salaries. These findings show that the economic well-being of teachers predicts not just satisfaction with their job but also demonstrated behavior. They additionally suggest that economic anxiety does not predict a disinterest with being an educator generally, but rather a dissatisfaction with being a teacher specifically.
Outcomes to answer this research question draw on both survey and administrative data. We construct a variable of teachers’ regard for teaching through a principal component analysis of a series of survey questions aimed at measuring teachers’ attitudes toward their job. These Likert-type scale questions include (a) whether they would be a teacher if they could do it all over again, (b) whether they like being a teacher in SFUSD, (c) whether they like working at their current school, (d) whether they feel good about their performance as a teacher, and (e) whether they are discouraged by the state of the profession. Our measure of teachers’ plans for resignation comes from a survey question asking their plans for the following year, which includes options such as “stay in SFUSD” and “retire” in addition to “resign.” Our measure of teachers’ interest in leadership roles comes from a survey question that asks, among the subset of teachers who do not indicate they either plan to retire in the following year or have been let go, whether they would be interested in moving at some point in the future into instructional, school-level, or district-level leadership positions.
We measure teachers’ absences in multiple ways. Using our administrative data on teacher attendance, we construct continuous measures of days missed for any reason, for professional development only, for illness only, and for personal leave or emergency only. 7 Because a number of outliers have especially high absence rates, we exclude teachers who are in the top 1% of our sample for number of days absent from this part of our analysis. We also construct indicators for chronic absence (defined as missing more than 10 days) for any reason, and specifically for illness or personal leave/emergency. We additionally track teachers’ administrative records to assess whether, as of April 2018 (2 years subsequent to the survey), they transferred to a different school in SFUSD, exited the district for any reason, or exited the district for reasons other than retirement.
Table 5 shows the results of linear probability models, where measures of economic anxiety predict measures of positive regard for teaching, interest in leadership roles, and reported plans to resign, as well as measures of attendance and demonstrated school transfer or district exit. 8 The “mean” row in each panel indicates the mean value of each outcome for our full analytic sample. Each cell shows the estimated coefficient from a separate regression and robust standard errors are in parentheses. Estimating comparable logit models and models including age as a control variable do not meaningfully change our results.
Association With Teachers’ Attendance, Regard for Teaching, and Turnover
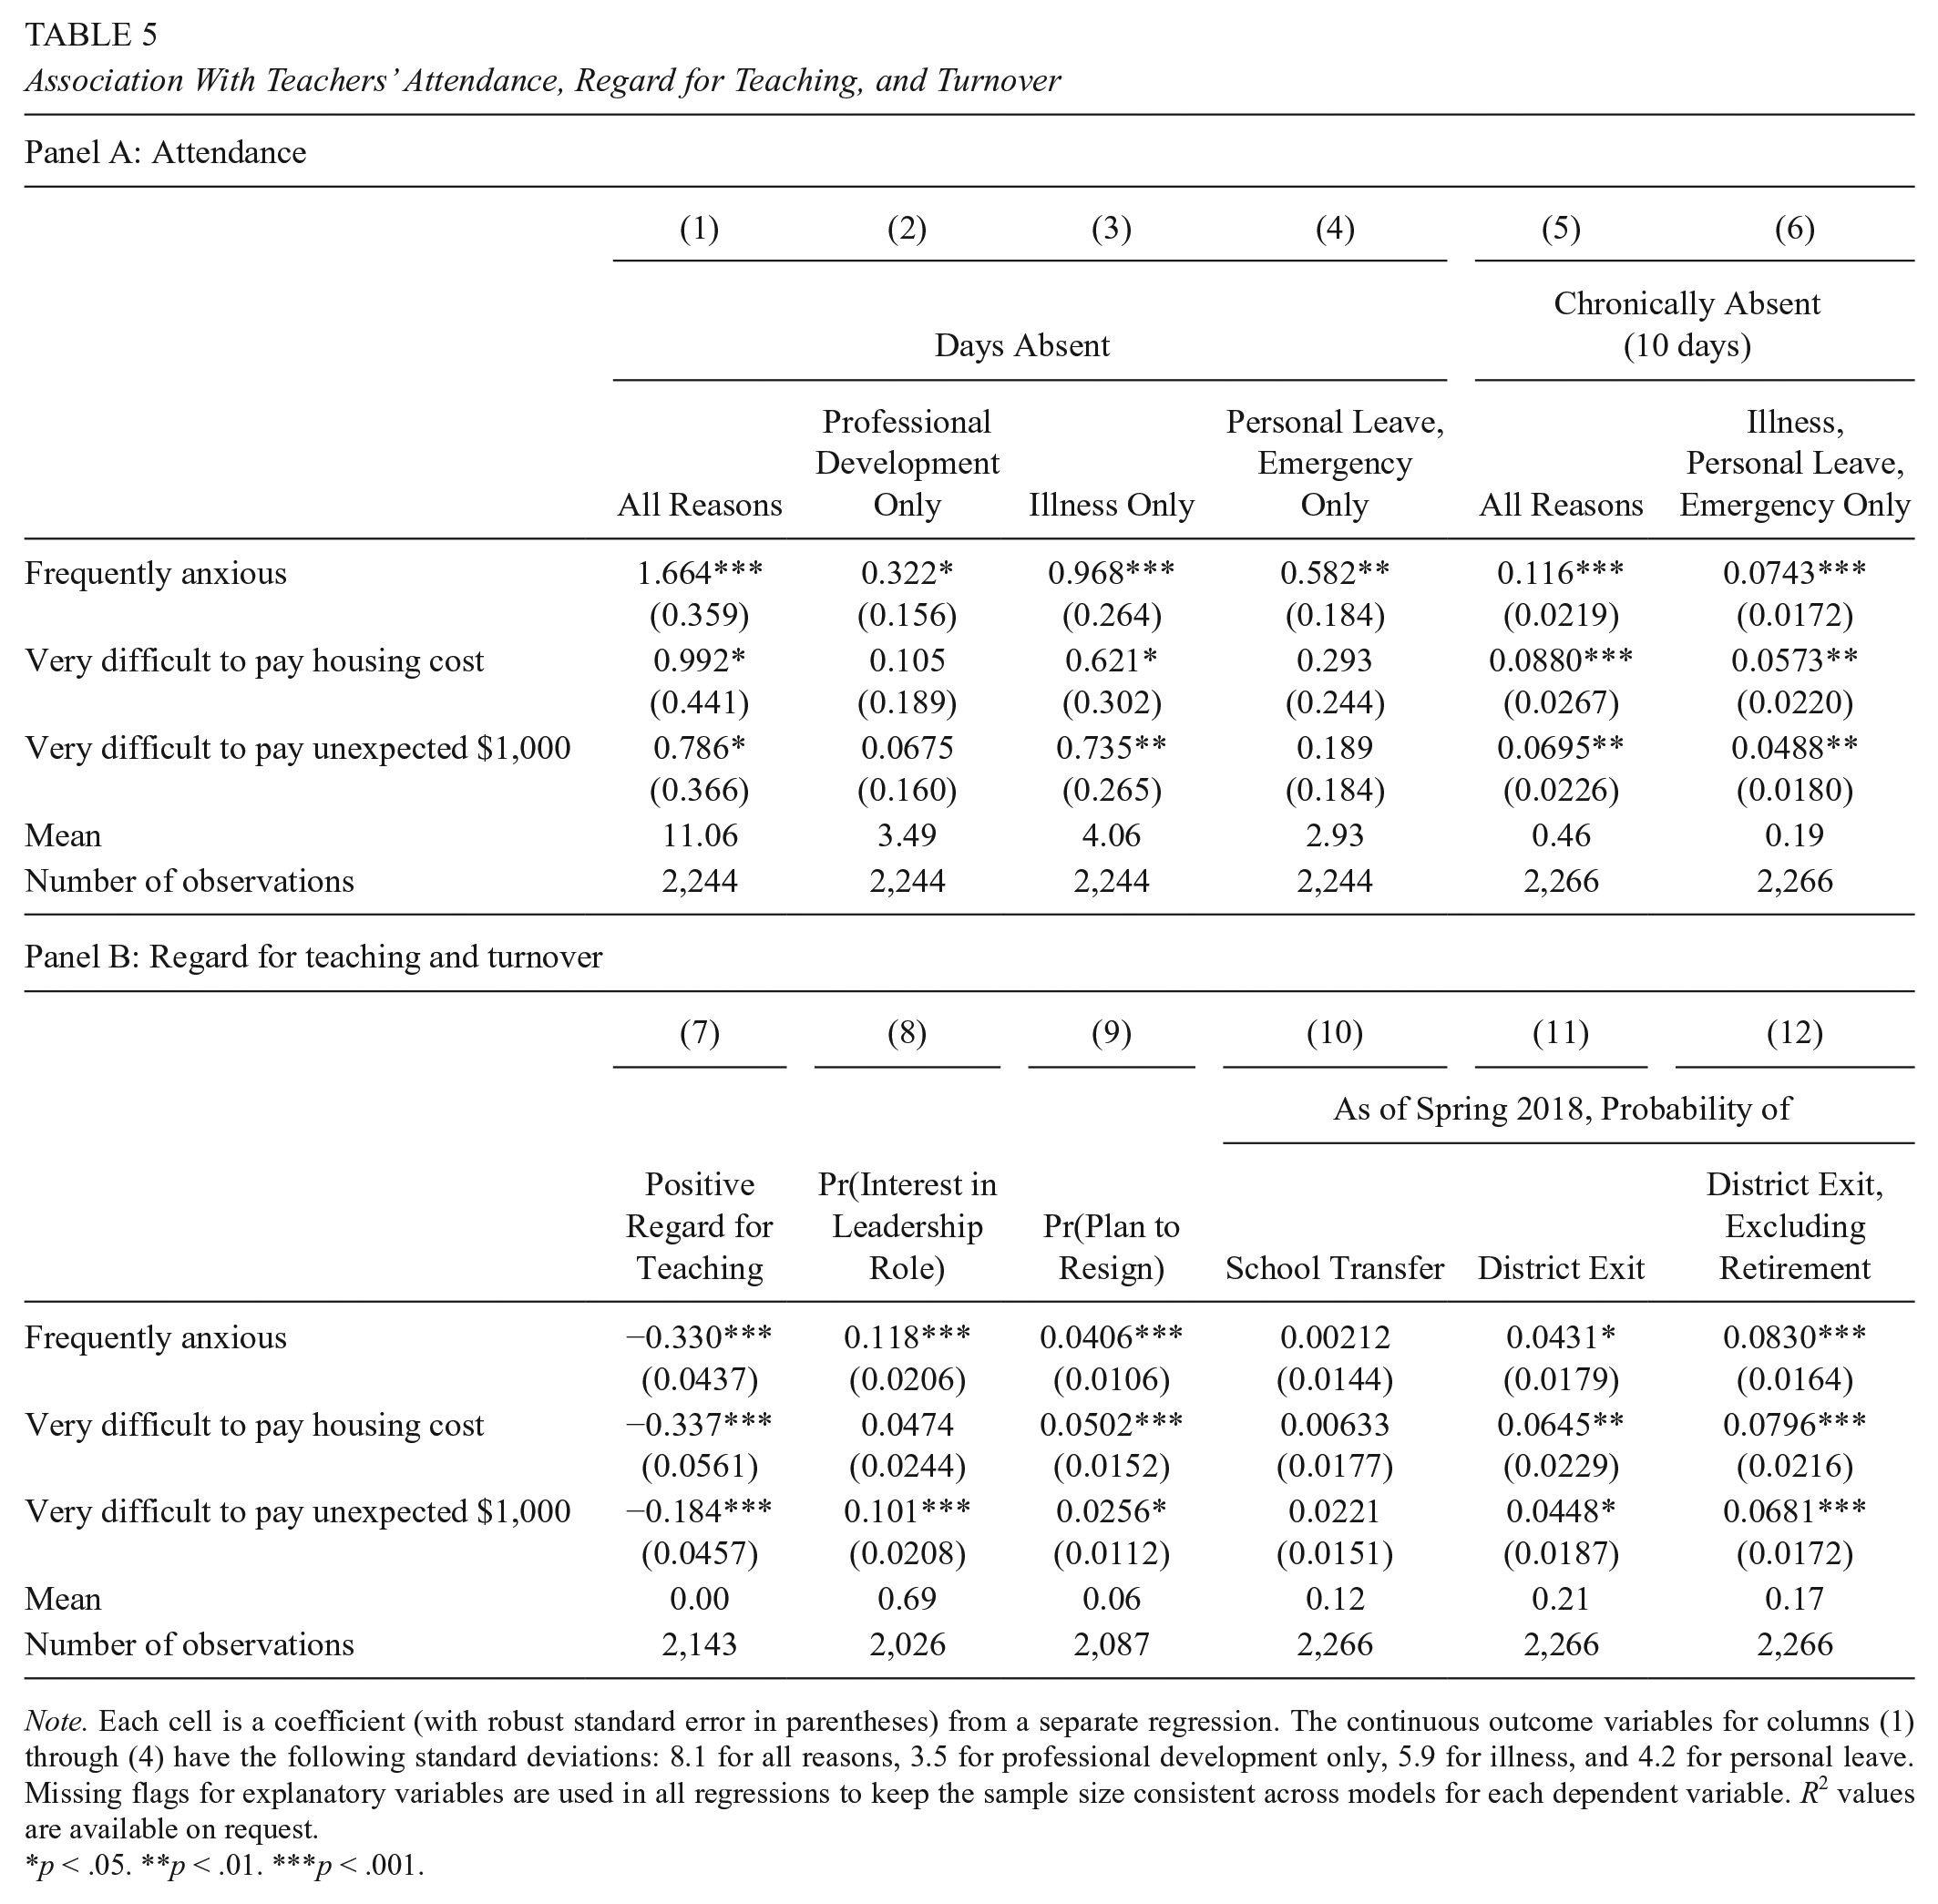
Note. Each cell is a coefficient (with robust standard error in parentheses) from a separate regression. The continuous outcome variables for columns (1) through (4) have the following standard deviations: 8.1 for all reasons, 3.5 for professional development only, 5.9 for illness, and 4.2 for personal leave. Missing flags for explanatory variables are used in all regressions to keep the sample size consistent across models for each dependent variable. R2 values are available on request.
p < .05. **p < .01. ***p < .001.
Table 5 shows that economic anxiety predicts teachers’ attitudes about their job and their likelihood of remaining a teacher in SFUSD. Across all three of our economic anxiety variables, economically anxious teachers have a lower regard for teaching and are more likely to plan to resign in the following year. For example, teachers who are frequently anxious have a regard for teaching that is 0.33 standard deviations lower than the overall sample, and nearly 0.5 standard deviations lower than teachers who are not frequently anxious. Frequently anxious teachers are also 67% more likely to say they plan to resign relative to the overall sample and 100% more likely relative to nonfrequently anxious teachers.
One might interpret these findings from negative survey responses as an indication that economic anxiety is associated with an overall disillusionment or disconnection with education generally. However, economically anxious teachers are also more likely to express interest in pursuing a leadership role at the instructional, school, or district level at some point in the future, indicating that they are not willing (or maybe able) to be an educator at the low wage of a teacher, but would be interested in being an educator in a different context. Although the teachers in our sample tend in general to be interested in pursuing such positions (nearly 70% indicate interest in at least one of these roles), teachers who are frequently anxious about their financial situations are 12 percentage points more likely to aspire to leadership roles, a difference of 17% relative to the overall sample and 19% relative to nonfrequently anxious teachers. The results are similar though slightly smaller in magnitude for teachers who have difficulty paying an unexpected expense. The association between teachers’ difficulty paying housing costs and their leadership aspirations is not significant; however, if we consider teachers’ interest in different types of leadership roles separately, these teachers are 8 percentage points and 6 percentage points more likely to be interested in school and district leadership, respectively (both statistically significant). Overall, the percentage increase in teachers’ interest in leadership positions associated with economic anxiety is considerably higher for school leadership and district leadership roles (a 65% and 40% increase above the sample mean, respectively) than for instructional leadership roles (a 15% increase above the sample mean). See Appendix Table B2 for more details. These findings provide evidence that economic anxiety is not necessarily leading teachers to want to leave the education sector, but it is associated with wanting to leave the relatively low-paying role of teacher. Given that far more educators are teachers than school or district leaders, this desire to move away from teaching may be problematic for schools, even if these teachers seek leadership roles in education.
The administrative data also demonstrate that economic anxiety predicts teacher behavior, in addition to teacher attitudes. Economically anxious teachers miss more days of school and are more likely to be chronically absent. In particular, teachers who are frequently anxious about their financial situation miss 1.6 more days of school, on average—a 15% increase over the mean missed days in our sample of teachers. Some of this predictive relationship with absenteeism is driven by young teachers, who are more likely to be financially anxious and have a higher propensity to miss school for professional development, as evidenced by supplemental models (not shown) that control for age and subsequently find no significant relationship between frequent anxiety and days missed for professional development. However, frequent anxiety also significantly predicts increases in days missed for illness and for personal leave—associations that remain significant even when controlling for age. Furthermore, frequently anxious teachers are 12 percentage points more likely to be chronically absent. Our findings are similar for the other measures of economic anxiety: Teachers who find it very difficult to cover housing costs miss more total days of school and are significantly more likely to be chronically absent. Both those who struggle with housing costs and unexpected expenses also miss significantly more school due to illness, suggesting that when health problems arise, teachers may lack a financial buffer to support them. Economic anxiety could also affect generalized anxiety, which, in turn, can lead to mental and physical health issues that might manifest in missed time from school. Alternatively, the association between economic anxiety and attendance could reflect a lower level of effort or engagement among teachers with greater financial stress, as Clotfelter, Ladd, and Vigdor (2009) find that sick days appear to be at least partially discretionary.
While we find that economically anxious teachers are significantly more likely to report that they plan to resign, it is possible these are merely pessimistic or angry feelings expressed through our survey, without genuine intention behind them. Yet by analyzing administrative data, we find that by the spring of 2018 (i.e., about 2 years after the survey), economically anxious teachers are significantly more likely to leave the district, while we find no difference in their likelihood of switching schools within SFUSD. The relationship between economic anxiety and likelihood of district exit for reasons other than retirement is even stronger. For example, excluding retirement, frequently anxious teachers are 8 percentage points more likely to leave the district than less anxious teachers. Given that 12.3% of the less anxious teachers depart SFUSD in this period, this represents a difference in turnover of 65%.
It is possible that our construct of economic anxiety is instead a proxy for a different teacher characteristic or is related to an omitted variable that similarly predicts teacher behavior and retention. Given our data and research design, we are unfortunately unable to identify true causal relationships driving these outcomes. For example, economic anxiety could be related to teachers’ overall dissatisfaction with living in the Bay Area or commitment to the San Francisco community, which could be the true underlying driver behind their decision to stay in SFUSD. Alternatively, economic anxiety could be related to teachers’ career ambitions and financial goals, which affects their attitudes toward their jobs and their persistence in the profession. Ideally, we would be able to rule out such potential omitted variables by identifying a comparable control group in another city or another profession, or by supplementing our analysis with richer data on teacher characteristics and attitudes. Unfortunately, these data are not available to us. That said, we do examine whether the observed relationships between teachers’ behavior and retention and their economic anxiety hold when controlling for other variables that could plausibly influence their attitudes toward their profession and desire to remain in it. Specifically, we estimate supplemental models predicting teacher attendance and district exit, but controlling for teachers’ experience, age, whether they are from the Bay Area and their career aspirations (measured as their reported interest in instructional or administrative leadership roles). In the case of teachers’ career aspirations particularly, this construct is inherently interrelated with teachers’ behaviors and retention, so we acknowledge that it can potentially be an outcome in and of itself (as we model and describe above), or a mediator. None of these alternative specifications meaningfully change our results, suggesting that potential explanatory variables examining experience, social support, and career ambition cannot explain away the relationship between economic anxiety and behavior and retention outcomes. See Appendix B for results of supplemental models.
Discussion
Teaching is one of the most geographically dispersed occupations. Where there are children, teachers are in demand. Substantial research has identified the shortage of teachers in areas producing few college graduates and in high-poverty areas with few college-educated workers (Boyd et al., 2005; Lankford, Loeb, & Wyckoff, 2002). This study is the first that we know of assessing difficulties for teachers working at the other extreme—in areas of high and increasing wealth, in which high property values can limit quality of life and create economic anxiety. These areas often have bimodal income distributions, so while the market for housing is out of reach for teachers, high-poverty enclaves have schools in need of strong teachers.
We find that teachers in San Francisco experience far greater economic anxiety than other American adults, even without restricting the national sample to those who are employed. They are also far more likely to rent, far less likely to own a home, and have far longer commutes than other workers. These experiences predict economic anxiety, especially for younger teachers and for those with weaker local networks. The higher levels of economic anxiety among younger teachers are concerning because they suggest that the pipeline of new teachers may be facing an added deterrent. Attrition because of retirement is looming—in SFUSD and more broadly—and a strong labor market for college graduates is pulling potential teachers to other professions (Darling-Hammond & Shields, 2016; Kraft, Brunner, Dougherty, & Schwegman, 2018). High living costs and the financial anxiety they potentially create may further reduce the supply of new teachers. Financial anxiety is particularly high for teachers in schools serving large proportions of Black students, at least in part because those schools are located in areas that are farther from teachers’ residences. To the extent that these schools have the greatest need for teachers, reducing economic anxiety may be an important hurdle to overcome in reducing the turnover rate and increasing the supply of teachers to these schools. This type of disparity in economic anxiety may also reinforce trends identified by Boyd et al. (2005) about teachers’ preferences for working in schools that are geographically proximate to their childhood homes or share similar characteristics with those schools.
We also find evidence that teachers’ financial anxiety is associated with their job performance. Teachers reporting greater economic anxiety also report that they have a lower regard for their job and are more likely to be chronically absent from school. Teacher absenteeism can, in turn, meaningfully hurt student learning (Clotfelter et al., 2009; Miller, Murnane, & Willet, 2008). These findings appear consistent with data from the 2015 to 2016 National Teacher and Principal Survey, which asks teachers whether they are satisfied with their teaching salary along with multiple questions about job satisfaction. Teachers who were dissatisfied with their salary were more likely to “think about transferring to another school” (37.9% compared with 23.4% for teachers satisfied with their salary), more likely to “think about staying home from school because I’m just too tired to go” (30.8% compared with 19.5%), and more likely to feel they had less enthusiasm relative to when they began teaching (51.9% compared with 36.6%). Overall, 54.8% of teachers were dissatisfied with their teaching salary (U.S. Department of Education, 2017).
Teachers’ economic anxiety predicts not only their stated plans to leave their teaching jobs but also their demonstrated exit from the district in as few as 2 years after completing our survey. That their economic anxiety does not predict school transfer suggests that, for these teachers, switching to another school within the district does not appear to be an appealing alternative that might prevent them from leaving altogether. Additionally, the stronger relationship between economic anxiety and nonretirement exit indicates that early retirement is not the main driver of this association, and that earlier-career teachers—for whom economic anxiety is higher on average in the first place—may be more responsive to financial stress in their decision to stay in their jobs. We unfortunately do not have data on where departing teachers go, so it remains an open question whether departing teachers ultimately leave to work in other districts or exit the profession entirely.
Although we find that economically anxious teachers are more likely to leave their jobs in SFUSD, we also find evidence to suggest they are not leaving because they no longer want to be an educator. These teachers are more likely to express interest in pursuing educational leadership roles at some point in the future than are teachers with less economic anxiety, suggesting that economic anxiety does not predict teachers’ disengagement with education in general. School and district leadership roles are likely to come with a considerable pay differential over classroom teacher salaries. For example, according to 2018–2019 SFUSD salary schedules, a veteran teacher with a bachelor’s degree and 13 years of service earns approximately $72,000, while an assistant principal earns at least $106,000. We cannot know for certain whether this pay increase explains the differential levels of interest in leadership positions among economically anxious teachers; however, the magnitude of the salary difference suggests this may be a relevant consideration for teachers who feel underpaid but remain passionate about education. It is also possible that the construct of economic anxiety correlates with a general dissatisfaction with one’s job or social status that makes higher status careers appear attractive; unfortunately, we are unable to test whether interest in higher level educational positions is distinct from interest in higher level positions generally.
Our data do not allow us to estimate causal pathways; however, the associations we find between elements of teachers’ financial situations and their economic anxiety offer insights into ways districts and policymakers may better support teachers. Raising teacher salaries overall is likely the most direct approach to addressing financial insecurity, though the increase necessary may be politically prohibitive. Alternative strategies that more specifically target the conditions that teachers struggling the most face are worthy of consideration, such as locating affordable housing closer to schools, offering housing stipends or low-cost loans, or making financial crisis grants available—alternatives to the support networks that some teachers lack. These and similar strategies have been employed to help low-income populations more generally, but their relevance to San Francisco’s teachers, that is, middle-income professionals, highlights a more general point. Several such professions—particularly those in human services—must be as geographically dispersed as their clientele. The Bay Area’s affordability crisis has long been a topic of discussion, but its reach into the lives of the supposedly middle class has only been more recently recognized. And yet, the Bay Area is likely to be just the leading edge of this problem, not its limit, as other cities with booming economic growth face steeply increasing costs of living. The issue of economic anxiety may plague educators acutely, but not uniquely.
The acuteness of this problem for educators, however, as well as its implications for the lives of the next generation, deserves special attention. While our analysis focuses on teachers who live and work in a high-cost urban area, there are indications that even across broader contexts, teachers’ economic well-being does not follow the patterns of middle-income workers overall. According to the General Social Survey, which tracks national attitudes and beliefs, in the years following the Great Recession, the percentage of teachers who believed that their financial situation was improving “during the last few years” stayed relatively stable, hovering between 27% and 38%. On the other hand, among employed respondents with a bachelor’s degree or higher who were not teachers, this percentage steadily increased, from 37% in 2010 to 53% in 2016. These statistics suggest that even outside the context of high living and housing costs, the economic landscape for teachers is not keeping pace with that of other middle-income professionals.
Finally, rather than providing a complete picture of the challenges that teachers face, our research raises additional questions about the nuances of teachers’ economic well-being and the ways it might be improved. We look at average trends across all SFUSD teachers regardless of where they live, recognizing that doing so might mask variation across teachers’ residential neighborhoods that could affect their quality of life, feelings of housing security, and satisfaction with their financial position. Additionally, more years of data could shed light on shifts in well-being over time and responses to targeted interventions, while research looking at teachers’ experiences in other districts and states could provide insight into the ways in which their experience is generalized or not across geographic context. Better understanding these contextual differences that make teachers feel more or less financially secure could help ensure a supply of teachers everywhere that students need them.
Footnotes
Appendix A
Table A1 presents descriptive statistics on our survey respondents, who make up our analytic sample. Column (1) shows the mean, and where applicable, the standard deviation for the various teacher and school characteristics that we use as explanatory variables in Table 2. Column (2) shows the same for the full sample of noncharter, public-school teachers in SFUSD in 2016. Across all variables, the means for the two samples are not significantly different.
In order to keep sample sizes consistent across the many regression models that include different covariates, we use missing flags for our explanatory variables; sample sizes for each model, then, are determined by the number of nonmissing responses to the dependent measure. For the regression results presented in Table 2, there is minimal missingness, since all explanatory variables come from administrative data. Missingness is more prevalent in the models shown in Tables 4 and 5, where the covariates are from survey data. For nearly all models shown in Table 4 in which the covariate comes from survey data, the missing flag is significant and negative, indicating that in general, those teachers who did not answer those questions are less likely to feel financially insecure. In Table 5, the missingness is less systematic, although those teachers who did not answer the questions on economic anxiety are less likely to have a high regard for teaching. Although typically patterns of nonrandom missingness should spark concern, in our case we suspect that, if anything, these patterns mean our results underestimate the relationships of interest.
Appendix B
Table B1 presents the results of our supplemental models examining the relationship between economic anxiety and teacher attitudes, attendance, and turnover, with the inclusion of additional controls representing potential mediators—specifically, teachers’ experience, age, whether the are from the Bay Area, and their interest in leadership roles. For simplicity, we model economic anxiety using an index variable constructed using principal components analysis on our three main economic anxiety variables used throughout the article (this index variable is described in more detail in Note 8). The dependent variables are consistent with those included in Table 5. Note that leadership aspirations and interest in a leadership role are the same variable and appear both as an outcome (column 8) and a control variable. As discussed in the main text, career aspirations are inherently interrelated with teacher attitudes and behaviors and we are agnostic as to the direction or relative strength of these relationships. As such, we see interest in leadership both as a relevant outcome for teachers and as a potential mediator for related outcomes. Note also that in the teacher survey, the question regarding teachers’ interest in leadership roles is a subquestion of their plans for the following year, which includes the option of resignation. Because of the nested structure of these questions, we do not estimate a model where the outcome is plans for resignation that also includes leadership aspirations as a control variable (column 9).
The results in Table B1 indicate that economic anxiety is still strongly predictive of teachers’ attitudes and behaviors, even when controlling for these potential omitted variables or mediators. For the most part, the magnitude of the relationships is consistent across specifications, although controlling for experience increases the association between economic anxiety and attendance. Additionally, controlling for age or experience decreases the magnitude of the relationship between economic anxiety and district exit (with or without retirement), though the majority of the associations remain statistically significant.
We also take a more detailed look at the association between economic anxiety and teachers’ interest in leadership roles by examining as separate outcomes teachers’ interest in instructional, school, and district leadership. The results are shown in Table B2. We find that economic anxiety more strongly predicts interest in school leadership than in instructional leadership and, depending on the measure of economic anxiety used, is slightly more predictive of district leadership than instructional leadership. It is worth noting that school- and district-level leadership positions generally have a larger pay increase relative to classroom teaching than insturctional leadership roles, suggesting that the increase in compensation may play a role in teachers’ stated interests. As we do in Table B1, we estimate supplemental models that control for potentially relevant confounders or mediators (Table B2, panel B). Our results are largely consistent across specifications.
Acknowledgements
We would like to thank Stephan Gordon, Daniel Menezes, and Laura Wentworth for their continued partnership and help. We are also grateful to the Stanford University Graduate School of Education Incentive Fund for Projects in San Francisco Unified School District. Support for this project was also provided by grants from the Institute for Education Sciences (R305B130017 and R305B140009) and the National Science Foundation (IBSS-L1620419). Correspondence of this article should be directed to Elise Dizon-Ross (
1.
The Marketplace Edison Research Survey was conducted through a combination of online and telephone (both landline and cell) interviews and is representative of Americans 18 years and older (Marketplace Staff, 2016).
2.
The first question’s answer options include “I am frequently anxious about my financial situation,” “I am sometimes anxious about my financial situation,” “I am rarely anxious about my financial situation,” “I am never anxious about my financial situation,” and “don’t know.” The second question’s answer options include “very easy,” “somewhat easy,” “somewhat difficult,” “very difficult,” “don’t know,” and “I don’t currently have rent or mortgage payments to make.” The third question’s answer options include “not at all difficult,” “somewhat difficult,” “very difficult,” and “don’t know.”
3.
These inequalities are all significant at the p < .001 level.
4.
Because not all 2,266 teachers in our sample responded to each of our three economic anxiety questions, the sample size varies across models depending on the dependent variable. We deal with the limited degree of missing data on independent variables by including covariate missing flags. See ![]() for more detail.
for more detail.
5.
We estimate alternative models for racial shares of the school population in which we control for the share of the student population enrolled in FRPL. The results of these models are effectively the same as those we report, with the exception that the coefficient on the share of Black students when predicting frequent financial anxiety is less precisely estimated and no longer statistically significant (β = 0.288, σ = 0.170).
6.
The precise median income for workers with a bachelor’s degree in the San Francisco–Oakland–Hayward metropolitan area was $66,506 in 2016 compared with $57,109 statewide. The salary premium for Bay Area workers is even higher among those with a graduate or professional degree, at $92,767 compared with $80,616 statewide.
7.
Our data track 10 different reasons a teacher might be absent: bereavement, illness, jury duty, military leave, nonservice, administrative leave, personal leave/emergency, professional development/permission day, special assignment, and subpoena.
8.
In addition to our three primary economic anxiety variables, we create a composite index measure of economic anxiety constructed using principal components factor analysis, in order to assess the variables’ collective predictive power in addition to their individual associations with teacher outcomes. We estimate all models shown in ![]() using this index as the explanatory variable and find that it demonstrates predictive power for all outcomes with the exception of the number of days absent due to professional development and the likelihood of school transfer, consistent with the results of the individual economic anxiety variables. These results are available by request. By construction, the mean of the index variable is 0 and the standard deviation is 1. A principal components factor analysis of the three economic anxiety variables yielded one factor with an eigenvalue greater than 1 (eigenvalue = 1.87). This factor variable accounts for 62.2% of the total variance of the three variables. Constructing an index using principal factors analysis yields similar results.
using this index as the explanatory variable and find that it demonstrates predictive power for all outcomes with the exception of the number of days absent due to professional development and the likelihood of school transfer, consistent with the results of the individual economic anxiety variables. These results are available by request. By construction, the mean of the index variable is 0 and the standard deviation is 1. A principal components factor analysis of the three economic anxiety variables yielded one factor with an eigenvalue greater than 1 (eigenvalue = 1.87). This factor variable accounts for 62.2% of the total variance of the three variables. Constructing an index using principal factors analysis yields similar results.
Authors
ELISE DIZON-ROSS is a PhD candidate in economics of education at the Stanford Graduate School of Education. Her research uses quantitative methods to study the impacts of economic inequality and educational and social policies on student outcomes and on the education sector more broadly.
SUSANNA LOEB is the director of the Annenberg Institute of School Reform at Brown University. She specializes in education policy, looking particularly at policies and practices that support teachers and school leaders.
EMILY PENNER is an assistant professor in the School of Education at the University of California, Irvine. Her research focuses on educational inequality and policy, and considers the ways that districts, schools, and teachers can contribute to or ameliorate educational inequality.
JANE ROCHMES is an assistant professor of sociology at Christopher Newport University in Newport News, VA. Her research integrates interests in social context, stratification, and education; she is particularly focused on how aspects of schooling perpetuate or ameliorate racial and socioeconomic inequality.