
Abstract
Freshman seminars are a ubiquitous offering in higher education, but they have not been evaluated using matched comparisons with data at scale. In this work, we use transcript data on over 76,000 students to examine the impact of first-year interest groups (FIGs) on student graduation and retention. We first apply propensity score matching on course-level data to account for selection bias. We find that graduation and re-enrollment rates for FIG students were higher than non-FIG students, an effect that was more pronounced for self-identified underrepresented racial minority students. We then employ topic modeling to analyze survey responses from over 12,500 FIG students to find that social aspects of FIGs were most beneficial to students. Interestingly, references to social aspects were not disproportionately present in the responses of self-identified underrepresented racial minority students.
Keywords
Undergraduate retention has long been an area of great interest in education, motivated in part by consistently high rates of college students not completing their degrees (Demetriou & Schmitz-Sciborski, 2011; Tinto, 1987). Recent estimates from the National Center for Education Statistics have about 40% of first-time, full-time bachelor’s degree-seeking students at 4-year postsecondary institutions not graduating within 6 years of first enrollment (Hussar et al., 2020; McFarland et al., 2018; McFarland et al., 2019) and the graduation rates are even lower for racial minority and Hispanic students (de Brey et al., 2019; Swail et al., 2003). These noncompleting students account for a lost investment on many fronts, with students spending valuable time/energy on their unfinished educational pursuits and institutions collectively spending billions on educating the students who leave their campuses (Johnson, 2012; Raisman, 2013). Of particular interest is the fact that a large number of those leaving higher education without degrees are the 20% to 30% of first-year (i.e., freshman) students seeking baccalaureate degrees who do not return for a second year of schooling (National Student Clearinghouse Research Center, 2019; Pascarella & Terenzini, 2005; Tinto, 1987).
One way in which universities have combated freshman attrition and attempted to improve the college experience is through the implementation of freshman orientation seminars (freshman seminars). Freshman seminars are courses focused on helping incoming students transition to college life, both socially and academically (Permzadian & Credé, 2016; Purdie & Rosser, 2011; Upcraft & Gardner, 1989). Freshman seminar courses draw on broader educational retention theory and the impact of social integration on persistence on students’ academic trajectories (Tinto, 1987). On large college campuses, freshmen often feel as though they do not have a personalized identity (i.e., they see themselves as another “face in the crowd”) while feeling overwhelmed by the competitive environment of higher education (Sullivan & Wulff, 1990). Freshman seminars (and, more specifically, learning communities) often rely on block scheduling and coregistration of classes, thus allowing students to take classes with the same group(s) of students. This promotes a sense of community, belonging, and provides freshmen with a means by which to more easily socialize and develop a peer group (Tinto, 2003; Tokuno & Campbell, 1992). This social engagement then helps students feel more connected to the campus community and more satisfied with the college experience overall (Cuseo, 2010) while helping them feel less isolated as learners (Tinto, 2003).
The popularity and ubiquity of freshman seminar courses in American higher education has helped make them a widely studied course genre (Barefoot et al., 1998; Cuseo, 1997; Padgett et al., 2013). However, the existence and effectiveness of these seminars on college campuses across the United States continues to be called into question (Griffin & Romm, 2008). Although some prior studies have used randomized controlled trials (e.g., 52), large scale and causally rigorous studies of seminar effectiveness using matched comparison groups are rare (Schnell & Doetkott, 2003). Additionally, these seminars are still inadequately assessed, particularly with respect to practical considerations for their design (Barefoot, 2000) as well as the degree to which specific student demographic subgroups are differentially affected by taking them.
In this work, we gather data from the institutional databases of a large, publicly funded U.S. university (the University of Washington, henceforth UW) to examine the impact of freshmen seminars on student outcomes using data science and large-scale econometric techniques. Using propensity score matching (PSM) on over 76,000 students across 17 student cohorts (and 22 years of data), we use information on students prior to their postsecondary education to match students who enrolled in first-year interest groups (“FIGs,” a type of freshman orientation seminar) with those who did not. We then examine the differences between these groups in terms of educational outcomes while also focusing on specific ethnic/racial groups (namely, Hispanic and underrepresented racial minority students). To our knowledge, only one previous study examined the effects of any freshman seminar using a similar methodology but did so with only a few hundred students, finding freshman seminars positively affected students’ likelihood to re-enroll for a second year (Clark & Cundiff, 2011). In this work, we examine graduation rates and grades in addition to re-enrollment rates and do so at a scale not seen in any previous study of freshmen seminars. We also focus on the impact of FIGs on specific student subgroups (namely underrepresented and Hispanic students) at scale.
To qualitatively understand the impact of FIGs on student success, we also examine the open-ended text responses of over 12,500 FIG-taking students across five cohorts of our data who were asked what they found most valuable about their FIG experience. To analyze these responses, we rely on topic modeling techniques to develop a preliminary codebook and then manually code each student survey response. We then use these survey responses to better understand which aspects of the freshman seminar can be linked to student success, as we hope this will help inform future research, particularly with respect to peer groups in education. In addition, we believe this analysis of survey responses complements our student enrollment data and presents valuable insight into the effective design of these seminars.
In all, we present an analysis of freshman seminars both at a scale previously unseen in the literature as well as using data science approaches previously not used in examining freshmen seminars. We leverage millions of course records for tens of thousands of students across decades of instruction to perform a rigorous matched comparison of students to assess the impact of FIGs on students’ educational outcomes. We then demonstrate how topic modeling techniques can be used to inform a codebook for the qualitative analysis of thousands of student survey responses, which further contextualize the matched comparison results. In so doing, we apply a gamut of data science approaches to a large data set to better understand the impact of a long-running educational program on student success.
Related Work
We present literature related to this study in the following manner: First, we provide a brief history of freshmen seminars. Then, we discuss prior studies that have assessed freshmen seminars. Last, we discuss prior works examining freshmen seminars specifically at the UW.
History of Freshman Seminars
Freshmen seminars take many different forms, including living learning communities, FIGs, and first-year experience courses (Purdie & Rosser, 2011). Though this work will focus specifically on FIGs, related research spans the spectrum of freshman seminar types. The freshmen seminar is defined by Barefoot (1993) as a course intended to enhance the academic and/or social integration of first-year students by introducing them (a) to a variety of specific topics which vary by seminar type, (b) to essential skills for college success, and (c) to selected processes, the most common of which is the creation of a peer group.
For the most part, these seminars tend to be smaller in size than most lower division courses, thereby allowing for greater student–faculty interaction and an environment more conducive to developing and fostering peer relationships (Padgett et al., 2013). These relationships are believed to allow for greater social integration of students within a campus community, thereby increasing students’ institutional commitment and their persistence toward the goal of graduation (Tinto & Goodsell, 1993).
Freshman seminars have long been a part of the American higher education landscape, with orientation courses dating back to the 19th century (Drake, 1966; Upcraft & Gardner, 1989). By the middle of the 20th century, a majority of institutions offered freshman seminar courses, with many campuses extending orientation beyond just a few days (Drake, 1966). This trend, however, reversed through the 1960s due to concerns about universities giving credit to students for adjusting to college life (Upcraft & Gardner, 1989). A resurgence in seminar offerings was partly fueled by courses such as the University of South Carolina’s “The University 101,” which became a standard for freshman seminars as other campuses attempted to develop similar programs (Schnell & Doetkott, 2003; Upcraft & Gardner, 1989). By the early 1980s, a growing interest in freshmen seminars saw conferences on freshman orientation/seminar courses held at the University of South Carolina (Upcraft & Gardner, 1989). Since then, freshman seminars have become near ubiquitous in the U.S. higher education landscape. The National Resource Center for The First-Year Experience and Students in Transition’s most recent numbers report that freshman seminars are offered for credit at 87% of 4-year institutions, of which 52% require them for students (U.S. Department of Education, 2016).
Assessing Freshman Seminars
Freshman seminars are widely believed to positively affect student retention, persistence, graduation, and academic performance (Berry, 2014; Cuseo, 1997, 2010; Fidler, 1991; Padgett et al., 2013; Pascarella & Terenzini, 2005). More specifically, numerous studies have found that freshman seminars tended to improve retention rates (recent examples include Millikin, 2011; Pascarella & Terenzini, 2005; Permzadian & Credé, 2016; Schnell & Doetkott, 2003; Stassen, 2003; Williford et al., 2001), improve graduation rates (recent examples include Klatt & Ray, 2014; Millikin, 2011; Pascarella & Terenzini, 2005; Schnell et al., 2003), and improve grades (recent examples include Jamelske, 2009; Permzadian & Credé, 2016; Stassen, 2003; Williford et al., 2001), among other outcomes.
Despite these outputs, however, it is difficult to disaggregate which aspects of freshman seminars contribute to specific student outcomes (Porter & Swing, 2006) and much of this is because of the study designs employed. Most studies examining freshman seminars do not explicitly account for selection bias (Cuseo, 2010; e.g., Klatt & Ray, 2014; Millikin, 2011). Other studies have used meta-analytic approaches (e.g., Berry, 2014; Permzadian & Credé, 2016) and/or regression approaches (OLS, multilevel, or other; e.g., Jamelske, 2009; Padgett et al., 2013; Porter & Swing, 2006; Stassen, 2003; Williford et al., 2001) in their assessment of freshman seminars. These studies compare students without matched controls or comparison groups, which have been underutilized when examining the effects of freshmen seminars (Schnell & Doetkott, 2003).
Examples of more causally rigorous studies on freshman seminars have used randomized controlled trials (e.g., Strumpf & Hunt, 1993) and PSM (e.g., Clark & Cundiff, 2011). Strumpf and Hunt (1993) performed a randomized controlled trial of 157 students at an undisclosed “large, predominantly white, urban institution.”The authors do not specify the dates for their study but details from the article suggest that it was likely in 1986. As part of their study, the authors randomly assigned 77 students to take a freshman orientation course and 80 students to not take the same course. When doing these assignments, the authors also ensured that an adequate number of Black students would be in each group, allowing them to examine the effects of the seminar across all students as well as a specific racial group (Black students). The researchers used a measure of “retention in good academic standing” as an outcome variable and examined up to four semesters after the seminar completed. The authors found that the seminar participants had higher rates of retention (74% after four semesters) compared with those who did not take the seminar (59% after four semesters). This effect was more pronounced when comparing the retention of Black students who participated in the seminar (82% after four semesters) with Black students who did not particpate in the seminar (44% after four semesters).
Clark and Cundiff, meanwhile, used PSM to match 109 seminar-taking students to 326 nonseminar-taking students at a “moderate-sized, Midwestern university” across three cohorts from 2004 to 2007 (Clark & Cundiff, 2011). They used 19 covariates in their logistic regression propensity score model and matched students in a one-to-many manner. The authors used GPA and first-year retention as comparison measures. After matching half of their treatment (seminar-taking) students (55 students) to control (nonseminar-taking) students, they found no difference in GPA and some evidence of higher first-year retention among those taking the seminar.
This work differs from these two previous studies in several meaningful ways:
This study examines students at a much larger scale (in the tens of thousands compared with hundreds) than either of the two previous studies.
This study uses a more expansive set of covariates to control for selection bias (in the hundreds compared with the tens) than either of the two previous studies.
This study examines students’ graduation rates, retention rates, and GPA as comparison measures where the two previous studies examined only retention and/or GPA but not graduation.
This study uses data that is more recent by using pulling institutional data records from 1998 to 2020.
This study contextualizes its quantitative results by examining open-ended student survey responses at scale.
FIGs at the University of Washington
The FIG program at the UW began in 1987 and was modeled after a similar program at the University of Oregon (Sullivan &Wulff, 1990; Tinto & Goodsell, 1993). FIGs are only offered during the first term of the academic year (Autumn quarter) and are for first-time, first-year students (freshmen) 1 students only. FIGs are optional for students and are not required for any graduation requirements as the FIG seminar only counts toward general education elective credit counts. FIGs are widely advertised to all incoming freshmen during orientation and advising sessions, which are required for all incoming freshmen before they register for classes. FIGs are open for registration during the standard university course registration period to all incoming first-time, first-year students (freshmen) who have completed the requisite orientation sessions. The UW Undergraduate Academic Affairs’ Office of First Year Programs (FYP) currently administers the FIG program and recent surveys of incoming freshmen by FYP indicate that only 3.6% of freshmen do not know what a FIG is by the time they start their coursework.
FIGs are presented as a cluster of classes, with participants co-enrolled in all classes of the cluster during their first academic term on campus. In addition to being co-enrolled in classes, all students within the same FIG cluster are also required to take a seminar class together. This seminar class has been led by an upperclassman peer since the program’s inception and is focused on a discussion of students’ personal experiences rather than academics, with an aim of developing a sense of involvement, participation, and community (Tokuno & Campbell, 1992). In the first year of the FIG program, 83 students enrolled in 4 different FIG clusters; in the second year of the program, 200 students enrolled across 8 FIG clusters; and in the third year of the program, 400 students enrolled across 20 different clusters (Sullivan & Wulff, 1990). Today, the FIG program has over 150 different clusters and enrolls between 50% and 60% of the UW’s annual incoming freshman population, totalling over 2,500 FIG enrollees annually. In the past, FIGs were organized around a central academic theme, such as pre-law or pre-engineering. Now, the program no longer explicitly delineates FIGs for particular interests, instead focusing on providing a more rounded experience for freshman entrants.
The UW operates on a quarter system and students in a FIG select a variable number of credits to enroll as part of a FIG, ranging from 2 credits (just the seminar class) to 17 credits (the seminar class plus three additional classes in which FIG mates are co-enrolled) for their first quarter. The UW charges block tuition for all students who register for between 12 and 18 credits, which is considered full-time undergraduate enrollment. There is no additional charge when students take the FIG seminar course and there are no restrictions specific to the FIG seminar as to how students pay for their tuition charges. Additionally, there is also no additional tuition charge when a full-time student enrolls in a FIG, as FIGs consist of a maximum of 17 credits. The above history and current state of the FIG program were confirmed with FYP.
Previous studies examining FIGs at UW looked at the program in its infancy in the late 1980s to early 1990s (Tinto & Goodsell, 1993; Tokuno & Campbell, 1992). Tokuno and Campbell (1992) looked at two freshman cohorts at the UW from 1988 and 1989 (about 6,660 students total), analyzing the effects of taking a FIG on scholarship and retention. Examining the 1989 cohort, they found that students who enrolled in FIGs had higher overall retention by 1.6 percentage points and also had higher course completion rates than their peers. However, the study only compared rates of graduation among the student groups and did not explicitly address confounding variables, not the least of which is the selection bias associated with students choosing whether to enroll in a FIG. In addition, the study was conducted during the program’s early years and less than 700 students had enrolled in FIGs during the program’s first 3 years combined, thereby limiting the general scope of the work.
Tinto and Goodsell conducted a longitudinal study in 1991, examining about 440 FIG students across 21 FIG clusters as well as about 1,800 non-FIG students (Tinto & Goodsell, 1993). In using both quantitative and qualitative approaches, they found that being involved in a FIG “seems to positively influence one’s sense of one’s own involvement as well as the nature of one’s peers and general institutional climate,” which then serve to impact both academic performance and persistence. As with the previous study, however, they did not account for selection bias among the students, particularly with respect to demographics and FIG students generally having higher entrance exam scores. Additionally, their comparison non-FIGs students were selected from specific courses and not across the entirety of the broader student population.
In this work, we compare FIG and non-FIG students using propensity scores based on a rich set of covariates detailing student characteristics and high school backgrounds prior to their entry into higher education. PSM was employed because students selected whether to enroll in a FIG on their own, rather than being randomly assigned. Thus, comparing students across this nonexperimental design poses the risk of treatment effects being biased. By matching students based on their propensity to enter FIGs (as explained in the Methods section), we attempt to account for potential confounders as well as self-selection. After matching students, we then compare academic outcomes across the FIG and non-FIG students. While previous studies on freshmen seminars attempted to correct for selection bias via individual covariates, they only included a limited set of covariates, which may not sufficiently account for self-selection (Clark & Cundiff, 2011). In our study, we match FIG and non-FIG students using nearly 200 covariates on a very large sample of students. Beyond this, to further delve into which specific aspects of a FIG are impactful to students, we also employ a text-mining-informed qualitative analysis on a large set of open-ended survey responses from FIG students. We believe this added analysis of first-hand accounts of the FIG program’s effectiveness helps elucidate why freshman seminars tend to provide measurable benefits to student academic outcomes at a scale not previously found in the literature.
Method
We present the methods for this project in the following manner. First, we give an overview of the data used in this study. Then, we give relevant definitions with respect to graduation and re-enrollment. Next, we give an overview of the methodology used in PSM. Then, we discuss our approach to analyze student survey responses. Last, we discuss our approach in building a predictive model using inputs from students’ FIG experiences. The UW’s Institutional Review Board approved the data collection and study design for this project.
Data
Data for this study spanned three distinct data sets: student registrar data, student survey data, and noninstitutional data. We describe each in greater detail below. The information on students prior to their entry to the University from all three data sets ultimately served as a rich set of covariates that we used both to predict the propensity for students to enroll in FIGs during their freshman year and as inputs into the supervised machine learning models.
Student Registrar Data
We collected de-identified student data from the UW’s data custodians in 2020. These data included complete student transcript records (courses taken, grades, etc.), student demographic information (race, gender, ethnicity, etc.), and student entrance application information (high school grades, entrance exam scores, etc.). We limited the data for this project to first-time, first-year students (freshmen) who first enrolled at the UW between 1998 and 2014. We used the year 2014 as a cutoff to allow at least 6 full calendar years for students to graduate with a baccalaureate degree (per the definition of graduate outlined below) as the data extended through 2020. In all, this included 22 years of institutional data and information on 90,623 unique freshmen students. We defined “FIG students” as those who had completed the two-credit FIG seminar course during the their freshmen year with a passing grade, as indicated on their transcript records, which track courses after the University’s add/drop date. We defined “non-FIG” students as those who did not complete the FIG seminar course during their freshmen year. In all, there were 256 instances of students who had withdrawn from the FIG seminar after the add/drop date (about 15 per year) and 1,298 instances of students completing the seminar but not receiving a passing grade (about 76 per year). These students were not used in the PSM.
Student Survey Data
The UW’s FYP collected exit surveys from nearly every FIG participant from 2010 to 2015. This was 14,514 students in total and an average of about 2,419 students per year (overall response rate of 98.3%). These surveys were given to students in FIGs at the end of their FIG term and asked students a wide range of questions regarding their FIG experiences. A few of the survey questions had responses that were recorded as open-ended text. For this project, we examined answers to a single question in the survey: “What did you find most valuable about the FIG?” for which there were 12,539 nonblank, open-ended text responses (86.4% of all survey respondents; 84.9% of FIG students). We chose this particular question because we felt it could help us better understand what aspects of the FIGs students found most beneficial. Note that the time frames for the survey data overlap with the student registrar data described above. We linked student survey responses to demographic and transcript data for all students providing survey responses.
Noninstitutional Data
In addition to the data from the University, we also used two additional sources of information: the College Board’s enrollment planning services (EPS) data 2 and U.S. Census data. The EPS is an analysis and reporting service from the College Board which provides detailed information for almost every high school in the United States. We used EPS data because these tend to have strong coverage across high schools where students take the SAT, which is the predominant entrance exam taken by students applying to the university (EPS data are provided by the College Board, who administer the SAT). The EPS data also have a large number of covariates for matching, many of which are related to students college aspirations and are not commonly found in other data sets. We felt these covariates could be used to better match students prior to them taking courses at the university (i.e., prior to them taking a FIG in their first term). From the EPS, we used data on students’ major intentions in higher education, students’ preferences with regard to postsecondary campus settings (both with respect to the campus itself and the city in which it is located), students’ long-term educational attainment goals, parents’ educational attainment, and parents’ income levels. EPS data are not available for individuals but are instead aggregated by high school. Accordingly, we aligned the EPS data to students’ registrar data using their high school CEEB (College Entrance Examination Board) codes from their applications to the University.
We also used 2015 U.S. Census data on average bachelor’s degree attainment and average high school completion for each ZIP code in the United States. We aligned the Census data to each individual student using the ZIP code from their application to the University.
Defining Graduation and Re-enrollment
We labelled students as “graduates” if they completed at least one baccalaureate degree within 6 calendar years of first enrolling at the University. We determined this by looking at the difference between the term for which students’ first baccalaureate degree was awarded and their respective first term on campus. We verified overall graduation rates with those used by the University’s institutional reporting offices. We labelled students as “re-enrollments” if they returned for a second academic year within 1 calendar year of the completion of their first academic year (i.e., they returned for their sophomore year within a year of completing their freshmen year). It should be noted that due to the large sample sizes used in this study, even minute differences between the groups are likely to be statistically significant. Though we present measures of statistical significance in this article, we have tried to emphasize the practical significance of the differences.
Propensity Score Matching
As aforementioned, students selecting whether they will or will not enter a FIG presents the issue of selection bias and possible confounding (Rosenbaum & Rubin, 1983). In addition, factors that are predictive of participating in a FIG may also be associated with students’ attrition or graduation. For example, a student whose parents have relatively low educational attainment may feel more unprepared for college and thus be more willing to seek additional help in the form of a FIG. At the same time, this students’ parents’ educational attainment may also be associated with lower academic success for the student. The existence of such factors makes it difficult to isolate the effect of FIGs from other possible factors that could affect the student outcomes of interest (in this case, graduation and re-enrollment).
As such, rather than simply comparing outcomes from treatment and control groups, PSM attempts to account for covariates that may influence the likelihood of receiving treatment (with “treatment” in this case defined as enrolling in a FIG). In PSM, a model is first constructed from potential confounders with a dependent variable associated with the treatment. The likelihood for each participant to receive treatment is referred to as the “propensity score.” Participants in the treatment group are matched to those in the control group based on their propensity scores using a range of criteria/restrictions.
We used students’ demographic information and precollege information from the registrar data as well as information on their high schools from the EPS data and information on ZIP codes from the census data to calculate the propensity scores via a logit model. In total, this included 197 covariates, broken down as follow: 41 from the student registrar databases, 3 from the U.S. Census data, and 153 from the EPS data. These covariates included but were not limited to students’ age, gender, residency, race/ethnicity (when not isolating to match on these covariates), standardized test scores, high school GPA, and high school coursework pulled from the student registrar databases; students’ home zip code’s percentage of population with bachelor’s degrees, and percentage of population completing high school from the Census data; and aggregated info (by high school) on students’ major intent and college plans from the EPS data. Our approach to PSM followed suggestions by Rubin and Thomas (1996) regarding the inclusion of all potential covariates in a propensity score model unless there is consensus that it is unrelated to the outcome variable.
A list of covariates used in the matching along with standardized bias calculations (which are discussed later in this article) are shown in the Table 7 of the online supplemental material. In all, the coviariates we used in the PSM were potential confounders when comparing student performance, graduation, and retention as well as variables that, in our data set, were highly associated with joining the treatment group (i.e., taking a FIG seminar). Among these were gender, race, residency, and high school academic preparation which, as can be seen by the standardized bias values before matching in Table 7, were skewed among the FIG and non-FIG groups. Table 7 also shows the degree to which PSM helped control for these differences between FIG and non-FIG students prior to matching.
After calculating propensity scores, we matched students in the treatment (FIG) group to those in the control (non-FIG) group using two levels of stratification and fixed caliper widths. We also employed different matching strategies when comparing the students, as described below. In terms of stratification, we first matched the students according to their time of entry to the University and then by whether they were a STEM-interested student (i.e., a student interested in science, technology, engineering, and/or math [STEM] fields). We used the first stratum to account for any institutional variation at the University across time and matched students based on entry year and entry term. We used the second stratum to account for course difficulty as introductory STEM courses are considered among the most challenging for new students and these students may feel differential levels of engagement while taking these courses (Gasiewski et al., 2012). STEM interest was determined by whether students’ major declaration during their first term was in a STEM field, whether they had a pre-major designation that was associated with a STEM field during their first term, and/or whether they took any STEM gatekeeper classes during their first term. 3 We coded STEM interest in a binary manner. Using this dual stratification, we matched every FIG student to corresponding non-FIG students from the same entrance year and with the same (binary) indication of STEM interest.
After the above stratification, we matched students based on caliper matching, wherein students were matched if they had propensity scores within a specified interval from each other. We kept the caliper at one tenth of the pooled standard deviation of all propensity scores. This is half the caliper width recommended by Austin (2011), thereby giving more stringent matching. Using the caliper, we matched students in each group in three different ways: one-to-many (where the results from the matched non-FIG group were averaged), one-to-one with replacement (where each FIG student is only matched to a single non-FIG student, but not vice versa), and one-to-one without replacement (where each FIG student is only matched to a single non-FIG student and vice versa). After matching students, we compared the graduation and re-enrollment rates of the student groups.
We also performed an additional round of matching to better control for course difficulty. In this round of matching, we only included matches if the FIG and non-FIG students had completely identical coursework for the academic term in which the FIG student completed the FIG seminar. We only included courses that were completed for numeric grades (i.e., not pass/fail) in this matching and the FIG seminar course was excluded when finding students with identical coursework. We did this by first creating a large matrix where each row represented a student and each column represented a course that was taken across our data set (2,174) and then matching identical rows in the matrix after accounting for the year of entry, STEM interest, and caliper. After matching, we compared students’ grade point averages (GPAs) for the term where students had identical coursework in addition to comparing their eventual re-enrollment and graduation.
In addition, we also compared Hispanic and underrepresented racial minority students based on FIG entry. We theorized that underrepresented racial minority students may be more likely to benefit from FIG for several reasons. First, in a predominantly White institution, such as the university in this study, the retention and persistence for underrepresented racial minority students is a critical equity goal that the institutional strategies aim to achieve. Research has shown that supportive educational environments during college are positively linked to the retention and persistence for underrepresented racial minority students (e.g., Bonous-Hammarth, 2000; Cole & Espinoza, 2008). More specifically, the support for underrepresented racial minority students from senior students, particularly advanced senior students of similar ethnic groups, include role modeling, tutoring for academic learning, and mentoring of how to navigate the university life (Palmer et al., 2010; Palmer et al., 2011). Second, students of color use peer-to-peer networks among freshmen to improve their academic performance and navigate college life. Peer networks are essential in improving underrepresented racial minority students campus engagement, recreation, and leisure, which play important roles in their social integration (Farmer-Hinton, 2008; Patterson, 2018; Zirkel, 2004). We thus hypothesized that FIGs, which are intentionally designed to build mentoring relationships and learning social and academic learning support, may be particularly beneficial for underrepresented racial minority students.
The race and ethnicity breakdowns used in this study were in accordance with how the university disaggregates students for Federal reporting. Because of this, categories for ethnicity (Hispanic and not Hispanic) were distinct and mutually exclusive from the race categories. Additionally, the list of underrepresented racial minority groups is maintained by the UWs Office of Minority Affairs and Diversity and includes federally recognized underrepresented minority students. We understand that these definitions may not align with other literature, particularly in the manner in which race and ethnicity are mutually exclusive and how underrepresented racial minority student groups are defined. However, they were how the data were organized in the institutional databases we used. When comparing Hispanic with non-Hispanic students and students from underrepresented racial minority groups to those not in underrepresented racial minority groups, we only included FIG and non-FIG students from the specific student subgroup for matching and all other students were excluded. As with all students, we used a dual stratification across year and term of entry and STEM interest when matching. We also reset the caliper widths based on one tenth of the pooled standard deviation for each student subgroup.
Survey Analysis
To code survey responses describing what students found most valuable about FIGs, we relied on a topic modeling-based qualitative analysis approach using inductive content analysis. First, we developed an initial codebook using a form of topic modeling called Latent Dirichlet allocation (LDA) (Blei et al., 2003). LDA is a generative statistical model that allows for topic discovery. In LDA, “documents are represented as random mixtures over latent topics, where each topic is characterized by a distribution over words” (Blei et al., 2003). In the case of the survey responses, the documents refer to individual student responses and the topics are general themes in the survey responses as represented by associations with specific words. We determined the optimal number of topics for LDA by varying the number of topics and calculating the perplexity of the topic models while reviewing how distinct the generated topics were. For this work, we wanted to use the topic modeling as a starting point in coding the massive text corpus—it was not going to be used to generate a final set of topics for our codebook. Therefore, our human understanding of what the topics meant and how distinct they were was critical. Ultimately, we generated five initial topics using LDA which allowed for the distinction of preliminary codes of interest. Prior to generating the topic models, we removed stop words (i.e., commonly occurring words which do little to distinguish topics within a text corpus) from the survey responses and stemmed the remaining words using a Porter stemmer.
After generating the topic model, we examined common themes and ideas presented within each topic based on the co-occurrence of words. This allowed us to accelerate our memoing during open coding of survey responses. Whereas this phase of analysis typically relies on an iterative reading, coding, and analysis of text to develop a codebook, we were instead able to leverage the results from topic modeling to get a sense of predominant themes in the responses and develop codes therefrom. From there, two researchers independently coded an initial set of 1,000 survey responses and iteratively expanded and refined the codebook to use. The researchers used each code within the codebook in an independent manner for each response unless specifically noted in the Results section (i.e., the use of one code did not exclude the use of another). There was also no limit to the number of codes that could be applied to each response. After coding the initial 1,000 responses together, the researchers each coded an additional 1,000 responses independently and discussed consistency in coding thereafter. Then, the researchers coded every remaining response individually. After coding all 12,539 responses individually, each response that was not coded identically between the two researchers was discussed and a consensus regarding coding was drawn. The researchers were only provided with the text of the student survey responses and the codebook when coding responses; student demographics and academics were not visible in any way. We used the final set of codes for each individual student response in the analysis.
Analysis Tools
All data pulls from institutional databases for this work were performed using custom SQL scripts. All data manipulation, integration, and analysis for this work was performed using custom scripts in the python programming language. The analysis pipeline was built using many widely used python data analysis libraries including pandas (2020), NumPy (Harris et al., 2020), SciPy (Jones et al., 2001), NLTK (Bird, 2006), and scikit-learn (Pedregosa et al., 2011). No other software or tools were used in the analysis.
Results and Discussion
FIG Participation
Of the 90,623 students in the study, 6,585 students (7.3%) had high school information that could not be matched to EPS data and an additional 6,446 students (7.1%) did not have both SAT math and verbal scores, which were used in the PSM. Among those without EPS data, 30.0% were FIG students and 70.0% were non-FIG students. Among those without SAT scores, 48.8% were FIG students and 51.2% were non-FIG students. Students without EPS data, without SAT scores, and who withdrew from the FIG seminar after the add/drop date or did not receive a passing grade for the seminar (as detailed in Data Subsection of the Methods section) were removed from the PSM, resulting in 14,299 (15.8%) students being excluded in total. Among these 14,299 students, 5,019 (35.1%) were students who completed the FIG seminar and 9,720 (64.9%) were students who did not complete the FIG seminar. These proportions were skewed toward non-FIG students in large part because the group of students who withdrew or did not complete the FIG seminar were composed entirely of non-FIG students.
After these exclusions, the PSM centered on the remaining 76,324 students, which we will henceforth refer to as the “study population.” Of these students, 41,894 (54.9%) enrolled in a FIG, while 34,430 of them did not (45.1%). Table 1 shows the demographics of the FIG and non-FIG students. There were a few relatively large differences in demographic composition among FIG and non-FIG students with respect to gender and race. In particular, female and Caucasian students were overrepresented among FIG students, while male and Asian students were underrepresented among FIG students. For the most part, all other demographics were fairly consistent in terms of proportions across the two groups. Interestingly, Tokuno reported that in the early years of the FIG program at UW, African American, American Indian, and Hispanic students were less likely to enroll in FIGs than other demographic groups (Tokuno & Campbell, 1992). This, however, was not the case with the students examined in this study as each of these groups were slightly more represented among FIG students. The race and ethnicity breakdowns shown in Table 1 and used in this study were in accordance with how the university disaggregates students for Federal reporting. Because of this, categories for ethnicity (Hispanic and not Hispanic) were distinct and mutually exclusive from the race categories.
Demographic Overview of First-Year Interest Groups (FIG) and non-FIG Students

The number and proportion of freshmen who completed FIGs across time is shown in Figure 1. Both increased steadily from 1998 through 2003, only to mostly see a downward trajectory since. In terms of percentages, FIG participation increased steadily from 40.3% in 1998 to 65.8% in 2003, only to remain fairly level from there and never dropping below 55%. Since 2005, FIG participation has remained between 45% and 60% of all incoming freshmen.
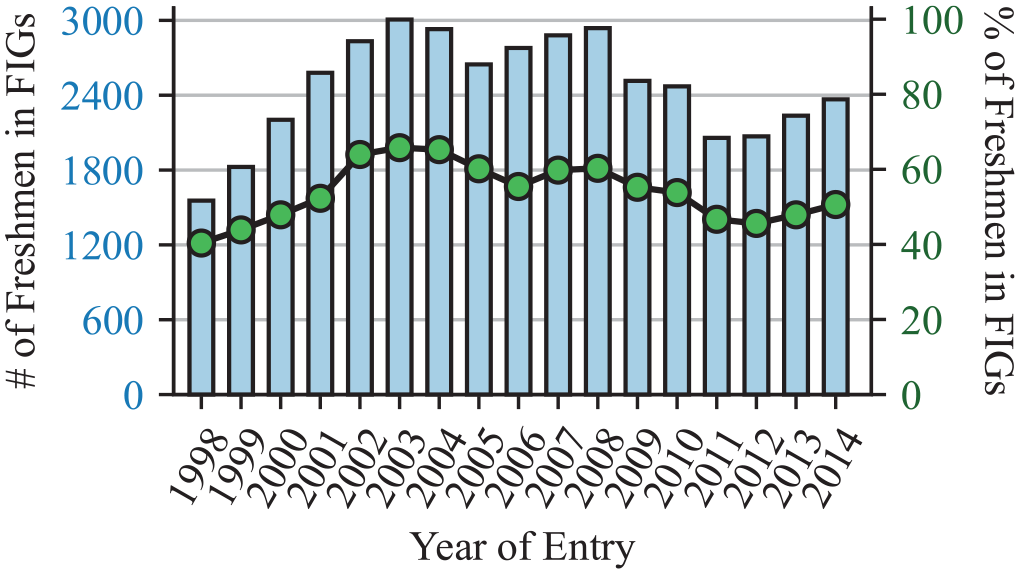
First-year interest groups (FIG) enrollment as count of freshmen (bar chart) and percentage of freshmen (line chart).
Propensity Score Matching
The distributions of the propensity scores for FIG students, non-FIG students, and non-FIG students matched to FIG students in a one-to-many manner are shown in Figure 2. The mean (±SD) propensity score for FIG students was 0.59 (±0.12) and the mean (±SD) propensity score for non-FIG students was 0.50 (±0.15), where, as noted earlier, these propensities represent the probability of a student enrolling in a FIG, regardless of whether they ultimately did. As such, the fact that FIG students had higher propensities than non-FIG students should come as no surprise. The shape and range of the distributions of propensity scores across FIG and non-FIG students show a large amount of common support, thereby indicating a high number of potential matches across FIG and non-FIG students. The caliper used when matching all students was 0.0145—each FIG student was matched to corresponding non-FIG students who were within ±1.45% as likely to enroll in a FIG. The resulting distribution of matched non-FIG students consists of the average propensity of all non-FIG students who fall within the designated caliper for each FIG student. The shape of the distributions of propensity scores of FIG and matched non-FIG students is nearly identical. The distribution of matched non-FIG students had a mean propensity score of 0.59 (±0.12), which was identical to the mean and standard deviation of the propensity score of FIG students.
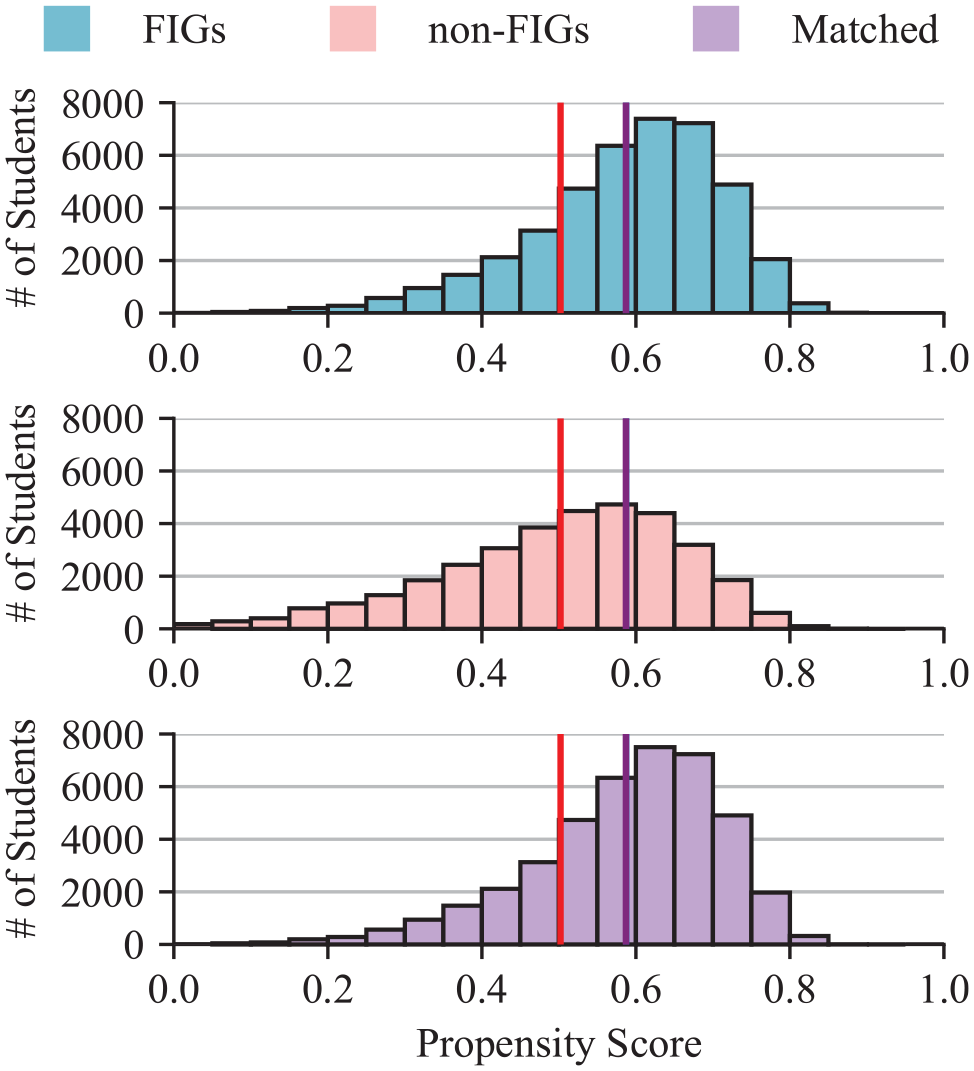
Propensity score distributions for first-year interest group (FIG) students (top), non-FIG students (middle), and matched non-FIG students (bottom).
To evaluate the effectiveness of the PSM, we calculated the standardized bias across each of the variables used in the PSM. The standardized bias calculation, as described by Caliendo, is a “measure to assess the marginal distance of the (variables)” used in the PSM and is calculated as “the difference of sample means in the treated and matched control subsamples as a percentage of the square root of the average of sample variances in both groups” (Caliendo & Kopeinig, 2008). In most empirical studies, a bias reduction below 5% is typically seen as sufficient in reducing potential confounding (Caliendo & Kopeinig, 2008). After PSM, the standardized bias across all covariates used in PSM had a mean value of 1.25%. Only 5 of the 197 covariates had a standardized bias value greater than 5% and none were greater than 7%. Standardized bias measures before and after matching for the covariates used in the PSM are shown in Table 7 in the online supplemental material.
When looking at one-to-many matching across all students, 41,833 FIG students (equivalent to 99.9% of the FIG population) had at least one non-FIG student matched. Of these matched students, 38,499 FIG students (92.0%) had at least 20 non-FIG students matched, again indicating a high level of common support for PSM. Each FIG student was matched to an average (±SD) of 64.3 (±35.6) non-FIG students and the distribution of matches per FIG student is shown in the top of Figure 3, with colors indicating the quartile of the propensity score of the FIG student. As can be expected, students with propensity scores in the second and third quartiles had the greatest number of matches, while FIG students who were more on the fringes of the propensity score distribution tended to have fewer matches. The bottom of Figure 3 shows a cumulative frequency graph of the number of matches for FIG students.

Distribution of the number of matches for each first-year interest group (FIG) student when using propensity score matching (top).
Retention and Graduation Rates
Unadjusted Rates
Prior to examining the differences between FIG and non-FIG students using PSM, we calculated unadjusted overall graduation and re-enrollment rates. Graduation and re-enrollment rates for the study population were 80.0% and 93.3%, respectively. Graduation and re-enrollment rates for the FIG students were 82.1% and 94.4%, respectively; graduation and re-enrollment rates for the non-FIG students were 77.6% and 92.0%, respectively. FIG students had much higher unadjusted graduation and re-enrollment rates than their non-FIG peers and, across the University as a whole, rates were substantially higher than national averages (McFarland et al., 2017). Rates for all FIG and non-FIG students across time are shown in Figure 4. For every entry year examined, we found that FIG students had higher graduation and re-enrollment rates than their non-FIG counterparts. Note that these rates were prior to matching students using PSM.

Graduation rates (top) and re-enrollment rates (bottom) for first-year interest group (FIG) and non-FIG students across time.
Rates After PSM
Graduation and re-enrollment rates for FIG and non-FIG students after PSM are shown in Table 2. The results did not significantly change based on the matching strategy used. As such, only results from one-to-many matching are discussed in further detail. After matching, FIG students tended to have substantially higher graduation and re-enrollment rates than their matched non-FIG peers (differences of 5.2 and 2.9 percentage points, respectively). These differences amount to decreasing the overall institutional attrition rate by 26.0% and the institutional first-year attrition rate by 43.3%. The percentage point differences in re-enrollment between FIG and non-FIG students are greater than those found by Tokuno (1.8 percentage points higher for FIG students; Tokuno & Campbell, 1992) but lower than those found by Tinto (over 6 percentage points; Tinto & Goodsell, 1993) at the same university. Additionally, these differences in re-enrollment rates are lower than those noted in previous studies comparing freshman seminar participants with nonparticipants (e.g., Millikin, 2011; Schnell & Doetkott, 2003; Stassen, 2003). It should be noted, however, that for both groups, the re-enrollment rates are greater than 90%, thereby decreasing the potential maximum difference between the two groups in terms of percentage points. While the differences in re-enrollment rate percentage points are in line with the PSM-based study conducted by Clark, the differences between baseline rates are much less pronounced in this study (Clark & Cundiff, 2011).
Graduation and Re-enrollment Rates for all Students After Propensity Score Matching With Standard Errors

Note. All differences between first-year interest groups (FIG) and non-FIG students were statistically significant (p < .01).
Matching Coursework
When matching students with identical coursework during the term in which the FIG student completed the FIG seminar, 2,439 students were matched. Of these, 945 FIG students were matched to more than one non-FIG student. The graduation rates, re-enrollment rates, and GPAs for FIG and non-FIG students after PSM are also shown in Table 2. Controlling for coursework, FIG students had notably higher GPAs (+0.09 on a 4.0 scale) when taking the same courses as their non-FIG counterparts. Interestingly, this analysis did not account for which courses were specifically part of the FIG and only looked to see that the students were taking the same courses. For example, this allows for FIG students who took three courses as part of their FIG (in addition to the FIG seminar) to be compared with non-FIG students who took the same three courses. It could also allow for FIG students who took the FIG seminar as a stand-alone course alongside three additional courses to be compared with non-FIG students who took the same three courses. Regardless, the results here indicate that FIGs tend to have a substantial effect on student academic success (as measured by GPA) regardless of whether the students take courses as part of the FIG cluster. The specific benefits of taking courses as part of a FIG versus not were not examined in this analysis. In addition to this difference in GPA, the difference in graduation and re-enrollment rates for FIG and non-FIG students follow the same trend as above, though to different degrees. Using coursework in addition to PSM to match students yielded differences in graduation (5.2 percentage points) and re-enrollment (3.3% percentage points) rates that were in line with results when not accounting for student coursework.
Examining Specific Student Groups
In addition to examining the graduation rates for all students, specific student groups were also examined. We compared students who self-identified as being Hispanic as well as students who self-identified as belonging to an underrepresented racial minority group. As mentioned previously, race and ethnicity were distinct and mutually exclusive groupings. Also, the list of underrepresented racial minority groups is maintained by the UW’s Office of Minority Affairs and Diversity and includes federally recognized underrepresented minority student groups. As was done with all students, we matched students who enrolled in a FIG with non-FIG students using PSM while stratifying on year of entry to the University and STEM intention. We reset the caliper width for each subgroup (i.e., Hispanic and underrepresented racial minority students) and a one-to-many matching strategy was employed. The caliper when matching Hispanic students was ±1.29% and for underrepresented racial minority students was ±1.24%. Of the 2,545 Hispanic students in FIGs, 2,288 (87.5%) were matched to at least one Hispanic non-FIG student; of the 2,382 underrepresented racial minority students in FIGs, 2,106 (88.4%) were matched to at least one underrepresented non-FIG student.
The graduation and re-enrollment rates after PSM across student subgroups are shown in Table 3. A few things are of note when looking at these rates. First, the differences in graduation and re-enrollment rates for Hispanic FIG students versus Hispanic non-FIG students were similar to those across all students, as shown in Table 2. Meanwhile, the graduation and re-enrollment rates of underrepresented FIG students were substantially higher than their non-FIG peers and much more pronounced than the estimated effect of taking a FIG when examining all students. Second, the graduation rates for both Hispanic and underrepresented racial minority students were still below the University’s average across all students. These facts could go hand-in-hand as the lower average rates across these groups allows for more differential gains in terms of percentage points to be realized for students attending FIGs. We know that the FIG curriculum at the University is not tailored to specific student groups based on race, ethnicity, or family backgrounds. Additionally, the larger realized effect for underrepresented racial minority students echoes the results from Strumpf and Hunt’s randomized control trial, wherein they saw a larger effect on retention for Black students who took a freshman seminar compared with the effect for all students (Strumpf & Hunt, 1993). Due to having small samples for some race groups, we were unable to conduct our matching while further disaggregating underrepresented racial minority students by race to examine the differential impact of FIGs on specific races. However, our findings for Hispanic and underrepresented racial minority students suggest potential differential effects for different ethnic/racial groups and we intend to further examine this in future work, as well as potentially looking at first-generation college entrants.
Graduation and Re-enrollment Rates for Hispanic and Underrepresented Racial Minority Students After Propensity Score Matching With Standard Errors
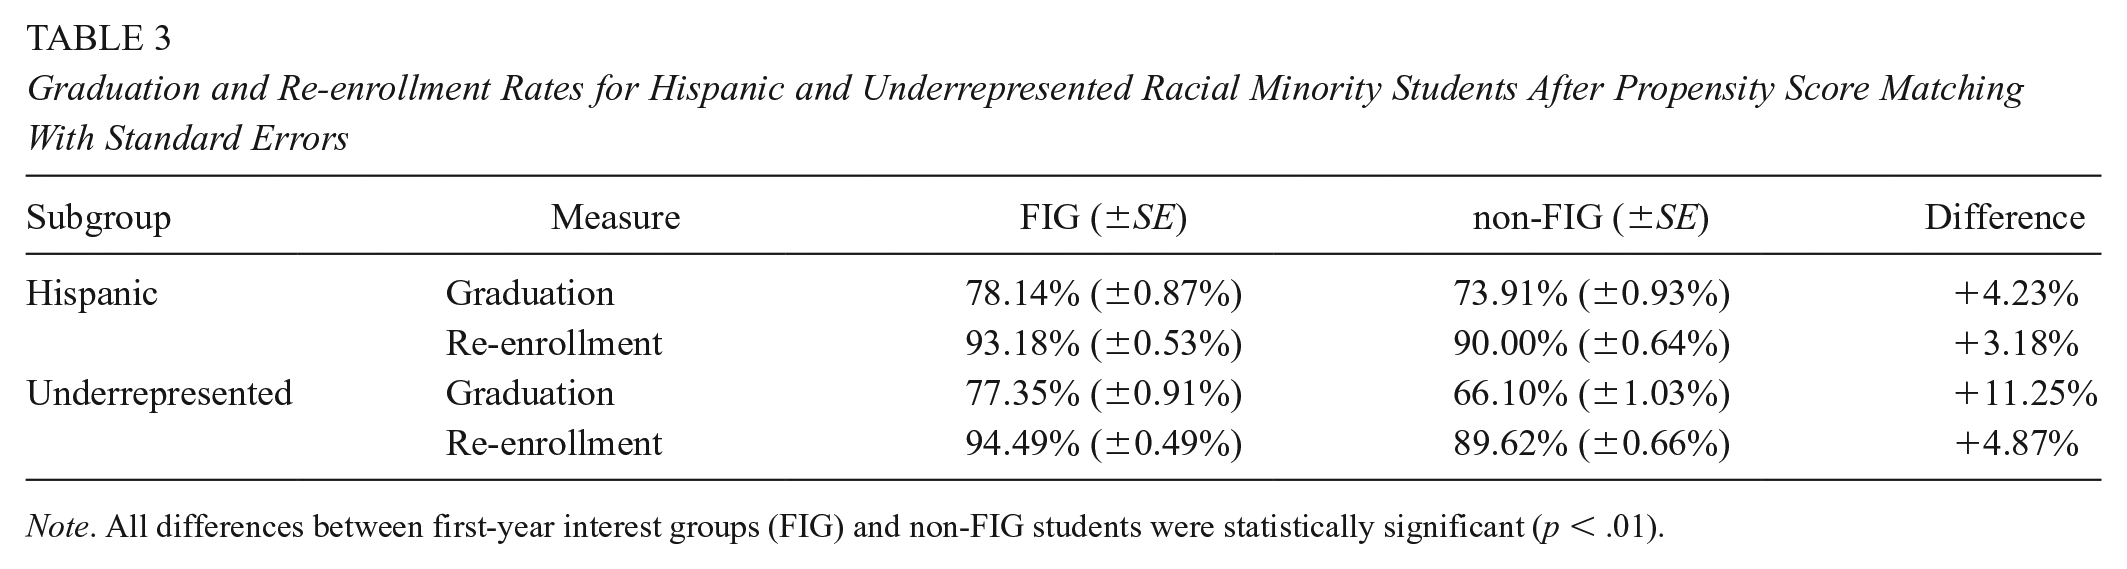
Note. All differences between first-year interest groups (FIG) and non-FIG students were statistically significant (p < .01).
It becomes apparent when examining the results from PSM across Tables 2 and 3 that the observed differences in FIG and non-FIG students are very robust to different matching strategies and across student subgroups. Regardless of the matching strategy employed and student subgroup examined, differences between the graduation rates for FIG and non-FIG students were always at least 4.4 percentage points higher for FIG students, while differences in re-enrollment rates were always at least 2.6 percentage points higher for FIG students. The fact that the PSM graduation and re-enrollment rates were similar to the unadjusted graduation and re-enrollment rates highlighted in Figure 4 is in part due to the number of possible matches based on FIG students’ propensity scores, as nearly the entire FIG population was matched to at least one non-FIG student. This also speaks to the degree to which there was common support among the propensities of FIG and non-FIG students, without which the given number of matches would not be possible. This wide common support is indicative that the differences between FIG and non-FIG students, as described by the variables used in the propensity score model, were not extreme. It should also be noted that even when matching students on more stringent criteria (i.e., matching students with identical coursework), far fewer students were matched and the differences between FIG and non-FIG students still persisted. All differences between FIG and non-FIG students shown in Tables 2 and 3 were statistically significant (p < .01) across all measures, matching strategies, and subgroups. Though this can be expected due to the large sample sizes in the study, we do believe the differences are also large enough for practical significance.
Survey Analysis
The above large-scale econometric analysis sheds light on the degree to which FIGs affect student outcomes. To better understand specific aspects of FIGs that students found to contribute positively to their education experience, we analyzed student survey responses using an approach that relied on both topic modeling and grounded theory. We then leveraged this analysis in building machine learning models to predict student success.
Developing a Codebook
We used topic modeling (namely, LDA) to develop an initial set of codes to use when examining responses from the student surveys. We provide examples of student responses (and associated codes) in the online supplemental material. We determined that five was an optimal number of topics to use in the LDA model based on our calculations of perplexity and our reading of the words associated with the topics. As noted earlier, the purpose of the topic modeling was to give us grounding to start our coding of the text responses. Thus, it was imperative that we not only understood the topics generated by the topic modeling but that they were readily distinguishable to the coders as they began to examine the survey responses. The five topics from the topic model and 10 words associated with each of the topics are shown in Table 4 with three common terms (FIG, valuable, part) excluded from each word list. Apparent from the topic/word list is that students tended to talk about their FIG leader and/or the FIG program, information on majors, information on campus resources, meeting people and/or making friends, forming study groups in a class, learning about UW, and learning about the city of Seattle.
Topic Modeling Results

Note. Words are listed in descending order of probability to appear in a topic.
We used the LDA-informed topics to better understand discussion points and themes of interest in the student survey responses. This allowed us to further develop the codebook detailed in Table 5. The codebook consisted of 18 unique codes and included a DROP code that was used for responses that were deemed irrelevant to the survey question. These responses were subsequently removed from the analysis and any percentage counts. The codes examined the responses from the perspective of academics (e.g., the finding interests and getting into classes codes), social integration (e.g., the meeting people, community, and people in classes codes), program organization (e.g., the cluster and connected classes codes), seminar design (e.g., the activity, smaller class, and course codes), and general college transition (e.g., the transition and skills codes). As noted previously, all codes were applied in an independent manner (i.e., the use of one code did not exclude the use of another) unless in the cases of the interests code, which was only used in conjunction with the meeting people code.
Codebook Used in Analysis of Survey Responses

Coding Results
Two coders independently coded each of the 12,539 survey responses, with codes applied independently and in a mutually exclusive manner. There was also no limit to the number of codes that could be applied to a single response. When examining the responses of all students, seven codes were used in at least 5% of all responses: new people (52.3%), people in classes (23.7%), activity (13.7%), survival skills (13.4%), FIG leader (9.2%), interests (6.0%; used in conjunction with new people), and transition (5.3%). All other codes were used in less than 3.5% of responses and were not analyzed further. The frequencies with which the seven codes were applied are shown in Table 6.
Frequency of Applied Codes (Only Those in at Least 5% of all Responses Are Shown)

Note. Percent agreement refers to percentage of responses for which coders applied the code in an identical manner. Percentages for students indicate percentage of responses from student group that were given the respective code.
p < .05. **p < .01.
In all, the two researchers coded 8,897 (71.0%) of all responses identically, regardless of the number of codes applied to each response. Table 6 also shows the degree to which the coders applied similar codes on a code-by-code basis, both in terms of general percent similarity as well as Cohen’s kappa values calculated for each code independently. Metrics were not calculated for the similar interests code as it was only used in conjunction with the meeting people code. In all, the coders had at least 90.7% agreement across each of the 18 codes. Additionally, each of the six codes that were used in at least 5.0% of responses and analyzed had a Cohen’s kappa value of at least 0.66, with three of the six having Cohen’s kappa values greater than 0.85. These metrics were calculated before the coders discussed discrepancies in their coding and arrived at a consensus across all codes. All calculations regarding the frequency of applied codes are based on codes after the coders came to a consensus regarding nonidentical codes.
Far and away, students thought that social aspects of the FIG were the most valuable with over half of all responses referencing meeting new people and/or making friends. Meanwhile, the second most frequently applied code referenced knowing people in classes and being able to form study groups. Also interesting is that about one tenth of those mentioning meeting new people also voluntarily shared that meeting people who share common interests with them was also important. This idea of greater social integration within a campus, be it by making friends and/or meeting people, is frequently visited in retention theory as a factor in increasing retention (Tinto, 1987). In this case, over 70% of all respondents mentioned some social impact the FIG had on their first term (across the new people, people in classes, FIG leader, and community codes). The idea of forming study groups in classes also ties into the idea of first-year students being academically supported as they adjust to college-level study and gain confidence (Porter & Swing, 2006). This points back to Barefoot’s definition of freshman seminars and how they “provide essential skills for college success” and also can be integral to them forming a peer group (Barefoot, 2000).
The third-most applied code referenced survival skills on campus. Most often, this code was used in reference to students understanding how to succeed in college, such as how to use library resources, how to register for classes, and where to find help with homework. The fourth most applied code referenced activities that were part of the seminar, frequently referring to an activity wherein the FIG leaders led their students off campus to explore the city. Most students referenced this activity in the context of being able to better acquaint with their peers outside of a class while also learning more about the city they are living in. It should be noted that as the largest postsecondary institution in Washington State, the UW enrolls many students who have never lived in the city of Seattle and/or in an urban setting. The FIG students also frequently mentioned their FIG leader as being a valuable asset. Much of this was in reference to having an undergraduate peer who had been in their position as a freshman and knew how to navigate the University, both physically and academically. In some cases, students also referenced their FIG leader as being an effective sounding board with regards to struggles as they adjusted to college life.
Table 6 also shows the frequency with which the codes were applied to responses from student subgroups. All differences in code frequency across student subgroups were relatively small (within ±3 percentage points). Comparing Hispanic students with non-Hispanic students, only mentions of meeting new people (2.9 percentage points higher for Hispanic students) and survival skills (1.0 percentage points lower for Hispanic students) differed by more than ±1 percentage point. When comparing underrepresented racial minority and nonunderrepresented racial minority students, the largest differences was in the code referencing students finding peers with similar interests, which was actually mention 2.6 percentage points less frequently by underrepresented racial minority students. Meanwhile, the code referencing a specific activity in the FIG and the code referencing survival skills on campus were references 1.8 and 2.2 percentage points more often, respectively. It should be noted that both Hispanic and underrepresented racial minority students tended to mention meeting new people more frequently than their peers, though the observed differences in the frequency of applied codes are still rather small across all groups (<3%).
It does not seem as though specific student subgroups found the FIGs more valuable than their peers in any particular way based on their subjective responses. This is highlighted by the fact that only one of the codes was found to differ between subgroups to a statistically significant degree: the transition code when examining underrepresented racial minority students (p < .01). This is particularly interesting when considering the larger impact FIGs had on these student subgroups in terms of academic success, as shown in Table 3. One potential explanation of this is that FIGs these students are more unprepared for their transition to college that the FIGs assist with, albeit in a manner that is not differentiable across student groups. An alternative explanation is that FIGs do have some differential impact on these groups with respect to the codes examined but it is not subjectively noted or articulated across the student subgroups. We intend to examine both possible explanations in greater detail in the future.
In all, the results from this analysis of student survey responses help provide further context to the results from PSM in understanding why FIGs have the observed impacts on student academics. Social aspects of the FIGs tend to be the primary positive takeaway for students and this includes meeting peers, finding groups/peers to study with, and having a peer mentor in the FIG leader. Beyond that, students also found specific activities within FIGs to be useful as well as introductions to different resources available on campus to students. These two ideas—a greater social integration with the campus as well as providing necessary academic support—are not only central tenants to many freshman seminars but they also hold a prominent place in long-standing student attrition theory (Demetriou & Schmitz-Sciborski, 2011).
Limitations
We understand that there are several limitations with this study. First, although using PSM explicitly accounts for observable differences between FIG and non-FIG students before treatment, our analysis only balances the means of those observed covariates between the treatment and control groups. Thus, the results of this study may remain subject to biases of unobserved confounding variables (King & Nielsen, 2019). In the absence of a randomized controlled trial, we believe PSM allows for a more robust analysis than simply comparing FIG and non-FIG groups without any matching and, in this case, we match students while explicitly adjusting for selection bias and confounding variables using nearly 200 observables. What is more, our study provides an example of using matched comparisons with large-scale and detailed data to gauge freshmen seminars, which has rarely been done in prior work.
Another limitation is that this study relies on data from a single institution in its analysis. This limits the degree to which the results can be generalized to other campus settings. We also understand there are institution-specific subtleties with the data that may not be apparent when comparing with other institutions’ data. The data were limited to a single university due to the difficulty in obtaining detailed, anonymized registrar records in higher education. These type of data are different from longitudinal data typically used in education studies as it centers on course-level transcript records and individual-level demographic information, which is protected by institutions and not readily available for research purposes. However, given these limitations, this is a large, public university that likely shares commonalities with many other universities.
Another limitation of this work is the potential threat of interpreting FIG effects in light of other concurrent events. For instance, financial aid and on-campus residency may be other mechanisms that may differ among students concurrently with FIGs and may drive the differences observed between FIG and non-FIG students. As examples, previous studies have examined how financial aid can affect student persistence (e.g., Cabrera et al., 1990; Terkla, 1985) and other studies have looked at the effect of on-campus residency on persistence, even among first-year students (e.g., Purdie & Rosser, 2011). However, these data are not available through the University’s data stewards and therefore, we could not gauge the degree to which the estimated FIG effects were robust with respect to these possible alternative mechanisms.
A further limitation of this study is the fact that surveys were not available for all students used in PSM. UW’s FYP, meanwhile, did not electronically collect student feedback on FIGs until 2010. As aforementioned, the survey results corroborate the PSM estimates of FIG effects as students generally found FIGs useful. The aspects of usefulness of FIGs perceived by students are also indicative of student academic outcomes, particularly with respect to social integration, as informed by prior work (e.g., Tinto, 2003). The quantitative, qualitative, and predictive results are related in that they shed light on the FIG program, but provide different insights across distinct data-intensive methodologies.
Directions for Future Research
We believe a next step for this work is to examine the degree to which different FIG course compositions affect student success. More specifically, because FIGs at the UW allow for students to take varying numbers of credits, we hope to continue our analysis by treating FIG participation as a nonbinary treatment effect based on the number of credit hours students take as part of the FIG. This would then allow for a more granular analysis with respect to FIG treatment effects and outcomes and whether, as one could hypothesize based on the results shown in this work, a greater involvement in a FIG (i.e., more credit hours as part of a FIG cluster) leads to greater student success.
Another area for future research is examining the degree to which student survey responses relate directly to student success measures. In this work, we examined themes from student responses and student outcomes in aggregate and in isolation. To expand this work, we could examine the degree to which student survey responses (and specific verbiage used therein) relate to student success by examining these associations on a student level rather than in aggregate. Additionally, we can also examine the degree to which the student survey responses predict student outcomes both in the near and long term. We have begun preliminary work on this analysis but did not have meaningful results to share as part of this article.
We believe another area for future research is to examine the degree to which student success relates to characteristics of their FIG leaders. FIG leaders must take a preparation course before leading a FIG, thereby allowing us to identify these students based on their transcript records. We can then leverage the student registrar data to look at the academics of FIG peer instructors to see if specific attributes of the leaders relate to more effective administration of the seminar course. We believe this work can have wide implications in the design of future freshman seminars and the hiring of potential peer mentors for these seminars.
We believe a fourth space for more research involves better understanding why FIGs had a greater effect on the academic success of underrepresented racial minority groups. We intend to examine the possibility of an ethnographic exploration of how these students go through the freshman seminar and how it influences their first year. This may also be expanded to examine first-generation students, which were not identified in this work. Additionally, we also intend to examine FIG cohort composition and the degree to which homophily affected student success in some way. This includes examining specific minority groups in select fields (e.g., women in STEM) and seeing if their success was affected by having a similar peer makeup in their FIG seminar. An additional route of exploration may involve examining student transitions across fields, be it in switching majors of interest or showing some tendency to do so, as we have examined in the past with other student groups (Aulck et al., 2017). Last, with larger samples for individual racial/ethnic subgroups, we could also further disaggregate and match students based on race (rather than using the broader underrepresented racial minority classification) to compare outcomes.
Conclusions
This work examined the impact of FIGs on undergraduate student outcomes. To do so, we use data at a scale not previously seen in the literature when examining freshman seminars as we leverage millions of course records for tens of thousands of students across decades of instruction. In addition, we also use an array of data-intensive methods including: PSM across nearly 200 covariates and a host of different matching strategies to account for selection bias and topic modeling to inform a qualitative analysis of student survey responses. Using PSM on institutional registrar data, we show that FIGs positively affect both graduation and re-enrollment rates for participants, an effect that is more pronounced for Hispanic students and students from underrepresented racial minority groups. We also show evidence that FIGs tend to positively affect academic performance as measured by GPA. Then, using open-ended survey responses from FIG participants, we tease out what FIG participants found most valuable about the program, which centered on social aspects of the program (namely making new friends and knowing people in classes). Other aspects of interest included specific activities within the FIG seminar, general campus survival skills, and having an undergraduate peer leading the seminar course. Interestingly, we did not find a difference in perceptions of the benefits of the seminars across student subgroups, despite differences in academic performance across these subgroups. In all, this study provides valuable insight into the effectiveness of FIGs, not only in terms of student outcomes but also in terms of effective seminar design (e.g., focusing on social aspects of students’ integration). This work also demonstrates how data science approaches and techniques can be used at scale across a host of different data types to examine long-standing university programs. This includes leveraging transcript and demographic data from university registrar as well as data collected in the form of open-ended text responses on student surveys. We hope this provides an example for other institutions and researchers in using data-centric tools/approaches when evaluating the effects of university programs and policy.
Examples of student survey responses as well as the corresponding codes given to them by the researchers are provided in the online supplemental material.
Supplemental Material
sj-docx-1-ero-10.1177_23328584211021857 – Supplemental material for Helping Students FIG-ure It Out: A Large-Scale Study of Freshmen Interest Groups and Student Success
Supplemental material, sj-docx-1-ero-10.1177_23328584211021857 for Helping Students FIG-ure It Out: A Large-Scale Study of Freshmen Interest Groups and Student Success by Lovenoor Aulck, Joshua Malters, Casey Lee, Gianni Mancinelli, Min Sun and Jevin West in AERA Open
Footnotes
Acknowledgements
The authors thank the data stewards at the UW including the UW Registrar for their help and support of this project. The authors also thank UW’s FYP for their assistance with writing on the history of the FIG program at UW and their willingness to provide data for use in the analysis. Last, the authors thank Ott Toomet for his input on PSM and acknowledge Alex Lau for his assistance in coding student survey responses.
Declaration of Conflicting Interests
The author(s) declared the following potential conflicts of interest with respect to the research, authorship, and/or publication of this article: The authors of this publication were given research support from UW’s FYP. FYP were not given any right of refusal with respect to the publication and/or dissemination of the results from this study.
Funding
The author(s) disclosed receipt of the following financial support for the research, authorship, and/or publication of this article: Research support was provided from University of Washington’s FYP.
Notes
Authors
LOVENOOR AULCK is a data scientist at the University of Washington. His primary research interest is in educational data mining.
JOSHUA MALTERS was an undergraduate student in the Information School at the University of Washington.
CASEY LEE was an undergraduate student in the Information School at the University of Washington.
GIANNI MANCINELLI was an undergraduate student in the Information School at the University of Washington.
MIN SUN is an associate professor in education policy at the University of Washington. She specializes in economics of education, educator labor markets and effectiveness, school accountability and improvement, and school finance policies.
JEVIN WEST is an associate professor in the Information School at the University of Washington. He is interested in the origin of scholarly disciplines and how sociological and economic factors drive and slow the evolution of science.
References
Supplementary Material
Please find the following supplemental material available below.
For Open Access articles published under a Creative Commons License, all supplemental material carries the same license as the article it is associated with.
For non-Open Access articles published, all supplemental material carries a non-exclusive license, and permission requests for re-use of supplemental material or any part of supplemental material shall be sent directly to the copyright owner as specified in the copyright notice associated with the article.